Abstract
This work presents a new and facile route for the preparation of iron oxide-based catalysts supported on alumina, which enables the targeted synthesis of catalysts with an increased amount of isolated tetrahedrally coordinated iron centers compared to a conventional impregnation procedure, and therefore leads to an increase in activity for CO oxidation reaction. By a multi-step impregnation–calcination protocol, the catalysts were synthesized with iron loadings of between 1 and 10 wt%, and their catalytic activity was then compared with a 10 wt% loaded catalyst prepared by conventional single impregnation. With a loading of 8 wt%, the presented catalysts showed an improved catalytic activity regarding light-off and full conversion temperatures compared to this reference. Through the application of several analytical methods (PXRD, PDF, DRUVS, SEM, XAFS), the improved catalytic activity can be correlated with an increased amount of isolated iron centers and a significantly reduced fraction of agglomerates or particles.
1. Introduction
The removal of toxic emissions from the exhaust gases of combustion engines or processes has a significant impact on the ecosystem [1,2,3,4,5,6,7], making it an important field of research. Harmful substances are usually converted into less or non-harmful derivatives, which often requires the use of a catalyst. Therefore, heterogeneous catalysts are widely used in a number of applications, such as photocatalytic waste-water treatment [8,9,10], selective catalytic reduction of nitric oxides [11,12,13,14,15] or the catalytic removal of particulate matter from exhaust gases [16,17,18,19]. The widely used three-way catalyst represents a combined solution for multiple problems, namely the reduction of NOx to N2 with the simultaneous oxidation of hydrocarbons and carbon monoxide to CO2 [7,20,21,22,23]. The state-of-the-art catalyst systems utilized in such applications are based on rhodium, palladium, and platinum compounds. Due to their high prices, which are expected to increase even more in the future [24], their low sustainability [25,26] and their classification as critical raw materials [27], the replacement of these noble metals by abundant transition metals such as iron [28,29], cobalt, or copper is desirable [29,30,31].
The first iron-based catalysts for CO oxidation were already developed in the 1960s [32] and had evolved in the following years until Walker et al. published the first tests of γ-alumina-supported iron oxide catalysts, showing that these systems are capable of oxidizing CO and C3H6 to CO2 under the typical conditions for automotive operation (100–600 °C) [33].
Due to the reduced activity compared to noble metals, iron-based CO oxidation catalysts fell into oblivion for over a decade. After 2000, it experienced a renaissance because of a growing demand for sustainable alternatives for noble metals and was the subject of several publications regarding catalytic CO oxidation activity and the underlying mechanisms [34,35,36,37,38,39,40,41,42,43,44]. In 2003, Li et al. tested commercially available iron oxide nanoparticles with diameters of 3–5 nm in carbon monoxide oxidation and realized full conversion temperatures of approx. 350 °C [34]. Szegedi et al. applied MCM-41 as a support material for iron and obtained full conversion temperatures of around 330 °C [36]. Carriazo et al. used natural bentonite, an Al-pillared clay, as support material, inserted in this way iron oxide pillars in the material and obtained promising activities not only in CO oxidation but also in the ox-idation of organic compounds in aqueous medium and in gas phase [38]. Another frequently used support material is γ-alumina. Through variation of different iron loadings between 0.1 and 20 wt%, as well as different synthesis methods (incipient wetness impregnation or flame spray pyrolysis), full conversion temperatures of between 225 °C and 275 °C could be achieved [42,45,46,47].
Still, the realization of catalysts that are able to compete with both the activity and stability of state-of-the-art noble metal systems is a major challenge. However, by tuning the coordination geometry towards potentially the most active isolated tetrahedral species, as well as a high dispersion of the iron oxide species, promising reactivity could be achieved [48]. Our previous work showed that by simple wetness impregnation of γ-alumina with iron(III) acetylacetonate Fe(acac)3, catalysts with a broad particle size distribution and a high amount of octahedrally coordinated iron species could be obtained at iron loadings of 5 wt% and higher, while at 1 and 2.5 wt%, primarily isolated, tetrahedrally coordinated oxidic species were formed, which can be ascribed to higher catalytic activities [49,50,51].
The herein presented work aims to use these findings to optimize the catalytic activity by designing a new synthetic strategy to increase the total amount of more active iso-lated CO oxidizing iron species. The working hypothesis, which assumes that the precursor Fe(acac)3 has a higher surface mobility on the support than the final iron oxide, is based on the estimates of the Tamann and Hüttig temperatures [52,53] and has resulted in a preparation method that suppresses agglomeration and enables the formation of a high proportion of isolated, tetrahedrally coordinated iron-oxo species—a new and facile multi-step impregnation–calcination procedure. More precisely, the active component is successively loaded onto the γ-alumina support in steps of 1 wt% of iron. As will be shown, with this approach, it is possible to generate catalysts with defined structural properties containing the desired high amount of isolated iron oxidic species and reduce the ratio of less active higher agglomerates and particles. This would lead to increased catalytic activity with lower iron loading at the same time.
2. Results
2.1. Synthesis
Commercially available SCFa140 (Sasol®, Johannesburg, South Africa) was used as the γ-alumina support and iron(III) acetylacetonate (Sigma Aldrich, Taufkirchen, Germany) as the precursor. For catalyst preparation, a 0.25 M solution of the iron precursor in acetone was added to a suspension of SCFa140 in acetone, stirred for 10 min before removal of the solvent at 40 °C under reduced pressure. The obtained product was then annealed in air, heated with a ramp of 2 °C/min up to 600 °C, and then kept at this temperature for 3 h. This procedure was repeated for each step, i.e., each percentage increment of iron loading up to a total amount of 10 wt% iron. The respective catalysts, FE01 to FE10, with the number indicating the nominal wt% loading of iron, were characterized thoroughly as follows. Additionally, a reference catalyst SI10 was synthesized by a conventional single-step impregnation with 10 wt% of iron, followed by an identical calcination protocol, to enable a quantitative and qualitative comparison to the multi-step method.
2.2. Characterization
2.2.1. Powder X-ray Diffraction
To determine the present iron and aluminum oxide phases in the catalysts, powder X-ray diffraction (PXRD) was applied. As shown in Figure 1, all the samples show only reflexes which can be attributed to the γ-Al2O3 support, without the characteristic Bragg reflexes of iron oxides. The only exception would be SI10, as the additional reflexes that are visible here can be assigned to a mixture of α- and γ-Fe2O3 (see Figure S3). However, the momentum transfer (Q) value of the alumina reflexes, which is connected to 2θ with , shifts to lower values with increasing iron loading. Accordingly, the lattice of the support is widened, indicating an incorporation of the iron species into the support lattice. The corresponding lattice parameter a shows a linear correlation with the iron loading (supplementary information, Figure S1), according to Vegard’s law [54]. The reflection corresponding to the (440) crystal lattice was used for this calculation as its intensity is the highest and its overlap with other signals is low.
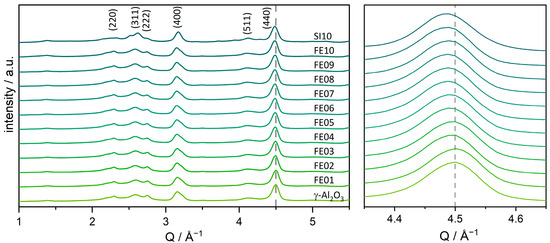
Figure 1.
Powder X-ray diffractograms of the catalysts FE01 to FE10 and the pure γ-Al2O3 support. The (440)-Bragg reflection of the γ-Al2O3 is highlighted with a dashed line to guide the eye with respect to the shift induced by increasing loading.
2.2.2. Pair Distribution Function
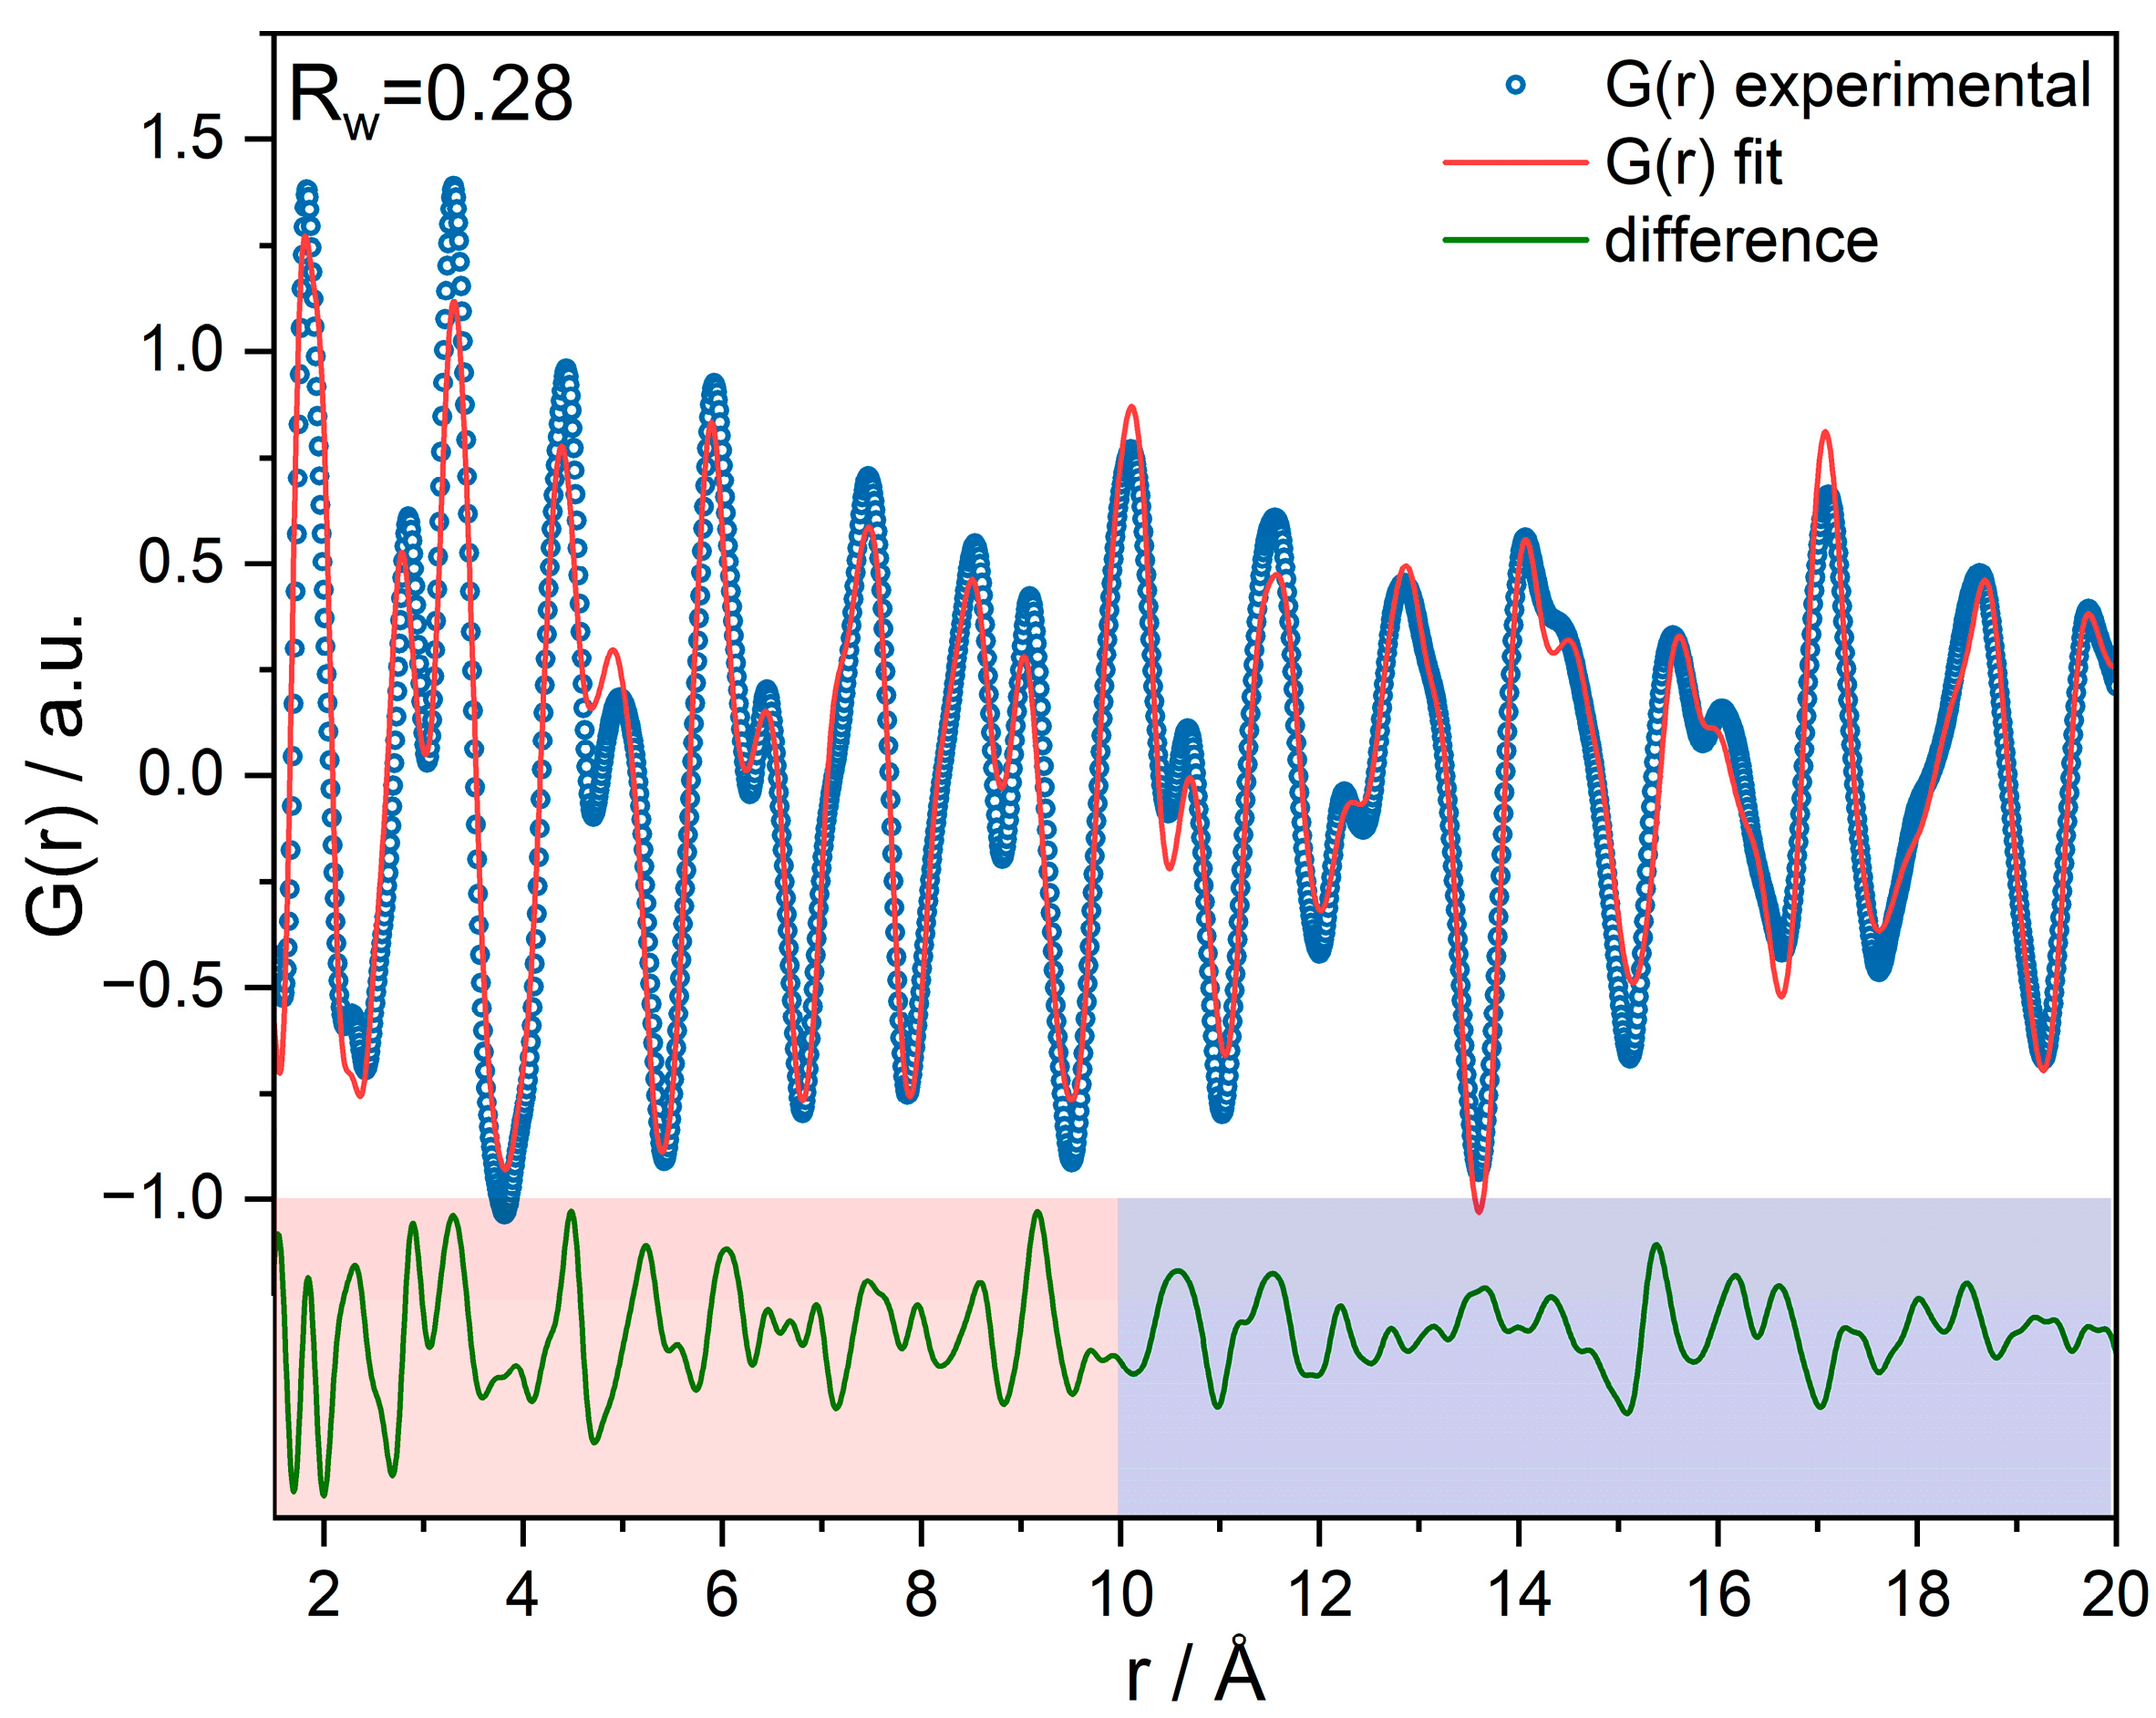
Pair distribution function (PDF) refinement of the SCFa140 (γ-Al2O3) support shows a reasonably good agreement with γ-Al2O3 of the space group (No. 227) and additional non-spinel Wyckoff sites (Figure 2). The structural deviations in the difference function up to 10 Å are slightly larger than above 10 Å. We assume that this local structure (r < 10 Å) is the result of a transformation from boehmite (γ-AlO(OH)) to γ-Al2O3 in the synthesis procedure, as shown by Paglia et al. [55]. The catalyst PDFs show an enlarged lattice parameter of Al2O3, but introducing a Fe2O3 phase did not significantly improve the goodness-of-fit because the scattering signal of Fe2O3 is too small compared to γ-Al2O3. Therefore, difference-PDFs (dPDFs) were generated, which take into account this change in lattice parameter of the alumina support [51].
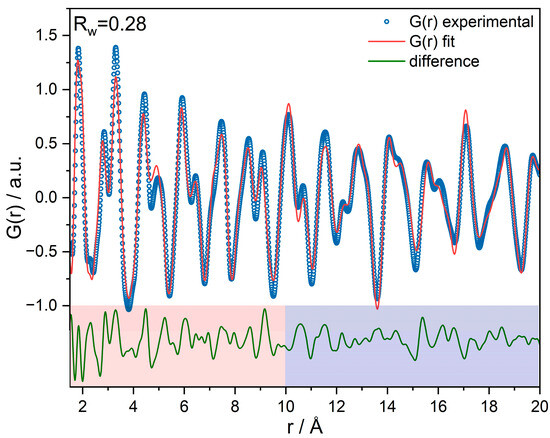
Figure 2.
PDF refinement of the γ-Al2O3 support, showing a difference between short-range (meaning in this case, r < 10 Å) and long-range order.
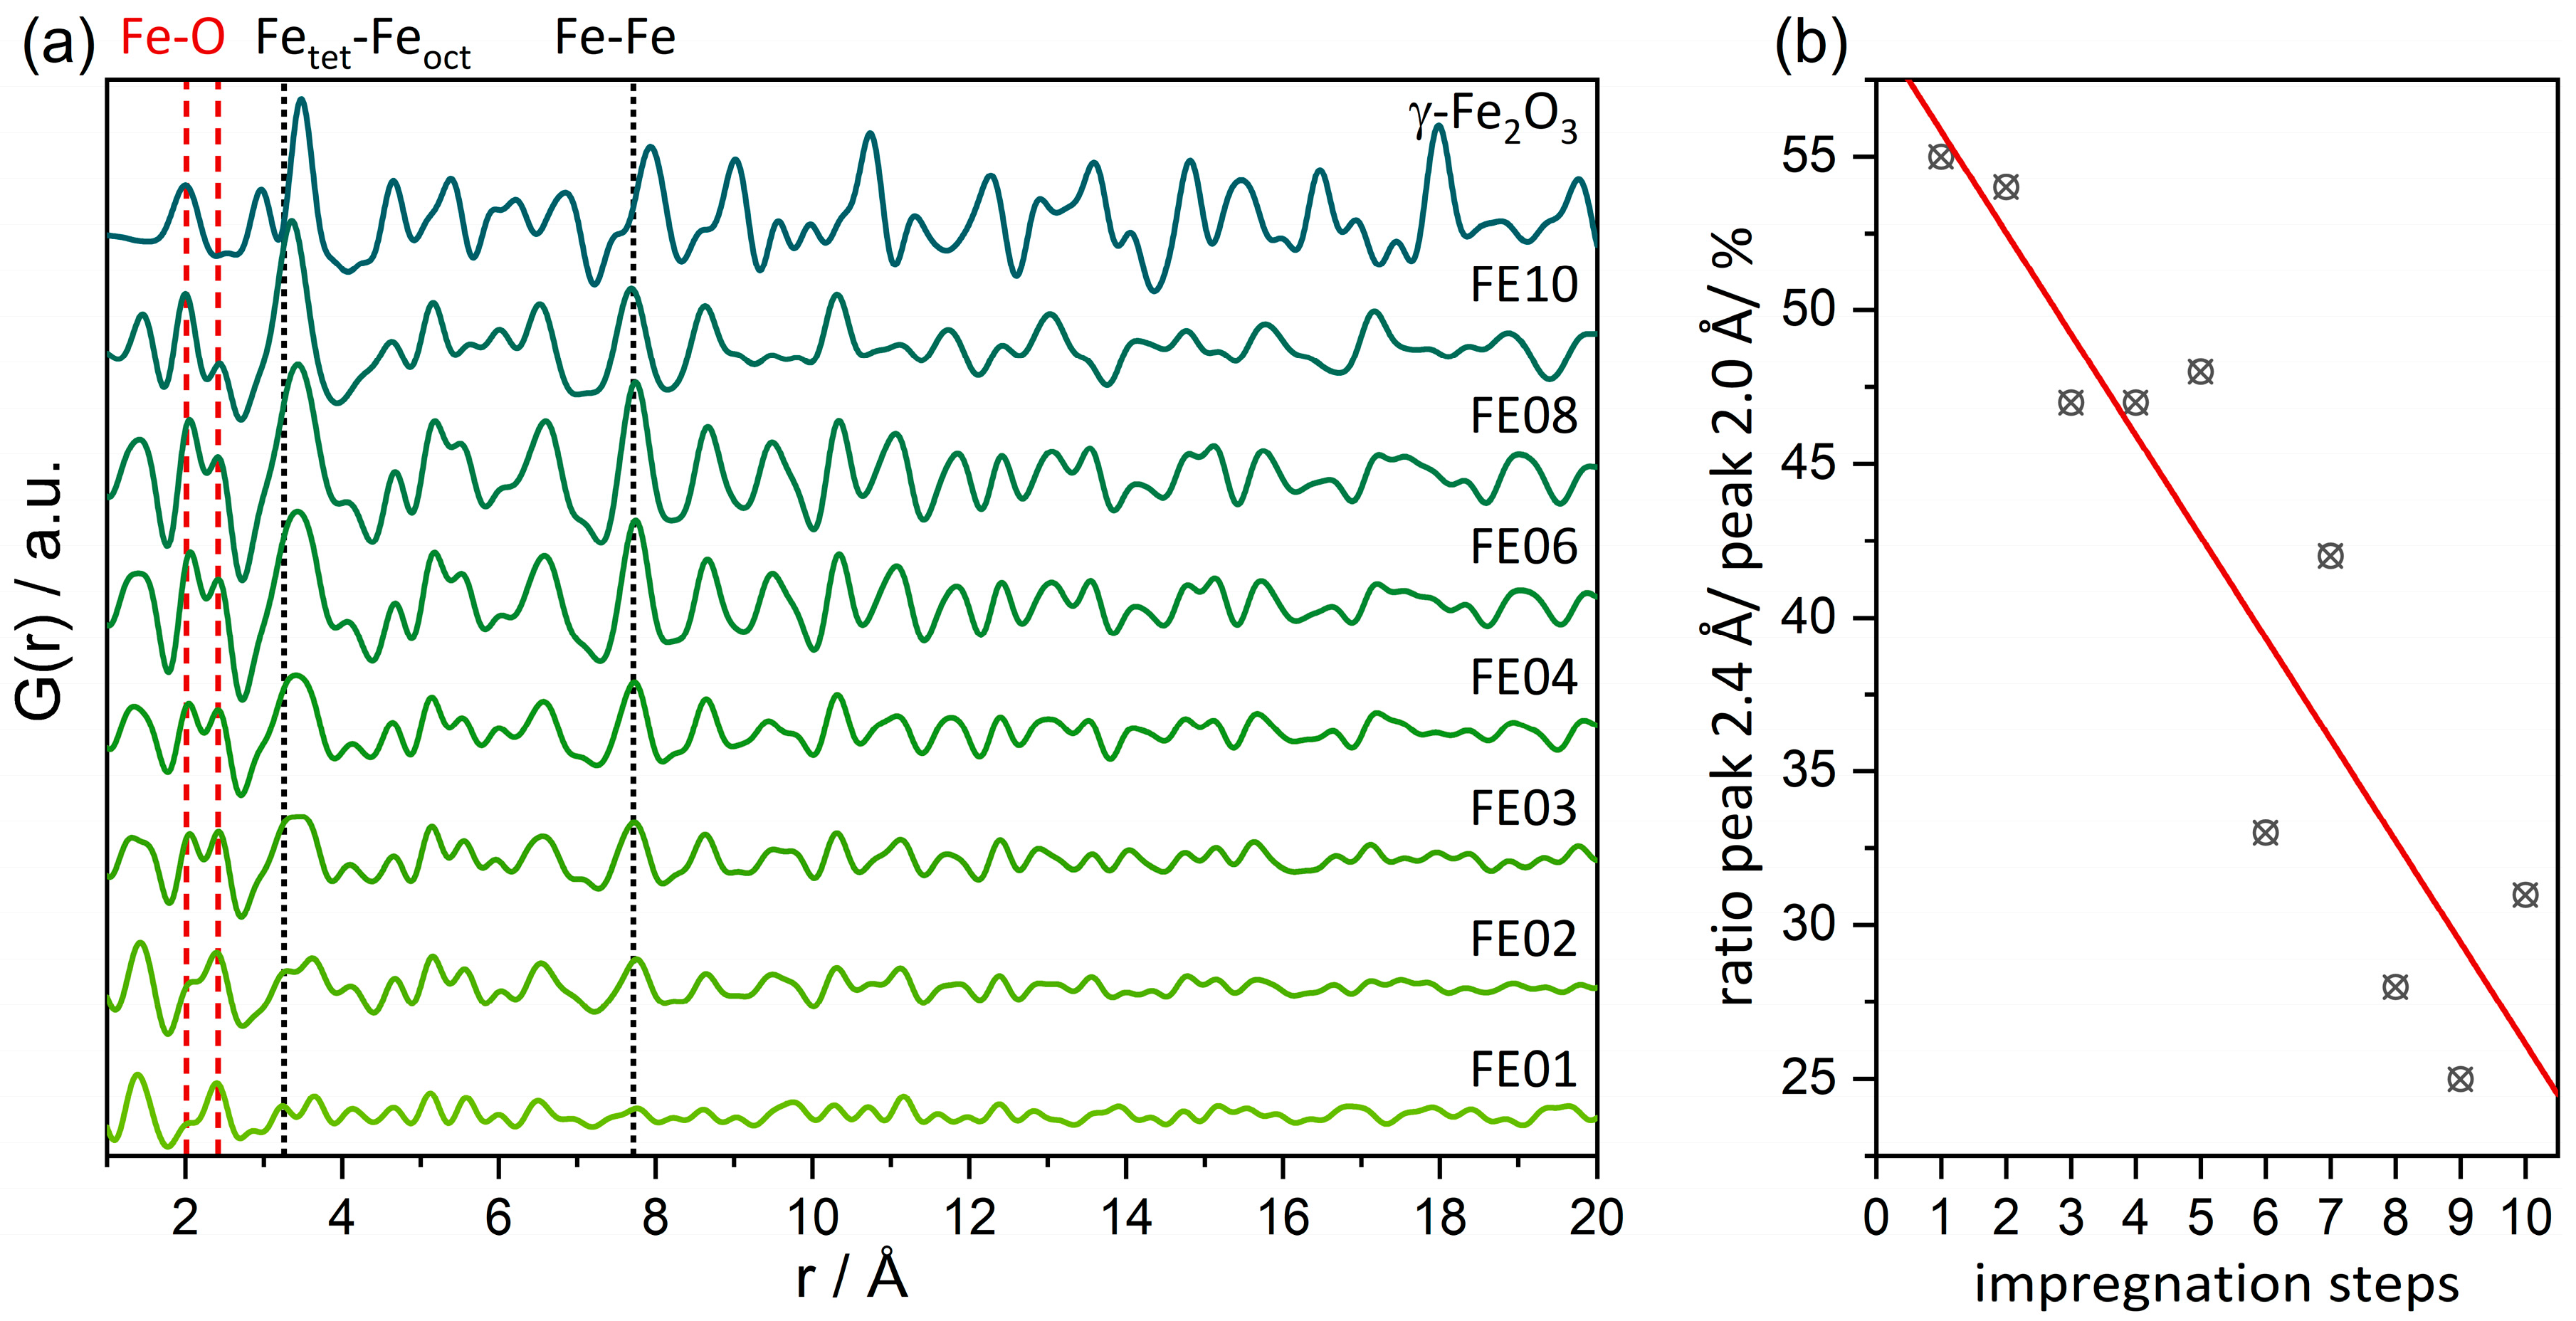
For supported heterogeneous catalysts, dPDFs (shown in Figure 3a, detailed refinements visible in Figure S4) represent an important tool because they are sensitive towards the potentially active loaded species and work by subtracting the support signatures. All the distances visible in the dPDFs originate from Fe2O3 and possibly from the restructured γ-Al2O3 or surface-bonded Fe–O–Al motifs. For 1 wt% Fe loading, the dPDF signal cannot be clearly assigned to iron oxide due to a lack of intensity. Distances (e.g., the Fe–Fe distance at ca. 7.7 Å) that match γ-Fe2O3 appear first in the sample FE02. Their intensity increases with the number of impregnations and thus total loading, pointing towards increasing mole fraction. As can be seen in Figure 3a, the Fe–Fe interatomic distances of all the investigated catalysts are contracted in comparison to bulk γ-Fe2O3. Interestingly, the Fe–Fe distance of the octahedrally oxygen-coordinated Feoct at 2.96 Å is only visible as a shoulder of the Fetet–Feoct distance at 3.37 Å for the sample FE03 and higher loadings. Both the signals at 2.96 and 3.37 Å appear to be broadened compared to γ-Fe2O3, indicating distortion and variation in the Fe–Fe distances. This is in accordance with EXAFS analysis (vide infra, Table S3), which shows no Fe–Fe coordination at the distance of 2.89 Å, as well as fewer Feoct sites than in the bulk.
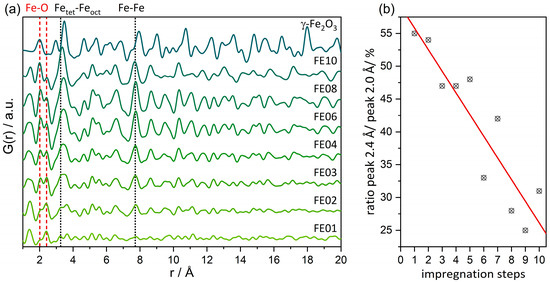
Figure 3.
(a) Difference-PDFs for selected impregnation samples. Highlighted (dashed lines) are distances evolving with number of impregnations that can be attributed to γ-Fe2O3. (b) Integral ratio of the peak at 2.4 Å and 2.0 Å that is assigned to restructuring of the γ-Al2O3 support.
In the dPDF analysis, an atom pair at ca. 2.4 Å is present, whose intensity in relation to the Fe–O signal at 2.0 Å decreases linearly with the number of impregnation steps (see Figure 3b). We attribute this interatomic distance of 2.4 Å to the γ-Al2O3 support, which restructures upon loading, resulting in an imperfect subtraction of the entire Al2O3 signal during dPDF calculation. This is well in line with its absence in the EXAFS refinements of the Fe K-edge data. The higher the iron oxide loading, the stronger it contributes to the dPDF in relation to the Al2O3 structural residual at 2.4 Å.
To track the crystalline nature of the iron oxide species, dPDF refinements were carried out using a maghemite phase (γ-Fe2O3) [56], which was shown to be beside α-Fe2O3, the main phase in powder X-ray diffraction (see Figure S3), in our earlier study on standard impregnation for 5–20 wt% Fe-loading (lower loadings of iron oxides on aluminum oxides are at present below the detection limit for dPDF) [51]. Again, in this multiple impregnation study, XAS analysis confirmed a high amount of Fetet, i.e., γ-Fe2O3-like species (vide infra). The lattice parameter a, the thermal displacement parameter Biso for Fe and O, as well as the correlated motion parameter δ2 were refined (for detailed information, see Table S1). Further, a spherical-shaped envelope accounting for the finite size effects of nanoparticles that subsequently lead to the dampening of the PDF was applied. The additional peak at 2.4 Å makes it especially hard to refine the PDF because this interatomic distance does not occur in the γ-Fe2O3 structure.
The γ-Fe2O3 lattice parameter a for FE09 and FE10 is significantly smaller than the literature value for the bulk material [56] (0.22 Å resp. 0.25 Å; for comparison, see Figure S4 and Table S1). This contraction stems from the nano size of the catalyst but could additionally be influenced by the contact to the support. For FE03–FE08, the lattice parameter is closer to the bulk value, but considering the high Rw values and remaining structural residuals in the difference curves, this needs to be interpreted with care. The structural residuals and the subtle observed shifts of the Bragg reflections of γ-Al2O3 in the PXRDs point to a restructuring of the γ-Al2O3/γ-Fe2O3 interface because of the Fe3+ introduction into the defective spinel structure of γ-Al2O3.
2.2.3. Diffuse Reflectance UV/Vis Spectroscopy
In order to gain additional insights into the structure of the iron species, diffuse reflectance UV/Vis spectroscopy (DRUVS) of FE01 to FE10 and the reference catalyst SI10 was carried out. The spectra are shown in Figure S5 and can be divided in two main regions as follows [57]: Signals below approx. 330 nm can be assigned to d–d transitions of the isolated iron centers, then divided into tetrahedrally coordinated FeO4 species (Fetet) at wavelengths below 300 nm and octahedrally coordinated FeO6 units (Feoct) around 320 nm. The signals of small oligomers (Feolig) mostly occur above 330 nm, and above 500 nm, even bigger FexOy particles are visible (Fepart) [57]. With increasing iron loading, the contributions above 300 nm increase and additional features above 400 nm emerge. These trends can be explained by an increase in the formation of small iron oxide oligomers or particulates with increasing iron loading.
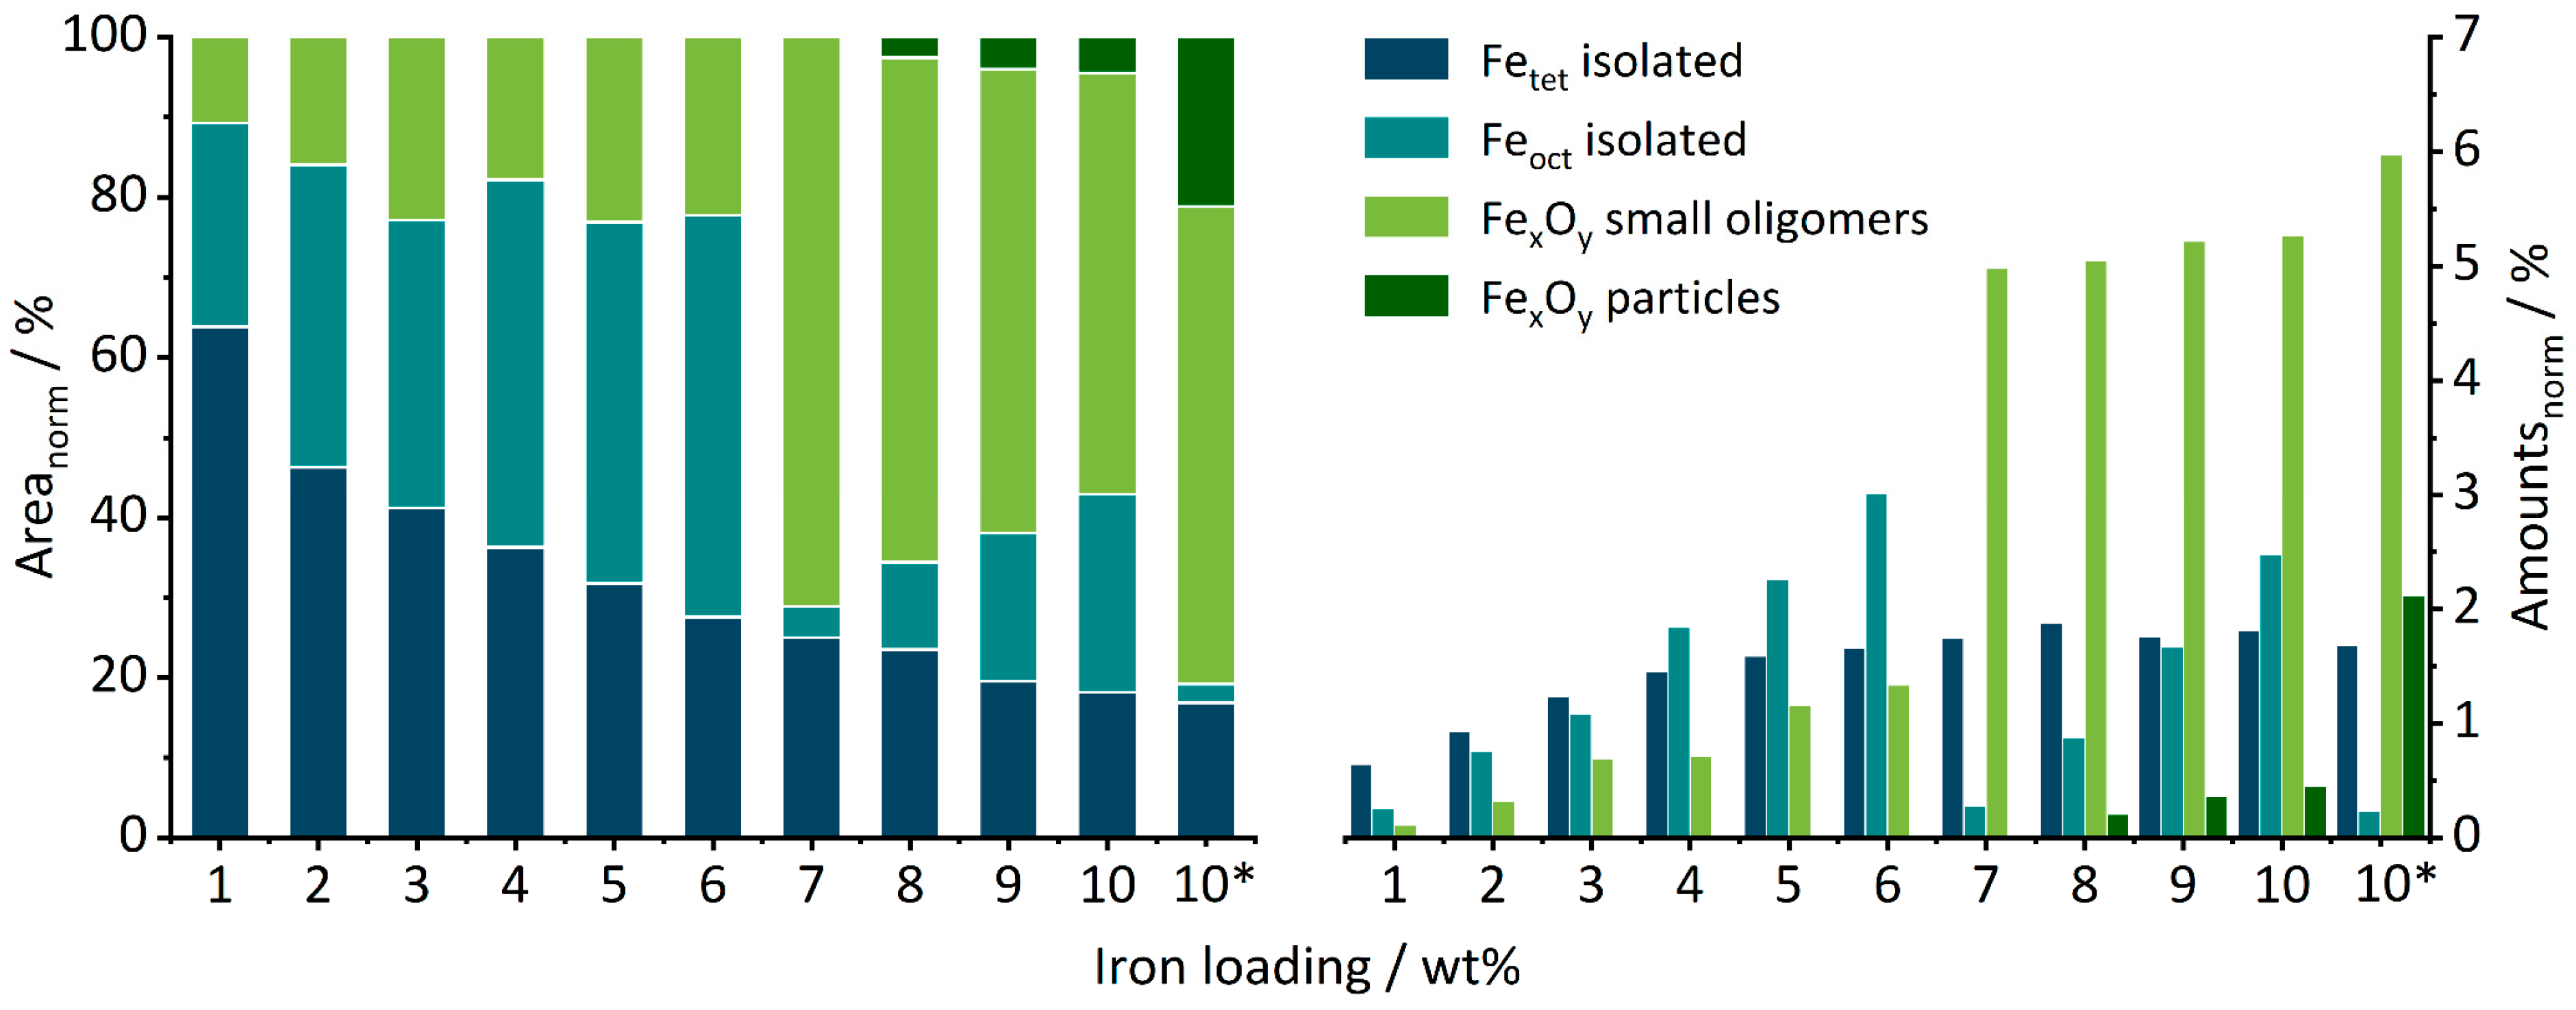
Quantification of the different contributions was attempted by deconvolution (see Supplementary info and Figure S5 for details). The results are summarized in Figure 4. It shows the fraction of each deconvoluted contribution with respect to the normalized total area of the spectra on the left, while on the right, the total amount of each species approximated by multiplication of the integrated percentage of the DRUVS bands with percentual iron loading is shown.

Figure 4.
Normalized percentual areas of tetrahedral, octahedral, oligomeric, and particulate iron oxide species (left) gained from peak deconvolution of the DRUV spectra of SI10 (10*) and FE01–FE10 and the total amounts of these species in wt% of the respective catalyst (right).
From FE01 to FE10, the area fraction assigned to Fetet species decreases constantly (see Figure 4 left), accompanied with an increase in the Feoct area from FE01 to FE06. Between FE06 and FE07, the fraction of Feoct drops and significantly more small oligomers are formed. Even though the performed DRUVS analysis might include a certain error, these strong changes could indicate, for example, the formation of a substructure which could not be identified by the applied characterization methods. The generation of FexOy particles starts at FE08 and increases with higher loadings, in line with the PDF-detected iron oxide nanoparticles for FE09 and FE10.
If these ratio values of the DRUVS spectrum are related to the iron loading of the catalysts, an estimation of the real present quantities of the individual species can be obtained (Figure 4, right). Up to FE03, the tetrahedral sites dominate, and the amount of Fetet then increases from FE01 to FE08 before finally forming a plateau. The number of Feoct continuously increases as well from FE01 to FE06. Surprisingly, the amount of Feoct suddenly drops for FE07, accompanied by an instantaneous increase in oligomeric species formation. From FE07 to FE10, there is a large but still increasing number of oligomers, and from FE08 to FE10, an increasing particle formation can be seen. A larger number of oligomeric species compared to crystalline phases for lower loadings is in accordance with PDF analysis.
The sample SI10 prepared for comparison in a single-step impregnation contains a significantly higher number of oligomers and particles as well as a much lower amount of Feoct species. Clearly, all the FE catalysts contain less agglomerates in the form of oligomers or particles compared to the single-step-impregnated reference catalyst SI10 or the comparable catalysts prepared in a similar fashion in the previous work [51]. Thus, from a DRUVS perspective, the target of the modified preparation route—to obtain a higher amount of isolated centers—was achieved.
2.2.4. Scanning Electron Microscopy
To clarify the indications obtained by XRD and DRUVS, SEM pictures of the investigated catalysts were recorded. The direct comparison of FE10 and SI10 clearly shows nanoparticles on the surface of the latter, as can be seen in Figure 5. No comparable structures are visible on the surface of FE10 (as well as on the surfaces of the lower loaded catalysts, see Supplementary Materials).
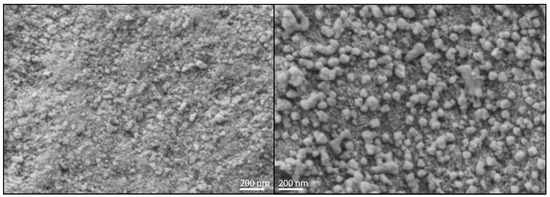
Figure 5.
Scanning electron microscopy pictures in 50,000-fold magnification of FE10 (left) and SI10 (right).
2.2.5. X-ray Absorption Spectroscopy
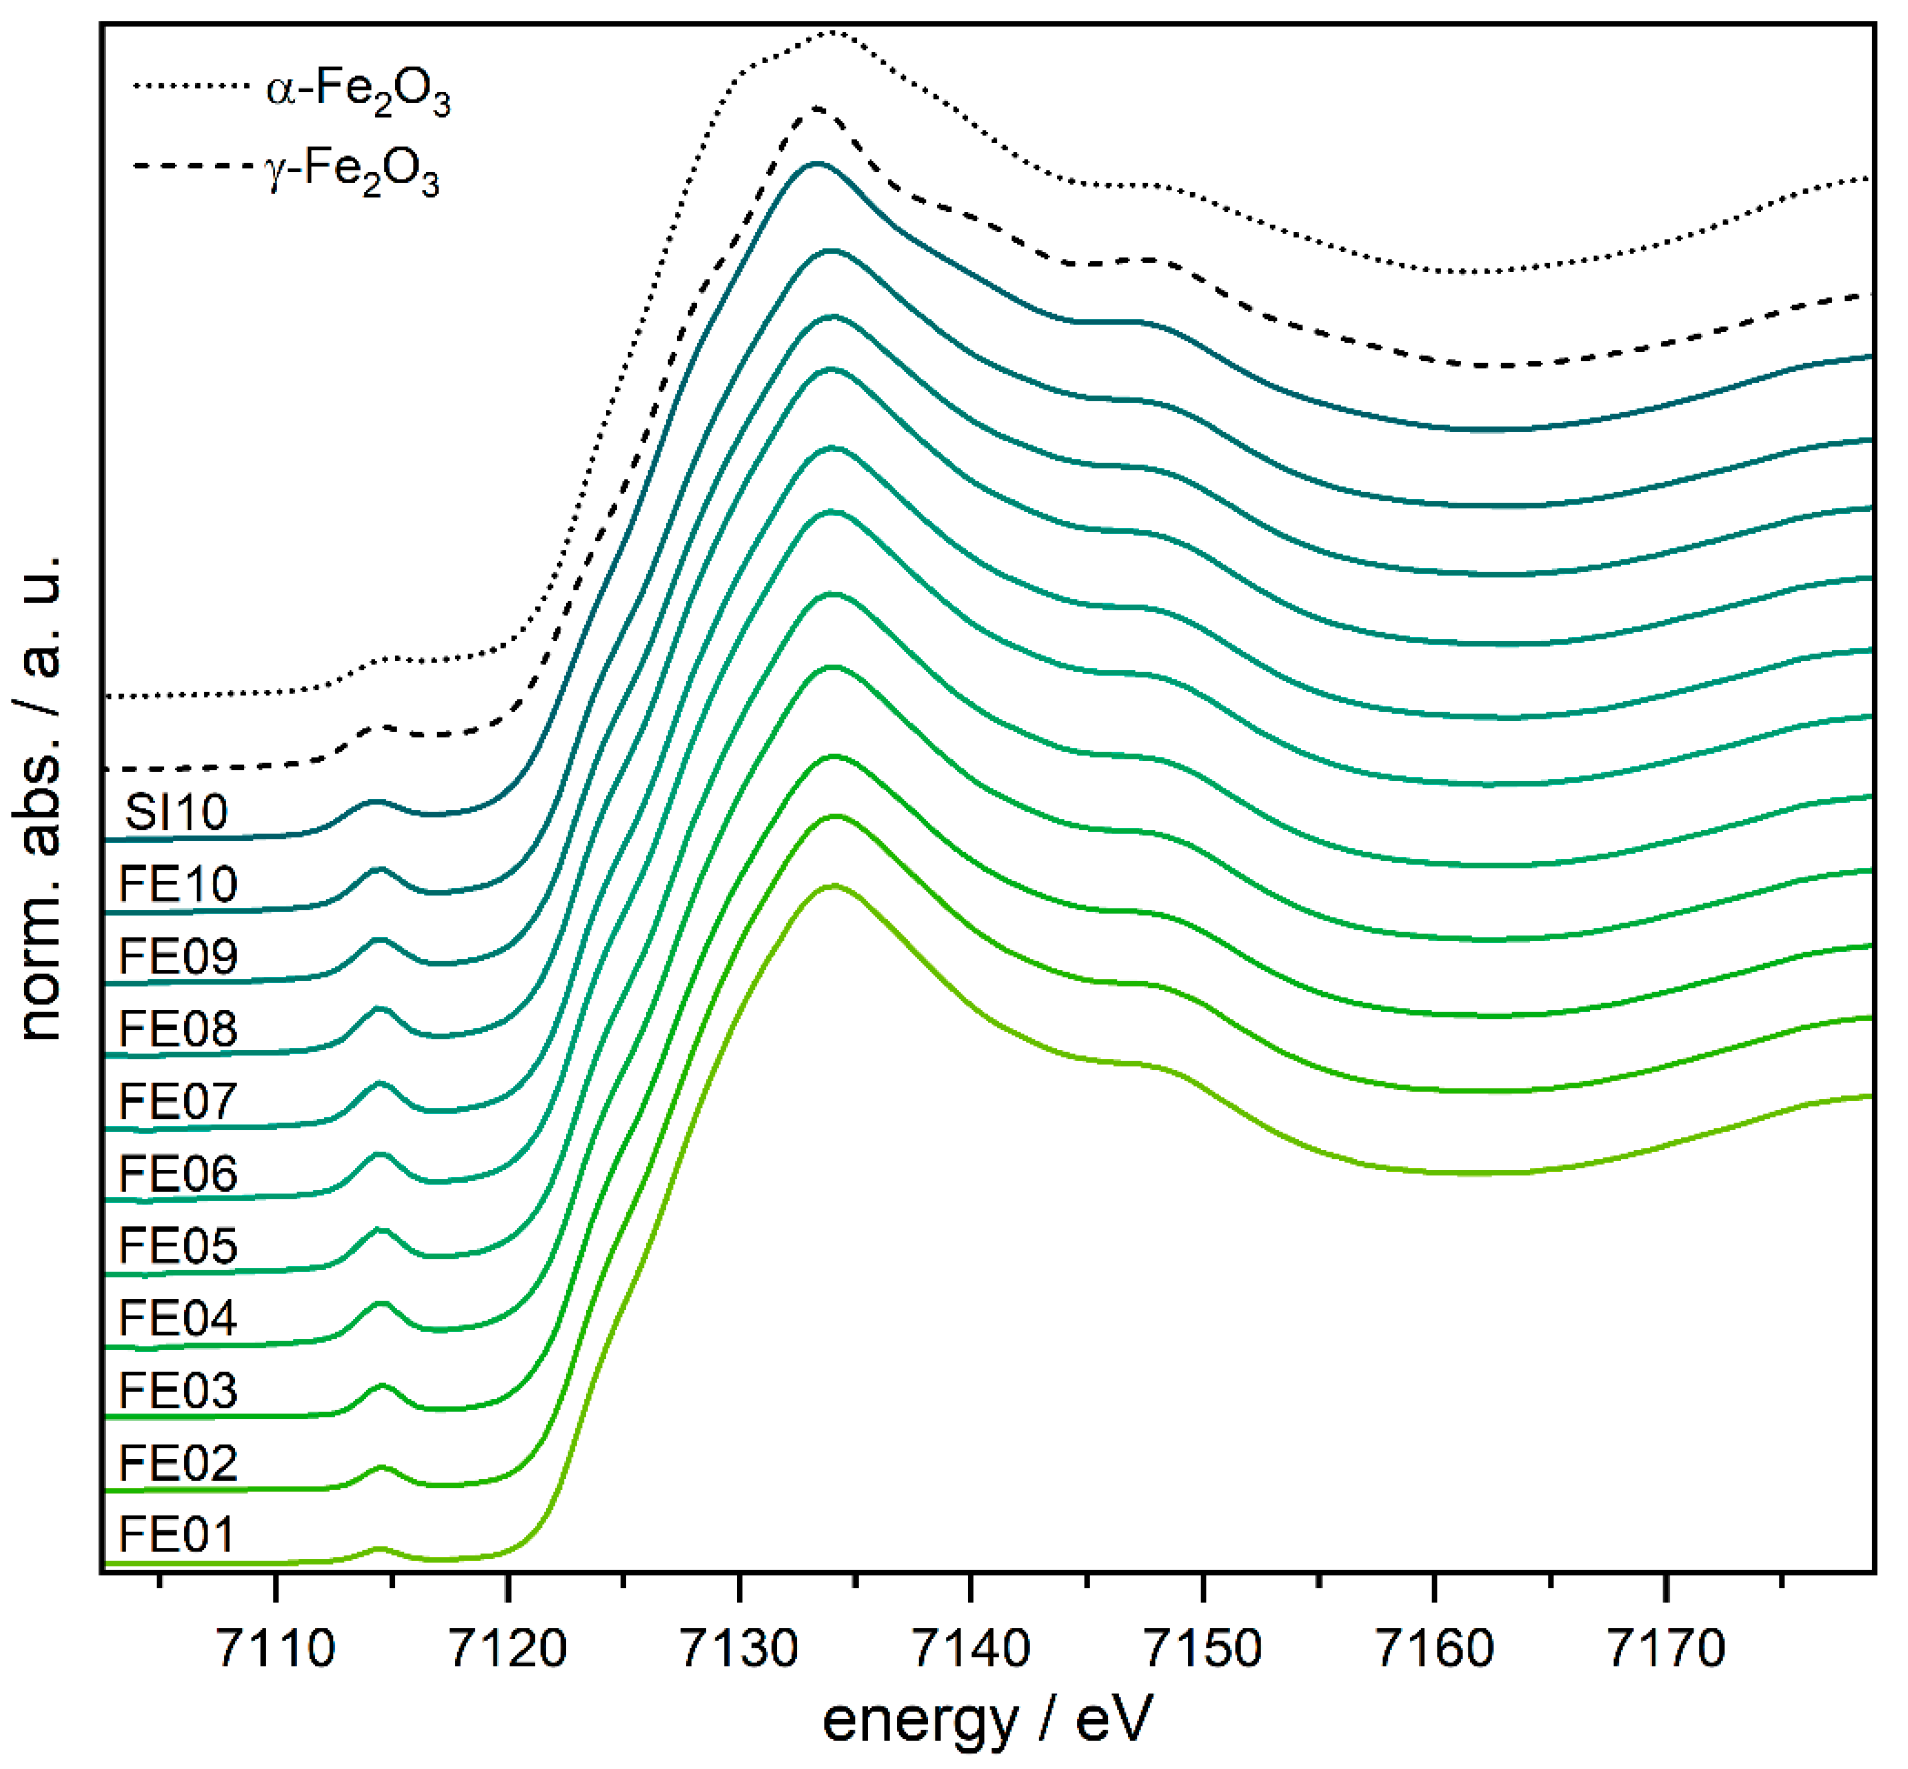
To further probe the local structure of the iron species and their oxidation state, X-ray absorption spectroscopy was carried out at the iron K-edge (see Figure 6). The pre-peak at around 7115 eV in the XANES (X-ray absorption near edge structure) region is derived from the transitions of the excited 1s electron into 3d or hybridized 3d/4p orbitals [58], depending on the local symmetry. If the coordination of the absorbing iron atom shows an inversion center, only 1s to 3d quadrupole transitions are possible, which are weak in intensity, since they are spin-forbidden. If the inversion symmetry of the absorbing iron atom is broken, 3d/4p orbital hybridization occurs and with this, dipole transitions into the 4p character of the hybrid orbital are possible [59]. Accordingly, coordination geometries without inversion symmetry show increased pre-peak intensities.
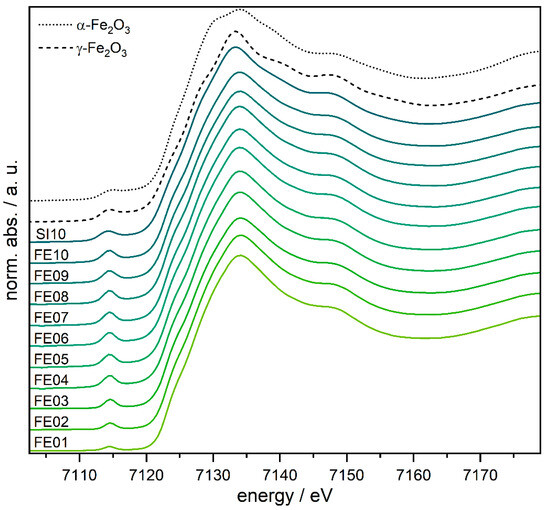
Figure 6.
XANES spectra of FE01–FE10, SI10, and the α- and γ-Fe2O3 references.
The pre-peak intensities increase steadily from FE01 to FE04 and remain at this intensity for all higher loaded catalysts. This can be explained with an increasing amount of non-centrosymmetric iron centers (up to FE04). At first glance, this behavior seems to contradict the results of the DRUVS analysis. However, if we consider that DRUVS does not provide any information about the presence of an inversion center (or its distortion), an increase in the pre-peak intensity can be explained by the increasing proportion of distorted octahedrally as well as the tetrahedrally coordinated iron centers. The energy of the pre-peaks as well as the actual edge position are nearly identical for all the samples (approx. 7114.5 eV and 7123 eV) and can clearly be assigned to FeIII by comparison with the reference samples (see Figure 6 and Figure S14 and Table S2).
More details about the local structure of the iron centers are achieved by EXAFS (extended X-ray absorption near edge structure) analysis. The detailed results and parameters of fitting the experimental EXAFS function with the theoretical models are shown in Table S3 and in Figures S18–S28. Three Fe–O contributions had to be included in the nearest neighbor shells to achieve satisfactory fit results. Since a high amount of γ-Fe2O3 was expected to occur according to DRUVS and PDF analysis, two Fe–O contributions were fitted at around 1.8 Å and 2.1 Å. The introduction of a third shell above 1.9 Å was necessary to increase the quality of fit and describe the possible α-Fe2O3 and AlFeO3 phases. The initial structural parameter used as input in the fit were extracted from crystal structures [56,60,61].
From FE01 to FE05, an increase in the coordination number in the first coordination sphere is observed, which is in good agreement with the increasing pre-peak intensities and reflects the trend of the DRUVS analysis, since this first coordination is characteristic of the tetrahedrally coordinated iron sites. This coordination number remains roughly constant with increasing iron loading, which again reflects the results of the DRUVS spectra. The second coordination number does not show a clear trend in the number of backscatterers, but a shift in the Fe–O distance from 1.92 Å for FE01 to 1.99 Å for FE10. This approximation of the Fe–O distance to the corresponding distance in α-Fe2O3 indicates an increasing amount of this phase with higher loadings. In turn, this would lead to more Feoct (FeO6) coordination sites—a trend which is also observable in the DRUVS analysis. For the third oxygen shell, no clear trend can be deduced as well. Additionally, this shell is of rather low specificity, as both α- and γ-Fe2O3 as well as AlFeO3 contain oxygen backscatterers at Fe–O distances of approx. 2.1 Å.
At higher distances, two Fe–Fe shells at 3.0 and 3.4 Å were fitted together with an Fe–Al shell in between, reflecting the shortest Fe and Al backscatterers present in a (mixed) oxidic structure (α-Fe2O3, γ-Fe2O3, AlFeO3) [56,60,61]. The presence of Al backscatterers (and the possible formation of AlFeO3) can be explained by incorporation of Fe ions in the alumina defect spinel lattice. While the numbers and distances do not follow any clear trend, the ratio of iron to aluminum backscatterers shows a rather drastic increase from FE06 to FE07, indicating the formation of bigger agglomerates or phase and thus backing up the results in DRUVS analysis and the hypothesis of an oligomeric substructure. The fit result of SI10 shows comparable parameters to FE09 and FE10. The only difference can be found in slightly shorter distances for all fitted shells, which could be assigned to a greater proportion of particles and correlated surface effects. An increased number of larger particles was also found in the DRUVS analysis and SEM.
2.2.6. Catalytic Activity Determination
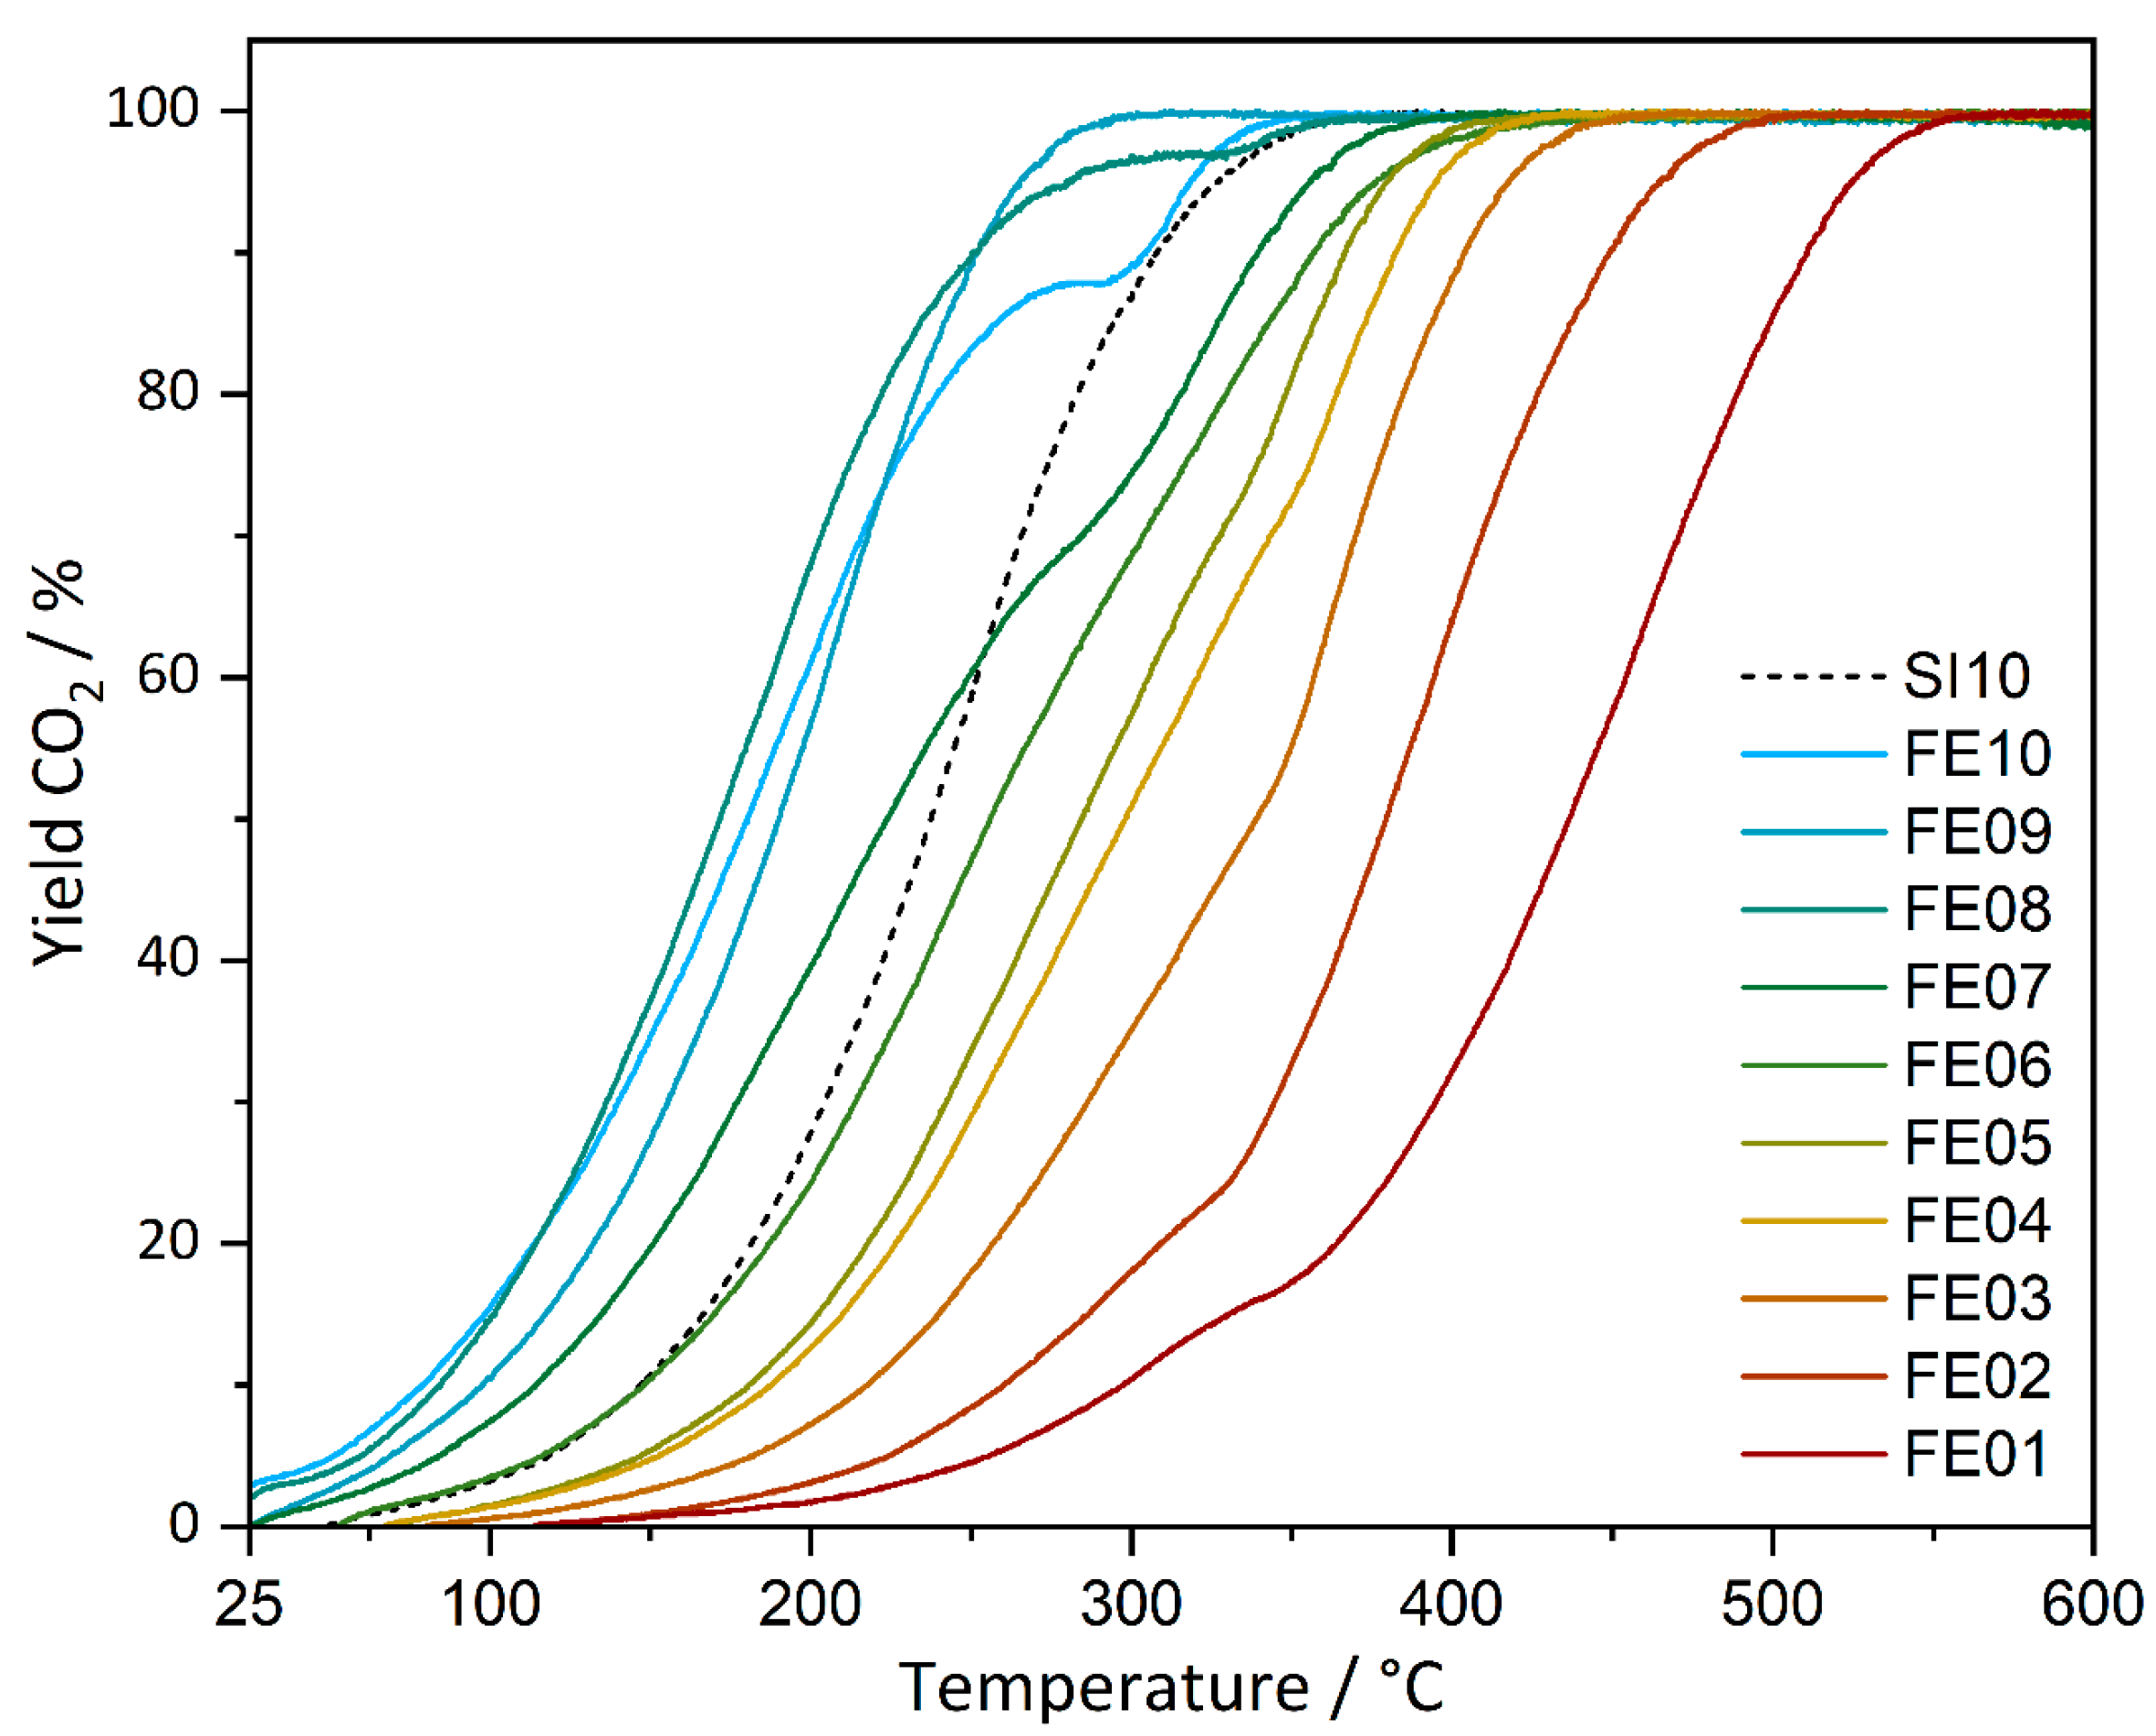
CO oxidation experiments of the prepared catalysts were carried out under continuous heating as well as at static temperatures (latter shown in the supporting information). Conversions for all catalysts under continuous heating are shown in Figure 7, and the respective temperatures of Tlight-off (10%), as well as temperatures for CO conversions of 50% and 95%, are contained in Table 1.
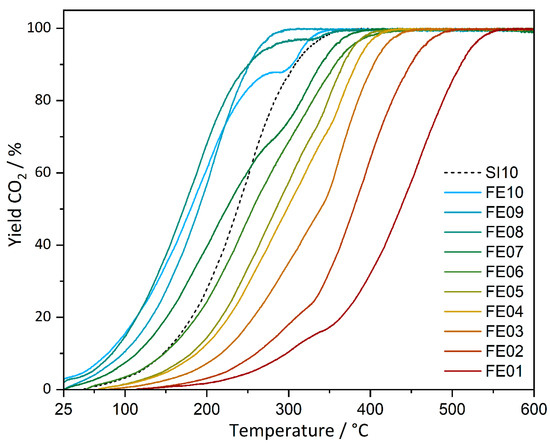
Figure 7.
CO oxidation conversions of FE01–FE10 and SI10 under continuous heating with 2 °C/min up to 600 °C.

Table 1.
Respective temperatures of 10, 50 and 95% CO conversion, obtained from catalytic experiments under continuous heating with 2 °C/min.
Starting from FE01, the light-off temperatures (at 10% conversion) decrease continuously with higher loadings, starting from 297 °C for FE01 to 85 °C for FE08 and 79 °C for FE10. FE09 does not fully follow the trend with 98 °C. The reference catalyst SI10 for comparison shows a Tlight-off at 147 °C. T50 follows the Tlight-off trend. Here, FE08 is most active with a T50 of 172 °C, followed by FE10 with 180 °C.
The T95 values decrease from 525 °C for FE01 with increasing iron loading to a minimum of 265 °C for FE09. FE10 exhibits above 80% conversion, an irregular behavior which cannot be explained by the available data so far, resulting in a T95 of 318 °C. For the reference material, SI10, the full conversion temperature is significantly higher (T95 = 327 °C). To conclude, the activity of the catalysts investigated increases with increasing iron loading and reaches its maximum at 8 and 9 wt% of iron. A higher activity with increasing iron content can indeed be expected from a generally increased number of available iron sites. It is, however, notable that in comparison to the conventionally prepared catalyst (SI10), a better catalytic activity (Tlight-off as well as T95) could be achieved with the multi-step impregnation–calcination protocol, even with lower iron loadings. Full conversion could be reached with FE09 at approx. 60 °C lower temperature compared to SI10.
The obtained numbers of conversion at distinct temperatures can be transformed into turnover frequencies (TOFs, see Figure 8), which, in this case, without knowledge of the exact amount of active sites, display the average number of conversions per iron atom of the as-prepared catalyst.
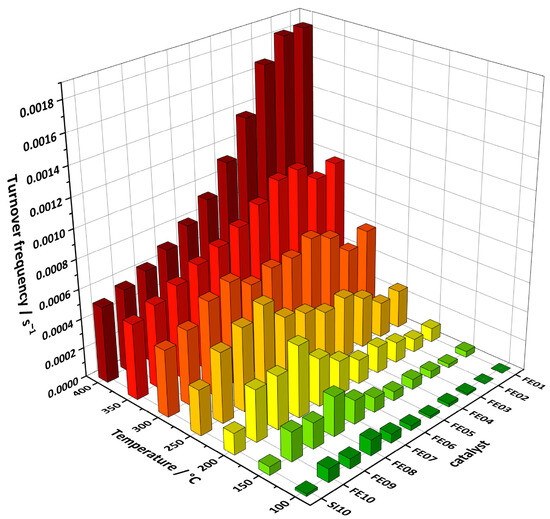
Figure 8.
Turnover frequencies of FE01 to FE10 and SI10 calculated from CO oxidation experiments under continuous heating with 2 °C/min.
At low temperatures of up to 250 °C, the TOFs obtained by catalytic experiments under continuous heating can be divided into two regions as follows: Catalysts with lower iron loadings (FE01 to FE06) show very low TOFs at temperatures of up to 250 °C, while FE07 to FE10 exhibit significantly higher TOFs at these temperatures, with a maximum for FE08. Starting at 150 °C, a second, smaller maximum for FE04 emerges, which overcomes the value of FE08 at 300 and 350 °C. At 400 °C, FE01 shows the highest TOF, which is more than three times higher than that of FE09 and FE10. The TOFs of SI10 follow the same trend as the catalysts with higher iron loading, an increase with temperatures up to 300 °C, followed by stagnation as the point of full conversion is reached. When compared directly, FE10 shows higher TOFs than SI10, especially at 100 to 250 °C.
3. Discussion
Based on the working hypothesis derived from the previous works, which proposed tetrahedrally coordinated Fe species as the most catalytically active in CO oxidation [51], a facile technique for the preparation of iron oxide catalysts with an enhanced amount of these active sites was explored by thorough structure–activity correlation investigations. According to the approximation of Hüttig and Tamann [52,53], which allows us to calculate the temperature at which a metal shows significant diffusion along the surface or the bulk lattice, iron oxides are far less mobile on the support surface at the calcination temperature of 600 °C than their precursor. Therefore, agglomeration can be hindered and a high amount of isolated iron oxidic species can be generated if a multi-step impregnation–calcination protocol, with a 1 wt% stepwise increase in iron loading up to a total loading of 10 wt%, is employed. This would lead to higher catalytic activities compared to the single-step prepared catalysts, which can then be assigned to larger amounts of isolated tetrahedrally and octahedrally coordinated iron oxide species.
By this preparation method, the formation of larger oligomers and particles is avoided as no indications could be found by PXRD and SEM. However, an incorporation of FeIII centers into the γ-Al2O3 lattice is suspected due to a successive shift in the 2θ values of the Al2O3 reflexes to smaller angles with increasing iron loading in the PXRD evaluation, and a significant number of Fe–Al backscatterers in the EXAFS analysis. Furthermore, iron is present in different grades of aggregation on the catalyst surface (isolated, oligomers, and particles), which could be clarified by DRUV spectroscopy. The fraction of isolated iron centers decreases with higher loadings. In comparison to the single-step impregnated reference sample, the number of isolated species (tetrahedral and octahedral coordination) could be significantly increased using the multi-step impregnation approach. The reference sample obtained by the conventional single-step impregnation with 10 wt% Fe exhibited the smallest fraction of isolated centers and the largest amount of small oligomers and particles of all the investigated catalysts, which is also visible in the SEM pictures. Due to a significant drop in the amount of isolated octahedrally coordinated centers between 6 and 7 wt% loading in favor of oligomer formation, two of the investigated catalysts show one of the highest proportions of isolated centers, namely the catalysts loaded with 4 and 8 wt%. This trend is also visible in EXAFS analysis. Unfortunately, a conclusive explanation for this abrupt drop in the proportion of octahedrally coordinated centers and the sudden rise of oligomers cannot be deduced from the experimental data obtained so far and will be the subject of future investigations. A possible reason might be the formation of a defined cluster species or phase, which requires a specified ratio between Fe and Al.
XANES analysis unambiguously proved that all the iron species are present in the oxidation state +3. An increase in the pre-peak intensity from 1 to 4 wt% can be seen, which can be used as an indicator for an increasing amount of γ-Fe2O3, a phase which was also identified with dPDF analysis at higher loadings as well as EXAFS analysis. Here, a shift in the Fe–O distance of the second coordination sphere shows an increase in the octahedrons or oligomeric iron oxide species with higher loadings. These results are perfectly in line with the findings obtained by DRUVS.
Catalytic tests of the presented samples in CO oxidation reaction during continuous heating can be correlated to their trend in structural properties in terms of the amount of isolated (tetrahedrally and octahedrally coordinated) Fe species, which increased from 1 to 8 wt% of iron, as well as the catalytic activity. Over a wide temperature range, the higher loaded catalysts (meaning 8 and 9 wt% loaded) are the most active ones, resulting in full conversion at 280 °C resp. 265 °C. Compared to the iron-based catalysts supported by γ-Al2O3 presented by Boubnov et al. [42] (full conversion approx. 250 °C) and Tepluchin et al. [46] (275 °C), as well as the iron-doped ceria systems of Laguna et al. [41] (325 °C), the obtained results are competitive.
This finding is also reflected in the turnover frequencies, where, at temperatures of up to 250 °C, the catalyst loaded with 8 wt% showed the highest values. As already mentioned, this catalyst showed one of the highest proportions of isolated centers in the DRUVS analysis, which allows for a correlation to its catalytic performance. Another catalyst with a significant number of isolated centers in DRUVS analysis is the 4 wt% loaded one, which exhibited the highest TOF values for temperatures above 250 °C. At the highest investigated temperature (400 °C), the catalyst with 1 wt% iron loading and the highest ratio of tetrahedrally coordinated centers compared to all other species showed the highest conversion numbers, which can be related to the fact that, at this temperature, the higher loaded catalysts have already reached full conversion.
The lower conversions under continuous heating conditions of the catalysts with lower iron loadings (1 wt% and 4 wt%) compared to 8 wt% loadings can be explained by the presence of a smaller absolute amount of iron—not only in form of isolated centers, which seem to have an outstanding effect on the catalytic activity, but also in form of oligomers, which are also expected to exhibit a certain catalytic activity. The formation of particles, on the other hand, seems to have a rather negative influence on the catalytic activity, explaining the higher temperatures for full conversion for the 9 and 10 wt% loaded catalysts.
With the presented multi-step impregnation–calcination procedure, the catalyst loaded with 8 wt% iron showed the best catalytic activity in CO oxidation and the highest amount of isolated tetrahedrally coordinated iron centers of the investigated series of catalysts. The successive loading of iron precursor onto the γ-Al2O3 support in 1 wt% steps, followed by calcination, seems to hinder agglomeration, hence much fewer oligomers and particulates are formed, which, in addition, has a positive influence on the catalysts’ activity. The multi-step impregnation–calcination technique enables the preparation of new heterogeneous catalysts with finely dispersed isolated active sites, potentially also with other 3d metals, that could increase their catalytic activity and lead to the replacement of noble metal catalysts in catalytic CO oxidation.
4. Materials and Methods
4.1. Synthesis
Preparation of Catalysts FE01 to FE10
A 0.25 M solution of iron(III) acetylacetonate (Sigma Aldrich, Taufkirchen, Germany) in acetone was prepared and added to a suspension of commercially available γ-Al2O3 (SCFa140, Sasol®). After stirring for 10 min, the solvent was removed at 40 °C under reduced pressure. The dry reddish powders were then annealed in a furnace under atmospheric air with a heating ramp of 2 °C/min up to 600 °C and held at this temperature for 3 h. The reported weight loadings of iron refer to the mass of iron inserted during synthesis (see Table 2). The amounts of iron and γ-Al2O3, respectively, the iron and the catalyst of the previous stage, were calculated to add up to 100 wt%. For each step, 1 wt% of iron was added in form of the said precursor solution to yield the next stage catalyst after calcination.
Table 2.
Total amounts of FE01 to FE10 and SI10 used for their preparation.
4.2. Analytics
Powder X-ray diffraction (PXRD) was acquired at ID31 beamline at the European Synchrotron Radiation Facility ESRF (Grenoble, France) with an X-ray energy of 65 keV. All the samples were measured in Kapton® capillaries with a diameter of 1 mm for 10 s. The powder diffraction patterns were collected using a Dectris 2M CdTe Detector, resulting in a Q-range of 0.9–28.7 Å−1. Radial integration was performed with xpdtools. Pair distribution function calculation of the data was carried out with xPDFsuite [62]. PDF refinements were carried out with DiffPy-cmi [63]. The γ-Al2O3 support was refined against a cubic (spinel) crystal structure [64] containing Al3+ ions on tetrahedral and octahedral spinel positions, as well as additional Al3+ ions on non-spinel positions. The refinable variables were the occupancy of these positions (8a, 16c, 16d, 48f Wyckoff), thermal parameters Biso of the Al3+ ions, the lattice parameter a, spherical particle size accounting for small crystalline domains in the porous support, the phase scale factor, and δ2 accounting for correlated motion of nearest neighbor atoms, described by Jeong et al. [65].
DRUV analyses were performed on a Lambda 850 spectrometer from Perkin Elmer equipped with a Praying Mantis diffuse reflectance accessory (Harrick). The catalyst powder samples were examined at ambient conditions and without dilution, and pure γ-Al2O3 was used as a reference. The spectra were collected from 200 to 800 nm with a resolution of 1 nm. The DRUV–vis spectra were converted using the Kubelka–Munk function that is defined as F(R) = (1 − R)2/(2R). The spectra were processed by manual subtraction of a Lorentzian-type function as a baseline followed by peak deconvolution using three to six Gauss functions, depending on the shape of the experimental spectrum.
X-ray absorption spectroscopy (XAS) experiments of FE01 to FE08 at the Fe K-edge (7112 eV) were performed at PETRA III beamline P64 at Deutsches Elektronen-Synchrotron DESY (Hamburg, Germany) using a Si(311) double crystal monochromator at a maximum beam current of 100 mA. X-ray absorption spectroscopy (XAS) experiments of FE09, FE10, and SI10 at the Fe K-edge (7112 eV) were performed at PETRA III beamline P65 at DESY with a Si(111) double crystal monochromator at a maximum beam current of 100 mA. At each beamline, calibration of the monochromator was controlled using an Fe foil. The samples were diluted with cellulose (Sigma-Aldrich), homogenized in a mortar and then pressed to a pellet. FE01 to FE03 were measured in fluorescence mode using a PIPS detector (passivated implanted planar silicon), while FE04 to FE10 and SI10 were measured in transition mode using ionization chambers in front of and behind the sample.
E0 was defined as the first maximum of the derivative after the pre-peak. For EXAFS analysis, the background was subtracted from the obtained spectra as a Victoreen-type polynomial [66,67], followed by the determination of the smooth part of the spectrum by a piecewise polynomial, optimized to yield minimal low-R components for the resulting Fourier transformation. After division by the smoothed part, the photon energy was transformed into the photoelectron wavenumber k. χ(k) was weighted with k3 for the fitting with the program EXCURV98, which utilizes the EXAFS equation (Equation (1)) in the form of pseudo-radial distribution functions.
Here, inelastic effects are represented by the amplitude reducing factor and λ, the mean free path length, while the number of backscattering atoms Nj, their distance to the observed atom rj and the Debye–Waller-like factor σ2 take structural parameters into account.
Scanning electron microscopy (SEM) and energy dispersive X-ray spectroscopy (EDX) images were recorded using a Zeiss NEON 40 microscope equipped with an UltraDry detector by Thermo Fisher Scientific. SEM images were recorded using an acceleration potential of 2 kV and an aperture size of 30 µm, while EDX images were recorded with an acceleration voltage of 10 kV to produce the corresponding fluorescence radiation.
4.3. Catalytic Experiments
For catalytic experiments the samples were homogenized in a mortar, pressed to a pellet, and then granulated and sieved to a fraction of 125 to 250 μm. Then, 267 mg of the catalyst were placed in a quartz glass tube with an inner diameter of 6 mm. The filling was plugged on both sides with quartz wool and the reactor was mounted into a clamshell oven. K-type thermocouples were inserted from both sides to log the exact temperatures at the gas entrance and exit of the packed bed. Continuous measurements were carried out during heating with a rate of 2 °C/min up to 600 °C, with a permanent gas feed of 1000 ppm CO and 10 vol% O2 in an inert gas balance to a total flow of 400 mL/min. For activation, the catalysts were heated under a constant argon flow of 400 mL/min up to 450 °C, with a heating rate of 5 °C/min, and then cooled down again to room temperature. For static experiments, the catalysts were cooled down to 150 °C in an inert gas after the continuous measurements. Then, the above-mentioned gas feed was applied, and the catalytic activity was measured at 150, 200, and 250 °C, each for 2 h.
Supplementary Materials
The following supporting information can be downloaded at: https://www.mdpi.com/article/10.3390/catal14070416/s1: Detailed information about powder diffraction measurements and PDF analysis, DRUVS spectra and analysis, SEM pictures, X-ray absorption (XANES and EXAFS) analysis details.
Author Contributions
Synthesis—catalytic tests, S.S.; data analysis—powder diffraction, DRUVS and XAS, S.S.; data analysis—PDF, N.P. and M.Z.; writing—original draft preparation, S.S.; writing—review and editing, S.S., R.S. and M.B.; visualization, S.S. and R.S.; supervision, M.B. and M.Z.; funding acquisition, M.B. All authors have read and agreed to the published version of the manuscript.
Funding
This research was funded by the Deutsche Forschungsgemeinschaft, grant number BA 4467/5-1, BA 4467/8-2 and ZO 369/2-1, as well as by the German BMBF, grant numbers FKZ 05K18PPA and 05K24PPA.
Data Availability Statement
The data presented in this study are available on request from the corresponding author.
Acknowledgments
Provision of beamtime by beamlines P64 and P65 at PETRA III is kindly acknowledged. We thank the beamline staff for their support. We thank Sabrina Thomä for carrying out the XRD measurements, and kindly acknowledge the provided beamtime by beamline ID31 at ESRF as well as the DAAD for financing Sabrina Thomä’s stipend for the stay in Grenoble. Furthermore, we would like to thank Manuel Traut and Wolfgang Bremser for the SEM and EDX measurements.
Conflicts of Interest
The authors declare no conflicts of interest.
References
- Stabile, L.; Massimo, A.; Rizza, V.; D’Apuzzo, M.; Evangelisti, A.; Scungio, M.; Frattolillo, A.; Cortellessa, G.; Buonanno, G. A novel approach to evaluate the lung cancer risk of airborne particles emitted in a city. Sci. Total Environ. 2019, 656, 1032–1042. [Google Scholar] [CrossRef] [PubMed]
- Yim, S.H.L.; Lee, G.L.; Lee, I.H.; Allroggen, F.; Ashok, A.; Caiazzo, F.; Eastham, S.D.; Malina, R.; Barrett, S.R.H. Global, regional and local health impacts of civil aviation emissions. Environ. Res. Lett. 2015, 10, 34001. [Google Scholar] [CrossRef]
- Royal College of Physicians. Every Breath We Take: The Lifelong Impact of Air Pollution. Report of a Working Party; RCP: London, UK, 2016. [Google Scholar]
- World Health Organisation. WHO Ambient Air Quality Database. Available online: https://www.who.int/data/gho/data/themes/air-pollution/who-air-quality-database (accessed on 29 August 2023).
- Belton, D.N.; Taylor, K.C. Automobile exhaust emission control by catalysts. Curr. Opin. Solid State Mater. Sci. 1999, 4, 97–102. [Google Scholar] [CrossRef]
- Dey, S.; Mehta, N.S. Automobile pollution control using catalysis. Resour. Environ. Sustain. 2020, 2, 100006. [Google Scholar] [CrossRef]
- Wallington, T.J.; Anderson, J.E.; Dolan, R.H.; Winkler, S.L. Vehicle Emissions and Urban Air Quality: 60 Years of Progress. Atmosphere 2022, 13, 650. [Google Scholar] [CrossRef]
- Roy, N.; Chakraborty, S. ZnO as photocatalyst: An approach to waste water treatment. Mater. Today Proc. 2021, 46, 6399–6403. [Google Scholar] [CrossRef]
- Singh, P.; Mohan, B.; Madaan, V.; Ranga, R.; Kumari, P.; Kumar, S.; Bhankar, V.; Kumar, P.; Kumar, K. Nanomaterials photocatalytic activities for waste water treatment: A review. Environ. Sci. Pollut. Res. Int. 2022, 29, 69294–69326. [Google Scholar] [CrossRef]
- Ahmed, S.N.; Haider, W. Heterogeneous photocatalysis and its potential applications in water and wastewater treatment: A review. Nanotechnology 2018, 29, 342001. [Google Scholar] [CrossRef]
- Roppertz, A.; Füger, S.; Kureti, S. Investigation of Urea-SCR at Low Temperatures. Top. Catal. 2017, 60, 199–203. [Google Scholar] [CrossRef]
- Da Świrk Costa, K.; Delahay, G.; Zaki, A.; Adil, K.; Cadiau, A. Facile modifications of HKUST-1 by V, Nb and Mn for low-temperature selective catalytic reduction of nitrogen oxides by NH3. Catal. Today 2022, 384–386, 25–32. [Google Scholar] [CrossRef]
- Xu, G.; Li, H.; Yu, Y.; He, H. Dynamic Change of Active Sites of Supported Vanadia Catalysts for Selective Catalytic Reduction of Nitrogen Oxides. Environ. Sci. Technol. 2022, 56, 3710–3718. [Google Scholar] [CrossRef] [PubMed]
- Zhang, M.; Guan, Z.; Qiao, Y.; Zhou, S.; Chen, G.; Guo, R.; Pan, W.; Wu, J.; Li, F.; Ren, J. The impact of catalyst structure and morphology on the catalytic performance in NH3-SCR reaction: A review. Fuel 2024, 361, 130541. [Google Scholar] [CrossRef]
- Park, Y.-K.; Kim, B.-S. Catalytic removal of nitrogen oxides (NO, NO2, N2O) from ammonia-fueled combustion exhaust: A review of applicable technologies. Chem. Eng. J. 2023, 461, 141958. [Google Scholar] [CrossRef]
- Fino, D. Diesel emission control: Catalytic filters for particulate removal. Sci. Technol. Adv. Mater. 2007, 8, 93–100. [Google Scholar] [CrossRef]
- van Setten, B.A.A.L.; Makkee, M.; Moulijn, J.A. Science and technology of catalytic diesel particulate filters. Catal. Rev. 2001, 43, 489–564. [Google Scholar] [CrossRef]
- Zhang, Y.; Lou, D.; Tan, P.; Hu, Z.; Fang, L. Effect of catalyzed diesel particulate filter and its catalyst loading on emission characteristics of a non-road diesel engine. J. Environ. Sci. (China) 2023, 126, 794–805. [Google Scholar] [CrossRef] [PubMed]
- Kuye, A.; Kumar, P. A review of the physicochemical characteristics of ultrafine particle emissions from domestic solid fuel combustion during cooking and heating. Sci. Total Environ. 2023, 886, 163747. [Google Scholar] [CrossRef]
- Twigg, M.V. Catalytic control of emissions from cars. Catal. Today 2011, 163, 33–41. [Google Scholar] [CrossRef]
- Lambert, C.K. Current state of the art and future needs for automotive exhaust catalysis. Nat. Catal. 2019, 2, 554–557. [Google Scholar] [CrossRef]
- Rood, S.; Eslava, S.; Manigrasso, A.; Bannister, C. Recent advances in gasoline three-way catalyst formulation: A review. Proc. Inst. Mech. Eng. Part D 2020, 234, 936–949. [Google Scholar] [CrossRef]
- Wang, J.; Chen, H.; Hu, Z.; Yao, M.; Li, Y. A Review on the Pd-Based Three-Way Catalyst. Catal. Rev. 2015, 57, 79–144. [Google Scholar] [CrossRef]
- Jasiński, D.; Meredith, J.; Kirwan, K. The life cycle impact for platinum group metals and lithium to 2070 via surplus cost potential. Int. J. Life Cycle Assess. 2018, 23, 773–786. [Google Scholar] [CrossRef] [PubMed]
- Glaister, B.J.; Mudd, G.M. The environmental costs of platinum–PGM mining and sustainability: Is the glass half-full or half-empty? Miner. Eng. 2010, 23, 438–450. [Google Scholar] [CrossRef]
- Martínez-Hernando, M.-P.; García-Franco, E.; Bolonio, D.; Ortega, M.F.; García-Martínez, M.-J. Life cycle sustainability assessment of the platinum supply chain in the European Union. Sustain. Prod. Consum. 2024, 46, 679–689. [Google Scholar] [CrossRef]
- Grohol, M.; Veeh, C. Study on the Critical Raw Materials for the EU 2023—Final Report; Publications Office of the European Union: Luxembourg, 2023. [Google Scholar]
- Martinez, U.; Komini Babu, S.; Holby, E.F.; Chung, H.T.; Yin, X.; Zelenay, P. Progress in the Development of Fe-Based PGM-Free Electrocatalysts for the Oxygen Reduction Reaction. Adv. Mater. 2019, 31, e1806545. [Google Scholar] [CrossRef] [PubMed]
- Wu, G. Current challenge and perspective of PGM-free cathode catalysts for PEM fuel cells. Front. Energy 2017, 11, 286–298. [Google Scholar] [CrossRef]
- Glisenti, A.; Pacella, M.; Guiotto, M.; Natile, M.M.; Canu, P. Largely Cu-doped LaCo1−Cu O3 perovskites for TWC: Toward new PGM-free catalysts. Appl. Catal. B 2016, 180, 94–105. [Google Scholar] [CrossRef]
- Pacella, M.; Garbujo, A.; Fabro, J.; Guiotto, M.; Xin, Q.; Natile, M.M.; Canu, P.; Cool, P.; Glisenti, A. PGM-free CuO/LaCoO3 nanocomposites: New opportunities for TWC application. Appl. Catal. B 2018, 227, 446–458. [Google Scholar] [CrossRef]
- Hofer, L.J.E. Specificity of catalysts for the oxidation of carbon monoxide-ethylene mixtures*1. J. Catal. 1964, 3, 451–460. [Google Scholar] [CrossRef]
- Walker, J.S.; Straguzzi, G.I.; Manogue, W.H.; Schuit, G.C.A. Carbon monoxide and propene oxidation by iron oxides for auto-emission control. J. Catal. 1988, 110, 298–309. [Google Scholar] [CrossRef]
- Li, P.; Miser, D.E.; Rabiei, S.; Yadav, R.T.; Hajaligol, M.R. The removal of carbon monoxide by iron oxide nanoparticles. Appl. Catal. B 2003, 43, 151–162. [Google Scholar] [CrossRef]
- Lin, H.-Y.; Chen, Y.-W.; Wang, W.-J. Preparation of nanosized iron oxide and its application in low temperature CO oxidation. J. Nanopart. Res. 2005, 7, 249–263. [Google Scholar] [CrossRef]
- Szegedi, A.; Hegedus, M.; Margitfalvi, J.L.; Kiricsi, I. Low temperature CO oxidation over iron-containing MCM-41 catalysts. Chem. Commun. 2005, 1441–1443. [Google Scholar] [CrossRef]
- Abdel Halim, K.S.; Khedr, M.H.; Nasr, M.I.; El-Mansy, A.M. Factors affecting CO oxidation over nanosized Fe2O3. Mater. Res. Bull. 2007, 42, 731–741. [Google Scholar] [CrossRef]
- Carriazo, J.G.; Centeno, M.A.; Odriozola, J.A.; Moreno, S.; Molina, R. Effect of Fe and Ce on Al-pillared bentonite and their performance in catalytic oxidation reactions. Appl. Catal. A 2007, 317, 120–128. [Google Scholar] [CrossRef]
- Kandalam, A.K.; Chatterjee, B.; Khanna, S.N.; Rao, B.K.; Jena, P.; Reddy, B.V. Oxidation of CO on Fe2O3 model surfaces. Surf. Sci. 2007, 601, 4873–4880. [Google Scholar] [CrossRef]
- Wagloehner, S.; Reichert, D.; Leon-Sorzano, D.; Balle, P.; Geiger, B.; Kureti, S. Kinetic modeling of the oxidation of CO on Fe2O3 catalyst in excess of O2. J. Catal. 2008, 260, 305–314. [Google Scholar] [CrossRef]
- Laguna, O.H.; Centeno, M.A.; Boutonnet, M.; Odriozola, J.A. Fe-doped ceria solids synthesized by the microemulsion method for CO oxidation reactions. Appl. Catal. B 2011, 106, 621–629. [Google Scholar] [CrossRef]
- Boubnov, A.; Roppertz, A.; Kundrat, M.D.; Mangold, S.; Reznik, B.; Jacob, C.R.; Kureti, S.; Grunwaldt, J.-D. Towards advanced structural analysis of iron oxide clusters on the surface of γ-Al2O3 using EXAFS. Appl. Surf. Sci. 2016, 386, 234–246. [Google Scholar] [CrossRef]
- Zhang, H.; Fang, S.; Hu, Y.H. Recent advances in single-atom catalysts for CO oxidation. Catal. Rev. 2022, 64, 491–532. [Google Scholar] [CrossRef]
- Dong, N.; Chen, M.; Ye, Q.; Zhang, D.; Dai, H. An investigation on catalytic performance and reaction mechanisms of Fe/OMS-2 for the oxidation of carbon monoxide, ethyl acetate, and toluene. J. Environ. Sci. (China) 2022, 112, 258–268. [Google Scholar] [CrossRef] [PubMed]
- Tepluchin, M.; Casapu, M.; Boubnov, A.; Lichtenberg, H.; Wang, D.; Kureti, S.; Grunwaldt, J.-D. Fe and Mn-Based Catalysts Supported on γ-Al2O3 for CO Oxidation under O2-Rich Conditions. ChemCatChem 2014, 6, 1763–1773. [Google Scholar] [CrossRef]
- Tepluchin, M.; Pham, D.K.; Casapu, M.; Mädler, L.; Kureti, S.; Grunwaldt, J.-D. Influence of single- and double-flame spray pyrolysis on the structure of MnOx/γ-Al2O3 and FeOx/γ-Al2O3 catalysts and their behaviour in CO removal under lean exhaust gas conditions. Catal. Sci. Technol. 2015, 5, 455–464. [Google Scholar] [CrossRef]
- Mosallanejad, S.; Dlugogorski, B.Z.; Kennedy, E.M.; Stockenhuber, M. On the Chemistry of Iron Oxide Supported on γ-Alumina and Silica Catalysts. ACS Omega 2018, 3, 5362–5374. [Google Scholar] [CrossRef]
- Hnat, I.; Kocemba, I.; Rynkowski, J.; Onfroy, T.; Dzwigaj, S. Influence of the state of iron on CO oxidation on FeSiBEA zeolite catalysts. Catal. Today 2011, 176, 229–233. [Google Scholar] [CrossRef]
- Schoch, R.; Huang, H.; Schünemann, V.; Bauer, M. A new iron-based carbon monoxide oxidation catalyst: Structure-activity correlation. ChemPhysChem 2014, 15, 3768–3775. [Google Scholar] [CrossRef] [PubMed]
- Schoch, R.; Bauer, M. Pollution Control Meets Sustainability: Structure-Activity Studies on New Iron Oxide-Based CO Oxidation Catalysts. ChemSusChem 2016, 9, 1996–2004. [Google Scholar] [CrossRef] [PubMed]
- Schlicher, S.; Prinz, N.; Bürger, J.; Omlor, A.; Singer, C.; Zobel, M.; Schoch, R.; Lindner, J.K.N.; Schünemann, V.; Kureti, S.; et al. Quality or Quantity? How Structural Parameters Affect Catalytic Activity of Iron Oxides for CO Oxidation. Catalysts 2022, 12, 675. [Google Scholar] [CrossRef]
- Argyle, M.; Bartholomew, C. Heterogeneous Catalyst Deactivation and Regeneration: A Review. Catalysts 2015, 5, 145–269. [Google Scholar] [CrossRef]
- Moulijn, J.; van Diepen, A.; Kapteijn, F. Catalyst deactivation: Is it predictable? Appl. Catal. A 2001, 212, 3–16. [Google Scholar] [CrossRef]
- Vegard, L. Die Konstitution der Mischkristalle und die Raumfllung der Atome. Z. Phys. 1921, 5, 17–26. [Google Scholar] [CrossRef]
- Paglia, G.; Božin, E.S.; Billinge, S.J.L. Fine-Scale Nanostructure in γ-Al2O3. Chem. Mater. 2006, 18, 3242–3248. [Google Scholar] [CrossRef]
- Shmakov, A.N.; Kryukova, G.N.; Tsybulya, S.V.; Chuvilin, A.L.; Solovyeva, L.P. Vacancy Ordering in γ-Fe2O3: Synchrotron X-ray Powder Diffraction and High-Resolution Electron Microscopy Studies. J. Appl. Crystallogr. 1995, 28, 141–145. [Google Scholar] [CrossRef]
- Pérez-Ramírez, J.; Groen, J.; Brückner, A.; Kumar, M.; Bentrup, U.; Debbagh, M.; Villascusa, L. Evolution of isomorphously substituted iron zeolites during activation: Comparison of Fe-beta and Fe-ZSM-5. J. Catal. 2005, 232, 318–334. [Google Scholar] [CrossRef]
- Westre, T.E.; Kennepohl, P.; DeWitt, J.G.; Hedman, B.; Hodgson, K.O.; Solomon, E.I. A Multiplet Analysis of Fe K-Edge 1s → 3d Pre-Edge Features of Iron Complexes. J. Am. Chem. Soc. 1997, 119, 6297–6314. [Google Scholar] [CrossRef]
- de Groot, F.; Vankó, G.; Glatzel, P. The 1s x-ray absorption pre-edge structures in transition metal oxides. J. Phys. Condens. Matter 2009, 21, 104207. [Google Scholar] [CrossRef] [PubMed]
- Blake, R.L.; Hessevick, R.E.; Zoltai, T.; Finger, L.W. Refinement of the hematite structure. Am. Mineral. 1966, 51, 123–129. [Google Scholar]
- Bouree, F.; Baudour, J.L.; Elbadraoui, E.; Musso, J.; Laurent, C.; Rousset, A. Crystal and magnetic structure of piezoelectric, ferrimagnetic and magnetoelectric aluminium iron oxide FeAlO3 from neutron powder diffraction. Acta Cryst. 1996, B52, 217–222. [Google Scholar] [CrossRef]
- Yang, X.; Juhas, P.; Farrow, C.L.; Billinge, S.J.L. xPDFsuite: An End-to-End Software Solution for High Throughput Pair Distribution Function Transformation, Visualization and Analysis. 2014. Available online: http://arxiv.org/pdf/1402.3163v3 (accessed on 28 June 2024).
- Juhás, P.; Farrow, C.L.; Yang, X.; Knox, K.R.; Billinge, S.J.L. Complex modeling: A strategy and software program for combining multiple information sources to solve ill posed structure and nanostructure inverse problems. Acta Cryst. 2015, A71, 562–568. [Google Scholar] [CrossRef]
- Smrčok, Ľ.; Langer, V.; Křesťan, J. Gamma-alumina: A single-crystal X-ray diffraction study. Acta Cryst. 2006, C62, i83–i84. [Google Scholar] [CrossRef]
- Jeong, I.-K.; Heffner, R.H.; Graf, M.J.; Billinge, S.J.L. Lattice dynamics and correlated atomic motion from the atomic pair distribution function. Phys. Rev. B 2003, 67, 104301. [Google Scholar] [CrossRef]
- Newville, M.; Līviņš, P.; Yacoby, Y.; Rehr, J.J.; Stern, E.A. Near-edge x-ray-absorption fine structure of Pb: A comparison of theory and experiment. Phys. Rev. B 1993, 47, 14126–14131. [Google Scholar] [CrossRef] [PubMed]
- Ertel, T.S.; Bertagnolli, H.; Hückmann, S.; Kolb, U.; Peter, D. XAFS Spectroscopy of Liquid and Amorphous Systems: Presentation and Verification of a Newly Developed Program Package. Appl. Spectrosc. 1992, 46, 690–698. [Google Scholar] [CrossRef]


Disclaimer/Publisher’s Note: The statements, opinions and data contained in all publications are solely those of the individual author(s) and contributor(s) and not of MDPI and/or the editor(s). MDPI and/or the editor(s) disclaim responsibility for any injury to people or property resulting from any ideas, methods, instructions or products referred to in the content. |
© 2024 by the authors. Licensee MDPI, Basel, Switzerland. This article is an open access article distributed under the terms and conditions of the Creative Commons Attribution (CC BY) license (https://creativecommons.org/licenses/by/4.0/).