Article

Autocatalyzed Kinetics of 6-Electron Electroreduction of Iodic Acid Studied by Rotating Disk Electrode Technique

1
Faculty of Petrochemistry and Polymer Materials, D. I. Mendeleev Russian University of Chemical Technology, Miusskaya Ploshchad, 9, Building 1, Moscow 125047, Russia
2
A.N. Frumkin Institute of Physical Chemistry and Electrochemistry, Russian Academy of Sciences, Leninsky Prosp., 31, Moscow 119071, Russia
*
Author to whom correspondence should be addressed.
Catalysts 2024, 14(7), 437; https://doi.org/10.3390/catal14070437 (registering DOI)
Submission received: 14 June 2024 / Revised: 4 July 2024 / Accepted: 6 July 2024 / Published: 9 July 2024
(This article belongs to the Section Electrocatalysis)

Abstract

:
The 6-electron electrochemical reduction of IO3 to I represents a breakthrough for the development of next-generation redox flow batteries, offering substantially higher energy densities for oxidizer storage. Our study reveals that on a glassy carbon (GC) electrode in acidic electrolytes, HIO3 undergoes an autocatalyzed electrochemical reduction to I. This process is mediated by the formation of a thin iodine layer on the electrode, acting as an intermediate and a catalyst. Under steady-state conditions, the iodine layer forms via a comproportionation reaction (HIO3 + I + 5H+ = I2 (s) + 3H2O). Initially, the iodine layer is generated through the slow direct electrochemical reduction of HIO3 on pristine GC. Once established, this layer significantly enhances the rate of iodate reduction. On voltammetry curves, it is clearly observable as a step-wise current surge to reach a plateau. The limiting current density on the GC seemingly aligns with the Levich equation, varying with the RDE rotation rate. Earlier, we demonstrated the electrochemical oxidation of I back to HIO3 using an H2/HIO3 flow cell, showcasing a full cycle that underpins the feasibility of this approach for energy storage. This study advances the understanding of iodate electroreduction and underscores its role in enhancing the capacity of next-generation energy storage systems.

1. Introduction

The ongoing transformation of the energy sector from fossil-based fuels to zero-carbon sources requires the widespread use of photovoltaics and wind power, which depend on weather conditions and, therefore, require the development of powerful and effective energy storage systems (ESS). Electrochemical ESS are capable of meeting the requirements of different applications by providing high variability and adaptability. Among electrochemical ESS, aqueous redox flow batteries (RFBs) are especially suitable for safe stationary storage of high quantities of energy. Due to the spatial separation of the electrochemical reactor and storage of reactants, RFBs provide flexibility in scaling power and stored energy. The amount of energy stored in RFBs depends on the volume of tanks filled with liquid reactants, the concentration of reactants, the voltage between the electrodes, and the charge passed in electrochemical reactions at the electrodes in a particular redox process. In most practical RFBs, such as all-vanadium, iron–chromium, and zinc–bromine, only one electron is transferred per single molecule or ion of the oxidizer in an electrochemical process occurring at the positive electrode of the RFB. The use of multi-electron oxidizers enables the storage capacity of the oxidizer tank to be multiplied. The use of bromates and chlorates as 6-electron oxidizers in electrochemical power sources was proposed in [1,2,3]. The overall reduction processes are as follows [4]:
BrO3 + 6H+ + 6ē → Br + 3H2O    E0 = 1.423 V;
ClO3 + 6H+ + 6ē → Cl + 3H2O     E0 = 1.451 V.
In strongly acidic aqueous electrolytes, these electrochemical reactions are relatively fast but almost impossible in alkaline electrolytes. The reverse processes of electrochemical oxidation of the respective bromide or chloride anions to bromate or chlorate anions, respectively, require an alkaline medium. Effective battery recharging is hardly possible without engaging additional chemical stages that are rather complex. In contradistinction to bromates and chlorates, iodate ↔ iodide transformation can be conducted in both directions in aqueous acidic electrolytes [5,6,7,8,9,10,11,12,13]:
IO3 + 6H+ + 6ē → I + 3H2O,     E0 = 1.085 V.
The use of iodate as an oxidizer in electrochemical power sources was proposed in refs. [14,15,16,17]. Using iodate as an oxidizer instead of bromates or chlorates enables electric recharging of the power source. Electrochemical reduction of iodate anion in aqueous acidic electrolytes at noble metal electrodes has been studied in several works [5,6,7,9,10,12]. The following autocatalytic mechanism of iodate reduction was proposed in refs. [6,7,9,12,18]:
2IO3 + 10ē + 12H+ ↔ I2 (el) + 6H2O,     E0 = 1.195 V;
I2 (el) + 2ē → 2I,     E0 = 0.535 V;
I2 (s) + 2ē → 2I,     E0 = 0.535 V;
IO3 + 5I + 6H+ ↔ 3I2 (el) + 3 H2O.
According to this mechanism, iodate electrochemical reduction (2) is initiated by a relatively slow reaction (3), which produces dissolved iodine I2 (el) in the electrolyte. Dissolved iodine is electrochemically reduced to I in a fast [18] consecutive reaction (4). Comproportionation reaction (5) between iodide and iodate reproduces dissolved iodine [19]. After that, the cycle consisting of reactions (4) and (5) comes into action and provides for a high rate of iodate reduction by the overall process (2). It is important to note that according to the proposed scheme, the reduction of iodate anions is possible only at relatively low potentials where iodine can be reduced to iodide, as shown in Equation (4). The electrochemical reduction of an iodate anion to iodide consumes six protons, as shown in Equation (2). For this reason, electrochemical reduction of iodate requires the presence of strong acid. Sulfuric acid with pKa1 = −3 was used to acidify the electrolyte in the present study. Iodates in the presence of sulfuric acid are actually in the undissociated form of relatively weak iodic acid, pKa = 0.75. However, hydroiodic acid is extremely strong, pKa ~ −9 [20].
This catalytic cycle can involve other intermediate compounds, including solid iodine I2 (s) and metastable hypoiodous acid HOI, as well as dissolved iodine [21,22]. HOI can be formed by a few processes. They are the dissolution of iodine in aqueous solutions, reaction (6), electrochemical oxidation of iodide, reaction (7), and comproportination of iodic acid and iodine, reaction (8), although the equilibrium constant of reaction (8) is low, 6 10−11 [23]:
H2O +I2 ↔ HI + HOI;
HOI + H+ + 2ē ↔ I + H2O     E0 = 0.987 V;
HIO3 + 2I2 + 2H2O ↔ 5HIO.
It can be hypothesized that the kinetics of iodic acid reduction at a rotating disk electrode (RDE) follows the same pattern as the EC” reduction mechanism suggested in reference [24] for electrochemical reduction of bromate anions. According to [24], the reduction of BrO3 proceeds via the formation of dissolved bromine Br2 (el). Due to the low electrochemical activity of bromate anions, the electroreduction process starts with the reduction of bromine Br2 (el) dissolved in electrolyte, reaction (9), which is formed by the slow decomposition of bromate in strongly acidified bromate solutions. In the vicinity of the electrode surface, within the reaction layer of thickness zk, Br and BrO3 anions comproportionate regenerating Br2 (el), reaction (10):
3Br2 (el) + 6ē + 6H+ → 6Br     E0 = 1.087 V;
5Br + BrO3 + 6H+ → 3Br2 (el) + 3H2O.
The electrochemical reduction of bromine to bromide (9) on the GC electrode is very fast [25]. The reduction pathway of bromate anions is similar to that of iodate reactions (3–5). Under certain conditions, the rate of electrochemical reduction of bromate anions on RDE is limited by the rates of convection–diffusion transport of reacting species within the diffusion layer and the kinetics of chemical comproportination reaction (10). The comproportination reaction (10) has been extensively studied in weakly acidic solutions and with a relatively low concentration of reactants [19].
At certain potentials of RDE, the bromate reduction current becomes independent of the electrode potential (E)—reduction current density reaches a plateau (ipl). The complexity of the bromate reduction mechanism causes a significant deviation in ipl from the well-known Levich plot describing the dependence of convective–diffusion limited current density on RDE rotation rate: ilim ~ ω0.5. The mathematical treatment reveals that the dependence of plateau current density of bromate reduction on RDE rotation rate in coordinates ipl − ω0.5 takes an S-shape [24]. An S-shaped curve of bromate reduction voltammetry was indeed observed on GC RDE [26].
The shape of ipl ~ ω0.5 depends on the ratio zd/zk, where zd stands for the thickness of the diffusion layer on RDE according to the Levich equation [27]:
zd = 1.61 D1/3 ω−1/2 ν1/6.
If zk << zd, the dependence ipl on ω0.5 is converted into a Levich plot [27]:
ilim = 0.62 n F D2/3 ω1/2 ν−1/6 C.
Here, D stands for the diffusion coefficient of the bromate anion, n = 6 is the number of electrons that take part in the global reaction, ν is the kinematic viscosity of the solution, and C is the concentration of reacting species. The following is a description of the S-shape of the dependence of ipl on rotation rate. At low RDE rotation rates, ipl increases with ω reaching a local maximum. After that, a rather sharp, by an order of magnitude or more, decrease in ipl occurs until the current hits its minimum. At higher ω, ipl increases steadily with an increase in the rotation rate. It is important to note that both zk and zd are not constant. zk is independent of the rotation rate, but it depends on the diffusion coefficient and the comproportination reaction rate.
The primary goal of this work is to study the kinetics of iodic acid reduction to iodide at carbonaceous electrodes in aqueous acidic electrolytes in view of possible applications of this reaction on positive electrodes in advanced metal-iodate RFBs.

2. Results and Discussion

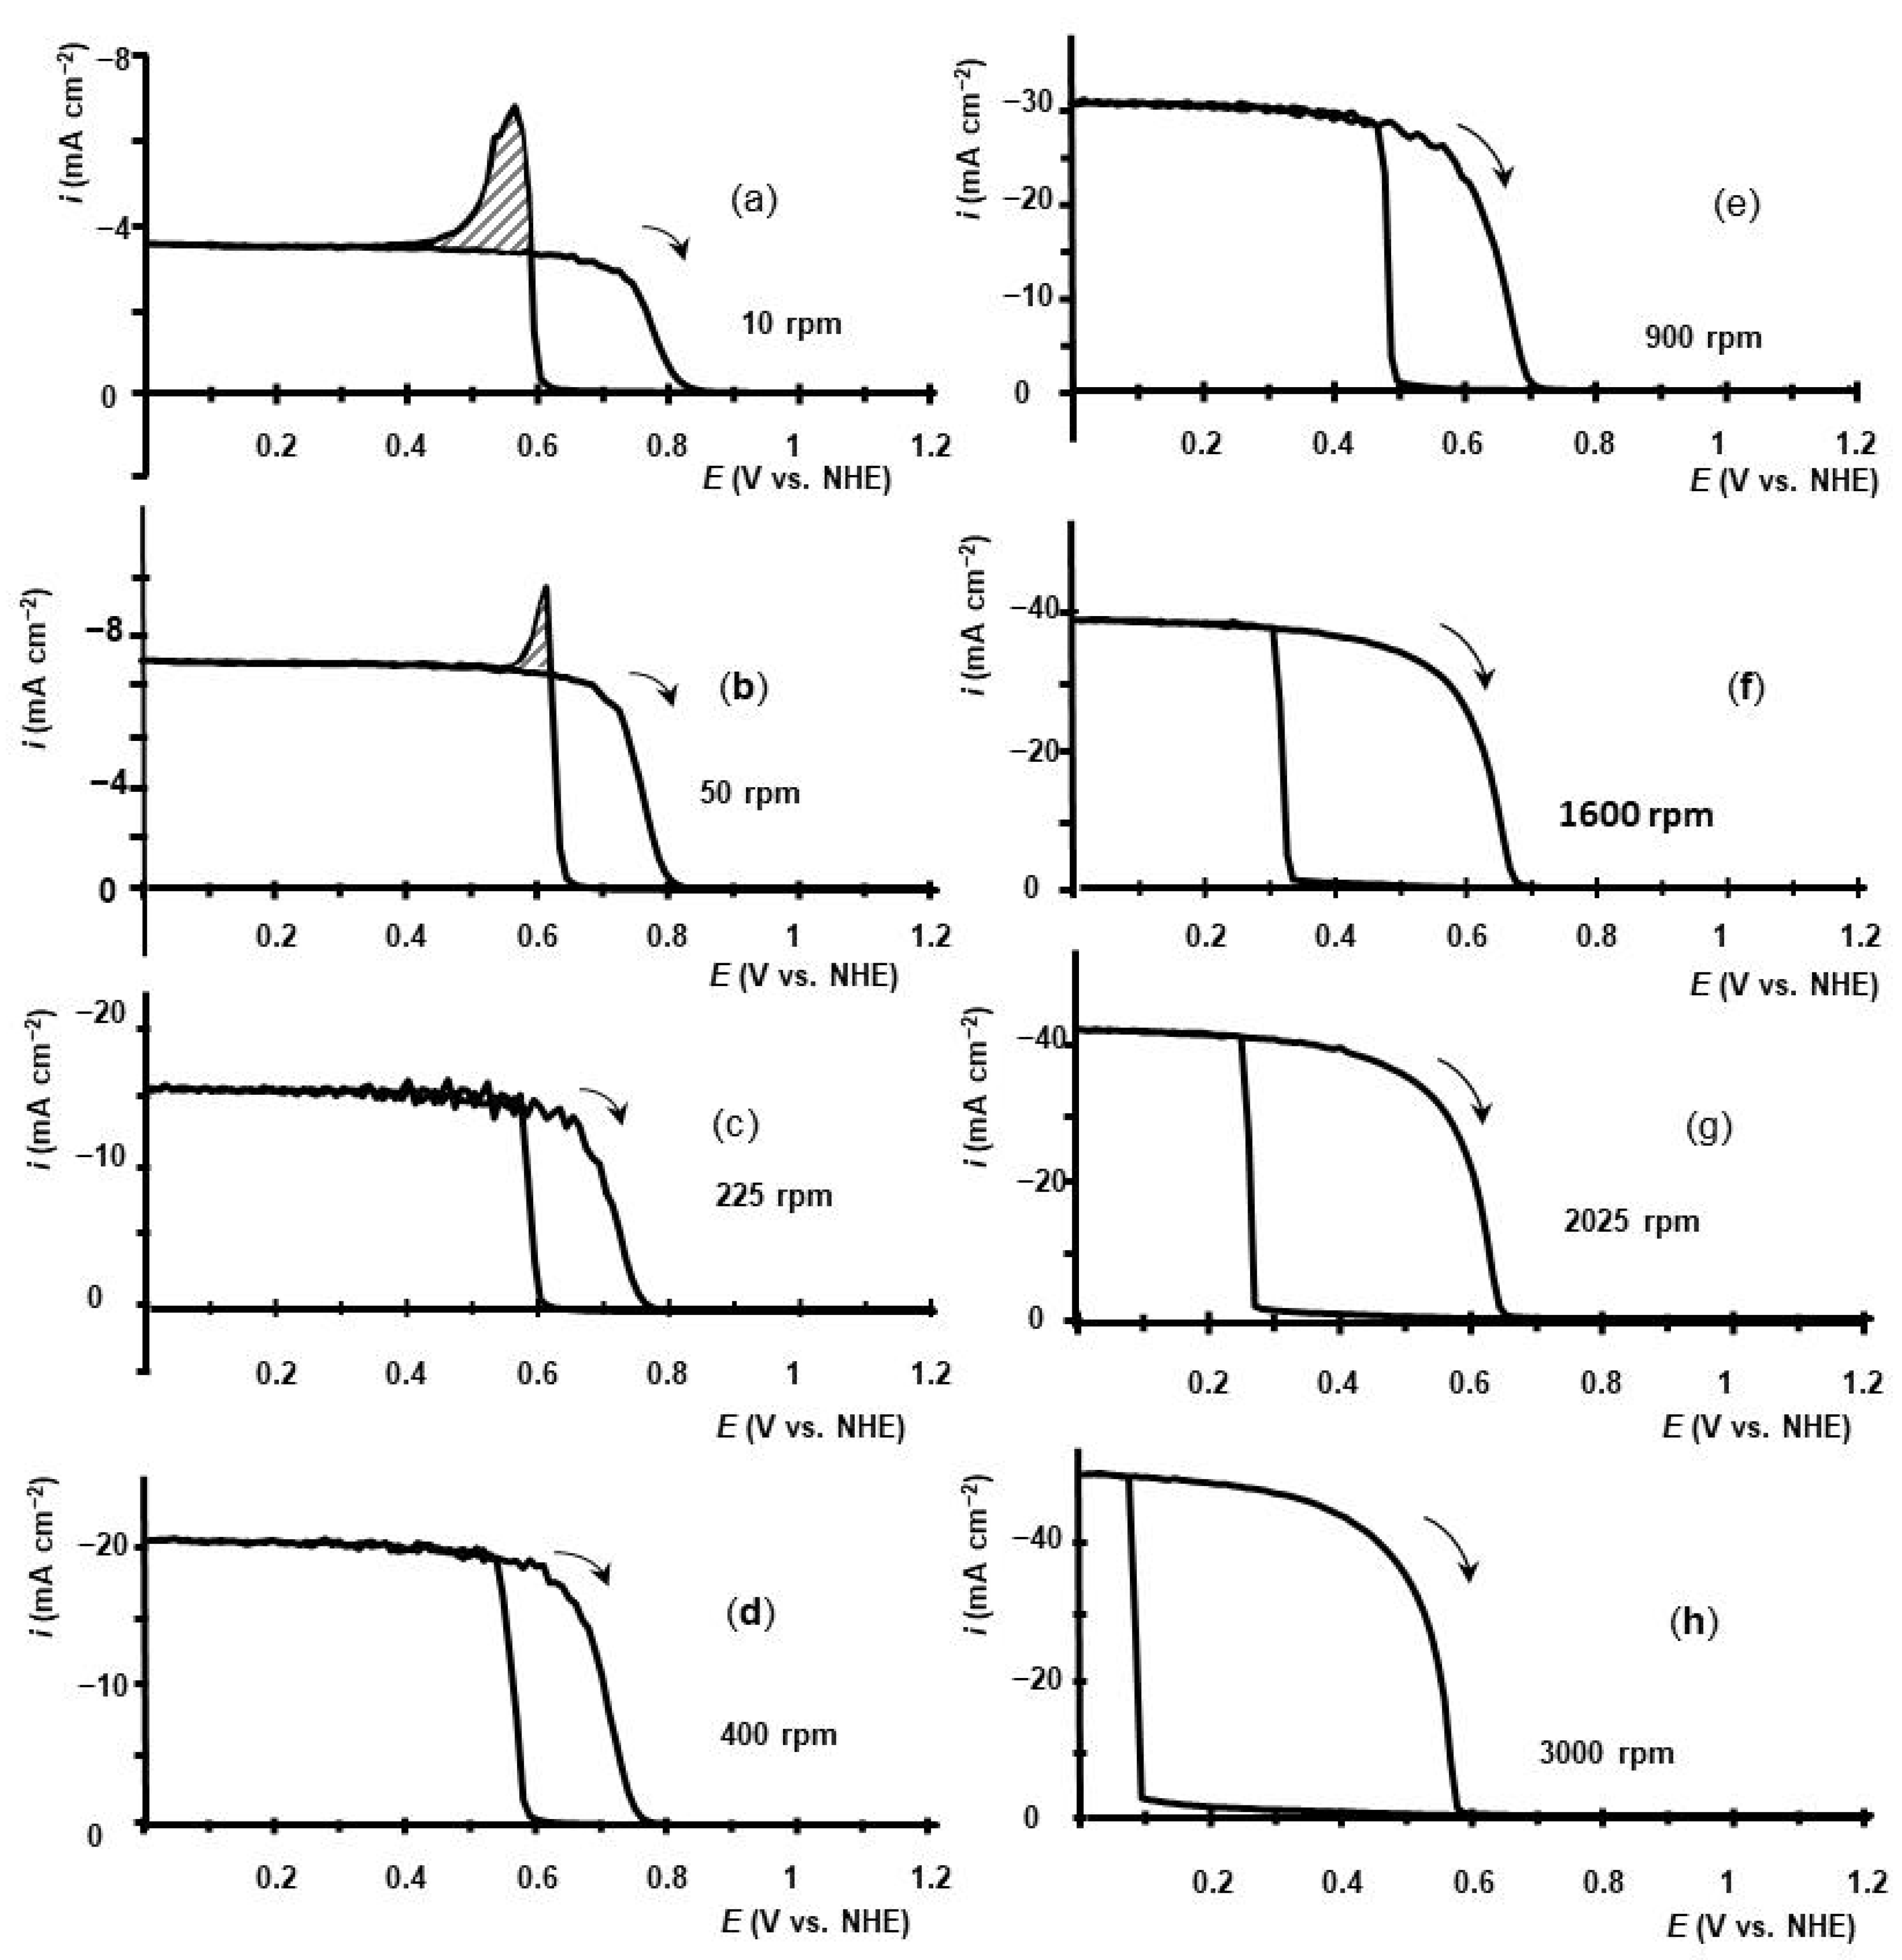
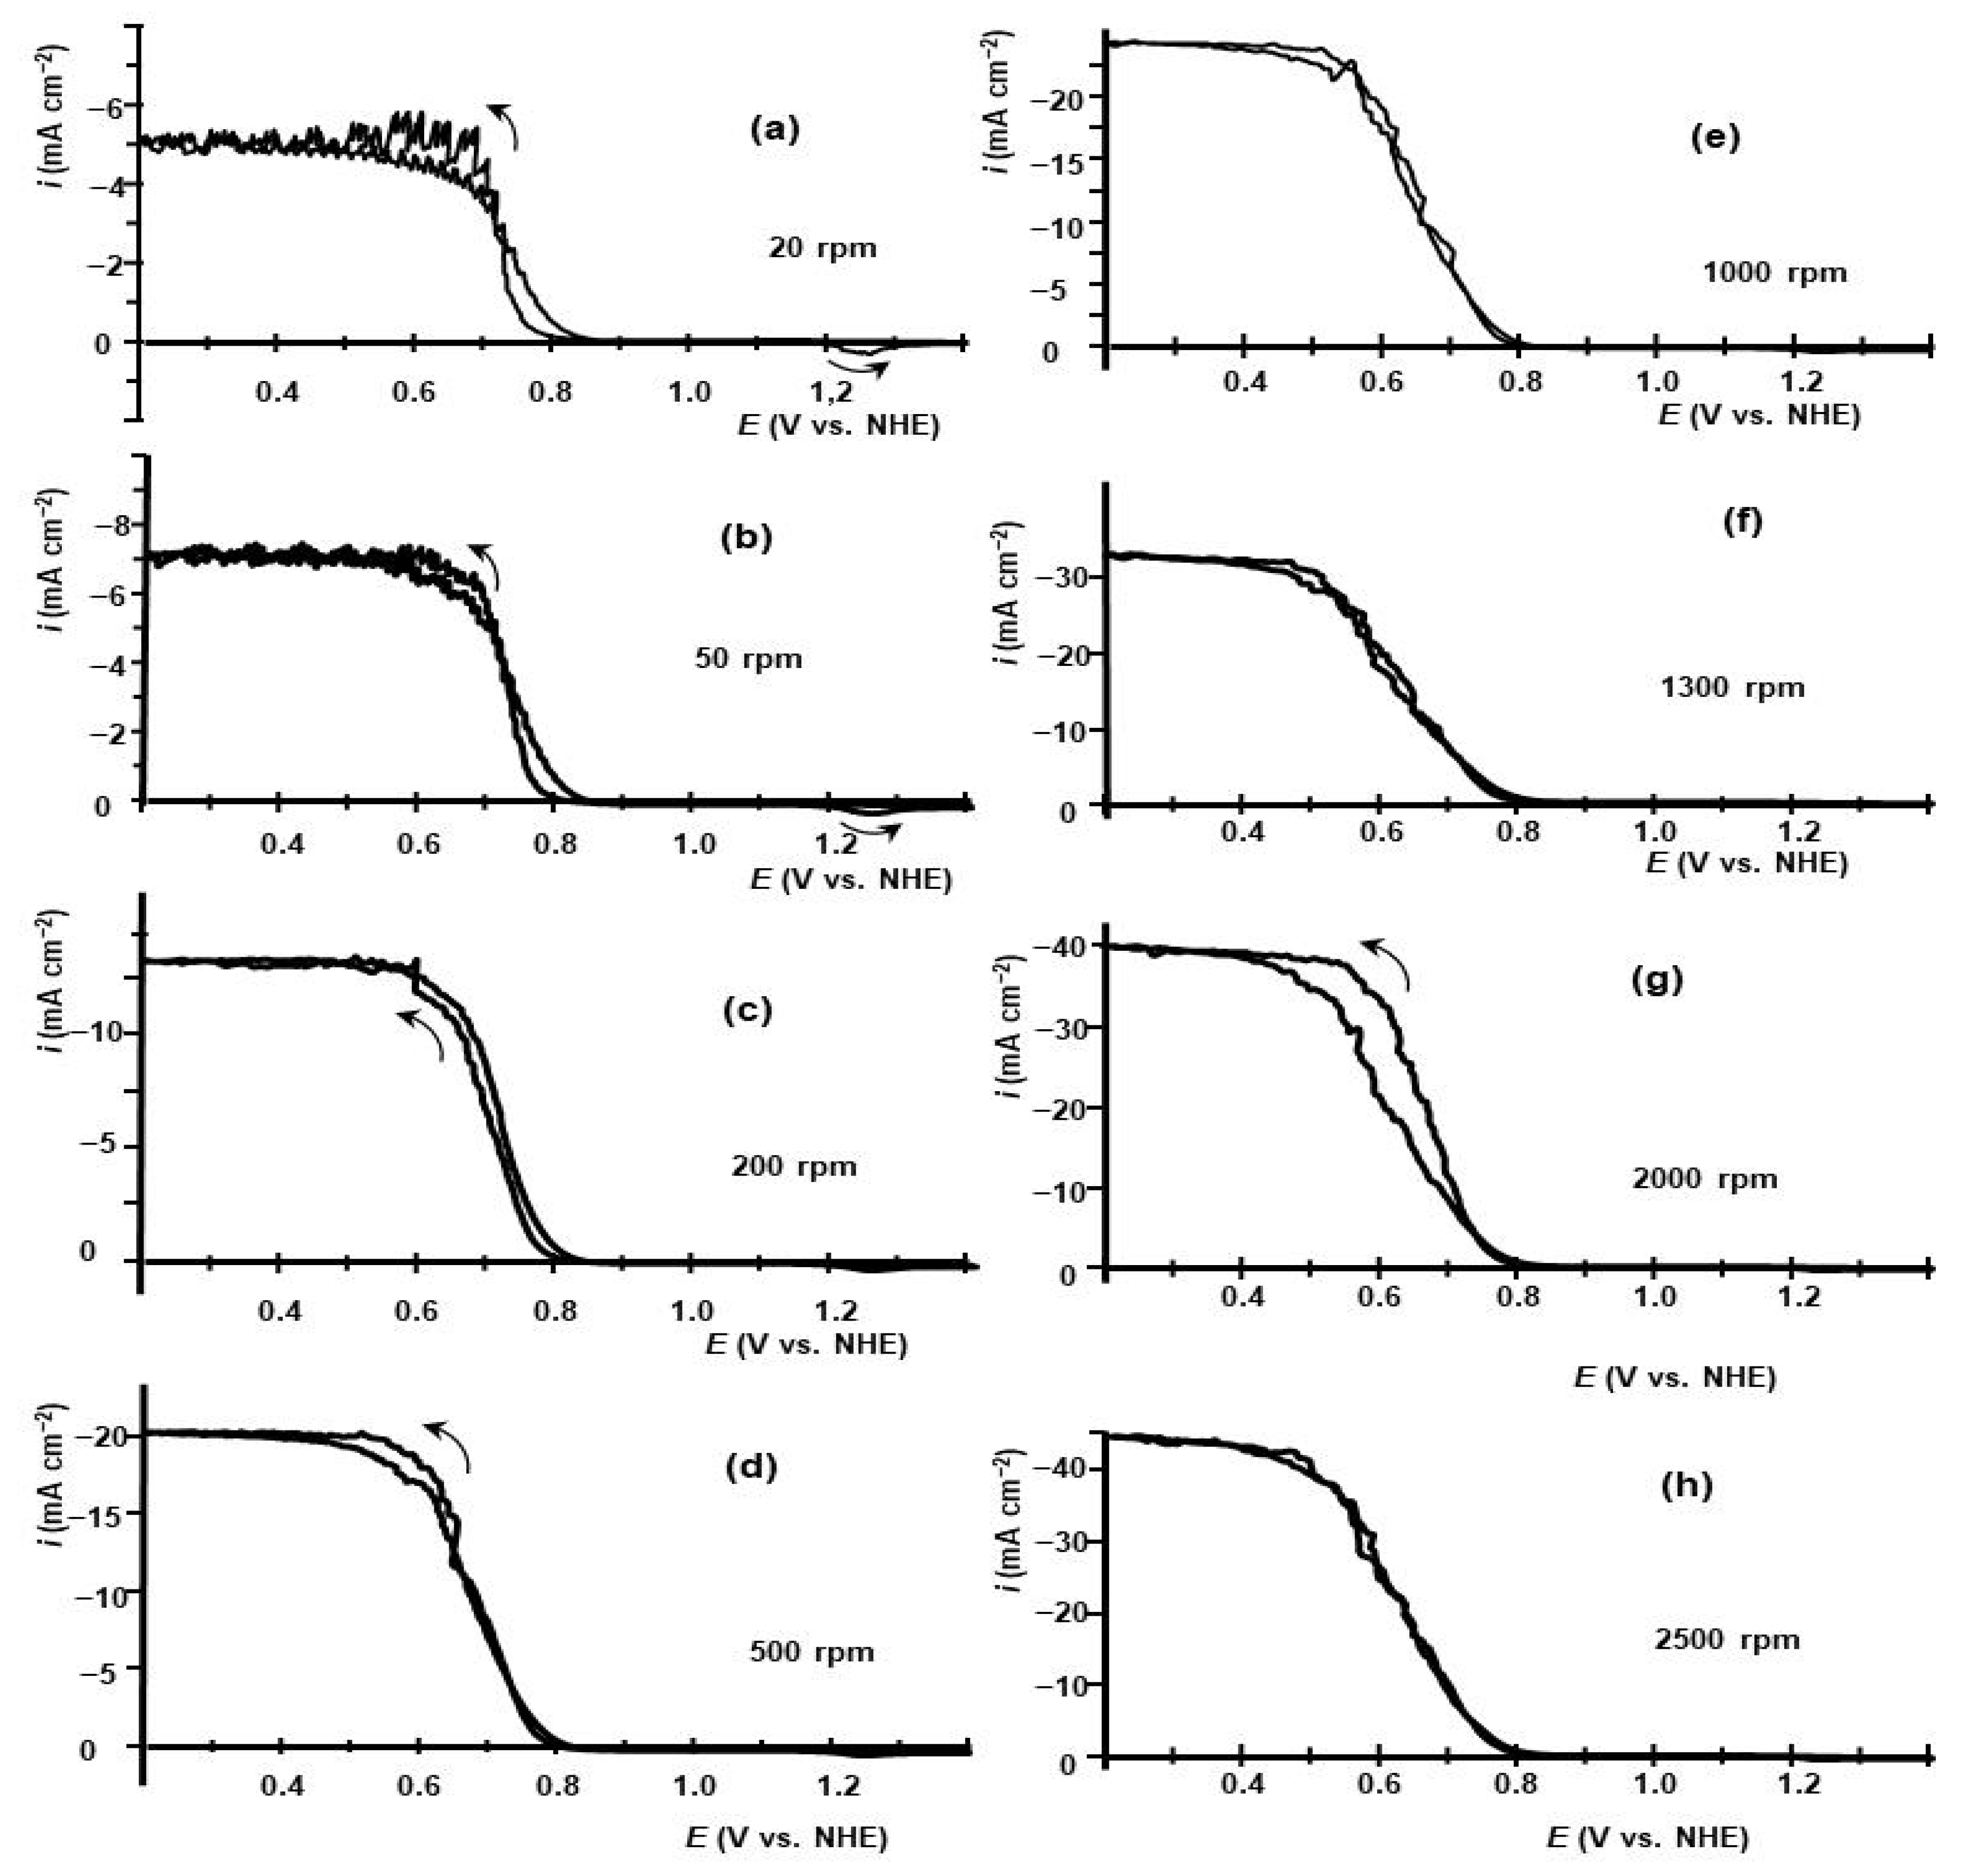
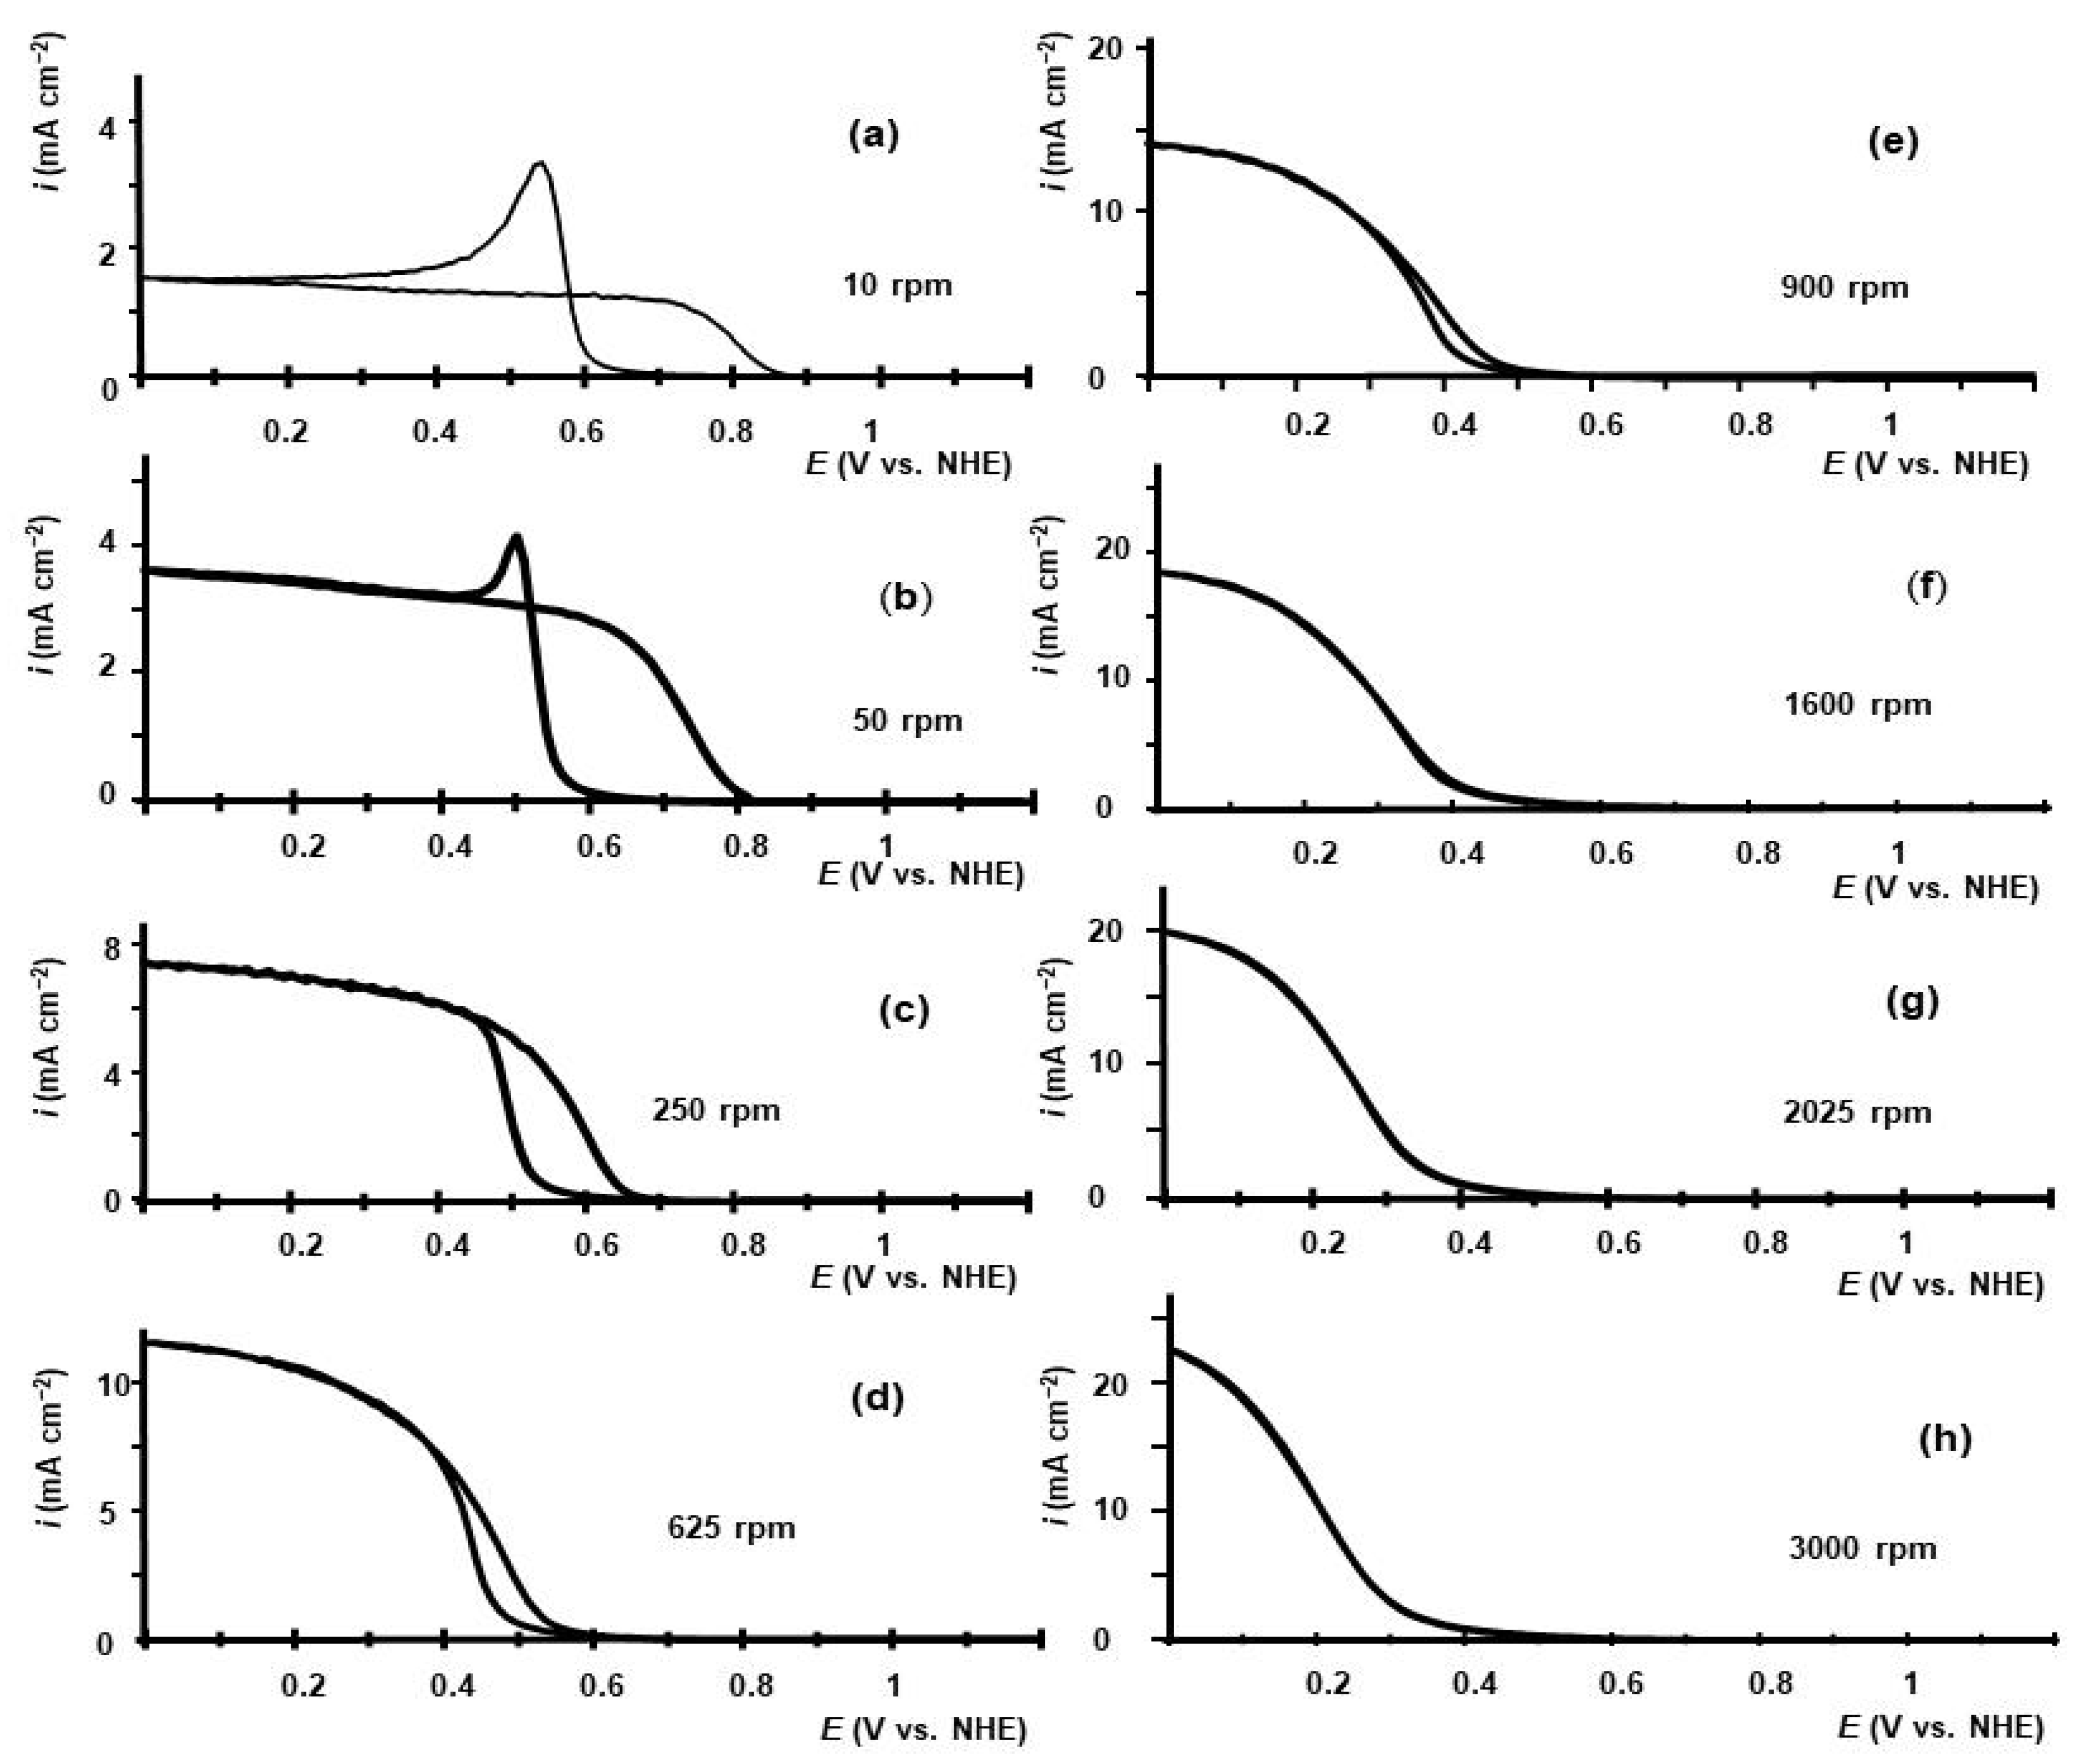
2.1. Voltammetry of HIO3 Reduction on GC RDE in Aqueous Electrolyte

Figure 1 displays some of the voltammetry curves for iodic acid reduction that were measured at GC RDE.
The measurements were performed at room temperature in 0.5 M H2SO4 aqueous electrolyte with RDE rotation rates in the range of 10 to 3000 rpm. The voltammetry scans were started at E = 1.6 V to decrease potentials. At E = 0.0 V, the scans were reversed. At potentials E > 1.2 V, the currents were too low. For this reason, only fractions of voltammetry curves between E = 0 V and E = 1.2 V are shown. Figure 1 indicates that on forward potential scans, the current surges to a plateau value at a threshold potential. On the backward scans, the reduction current decreases to nearly zero after reaching another threshold potential. Hysteresis of the voltammetry curves, which depends on the RDE rotation rate, attracts attention. At low RDE rotation rates, such as 400 rpm or lower, a reduction current emerges at E = 0.65–0.7 V. At lower potentials, the current reaches a plateau value. The potential for current onset is close to the equilibrium potential of iodine reduction to iodide by reaction (4), assuming the formation of solid iodine and taking into account that the concentration of iodide in the cell can hardly exceed the bulk concentration of iodide acid—0.01 M. The solubility of iodine in aqueous electrolytes (~1.2 mM) [28] is lower than the concentration of iodic acid in our experiments. For this reason, the assumption that iodine will be deposited on the electrode and a thin layer of solid iodine (I2 (s)) will be formed on it is reasonable.
The curves recorded at high RDE rotation rates, 900 rpm and higher, on scans to E = 0 V demonstrate another peculiar feature: the current remains low until a very sharp increase occurs at potentials substantially lower than 0.6 V. At 3000 rpm, the reduction current density sharply increases at E~0.1 V and immediately reaches a plateau value, as shown in Figure 1h. The reverse scan shows that iodic acid reduction persists at potentials higher than 0.6 V. At these potentials, the reduction of iodine is impossible, preventing the operation of the iodate reduction cycle consisting of reactions (4) and (5). At low RDE rotation rates, this feature of voltammetry becomes more noticeable. At 10 rpm, the reduction current vanishes at E~0.85 V, Figure 1a.
To account for the unusual behavior of voltammetry, formations of solid iodine layer and dissolved hypoiodous acid (IOH) must be taken into account in the formulation of the iodic acid reduction mechanism. The participation of a thin layer of solid iodine I2 (s) on the electrode surface rather than dissolved iodine (I2 (el)) in the reaction cycle in terms of work [24] means that zd/zk >> 1. In this case, the values of the plateau current are expected to approach the values calculated by the Levich Equation (12). The dependence of the plateau current on the RDE rotation rate measured in 0.01 M HIO3–0.5 M H2SO4 is shown in Figure 2a.
It mostly follows Levich’s dependence, Equation (12), of the convection–diffusion limited current (ilim) on the RDE rotation rate. The dependence of the convection–diffusion limited current calculated by Equation (12) is shown as a dashed line (1) in Figure 2a. To calculate it, the values of the iodate diffusion coefficient D = 1.1 10−5 cm2 s−1 [29] and the kinematic viscosity of aqueous 0.5 M H2SO4 ν = 1.08 cSt [30] were used. The number of electrons n = 6, Faraday constant, and concentration of iodic acid C = 10 mM were used in calculations of convection–diffusion limited current density. With an increase in the RDE rotation rate, the difference between experimental and calculated current density values also increases. At 10 rpm, the experimental current density is lower than the calculated current density by approximately 11%, while the deviation is approximately 26% at 3000 rpm.
The dependence of the plateau current density measured at GC RDE in 0.05 M HIO3–1 M H2SO4 electrolyte is shown in Figure 2b. A five-fold increase in HIO3 concentration resulted in a 4.5-fold increase in the slope of the linear trend line. At 10 rpm, the experimental current density is lower than the calculated current density by ~40%, while the deviation at 3000 rpm is ~32%.
The sharp change in current on forward potential scans towards E = 0 V at high RDE rotation rates is attributed to the formation of a thin layer of iodine on the electrode. Because of its low thickness, the formation of a layer of solid iodine does not prevent electrochemical reactions at the electrode. Indeed, the formation of the iodine layer during electrochemical oxidation of iodide on a GC electrode has been observed in many works, e.g., [31,32,33]. Diffusion of I or I3 through the iodine layer towards the electrode increases the charge transfer resistance in transformations iodide ↔ iodine. In the iodic acid reduction process at plateau potentials, the current density is limited by the kinetics of slow stages of the comproportination reaction and convective diffusion.
When forward scans are performed, an iodine layer is formed when the rate of potential-dependent electrochemical reduction of HIO3 to dissolved iodine (reaction (3)) exceeds the rate of removal of dissolved iodine from the electrode by diffusion through the diffusion layer. Electrochemical reduction is independent of potential, while the thickness of the diffusion layer on RDE decreases with an increase in ω. As the rotation rate increases, reaction (3) must require greater overvoltage to reach and overcome the saturation concentration of iodine and create a layer of iodine on the electrode. Charge, corresponding to peaks on voltammetry in Figure 1a at 10 rpm and Figure 1b at 50 rpm, can be attributed to the nucleation and formation of a thin iodine layer on the RDE surface. The calculated charge corresponds to the formation of a 10–30 nm thick dense iodine layer, assuming a 5-electron reduction. The thickness of the iodine layer on the electrode surface remains constant over time due to its role as a catalyst and intermediate compound. On reversed scans from E = 0 V to E = 1.6 V, at RDE rotation rates of 1600 rpm and lower, the reduction of iodine does not fall to zero at E~0.65 V. This effect is more pronounced at low rotation rates. At an RDE rotation rate of 10 rpm, the current vanishes at E ~ 0.85 V, as shown in Figure 1a. Apparently, at E > 0.65 V, the main reduction product of iodic acid is iodine, which is formed mostly in electrolytes in the vicinity of the electrode by the overall reaction (3). In contrast to the reduction of iodic acid during the forward scan to E = 0 V, during the reverse scan, there is a layer of iodine on the electrode, and iodic acid is also present in the diffusion layer. It makes the formation of metastable hypoiodic acid possible by comproportination reaction (8) [34]. The equilibrium constant for this reaction is ~6 10−8 [35]. Hypoiodic acid can be electrochemically reduced to dissolved iodine by reaction [34]:
2HOI + 2H+ +2ē → I2 +2H2O     E0 = 1.354 V.
It is worth mentioning that iodide, which is formed by the reduction of iodic acid on the electrode, is converted to dissolved iodine and solid iodine in the bulk electrolyte by reaction (5). It is a well-known fact [6,7,9,12,18] that the rate of iodic acid reduction is accelerated by the accumulation of iodine in the electrolyte. To avoid the influence of dissolved iodine on voltammetry of iodic acid reduction, the electrolytes in the cell were completely replaced by fresh electrolytes after recording only two voltammetry curves.

2.2. Hypoiodic Acid

To prove the involvement of hypoiodic acid in the electrochemical reduction of iodic acid, we recorded voltammetry on GC RDE in aqueous 0.01 M HIO3–0.5 M H2SO4 saturated with iodine. The bottom of the cell remained covered with crystalline iodine during the experiments. The formation of hypoiodic acid by reaction (8) occurs in HIO3 electrolytes saturated with iodine. The voltammetry curves are shown in Figure 3. The hysteresis of voltammetry curves in Figure 3 is less pronounced compared with the curves measured in 0.01 M HIO3–0.5 M H2SO4, Figure 1. In the presence of iodine in 0.1 M HIO3–0.5 M H2SO4, the onset of reduction current is virtually the same for all curves ~0.85–0.9 V. The reduction current that flows in the potential range of 0.9–0.6 V can be ascribed to the reduction of hypoiodic acid to iodine by reaction (14). It is followed by a comproportionation reaction of iodine and iodic acid in the electrolyte in the electrode vicinity to reproduce the dissolved hyperiodic acid reaction (8).
To prove the participation of hypoiodic acid in the electrochemical reduction of iodic acid, we recorded voltammetry on GC RDE in aqueous 0.01 M HIO3–0.5 M H2SO4 saturated with iodine. The iodine crystals remained on the bottom of the cell during the experiments. In HIO3 electrolytes saturated with iodine, hypoiodic acid, formed by reaction (8), is also present. The voltammetry curves are shown in Figure 3. Because in the potential region of 1.4 V < E < 1.6 V, the currents were low, this fraction of voltammetry curves is omitted. The hysteresis of the voltammetry curves in Figure 3 is less pronounced compared with curves measured in 0.01 M HIO3–0.5 M H2SO4, Figure 1. In the presence of iodine in 0.1 M HIO3–0.5 M H2SO4, the onset of the reduction current is virtually the same for all curves ~0.85–0.9 V. The reduction current that flows in the potential range 0.9–0.6 V can be ascribed to the reduction of hypoiodic acid to iodine by reaction (14), followed by the comproportionation reaction of iodine and iodic acid in the electrolyte in the electrode vicinity to reproduce dissolved hyperiodic acid, reaction (8).
In this case, hypoiodic acid acts as a catalyst and intermediate compound in the sequence of these reactions, the voltammetry of which generally follows the EC″ mechanism [24]. Because the comproportination reaction occurs mostly in the electrolyte, the thickness of the reaction layer, in this case, can be comparable to or even higher than the thickness of the diffusion layer. At potentials below 0.6 V, 5-electron reduction to iodide is replaced by a 6-electron reduction process to iodide. The dependence of plateau current on GC RDE in 0.01 M HIO3–0.5 M H2SO4 saturated with iodine on RDE rotation rate is shown in Figure 2a. The current density at plateau potentials, namely, at E = 0.2 V, remains virtually unchanged by the presence of iodine dissolved in the electrolyte.
There is a small peak of oxidation current at E > 1.1 V on the reverse potential scans. This feature is not present on forward scans. It was shown in ref. [13] that in the hydrogen/iodate flow cell, electrochemical transformations in the sequence iodide–iodine–iodate can be conducted in both directions. Apparently, the oxidation process at E > 1.1 V corresponds to the oxidation of iodine to iodic acid. The iodine, which is oxidized under these conditions, apparently originates from the porous iodine layer, which was formed at lower potentials. The charge corresponding to this process on voltammetry is incomparably lower than the charge related to reduction processes that took place at E < 0.8 V. It is suggested that reduction products are predominantly moved in the bulk electrolyte, where they are converted into solid iodine through comproportination reactions with iodic acid.

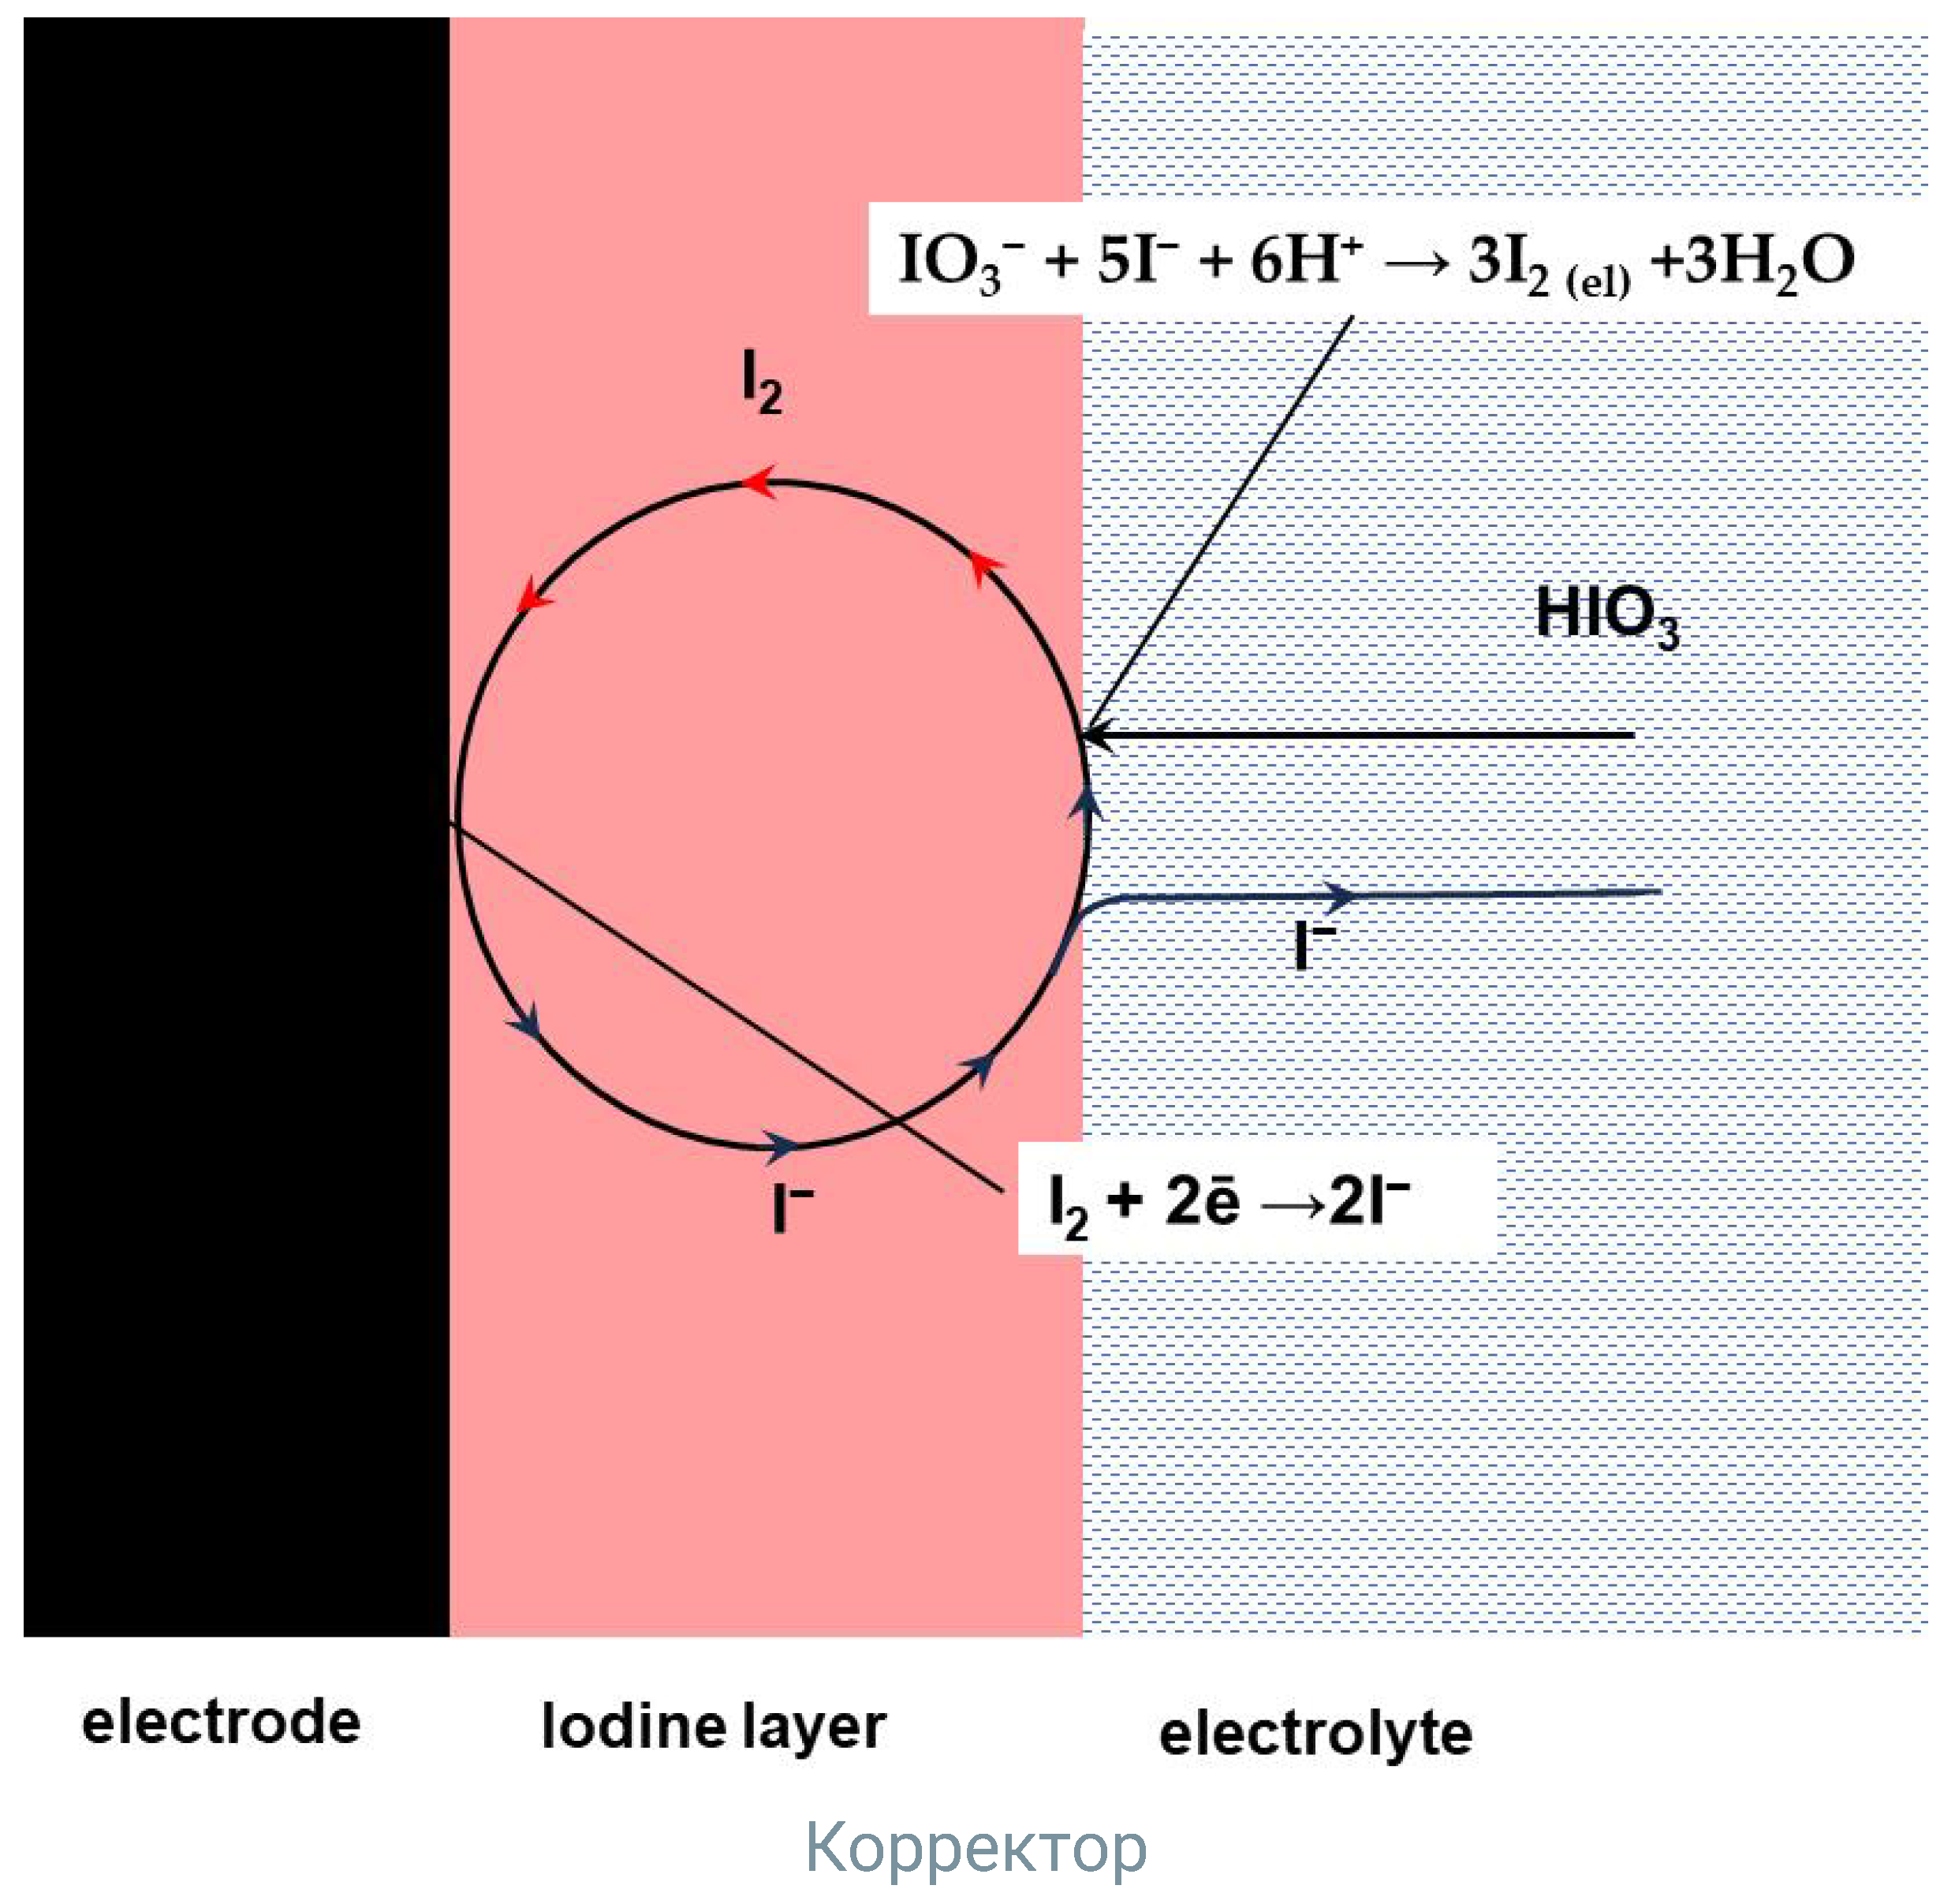
2.3. Iodine Layer on GC Electrode

The hysteresis of voltammetry for iodic acid reduction and the sharp changes in voltammetry curves at certain potentials, Figure 1a,b, are attributable to the nucleation and formation of a thin, dense iodine layer on the GC electrode surface. The main Faradaic reaction in iodic acid reduction is the reduction of iodine, which is mostly contained in this thin solid layer. The existence of this layer on the electrode is partly due to the low solubility of iodine in aqueous electrolytes. The presence of this layer at potentials lower than the equilibrium potential of the iodide/iodine pair, E < 0.65V, is a result of the balance between the production of iodine on the electrode and its removal from the electrode surface. Solid iodine is produced by the comproportionation reaction of I with HIO3. Iodine is removed from the layer by electrochemical reduction to iodide and by iodine dissolution via diffusion through the diffusion layer formed on RDE. The rate of iodine dissolution depends on the thickness of the diffusion layer and the solubility of iodine in the electrolyte. We increased the dissolution rate of the iodine layer by replacing water in the electrolyte with an ethanol–water w/w 50% mixture (EtOH-W). This increased the solubility of iodine from 0.03 mass% to 4.3%, or 0.15 M [28]. The rate of iodine layer dissolution in aqueous electrolytes is very low due to the low solubility of iodine. However, in EtOH-W-based electrolytes, the dissolution rate can be high enough to influence the coverage of the surface of the electrode by the iodine layer or even the presence of the layer. Assuming that the concentration of iodine in the electrolyte at the interface of the iodine layer and the electrolyte is equal to the saturation concentration, replacing the water in the electrolyte by EtOH–W increases the rate of iodine layer dissolution by a factor of 4.3/0.03~140. The kinematic viscosity of EtOH–H2O (1:1) is higher than that of water by a factor of only 2.6 [36]. Regarding the dissolution rate of the iodine layer, the change in diffusion coefficient due to changes in viscosity is negligible compared with the change in the saturation concentration of iodine at the interface. Some voltammetry curves measured in 0.01 M HIO3–0.5 M H2SO4 EtOH–W are shown in Figure 4. The dependence of iodic acid reduction current measured at E = 0.2 V in 0.01 M HIO3–0.5 M H2SO4 EtOH-W is shown in Figure 2a.
The voltammetry curves measured at RDE in 0.01 M HIO3-0.5 M H2SO4 EtOH-W at rotation rates of 10 rpm and 50 rpm in Figure 4a,b are similar to curves measured in aqueous electrolyte, Figure 1a,b, although plateau currents are roughly two times lower. The decrease in plateau current densities in water–ethanol electrolytes generally agrees with the change in the iodine diffusion coefficient caused by viscosity changes, as indicated in Equation (12).
The voltammetry curves measured at RDE in 0.01 M HIO3-0.5 M H2SO4 EtOH-W at high rotation rates of 900 rpm–3000 rpm are shown in Figure 4e–h. These curves differ from the curves measured in the same range of rotation rates in aqueous 0.01 M HIO3–0.5 M H2SO4, Figure 1e–h.
There is no hysteresis of voltammetry in 0.01 M HIO3-0.5 M H2SO4 EtOH-W at high rotation rates. The increase in RDE rotation rates shifts the voltammetry curves to lower potentials. At 2025 and 3000 rpm, as shown in Figure 4g,h, the plateau in current density has not been reached at all. This causes a decrease in the current density measured at E = 0.2 V with an increase in rotation rate, as shown in Figure 2a.
Based on these observations, we conclude that in 0.01 M HIO3-0.5 M H2SO4 EtOH-W, the reduction of iodic acid proceeds through the formation of a thin iodine layer on the GC electrode, with coverage dependent on the RDE rotation rate. As the rotation rate of RDE increases, the coverage at a given electrode potential decreases, and the reduction current decreases.
The simplified scheme of the HIO3 reduction by an autocatalytic process involving a thin layer of iodine on the electrode surface is shown in Figure 5.
The iodine dissolved in electrolytes does not play a significant role in the electrochemical reduction of iodic acid in the EtOH-W electrolyte. Otherwise, the voltammetry curves measured at different rotation rates should be of similar shape and have the same onset potential, as in Figure 2a in reference [28].

3. Materials and Methods

HIO3 99.9% (Chemcraft, Kaliningrad, Russia), crystalline iodine (99.5%) (MiniMed, Bryansk, Russia), H2SO4 95% special purity grade (ChemExpress, Moscow, Russia), and deionized water (6 MOhm cm) were used to prepare electrolytes.
Electrochemical measurements were performed at room temperature using an Autolab PGSTAT302N potentiostat/galvanostat. A glassy carbon rotating disk electrode of 5 mm diameter, an AFMSRX Rotator, and a three-electrode cell (volume 200 mL), all from Pine Research Instrumentation (Durham, NC, USA), were used in the experiments. A Pt wire and Ag/AgCl-KCl-saturated reference electrode were used as counter and reference electrodes, respectively. The potential of the Ag/AgCl-KCl-saturated reference electrode is 199 mV vs. the normal hydrogen electrode (NHE). The potential readings throughout the article are given versus NHE. The compartments of counter and reference electrodes were separated from the compartment of the working electrode by glass frits. Prior to recording each voltammetry curve, the working electrode was rinsed with ethanol, repolished with 0.05 μm alumina slurry, and rinsed with deionized water. The electrolyte in the cell was continuously purged with high-purity Ar (99.999%) to remove oxygen. In experiments with iodine-free electrolytes, Figure 1 and Figure 4, the electrolyte in the cell was replaced after recording only two consecutive voltammetry curves. Otherwise, iodine and hypoiodic acid, which were produced in the bulk electrolyte by the comproportination reactions with iodic acid (5) and (8), influenced the recorded voltammetry curves.

4. Conclusions

Based on RDE studies with a GC electrode in H2SO4 electrolytes, the basic features of the electrochemical reduction of iodic acid to iodide are established.
It is shown that the 6-electron reduction of iodic acid to iodide starts at potentials close to the equilibrium potential of the iodine/iodide redox couple. On the other hand, the oxidation of iodide to iodic acid proceeds at potentials close to the thermodynamic potentials of the iodate/iodide couple, E0 = 1.085 V. The potential differences cause a voltage loss of ~0.6 V during the cycle of reducing iodic acid to iodide and oxidizing iodide to iodic acid. However, in the presence of iodine in the electrolyte, as it is expected to be in the real environment of a flow cell, this voltage loss is decreased to 0.4 V and less by successive reduction/oxidation processes in the sequence iodide ↔ iodine ↔ iodic acid.
The rate of electrochemical reduction of iodic acid to iodide on the RDE rotation rate seemingly follows the Levich equation for convection–diffusion limited reduction. The deviations in the dependence of reduction current on rotation rate from the Levich plot are attributed to the complicated kinetics of autocatalyzed reduction of iodic acid. The deviations of current density from calculations by the Levich equation depend on the RDE rotation rate and reach 40%.
Based on the experiments with RDE, it has been shown that the reduction of iodic acid to iodide proceeds at a high rate only if an iodine layer is present on the surface of the GC electrode. In the electroreduction of iodic acid, the iodine layer functions as both an intermediate compound and catalyst.
In the presence of dissolved iodine in the electrolyte, an additional autocatalytic reaction cycle is engaged, which results in the reduction of iodic acid to iodine by a 5-electron process. The reduction starts at E~0.95 V. Hypoiodic acid acts as an intermediate compound and a catalyst in this reaction cycle. At potentials below 0.6 V, the 5-electron reduction to iodine is replaced by a 6-electron reduction process to iodide.

Author Contributions

L.A., A.R. and G.S. performed most of the experiments and collected and analyzed data. O.T. and R.P. devised the experiment and validated the concept. A.A., V.A. and A.M. designed the study and supervised the project. All authors contributed to the general discussion and co-wrote the manuscript. All authors have read and agreed to the published version of the manuscript.

Funding

The study was supported by the Russian Science Foundation grant (project № 21-73-30029; reference to the project information: https://www.rscf.ru/project/21-73-30029/ (accessed on 8 July 2024)).

Data Availability Statement

Data presented in this article is available in the main manuscript at reasonable request from the corresponding author.

Conflicts of Interest

The authors declare no conflicts of interest. The funders had no role in the design of the study, in the collection, analyses, or interpretation of data, in the writing of the manuscript, or in the decision to publish the results.

References

  1. Tolmachev, Y.V.; Piatkivskyi, A.; Ryzhov, V.V.; Konev, D.V.; Vorotyntsev, M.A. Energy cycle based on a high specific energy aqueous flow battery and its potential use for fully electric vehicles and for direct solar-to-chemical energy conversion. J. Solid State Electr. 2015, 19, 2711–2722. [Google Scholar] [CrossRef]
  2. Konev, D.V.; Istakova, O.I.; Ruban, E.A.; Glazkov, A.T.; Vorotyntsev, M.A. Hydrogen-chlorate electric power source: Feasibility of the device, discharge characteristics and modes of operation. Molecules 2022, 27, 5638. [Google Scholar] [CrossRef]
  3. Modestov, A.D.; Konev, D.V.; Tripachev, O.V.; Antipov, A.E.; Tolmachev, Y.V. A hydrogen–bromate flow battery for air-deficient environments. Energy Technol. 2018, 6, 242–245. [Google Scholar] [CrossRef]
  4. Vanysek, P. Electrochemical series. In CRC Handbook of Chemistry and Physics, 95th ed.; Haynes, W.M., Ed.; CRC PRESS: Boca Raton, FL, USA, 2014; pp. 5–80. [Google Scholar]
  5. Anson, F.C.; Lingane, J.J. Anodic chronopotentiometry with platinum and gold electrodes. The iodide-iodine-iodate system. J. Am. Chem. Soc. 1957, 79, 1015–1020. [Google Scholar] [CrossRef]
  6. Badea, G.E. Autocatalytic reduction of iodate at the platinum electrode in 0.5 M H2SO4 solutions. Rev. Roum. Chim. 2007, 52, 491–498. [Google Scholar]
  7. Beran, P.; Bruckenstein, S. Voltammetry of iodine (I) chloride, iodine, and iodate at rotated platinum disk and ring disk electrodes. Anal. Chem. 1968, 40, 1044–1051. [Google Scholar] [CrossRef]
  8. Chen, Y.; Zhang, H.; Wu, B. Determination of the adsorbed intermediate of iodide electro-oxidation on a platinum electrode by rotating disk electrode potential step coulometry (RDE-PSC). J. Electroanal. Chem. 1992, 335, 321–326. [Google Scholar] [CrossRef]
  9. Desideri, P.G. Reduction of iodate in sulphuric medium I. The reduction mechanism. J. Electroanal. Chem. 1965, 9, 218–228. [Google Scholar]
  10. Desideri, P.G. Electrochemical behaviour of iodate in hydrochloric acid solutions. J. Electroanal. Chem. 1968, 17, 129–136. [Google Scholar] [CrossRef]
  11. Grgur, B.N.; Gvozdenovic, M.M.; Stevanovic, J.S.; Jugovic, B.Z.; Trisovic, L.T. Electrochemical oxidation of iodide in aqueous solution. Chem. Eng. J. 2006, 124, 47–54. [Google Scholar] [CrossRef]
  12. Wels, B.R.; Austin-Harrison, D.S.; Johnson, D.C. Electrocatalytic reduction of iodate at platinum electrodes in 0.5 M H2SO4. Langmuir 1991, 7, 559–566. [Google Scholar] [CrossRef]
  13. Modestov, A.; Andreev, V.; Antipov, A.; Petrov, M.M. Aluminum/bromate and aluminum/iodate mechanically rechargeable batteries. Batteries 2022, 8, 270. [Google Scholar] [CrossRef]
  14. Jones, J.L.; Arranaga, A.B. A New zinc-lodate primary battery. J. Electrochem. Soc. 1958, 105, 435–439. [Google Scholar] [CrossRef]
  15. Modestov, A.; Andreev, V.; Antipov, A. Novel aqueous zinc–halogenate flow batteries as an offspring of zinc–air fuel cells for use in oxygen-deficient environment. Energy Technol. 2021, 9, 2100233. [Google Scholar] [CrossRef]
  16. Ma, W.; Liu, T.; Xu, C.; Lei, C.; Jiang, P.; He, X.; Liang, X. A twelve-electron conversion iodine cathode enabled by interhalogen chemistry in aqueous solution. Nat. Commun. 2023, 14, 5508. [Google Scholar] [CrossRef]
  17. Xie, C.; Wang, C.; Xu, Y.; Li, T.; Fu, Q.; Li, X. Reversible Multielectron Transfer I−/IO3− Cathode Enabled by a Hetero-Halogen Electrolyte for High-Energy-Density Aqueous Batteries. Nat. Energy 2024, 9, 714–724. [Google Scholar] [CrossRef]
  18. Vetter, K.J. Electrochemical Kinetics. In Theoretical and Experimental Aspects; Academic Press: New York, NY, USA, 1967; pp. 471–477. [Google Scholar]
  19. Schmitz, G. Kinetics and mechanism of the iodate–iodide reaction and other related reactions. Phys. Chem. Chem. Phys. 1999, 1, 1909–1914. [Google Scholar] [CrossRef]
  20. Perrin, D.D. Dissociation Constants of Organic Bases in Aqueous Solution; Butterworth & Co., Ltd.: London, UK, 1965; pp. 111–200. [Google Scholar]
  21. Spitz, R.D.; Liefbafsky, H.A. The Iodate-Iodine Electrode Mechanism, Standard Potentials, Related Thermodynamic Data. J. Electrochem. Soc. 1975, 122, 363–367. [Google Scholar] [CrossRef]
  22. Bichsel, Y.; Von Gunten, U. Hypoiodous acid: Kinetics of the buffer-catalyzed disproportionation. Wat. Res. 2000, 34, 3197–3203. [Google Scholar] [CrossRef]
  23. Myers, O.E.; Kennedy, J.W. The kinetics of iodine-iodate isotopic exchange reaction. J. Am. Chem. Soc. 1950, 72, 897–906. [Google Scholar] [CrossRef]
  24. Vorotyntsev, M.A.; Antipov, A.E.; Konev, D.V. Bromate anion reduction: Novel autocatalytic (EC″) mechanism of electrochemical processes. Its implication for redox flow batteries of high energy and power densities. Pure Appl. Chem. 2017, 89, 0306. [Google Scholar] [CrossRef]
  25. Mastragostino, M.; Gramellini, C. Kinetic study of the electrochemical processes of the bromine/bromide aqueous system on vitreous carbon electrodes. Electrochim. Acta 1985, 30, 373–380. [Google Scholar] [CrossRef]
  26. Modestov, A.D.; Konev, D.V.; Antipov, A.E.; Petrov, M.M.; Pichugov, R.D.; Vorotyntsev, M.A. Bromate electroreduction from sulfuric acid solution at rotating disk electrode: Experimental study. Electrochim. Acta 2018, 259, 655–663. [Google Scholar] [CrossRef]
  27. Faulkner, L.R.; Bard, A.J. Electrochemical Methods: Fundamentals and Applications, 2nd ed.; Wiley and Sons: New York, NY, USA, 2001; p. 339. [Google Scholar]
  28. Varlamova, T.M.; Rubtsova, E.M.; Mushtakova, S.P. Solubility Diagrams of the Potassium Iodide–Water–Ethanol and Iodine–Water–Ethanol Ternary Systems. Rus. J. Phys. Chem. A 2009, 83, 1896–1899. [Google Scholar] [CrossRef]
  29. Bunerjee, P.; Bagchi, B. Ions’ motion in water. J. Chem. Phys. 2019, 150, 190901. [Google Scholar] [CrossRef]
  30. Joshi, B.K.; Kandapal, N.D. Volumetric and transport properties of aqueous sulphuric acid. Phys. Chem. Liq. 2007, 45, 463–470. [Google Scholar] [CrossRef]
  31. Bejerano, T.; Gileadi, E. Formation of thick layers of iodine during the anodic oxidation of iodide on a RDE Part I. The precipitation-dissolution mechanism. J. Electroanal. Chem. 1977, 82, 209—225. [Google Scholar] [CrossRef]
  32. Bejerano, T.; Gileadi, E. Formation of Thick Layers of Iodine During the Anodic Oxidation of Iodide on a RDE. II. Open-Circuit Behavior. J. Electrochem. Soc. 1977, 124, 1720–1723. [Google Scholar] [CrossRef]
  33. Jang, W.J.; Cha, J.S.; Kim, H.; Yang, J.H. Effect of an iodine film on charge-transfer resistance during the electro-oxidation of iodide in redox flow batteries. ACS Appl. Mater. Inter. 2021, 13, 6385−6393. [Google Scholar] [CrossRef]
  34. Sorti, L.; Vitulano, F.; Cappellini, E.; Uggeri, F.; Morelli, C.F.; Sello, G.; Minguzzi, A.; Vertova, A. Electrochemical iodination through the in situ generation of iodinating agents: A promising green approach. Molecules 2023, 28, 5555. [Google Scholar] [CrossRef]
  35. Allen, T.L.; Keeper, R.M. The formation of hypoiodous acid and hydrated iodine cation by the hydrolysis of iodine. J. Am. Chem. Soc. 1955, 77, 2957–2960. [Google Scholar] [CrossRef]
  36. Khattab, S.K.; Bandarkar, F.; Fakhree, M.A.A.; Jouyban, A. Density, viscosity, and surface tension of water+ethanol mixtures from 293 to 323 K. Korean J. Chem. Eng. 2012, 29, 812–817. [Google Scholar] [CrossRef]
Figure 1. Dependence of current density on GC RDE potential in 0.01 M HIO3-0.5 M H2SO4 electrolytes measured at different rotation rates: (a)—10 rpm; (b)—50 rpm; (c)—225 rpm; (d)—400 rpm; (e)—900 rpm; (f)—1600 rpm; (g)—2025 rpm; (h)—3000 rpm. Potential scan rate—10 mV s−1. Potential scans were initiated at E = 1.6 V toward E = 0 V; at E = 0 V, the scans were reversed.
Catalysts 14 00437 g001
Figure 2. Dependence of the plateau current density measured at E = 0.2 V on the RDE rotation rate. (a)—0.01 M HIO3–0.5 M H2SO4: (1)—calculated by Levich equation; ●—0.01 M HIO3–0.5 M H2SO4 experiment; x—0.01 M HIO3–0.5 M H2SO4—I2 saturated; ○—0.01 M HIO3–0.5 M H2SO4 in H2O-C2H5OH (1:1). (b)—measurements in 0.05 M HIO3–1 M H2SO4: (1)—calculated by Levich equation ●—experiment.
Catalysts 14 00437 g002
Figure 3. Voltammetry at GC RDE measured in 0.01 M HIO3-0.5 M H2SO4 saturated with iodine measured at different rotation rates: (a)—20 rpm; (b)—50 rpm; (c)—200 rpm; (d)—500 rpm; (e)—1000 rpm; (f)—1300 rpm; (g)—2000 rpm; (h)—2500 rpm. Potential scan rate—10 mV s−1. The RDE rotation rate in rpm is indicated in the respective diagrams. Potential scans were initiated at E = 1.6 V toward E = 0.2 V; at E = 0.2 V, the scans were reversed.
Catalysts 14 00437 g003
Figure 4. Dependence of current density on GC RDE potential in 0.01 M HIO3-0.5 M H2SO4 ethanol–water (w/w 50%) electrolytes measured at different rotation rates: (a)—10 rpm; (b)—50 rpm; (c)—250 rpm; (d)—625 rpm; (e)—900 rpm; (f)—1600 rpm; (g)—2025 rpm; (h)—3000 rpm. Potential scan rate—10 mV s−1. The RDE rotation rate in rpm is indicated in the respective diagrams. Scans were initiated at E = 1.6 V toward E = 0 V; at E = 0 V, the scans were reversed.
Catalysts 14 00437 g004
Figure 5. Simplified scheme of HIO3 electrochemical reduction to iodide in acidic electrolytes at GC electrode. The scheme underlines the important role of the iodine layer in the autocatalytic cycle.
Catalysts 14 00437 g005
Disclaimer/Publisher’s Note: The statements, opinions and data contained in all publications are solely those of the individual author(s) and contributor(s) and not of MDPI and/or the editor(s). MDPI and/or the editor(s) disclaim responsibility for any injury to people or property resulting from any ideas, methods, instructions or products referred to in the content.

