Abstract
WO3 nanoflowers were synthesized via anodization and subsequently calcined in air at different temperatures (200–700 °C) to evaluate their photocatalytic activity. The samples were characterized in terms of their morphological, crystallite, and optical properties. Anodization produced WO3 hydrate with a layer thickness of ~1.2 µm, which was transformed into WO3 after heating. All samples exhibited monoclinic phase, with Raman shift intensity increasing with the calcination temperature. Some residual WO3·H2O was detected at certain temperatures. The calculated bandgap energy ranged from 2.49 to 2.67 eV, with higher calcination temperatures leading to lower absorbance in the UV region. The photodegradation of phenol under UV-Vis radiation reached 35% in 60 min for WO3_700 °C, where the photocatalyst suffered a morphological transformation from a nanoflower to nanogranular structure, accompanied by increased crystallinity. Under visible light, the phenol abatement was limited, achieving 1–3% degradation. The WO3 surface is likely negatively charged at the solution’s pH (5.6), which may explain the low phenol adsorption (~1%).
1. Introduction
Water scarcity and water pollution are two major problems of the 21st century. The persistence of complex organic compounds in water is a global issue that must be addressed urgently [1]. Biorecalcitrant organic compounds remain in water resources because conventional wastewater treatment technologies do not efficiently remove them [1,2]. However, the use of advanced oxidation processes (AOPs) can promote the degradation of these pollutants by transforming them into H2O and CO2 when complete mineralization is achieved.
Among AOPs, photocatalysis require a semiconductor photocatalyst to initiate and enhance the generation of oxidative radicals, particularly the •OH radical [3]. Therefore, the study and development of novel photocatalytic materials is a key research focus, particularly with the objective of achieving higher photocatalytic performance.
Regarding the materials, tungsten trioxide (WO3) can be an interesting option to consider since it has already been widely studied by the scientific community for various applications such as gas sensors, conducting electrodes, hydrogen generation, electrocatalysts, or photocatalysts [4,5]. This material has an indirect bandgap energy of 2.3–2.8 eV, which allows WO3 to be active under visible light and absorb up to 12% of the solar spectrum (visible spectrum up to 500 nm) [6]. This characteristic reduces dependence on artificial radiation, making WO3 a promising candidate for photo-driven AOPs and a viable option for water and wastewater treatment solutions.
Currently, most of the photocatalysis-based solutions that are being studied and developed rely on the traditional TiO2 powder (bandgap energy of 3.08–3.20 eV). However, TiO2 presents several drawbacks for photocatalytic oxidation processes, namely: (i) powder materials are difficult to separate from aqueous solutions and reuse, posing challenging issues for industrial implementation; (ii) the bandgap energy of TiO2 requires UV radiation, which is often provided artificially, leading to higher energy consumption and costs; (iii) while TiO2 can be activated by solar radiation (due to UVA fraction in the solar spectrum), it cannot be activated under visible light, which constitutes the largest portion of the solar radiation spectrum. Thus, WO3 offers certain advantages over TiO2, but its application is also predominantly reported in powder form, which still presents similar limitations.
A potential solution to overcome the challenges associated with powder photocatalysts involves either supporting the powder on a substrate or producing the material in a form that can be easily separated from water [7]. In this regard, the anodization method is a simple and cost-effective process that enables the generation of metal oxides from a metallic foil (for example, Ti, W, Zn, Mo, etc.) forming photocatalysts that are easier to recover from water [8]. Additionally, this technology allows the formation of different nanostructures (such as nanotubes, nanorods, nanoparticles, nanosheets, nanoflowers, etc.) [9] whose presence and modification can enhance the material’s properties and improve the photocatalytic process. For example, TiO2 nanotubes exhibit superior photocatalytic performance when compared to compacted TiO2 [10,11,12].
In previous studies, Pancielejko et al. [13] obtained WO3 thin films for air purification, obtaining WO3 nanoflowers with bandgap energies ranging from 2.40 to 2.75 eV and capable of removing 100% of toluene (200 ppm) in 60 min under visible light (λmax = 415 nm). However, in that study, the calcination conditions were not optimized for the obtained films. It is known that the calcination conditions play a crucial role in enhancing the material’s activity, and therefore, these conditions should be considered and optimized. With this, Fernández-Domene et al. [14] investigated different calcination temperatures (400 and 600 °C) for the preparation of WO3 nanorods used in the photoelectrocatalytic removal of an insecticide at acidic pH. Their results indicated that calcination at 600 °C promotes a higher degree of dehydration and crystallinity. Similarly, Mzimela et al. [15] evaluated the calcination temperature (300, 500, and 700 °C) of WO3 nanoparticles synthesized via the acidic precipitation method, concluding that the photocatalytic oxidation of rhodamine B was only achieved with samples calcined at 300 °C.
Although previous studies from literature examined WO3 samples calcined at two or three different temperatures, no research has reported the optimization of the photocatalytic activity of anodized WO3 by evaluating a wide range of calcination temperatures. Therefore, to the best of our knowledge, this work reports for the first time the impact of various calcination temperatures (from 200 to 700 °C) on WO3 nanoflowers synthesized via anodic oxidation. The impact of calcination temperature and time were evaluated based on the photocatalytic oxidation of a phenol solution using the different materials.
2. Results and Discussion
2.1. Photocatalyst Characterization Results
SEM analysis was performed to examine the tungsten oxide film morphology and to determine the dimensions of the oxide layer. Figure 1 presents the morphologies obtained for the anodized W foil and the tungsten oxides calcined at different calcination temperatures, with the corresponding film color shown as insets.
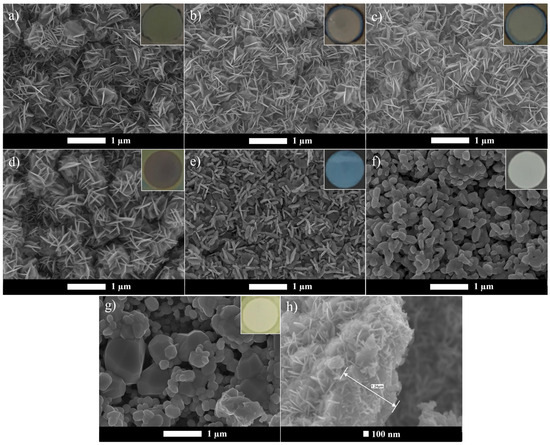
Figure 1.
SEM images of WO3 samples: (a) WO3_A, (b) WO3_200 °C, (c) WO3_300 °C, (d) WO3_400 °C, (e) WO3_500 °C, (f) WO3_600 °C, (g) WO3_700 °C, (h) oxide layer thickness (measured from WO3_200 °C). Inset: oxide layer color.
The anodization resulted in the formation of flower-like bundles with an oxide layer thickness of approximately 1.2 µm, which agrees with the study of Pancielejko et al. [13]. However, this analysis also confirms that the annealing process can influence the nanostructure’s morphology, leading to a transformation from a flower-like structure to platelet and nanogranular shapes at temperatures above 400 °C. Comparing the as-anodized sample with the samples annealed in air from 200 to 400 °C (Figure 1a–d), no noticeable morphological differences were observed. Additionally, increasing the annealing temperature caused a change in the oxide layer color, as shown in the SEM image insets (Figure 1).
For the sample calcined at 700 °C, it is possible to visually note the partial destruction of the W foil, with oxide formation also observed on the non-anodized regions. A further increase in temperatures above 700 °C would likely result in the complete W foil disintegration, and due to this, higher temperatures were not explored. Similar behavior was reported by Syrek et al. [16], who observed grain formation and metallic W foil destruction at 700 °C. The development of these nanostructures may be associated with the transition from the amorphous to the monoclinic phase, as is discussed further. Figures S1–S3 provide additional SEM images of WO3 nanostructures obtained after calcination at 500, 600, and 700 °C at different magnifications, offering a more detailed view of their structural morphology. Moreover, although not explicitly analyzed in this study, it is likely possible that the morphological changes induced by calcination temperature also influence the particle size as well as the specific surface area [15,17].
Different WO3 nanostructures have been reported in previous studies. As example, Roselló-Márquez et al. [18] reported the anodization of a W foil using 0.05 M H2O2 with 1.5 M of H2SO4, forming a spongy layer with very small nanoplatelets. When H2SO4 was replaced by CH4O3S, tiny nanowires were obtained. In another study, Fernández-Domene et al. [14] synthesized nanorods and nanosheets that evolved into more defined nanorods, as the calcination temperature increased from 400 to 600 °C. Additionally, the anodization at 50 V in a 0.25 wt% HF electrolyte solution followed by calcination at 500 °C resulted in WO3 nanopores with a blue oxide layer [5], as also observed in this study for the sample calcined at the same temperature (Figure 1). Mena et al. [17] reported that WO3 microspheres obtained by the sol–gel method began to lose their shape as the calcination temperature increased from 500 to 600 and 700 °C, also promoting a crystallite phase change from orthorhombic (500 °C) to monoclinic (600 and 700 °C).
The crystallite phases were analyzed using Raman spectroscopy, as presented in Figure 2a. Higher annealing temperatures led to increased crystallinity, evidenced by more intense peaks. Therefore, the Raman spectra were divided into two separate figures (Figure 2b,c). Moreover, the increase in temperature was also accompanied by the conversion and higher definition of WO3 crystallite phases.
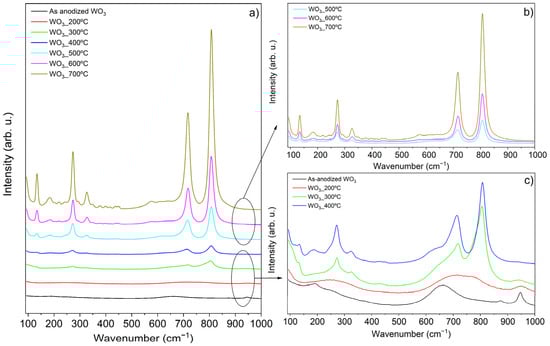
Figure 2.
Raman of WO3 samples: (a) all the samples; (b) WO3_500 °C, WO3_600 °C, WO3_700 °C; (c) WO3_A, WO3_200 °C, WO3_300 °C, WO3_400 °C.
The as-anodized sample and the ones annealed up to 300 °C appear to exhibit amorphous structure or poor crystallinity (Figure 2c). The WO3_A sample presents Raman bands at 191, 661, and 947 cm−1 that are attributed to the antisymmetric stretching vibrations of (W–O–W) bonds, the symmetric stretching vibrations of (O–W–O), and the symmetric stretching mode of the short terminal W6+=O bond, respectively [19]. Similar observations are reported in the literature, with these bands indicating the presence of WO3·H2O, WO3·2H2O, and amorphous WO3·n(H2O) hydrated oxides [19]. These hydrated species typically form during WO3 synthesis and are associated with the anodization process in liquid electrolytes, particularly under acidic conditions [19].
Interestingly, in their work, Fernández-Domene et al. [19] suggest the presence of WO3·2H2O based on the observation of a doublet bond near 660 and 680 cm−1 as well as the existence of Raman bands near 210 and 270 cm−1. However, this is not observed in the present study. Instead, the existence of singular bands at 191 and 661 cm−1 are consistent with the existence of WO3·H2O [19]. In the WO3_300 °C sample, new peaks begin to appear at 133, 272, 325, 718, and 805 cm−1. The 718 and 805 cm−1 peaks result from the partition of the 661 cm−1 peak, while the others (133, 272, 325 cm−1) are characteristic signals of monoclinic WO3 [19,20]. The 718 and 805 cm−1 peaks correspond to the symmetric stretching modes arising from O–W–O bonds, whereas the peaks at 272 and 325 cm−1 are associated with the bending of δ (O–W–O) bonds [19,20]. The low frequency peak at 133 cm−1 is attributed to the lattice modes of monoclinic crystallite phase [19].
The samples annealed at 400, 500, and 600 °C exhibit the same peaks as the WO3_300 °C sample, but with slight deviations and increased intensities as the temperature rises. The asymmetric peak at 718 cm−1 observed in the samples calcined at 300 and 400 °C can indicate the existence of residual traces of tungsten hydrate [21], which could explain these variations. Although the Raman spectra of the samples share similar peaks, a noticeable increase in intensity is observed from 300 to 400 °C. The literature indicates that a monoclinic WO3 phase is present at 400 °C, but at 500 °C, the structure may transition to either a monoclinic or orthorhombic WO3 phase, or even a mixture of both [17,19,22,23]. It seems that the synthesis method may influence the crystallite structure at 500 °C [17]. Since no additional peaks are detected and only the intensity increases, it suggests that the samples calcined at 500, 600, and 700 °C remain in the monoclinic WO3 phase, consistent with findings from other studies [16,17,20]. Moreover, at elevated temperatures, the monoclinic structure is the most thermodynamically stable WO3 phase due to the minimization of the surface Gibbs energy/entropy, which enhances the structural stability [24]. It is also expected an increase in the oxide layer thickness and in the crystallite size as the annealing temperature (increases [16,20].
X-ray diffraction (XRD) analysis further corroborated the Raman spectroscopy results, confirming the presence of monoclinic WO3 (ICDD entry 04-005-4272, space group P2₁/n), as shown in Figure 3 [22,24,25].
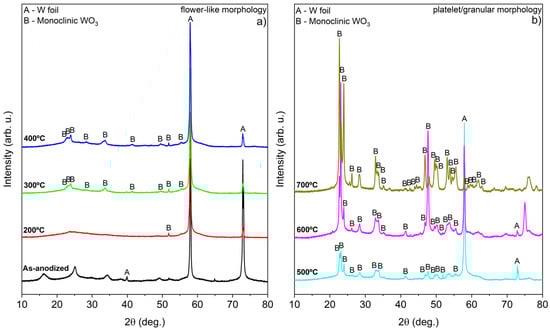
Figure 3.
XRD of WO3 samples calcined in air at different temperatures during 4 h: (a) nanoflower-like structure and (b) platelet/granular nanostructure.
The sample calcined at 700 °C exhibits weak signals of metallic tungsten, which may be attributed to the formation of tungsten oxides and the structural destruction observed in the entire W foil. Interestingly, the XRD confirms the observations of Raman spectroscopy findings, confirming the presence of WO3·H2O in the as-anodized sample [26]. Based on this observation and supporting literature [13,19,27], it appears that the anodization of W foil under the specified conditions can be summarized by the following reactions (Equations (1)–(3)). The detailed mechanism regarding the formation of WO3 nanoflowers through anodization has been described by Ng et al. [27].
W + 2 H2O → WO22+ + 4 H+ + 6 e−
WO22+ + 2 H2O → WO3·H2O + 2 H+
WO3·H2O + heat (>300/400 °C) → WO3 (monoclinic) + H2O
During anodization, an intermediate species (WO22+) is formed, which subsequently reacts with H2O to produce WO3·H2O as the final anodization product. Upon calcination, dehydration of OH− groups occurs, leading to the formation of WO3, which in this case, adopts a more defined monoclinic structure for temperatures above 400 °C [21,27,28]. Furthermore, the presence of WO3·H2O appears to play a crucial role in maintaining the nanoflower-like morphology. This is supported by Raman analysis, which shows that when the peaks become more symmetric (at 500 °C and above) the flower-like shape is lost, converting to a different nanostructure.
The optical properties of the samples calcined at different temperatures were also evaluated. The indirect bandgap energy was determined using Tauc’s plot based on the direct transition between 2p electrons present in the WO3 valence band of oxygen and the 5d conduction band of WO3 [29,30]. Tauc’s plot is a widely used method used for estimating the bandgap energies of semiconductors based on the assumption that the absorption coefficient (α) can be expressed by (αhv)1/y = B(hv − EBG), in which the “y” depends on the nature of the electron transition (1/2 and 2 for direct and indirect transitions, respectively), the “hv” is the photon energy, “B” is a constant, and the “EBG” is the bandgap energy of the material [31]. The absorption coefficient α is proportional to the Kubelka–Munk function (F(R) = (1−R2)/2R) that can be calculated based on the samples reflectance (R), obtained by DRS measurements.
With this, by plotting (αhv)1/y versus the photon energy (hv) it is possible to estimate the bandgap energy [24,31]. Figure 4 presents the DRS UV-Vis spectra (a) and the corresponding Tauc’s plot (b).
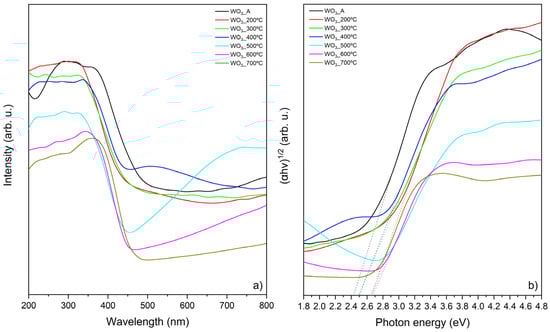
Figure 4.
Optical properties of WO3 samples: (a) UV-Vis DRS and (b) Kubelka–Munk function (to calculate bandgap energy).
As the calcination temperature increases, a decrease in the absorption intensity of the WO3 samples is observed. The same behavior was reported by Abbaspoor et al. [24], where the DRS measurements showed that the as-anodized WO3 exhibited the highest absorption intensity, while the sample calcined at 700 °C presented the lowest intensity, which is consistent with the findings of the present study. Additionally, the authors reported a “red shift” in the absorption edge with the increase in the calcination temperature increases, which is also observed in this work. This “red shift”, along with variations in the DRS absorption profiles, is attributed to an increase in the crystallite size [24]. Therefore, the differences observed in the DRS measurements (Figure 4a) can be directly linked to the morphological changes in the WO3 thin films induced by calcination.
The bandgap energies calculated from the Tauc plot (Figure 4b) are presented in Table 1 and ranged between 2.42 and 2.67 eV, consistent with the literature [13,22,32]. The bandgap energy depends on bonding–antibonding interactions, and variations in this energy can be attributed to structural organization induced by thermal treatments, lattice parameters, crystallite sizes, defects, and shapes [22].

Table 1.
Summary of the performance of synthetized WO3 films.
Photoluminescence measurements were conducted to obtain more details about the carrier’s generation through photoexcitation of WO3 samples annealed at different temperatures. The results are presented in Figure 5.
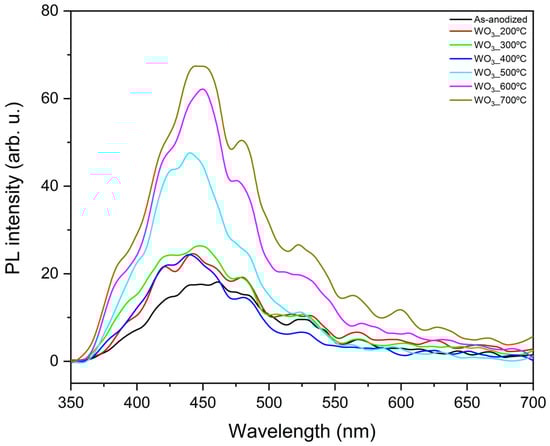
Figure 5.
PL measurements of WO3 samples calcined at different temperatures.
In this experiment, lower PL intensity is associated with reduced recombination, which, when minimized, generally benefits the photocatalytic reactions [33,34]. The peaks observed at around 420, 438, and 481 nm are attributed to the presence of intrinsic defects, such as oxygen vacancies, while the peak observed near 527 nm is pointed to the radiative recombination of photogenerated charges [13]. In this case, it appears that as the calcination temperature increases, the recombination also increases. This phenomenon becomes particularly pronounced above 500 °C, which is the temperature at which the morphology of the WO3 flowers changes (Figure 1). This suggests that the flower-like structure exhibits lower recombination compared to the grain-like morphology observed at calcination temperatures of 500, 600, and 700 °C.
It can be observed that when analyzing the temperatures in which the flower-like morphology is preserved (200–400 °C), the PL intensities are similar. However, the material calcinated at 300 °C seems to present slightly higher recombination than the other samples. Interestingly, the as-anodized sample shows the lowest recombination among all the synthesized WO3 samples. Combined with its favorable optical properties and estimated bandgap energy (2.42 eV), this suggests that it could be a promising material for photocatalysis.
2.2. Phenol Photodegradation
WO3 can be an interesting material for application in the photocatalytic oxidation of water contaminants due to its low bandgap energy, which is compatible with visible light activity. In this study, the photocatalytic activity of the material was evaluated for the abatement of phenol (20 mg/L), since it is a common contaminant in industrial wastewater [35].
Figure 6 presents the phenol abatement by photocatalysis with UV-Vis and visible light radiation after 60 min reaction (maximum error of ±1%). Figure S4 presents the degradation profile of phenol for the WO3 samples calcined at different temperatures.
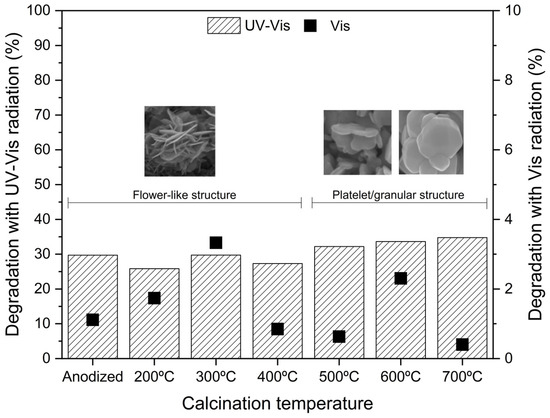
Figure 6.
Photocatalytic activity of WO3 samples for phenol degradation in 60 min reaction: UV-Vis radiation (left axis) and visible radiation (right axis).
The results show a negligible adsorption on the photocatalyst’s surface, with only about 1% phenol removal in 30 min. However, after 60 min of irradiation, the highest phenol removal (under UV-Vis) was achieved for the WO3_700 °C sample. Regarding adsorption, the pH zero point of charge (pHzpc) of WO3 is approximately 2.5 [36,37], while the phenol solution has a pH of 5.6. When the solution pH > pHzpc, the photocatalyst surface becomes negatively charged, while for pH < pHzpc, the surface becomes positively charged [38]. Thus, the anodized WO3 has a negatively charged surface. At this pH, phenol is neutral (pKa = 10), so the electrostatic interaction with WO3 is minimal, leading to very poor adsorption, which agrees with the present results.
The phenol degradation by direct photolysis was reported by Mazierski et al. [39], showing 3% degradation under UV-Vis radiation and 1% under visible radiation. Analyzing the UV-Vis photodegradation reaction along with the sample’s crystallinity (Figure 2), it is possible to see that as the temperature increases, the phenol degradation rate is also higher (excepting the case of 400 °C). The increase in the calcination temperature leads to an increase in the sample’s crystallite intensity. Furthermore, from 500 to 700 °C, the oxide morphology changes, which may also be accompanied by an increase in the crystallite size [15,16,20]. The XRD analysis shows only a small presence of metallic tungsten at 700 °C (Figure 3), suggesting higher formation of tungsten oxides.
Therefore, this may explain the observed differences and the higher activity of the sample calcined at 700 °C, although the photocatalytic activity order is contrary to what is observed in the PL measurements (Figure 5). The fact that the 400 °C sample does not follow this trend may be related to the fact that the 400 ºC is a transition temperature between the flower-like morphology and the new granular/platelet-like structure. This assumption helps explain why the 300 °C sample performs the best under UV-Vis (just analyzing the flower-shape structures).
Additionally, under visible light radiation, the phenol removal is very low. The WO3_300 °C has a relatively low bandgap energy of 2.49 eV (Table 1) compared to the other calcined samples, which can explain the best removal rate of 3%. The as-anodized sample has the lowest bandgap (2.42 eV), but its poor performance can be related to its amorphous composition.
Under visible light, Mzimela et al. [15] obtained about 78% dye removal (mostly related to adsorption—72%) using WO3 powders calcined at 300 °C. Increasing the calcination temperature to 500 or 700 °C resulted in negligible removal of 1–2%, mainly attributed to adsorption, which aligns with the observations of the present study. All the samples exhibited monoclinic crystallite structure. Interestingly, as the calcination temperature increased, the authors observed a decrease in surface area, which could explain the minimal degradation observed at higher temperature, as this decrease negatively impacts adsorption. However, by optimizing the reaction conditions (calcination temperature, solution pH, pollutant concentration, catalyst loading, and irradiation time), the authors were able to improve the photocatalytic degradation by achieving 96% removal after 4 h of irradiation, with adsorption having no contribution to this degradation. Similar process conditions were considered by other authors [40], who also found that well-defined structural morphology (in the case, nanorods) leads to better performance when compared to nanoparticles (monoclinic phase present).
Therefore, although the present study and the results of Mzimela et al. [15] suggest that the monoclinic phase may not be efficient under visible light, the work of Adhikari et al. [40] and the process optimization carried out by Mzimela et al. [15] demonstrate that it is possible to obtain good performance using monoclinic WO3. However, this low performance of WO3 can also be attributed to other crystallite phases and be a consequence of the inherent characteristics of WO3. For instance, Aslam et al. [41] reported a phenol degradation of about 2% and 8% in 30 and 180 min using powder disc-shaped WO3 (~2.55 eV) under solar radiation. For other phenol derivatives, the degradation was almost complete for chlorophenol and nitrophenol, while about 11% degradation was observed for resorcinol, in 180 min. The authors also mention that the formation of superoxide anion radical (•O2−) via the reduction of dissolved or adsorbed oxygen by conduction band electrons (e−) is not possible for WO3, as its conduction band potential is +0.74 V, while the formation of •O2− requires the potential to be at −0.28 V. However, the authors suggest the presence of this oxidizing species through some alternative mechanism.
In another study involving solar radiation, only the incorporation of Au nanoparticles onto the WO3 surface improved the photocatalytic activity (due to plasmonic effect), leading to enhanced degradation of some pollutants [42]. In fact, in the work of Desseigne et al. [42], the WO3 was composed of an orthorhombic crystallite phase (calcination in air at 500 °C) and the presence of gold nanoparticles resulted in better performance due to a longer lifetime of the photogenerated charges. The rate of charge recombination depends on the electrical properties of the material, but the Schottky barrier created at the interface between the gold nanoparticles and the semiconductor allows to increase the recombination time, resulting in a reduced recombination. This leads to a higher generation of radicals, which are responsible for the increased degradation of pollutants [42].
Although WO3 presents a low bandgap energy compatible with visible light irradiation, it appears to have a high recombination rate (as observed in Figure 4 and Figure 5), which may explain the low efficiency for photocatalysis, particularly under visible light. Furthermore, the work of Aslam et al. [41] and Desseigne et al. [42] support the notion of easy recombination in WO3, as the electrons are not capable of generating •O2− radicals due to the conduction band energy level of WO3. As a result, these electrons are available to react with the holes (h+). This recombination process is hindered by the incorporation of Au nanoparticles, which causes a stronger electron trapping effect, ultimately enhancing the photocatalytic activity by increasing the generation of oxidative species.
Therefore, using more efficient electron trappers should increase the charge carrier’s lifetime and reduce the recombination effect. This can be achieved by replacing oxygen by ozone [17,32,43,44,45,46], decorating WO3 with noble metals (as Au or Ag) [42,47], or employing photoelectrocatalysis [48,49,50].
Interestingly, for the photocatalytic oxidation of toluene in the gaseous phase, Pancielejko et al. [13] achieved complete removal in 60 min of visible light irradiation (λmax = 415 nm). This suggests that WO3 can present high activity for the treatment of gaseous streams by photocatalysis, while its application for the treatment of aqueous contaminants may not be as effective or may require better optimization of the process conditions [15]. The high activity observed in the work of Pancielejko et al. [13] is also attributed to the contribution of this type of nanostructure, since the flower-like morphology enhances the surface area and light absorption due to multiple light scattering. This, in turn, reduces the recombination of electron-hole pairs, thus improving the photoactivity of WO3 [13,51,52].
To analyze the influence of calcination time, the WO3_300 °C was chosen since it is the sample with the highest photoactivity for phenol degradation and retains the flower-like nanostructure (Table 1). The calcination time was varied for 1, 2 or 6 h (characterization data are presented in Supplementary Materials). Figure S5 presents the SEM images of WO3_300 °C calcined for different times, and Figure S6 presents different magnifications for WO3_300 °C_1h to better understand the oxide layer morphology. Similar shapes are observed for the other flower-like structures. To evaluate the crystallite phases, the Raman and XRD spectra are also reported in Figures S7 and S8, respectively, demonstrating that the samples annealed at 300 °C for different time periods maintain the monoclinic structure. However, different Raman intensity is observed (Figure S7).
Regarding their optical properties, the samples exhibit similar DRS absorbances (Figure S9), although the WO3_300 °C_1h shows higher absorbance, while the WO3_300 °C_4h shows the lowest. The corresponding bandgap energy was calculated using the Kubelka–Munk function (Figure S10) and found to be 2.53, 2.45, 2.49, and 2.43 eV for the sample annealed for 1, 2, 4, and 6 h, respectively (Table 1). Additionally, the photogenerated electron-hole pairs recombination was evaluated using PL analysis (Figure S11), with WO3_300 °C_6h presenting the lowest recombination. These results also suggest that samples with higher crystallinity (as indicated by Raman intensity—Figure S6) experience greater recombination.
The photocatalytic degradation of phenol was tested under UV-Vis (Figure S12) and Vis (Figure S13) radiation. The results suggest that increasing the calcination time does not significantly change the phenol degradation kinetics. Table 1 summarizes the results involving the synthesized WO3 films. To highlight the findings from this study, Table 2 presents a state-of-the-art comparison of anodized WO3 photocatalysts for the degradation of different contaminants.
Table 2.
Performance of anodized WO3 in photocatalysis.
3. Materials and Methods
3.1. Synthesis of WO3 Nanoflowers
The detailed synthesis of WO3 nanoflowers by anodization is provided in our previous work [13]. In general, tungsten foil was cut into 2.5 × 2.5 cm pieces and ultrasonically cleaned in acetone, isopropanol, methanol, and deionized water for 10 min in each solvent, followed by drying with a nitrogen stream. The W foil was anodized in an O-ring anodization cell using the foil as anode and a platinum mesh as cathode, at room temperature (20 °C).
The electrolyte solution was composed of 0.5 wt% NaF in 1 M H2SO4 and the anodization was performed at 40 V during 1.5 h. These parameters were selected based on our previous work [13], as they achieved the highest toluene degradation. After anodization, the samples were carefully immersed in deionized water to remove any electrolyte residues and then dried at 60 °C overnight. Calcination was performed at various temperatures (200, 300, 400, 500, 600, and 700 °C) during 4 h with a heating step of 4 °C/min in air. For the best-performing sample, the effect of the calcination time was also evaluated. The samples are labeled as “WO3_T”, where “T” represents the calcination temperature (200–700 °C). The as-anodized sample is denoted as “WO3_A”.
3.2. WO3 Photoactivity Evaluation
The photocatalytic activity of the prepared material was assessed by the degradation of a 20 mg/L phenol solution (pH = 5.6). The photocatalytic reaction was carried out in a quartz reactor with 8 mL of phenol solution and the WO3 sample (2 × 2 cm, with an anodized layer of 1.9 cm2). The adsorption capacity of the material was tested under dark conditions with an oxygen stream (10–12 L/min) for 30 min. After this period, the irradiation (UV-Vis, 1000 W, Oriel 66021, Oriel Instruments, Irvine, CA, USA) was applied for 1 h, with sampling at each 20 min. For the visible light experiments, a GG420 filter was placed near the reactor to cut the UV radiation below 420 nm. The irradiation intensity was measured with a UV power meter (C9536-01, Hamamatsu Photonics K.K., Hamamatsu, Japan) being kept constant at 100 mW/cm2. The phenol concentration was determined by HPLC-DAD (Shimadzu, Nakagyo-ku, Japan) using a flow rate of 0.55 mL/min of a 10%:90% mixture of acetonitrile and acidified water. The compound separation was performed in a C18 silichrom column at 40 °C, with phenol detection at 225 nm.
3.3. WO3 Analytical Characterization
The WO3 materials were analyzed regarding their morphology, crystallite structure, crystals dimensions, and radiation absorption. The morphology was evaluated using high-resolution scanning electron microscopy (JSM-7610F, JEOL, Akishima, Japan). The crystal structures were analyzed by Raman spectra (DXR2 SmartRaman, Thermo Scientific, Basingstoke, UK) equipped with a 532 nm DXR laser. This was also evaluated by X-ray diffraction (XRD, Phillips Xpert PROMDP, Farnborough, UK) with Cu Kα radiation (λ = 1.5404 Å). The radiation absorbance was measured using a DRS UV-Vis spectrophotometer (UV 2600, Shimadzu, Kyoto, Japan) equipped with an integrating sphere, using barium sulfate as the baseline. The bandgap energy was calculated through Tauc plot analysis (error ± 0.01 eV), based on the DRS data. Photoluminescence (PL) measurements were conducted to assess the recombination phenomenon occurring in the samples, using a photoluminescence spectrometer (LS-50B, PerkinElmer, Waltham, MA, USA) equipped with a Xe lamp and R928 photomultiplier. The determinations occurred at room temperature with excitation radiation at 300 nm, irradiating directly the sample surface at an angle of 90°.
4. Conclusions
The results show that increasing the calcination temperature causes a transformation in the WO3 morphology, transitioning from flower-like to platelet/granular nanostructures at temperatures above 400 °C. This transformation may be related to the conversion of WO3·H2O into WO3 due to the heating treatment.
After calcination, all the samples exhibited monoclinic phase and the Raman shift intensity increasing with the calcination temperature increase. For certain temperatures, there may still be the presence of residual WO3·H2O. The PL measurements suggest that the nanoflower shape reduces the recombination rate, and as the calcination temperature increases, the recombination rate becomes higher when other nanostructures are present.
In general, the photodegradation of phenol increased as the crystallite intensity also increased, with the best result under UV-Vis being achieved for WO3_700 °C with a 35% degradation in 60 min. These results are probably influenced by the high recombination rate characteristic of WO3 (as proven by PL), especially in the presence of oxygen. Thus, using powerful oxidants or better electron trapping agents (such as ozone), provide surface decoration with noble metals (as Au), or even employing photoelectrocatalysis, should be considered in future studies to enhance the photocatalytic activity of anodic WO3 nanostructures.
The effect of calcination time was also evaluated for the best sample that maintained the nanoflower shape (WO3_300 °C), with no significant improvement in phenol degradation being observed, despite changes in Raman intensities and radiation absorbance (accompanied by different bandgap energy) being noted. Therefore, from this work, the following points can be highlighted:
- Anodization produces WO3·H2O that is converted to monoclinic WO3 after calcination in air;
- WO3·H2O forms a flower-like nanostructure, which transforms into a platelet-like and granular nanostructures when heated above 500 °C;
- As the calcination temperature increases, the oxide layer presents different colors;
- The monoclinic WO3 exhibited bandgap energies ranging from 2.43 to 2.67 eV, depending on the calcination temperature and time;
- The flower-like morphology showed lower recombination compared to platelet-like or granular morphologies;
- The highest photoactivity was observed for the WO3 granular-like morphology (700 °C), with the highest activity for the nanoflower-like structure being observed for the WO3_300 °C sample.
Supplementary Materials
The following supporting information can be downloaded at: www.mdpi.com/article/10.3390/catal15030207/s1, Figure S1: SEM images of WO3 samples calcined at 500 °C during 4 h with different magnifications; Figure S2: SEM images of WO3 samples calcined at 600 °C during 4 h with different magnifications; Figure S3: SEM images of WO3 samples calcined at 700 °C during 4 h with different magnifications; Figure S4: Phenol photodegradation profiles using WO3 samples irradiated by UV-Vis and visible light radiation; Figure S5: SEM images of WO3 samples calcined at 300 °C for different times; Figure S6: SEM images of WO3 samples calcined at 300 °C during 1 h with different magnifications; Figure S7: Raman spectra of WO3 samples calcined at 300 °C for different times; Figure S8: XRD of WO3 samples calcined at 300 °C for different times; Figure S9: UV-Vis DRS of WO3 samples calcined at 300 °C for different times; Figure S10: Kubelka–Munk function of WO3 samples calcined at 300 °C for different times; Figure S11: PL measurements of WO3 samples calcined at 300 °C for different times; Figure S12: Phenol photodegradation profiles under UV-Vis radiation with WO3 samples calcined at 300 °C for different times; Figure S13: Phenol photodegradation profiles under Vis radiation with WO3 samples calcined at 300 °C for different times.
Author Contributions
Conceptualization, J.L., P.M., R.C.M., J.G. and A.Z.-M.; data curation, J.L., P.M. and T.K.; investigation, J.L., P.M. and T.K.; methodology, J.L., T.K., P.M., R.C.M., J.G. and A.Z.-M.; supervision, R.C.M., J.G. and A.Z.-M.; visualization, J.L.; writing—original draft preparation, J.L.; writing—review and editing, P.M., R.C.M., J.G. and A.Z.-M. All authors have read and agreed to the published version of the manuscript.
Funding
This research was funded by the Foundation of Science and Technology—FCT (Portugal), 2021.06221.BD (PhD grant with DOI: https://doi.org/10.54499/2021.06221.BD) (J.L.) and CEECIND/01207/2018 (J.G.). The authors gratefully acknowledge the financial support from the FCT to CERES (UIDB/00102/2020).
Data Availability Statement
The data presented in this study are available on request from the corresponding author.
Conflicts of Interest
The authors declare no conflicts of interest.
References
- Wilkinson, J.L.; Boxall, A.B.A.; Kolpin, D.W.; Leung, K.M.Y.; Lai, R.W.S.; Galbán-Malagón, C.; Adell, A.D.; Mondon, J.; Metian, M.; Marchant, R.A.; et al. Pharmaceutical Pollution of the World’s Rivers. Proc. Natl. Acad. Sci. USA 2022, 119, e2113947119. [Google Scholar] [CrossRef]
- Hamza, R.A.; Iorhemen, O.T.; Tay, J.H. Occurrence, impacts and removal of emerging substances of concern from wastewater. Environ. Technol. Innov. 2016, 5, 161–175. [Google Scholar] [CrossRef]
- Miklos, D.B.; Remy, C.; Jekel, M.; Linden, K.G.; Drewes, J.E.; Hübner, U. Evaluation of advanced oxidation processes for water and wastewater treatment—A critical review. Water Res. 2018, 139, 118–131. [Google Scholar] [CrossRef] [PubMed]
- Mukherjee, N.; Paulose, M.; Verghese, O.K.; Mor, G.K.; Grimes, C.A. Fabrication of nanoporous tungsten oxide by galvanostatic anodization. J. Mater. Res. 2003, 18, 2296–2299. [Google Scholar] [CrossRef]
- Zheng, Q.; Lee, C. Visible light photoelectrocatalytic degradation of methyl orange using anodized nanoporous WO3. Electrochim. Acta 2014, 115, 140–145. [Google Scholar] [CrossRef]
- Kalanur, S.S.; Hwang, Y.J.; Chae, S.Y.; Joo, O.S. Facile growth of aligned WO3 nanorods on FTO substrate for enhanced photoanodic water oxidation activity. J. Mater. Chem. A 2013, 1, 3479. [Google Scholar] [CrossRef]
- Shan, A.Y.; Mohd Ghazi, T.I.; Rashid, S.A. Immobilisation of titanium dioxide onto supporting materials in heterogeneous photocatalysis: A review. Appl. Catal. A Gen. 2010, 389, 1–8. [Google Scholar] [CrossRef]
- Galstyan, V.; Macak, J.M.; Djenizian, T. Anodic TiO2 nanotubes: A promising material for energy conversion and storage. Appl. Mater. Today 2022, 29, 101613. [Google Scholar] [CrossRef]
- Lincho, J.; Zaleska-Medynska, A.; Martins, R.C.; Gomes, J. Nanostructured photocatalysts for the abatement of contaminants by photocatalysis and photocatalytic ozonation: An overview. Sci. Total Environ. 2022, 837, 155776. [Google Scholar] [CrossRef]
- Poudel, M.B.; Yu, C.; Kim, H.J. Synthesis of Conducting Bifunctional Polyaniline@Mn-TiO2 Nanocomposites for Supercapacitor Electrode and Visible Light Driven Photocatalysis. Catalysts 2020, 10, 546. [Google Scholar] [CrossRef]
- Poudel, M.B.; Kim, A.A. Silver Nanoparticles Decorated TiO2 Nanoflakes for Antibacterial Properties. Inorg. Chem. Commun. 2023, 152, 110675. [Google Scholar] [CrossRef]
- Zlamal, M.; Macak, J.; Schmuki, P.; Krysa, J. Electrochemically assisted photocatalysis on self-organized TiO2 nanotubes. Electrochem. Commun. 2007, 9, 2822–2826. [Google Scholar] [CrossRef]
- Pancielejko, A.; Rzepnikowska, M.; Zaleska-Medynska, A.; Łuczak, J.; Mazierski, P. Enhanced Visible Light Active WO3 Thin Films Toward Air Purification: Effect of the Synthesis Conditions. Materials 2020, 13, 3506. [Google Scholar] [CrossRef] [PubMed]
- Fernández-Domene, R.M.; Roselló-Márquez, G.; Sánchez-Tovar, R.; Lucas-Granados, B.; García-Antón, J. Photoelectrochemical removal of chlorfenvinphos by using WO3 nanorods: Influence of annealing temperature and operation pH. Sep. Purif. Technol. 2019, 212, 458–464. [Google Scholar] [CrossRef]
- Mzimela, N.; Tichapondwa, S.; Chirwa, E. Visible-light-activated photocatalytic degradation of rhodamine B using WO3 nanoparticles. RSC Adv. 2022, 12, 34652–34659. [Google Scholar] [CrossRef]
- Syrek, K. Influence of annealing conditions on anodic tungsten oxide layers and their photoelectrochemical activity. Electrochim. Acta 2017, 8, 61–68. [Google Scholar] [CrossRef]
- Mena, E.; Rey, A.; Contreras, S.; Beltrán, F.J. Visible light photocatalytic ozonation of DEET in the presence of different forms of WO3. Catal. Today 2015, 252, 100–106. [Google Scholar] [CrossRef]
- Roselló-Márquez, G.; Fernández-Domene, R.M.; Sánchez-Tovar, R.; Cifre-Herrando, M.; García-Antón, J. Degradation of Diazinon based on photoelectrocatalytic technique using enhanced WO3 nanostructures: Mechanism and pathway. J. Environ. Chem. Eng. 2021, 9, 105371. [Google Scholar] [CrossRef]
- Fernández-Domene, R.M.; Sánchez-Tovar, R.; Segura-Sanchís, E.; García-Antón, J. Novel tree-like WO3 nanoplatelets with very high surface area synthesized by anodization under controlled hydrodynamic conditions. Chem. Eng. J. 2016, 286, 59–67. [Google Scholar] [CrossRef]
- Ng, C.Y.; Abdul Razak, K.; Lockman, Z. Effect of annealing temperature on anodized nanoporous WO3. J. Porous Mater. 2015, 22, 537–544. [Google Scholar] [CrossRef]
- Wang, C.-K.; Lin, C.-K.; Wu, C.-L.; Wang, S.-C.; Huang, J.-L. Synthesis and characterization of electrochromic plate-like tungsten oxide films by acidic treatment of electrochemical anodized tungsten. Electrochim. Acta 2013, 112, 24–31. [Google Scholar] [CrossRef]
- Desseigne, M.; Dirany, N.; Chevallier, V.; Arab, M. Shape dependence of photosensitive properties of WO3 oxide for photocatalysis under solar light irradiation. Appl. Surf. Sci. 2019, 483, 313–323. [Google Scholar] [CrossRef]
- Yang, M.; Shrestha, N.K.; Schmuki, P. Thick porous tungsten trioxide films by anodization of tungsten in fluoride containing phosphoric acid electrolyte. Electrochem. Commun. 2009, 11, 1908–1911. [Google Scholar] [CrossRef]
- Abbaspoor, M.; Aliannezhadi, M.; Tehrani, F.S. High-performance photocatalytic WO3 nanoparticles for treatment of acidic wastewater. J. Sol-Gel Sci. Technol. 2023, 105, 565–576. [Google Scholar] [CrossRef]
- Syrek, K.; Kotarba, S.; Zych, M.; Pisarek, M.; Uchacz, T.; Sobańska, K.; Pięta, Ł.; Sulka, G.D. Surface Engineering of Anodic WO3 Layers by In Situ Doping for Light-Assisted Water Splitting. ACS Appl. Mater. Interfaces 2024, 16, 36752–36762. [Google Scholar] [CrossRef]
- Hatel, R.; Baitoul, M. Nanostructured Tungsten Trioxide (WO3): Synthesis, structural and morphological investigations. J. Phys. Conf. Ser. 2019, 1292, 012014. [Google Scholar] [CrossRef]
- Ng, C.; Ye, C.; Ng, Y.H.; Amal, R. Flower-Shaped Tungsten Oxide with Inorganic Fullerene-like Structure: Synthesis and Characterization. Cryst. Growth Des. 2010, 10, 3794–3801. [Google Scholar] [CrossRef]
- Amano, F.; Tian, M.; Ohtani, B.; Chen, A. Photoelectrochemical properties of tungsten trioxide thin film electrodes prepared from facet-controlled rectangular platelets. J. Solid State Electrochem. 2012, 16, 1965–1973. [Google Scholar] [CrossRef]
- Deb, S.K. Optical and photoelectric properties and colour centres in thin films of tungsten oxide. Philos. Mag. 1973, 27, 801–822. [Google Scholar] [CrossRef]
- Teoh, L.G.; Shieh, J.; Lai, W.H.; Hung, I.M.; Hon, M.H. Structure and optical properties of mesoporous tungsten oxide. J. Alloys Compd. 2005, 396, 251–254. [Google Scholar] [CrossRef]
- Makuła, P.; Pacia, M.; Macyk, W. How To Correctly Determine the Band Gap Energy of Modified Semiconductor Photocatalysts Based on UV–Vis Spectra. J. Phys. Chem. Lett. 2018, 9, 6814–6817. [Google Scholar] [CrossRef] [PubMed]
- Yang, J.; Xiao, J.; Cao, H.; Guo, Z.; Rabeah, J.; Brückner, A.; Xie, Y. The role of ozone and influence of band structure in WO3 photocatalysis and ozone integrated process for pharmaceutical wastewater treatment. J. Hazard. Mater. 2018, 360, 481–489. [Google Scholar] [CrossRef] [PubMed]
- Hu, X.; Shi, Y.; Zhu, B.; Zhang, S.; Huang, W. Highly photostable palladium-loaded TiO2 nanotubes and the active species in the photodegradation of methyl orange. Chin. J. Catal. 2015, 36, 221–228. [Google Scholar] [CrossRef]
- Wu, Z.; Sheng, Z.; Liu, Y.; Wang, H.; Tang, N.; Wang, J. Characterization and activity of Pd-modified TiO2 catalysts for photocatalytic oxidation of NO in gas phase. J. Hazard. Mater. 2009, 164, 542–548. [Google Scholar] [CrossRef] [PubMed]
- Reszczyńska, J.; Grzyb, T.; Sobczak, J.W.; Lisowski, W.; Gazda, M.; Ohtani, B.; Zaleska, A. Visible light activity of rare earth metal doped (Er3+, Yb3+ or Er3+/Yb3+) titania photocatalysts. Appl. Catal. B Environ. 2015, 163, 40–49. [Google Scholar] [CrossRef]
- Anik, M.; Cansizoglu, T. Dissolution Kinetics of WO3 in Acidic Solutions. J. Appl. Electrochem. 2006, 36, 603–608. [Google Scholar] [CrossRef]
- Moghazy, M.A. Leidenfrost Green Synthesis Method for MoO3 and WO3 Nanorods Preparation: Characterization and Methylene Blue Adsorption Ability. BMC Chem. 2023, 17, 5. [Google Scholar] [CrossRef]
- Canle, M.; Pérez, M.I.F.; Santaballa, J.A. Photocatalyzed Degradation/Abatement of Endocrine Disruptors. Curr. Opin. Green Sustain. Chem. 2017, 8, 101–138. [Google Scholar] [CrossRef]
- Mazierski, P.; Nischk, M.; Gołkowska, M.; Lisowski, W.; Gazda, M.; Winiarski, M.J.; Klimczuk, T.; Zaleska-Medynska, A. Photocatalytic Activity of Nitrogen-Doped TiO2 Nanotubes Prepared by Anodic Oxidation: The Effect of Applied Voltage, Anodization Time and Amount of Nitrogen Dopant. Appl. Catal. B 2016, 196, 77–88. [Google Scholar] [CrossRef]
- Adhikari, S.; Sarath Chandra, K.; Kim, D.-H.; Madras, G.; Sarkar, D. Understanding the morphological effects of WO3 photocatalysts for the degradation of organic pollutants. Adv. Powder Technol. 2018, 29, 1591–1600. [Google Scholar] [CrossRef]
- Aslam, M.; Ismail, I.M.I.; Chandrasekaran, S.; Hameed, A. Morphology-Controlled Bulk Synthesis of Disc-Shaped WO3 Powder and Evaluation of Its Photocatalytic Activity for the Degradation of Phenols. J. Hazard. Mater. 2014, 276, 120–128. [Google Scholar] [CrossRef] [PubMed]
- Desseigne, M.; Madigou, V.; Coulet, M.-V.; Heintz, O.; Chevallier, V.; Arab, M. Au/WO3 nanocomposite based photocatalyst for enhanced solar photocatalytic activity. J. Photochem. Photobiol. A Chem. 2023, 437, 114427. [Google Scholar] [CrossRef]
- Nishimoto, S.; Mano, T.; Kameshima, Y.; Miyake, M. Photocatalytic water treatment over WO3 under visible light irradiation combined with ozonation. Chem. Phys. Lett. 2010, 500, 86–89. [Google Scholar] [CrossRef]
- Mano, T.; Nishimoto, S.; Kameshima, Y.; Miyake, M. Water Treatment Efficacy of Various Metal Oxide Semiconductors for Photocatalytic Ozonation under UV and Visible Light Irradiation. Chem. Eng. J. 2015, 264, 221–229. [Google Scholar] [CrossRef]
- Rey, A.; Mena, E.; Chávez, A.M.; Beltrán, F.J.; Medina, F. Influence of Structural Properties on the Activity of WO3 Catalysts for Visible Light Photocatalytic Ozonation. Chem. Eng. Sci. 2015, 126, 80–90. [Google Scholar] [CrossRef]
- Figueredo, M.A.; Rodríguez, E.M.; Checa, M.; Beltrán, F.J. Ozone-Based Advanced Oxidation Processes for Primidone Removal in Water Using Simulated Solar Radiation and TiO2 or WO3 as Photocatalyst. Molecules 2019, 24, 1728. [Google Scholar] [CrossRef] [PubMed]
- Aamir, L. Novel p-type Ag-WO3 nano-composite for low-cost electronics, photocatalysis, and sensing: Synthesis, characterization, and application. J. Alloys Compd. 2021, 864, 158108. [Google Scholar] [CrossRef]
- Daghrir, R.; Drogui, P.; Robert, D. Modified Titanium Dioxide for Environmental Photocatalytic Applications: A Review. J. Photochem. Photobiol. A Chem. 2012, 238, 41–52. [Google Scholar] [CrossRef]
- Fernández-Domene, R.M.; Sánchez-Tovar, R.; Lucas-Granados, B.; Muñoz-Portero, M.J.; Ramírez-Grau, R.; García-Antón, J. Visible-Light Photoelectrodegradation of Diuron on WO3 Nanostructures. J. Environ. Manag. 2018, 226, 249–255. [Google Scholar] [CrossRef] [PubMed]
- Roselló-Márquez, G.; Fernández-Domene, R.M.; Sánchez-Tovar, R.; García-Antón, J. Photoelectrocatalyzed degradation of organophosphorus pesticide fenamiphos using WO3 nanorods as photoanode. Chemosphere 2020, 246, 125677. [Google Scholar] [CrossRef] [PubMed]
- Liang, Y.; Lin, S.; Liu, L.; Hu, J.; Cui, W. Oil-in-water self-assembled Ag@AgCl QDs sensitized Bi2WO₆: Enhanced photocatalytic degradation under visible light irradiation. Appl. Catal. B Environ. 2015, 164, 192–203. [Google Scholar] [CrossRef]
- Zhu, Z.; Yan, Y.; Li, J. Preparation of flower-like BiOBr–WO3–Bi2WO6 ternary hybrid with enhanced visible-light photocatalytic activity. J. Alloys Compd. 2015, 651, 184–192. [Google Scholar] [CrossRef]
- Kikuchi, T.; Kawashima, J.; Natsui, S.; Suzuki, R.O. Fabrication of porous tungsten oxide via anodizing in an ammonium nitrate/ethylene glycol/water mixture for visible light-driven photocatalyst. Appl. Surf. Sci. 2017, 422, 130–137. [Google Scholar] [CrossRef]
- Ismail, S.; Ng, C.Y.; Ahmadi, E.; Razak, K.A.; Lockman, Z. Segmented nanoporous WO3 prepared via anodization and their photocatalytic properties. J. Mater. Res. 2016, 31, 721–728. [Google Scholar] [CrossRef]
- Lai, C.W. WO3 nanoplates film: Formation and photocatalytic oxidation studies. J. Nanomater. 2015, 2015, 563587. [Google Scholar] [CrossRef]
- Ou, J.Z.; Rani, R.A.; Balendhran, S.; Zoolfakar, A.S.; Field, M.R.; Zhuiykov, S.; O’Mullane, A.P.; Kalantar-zadeh, K. Anodic formation of a thick three-dimensional nanoporous WO3 film and its photocatalytic activity. Electrochem. Commun. 2013, 27, 128–132. [Google Scholar] [CrossRef]
- Lai, C.W.; Sreekantan, S. Fabrication of WO3 nanostructures by anodization method for visible-light driven water splitting and photodegradation of methyl orange. Mater. Sci. Semicond. Process. 2013, 16, 303–310. [Google Scholar] [CrossRef]
- Zhang, X.; Huo, K.; Hu, L.; Chu, P.K. Fabrication and photocatalytic activity of nanoporous WO3 film. Nanosci. Nanotechnol. Lett. 2010, 2, 51–57. [Google Scholar] [CrossRef][Green Version]
- Watchatenwong, A.; Chanmanee, W.; de Tacconi, N.R.; Chenthamarakshan, C.R.; Kajitvichyanukul, P.; Rajeshwar, K. Anodic growth of nanoporous WO3 films: Morphology, photoelectrochemical response and photocatalytic activity for methylene blue and hexavalent chrome conversion. J. Electroanal. Chem. 2008, 612, 112–120. [Google Scholar] [CrossRef]
- Lai, C.W.; Hamid, S.B.A.; Sreekantan, S. A Novel Solar Driven Photocatalyst: Well-Aligned Anodic WO3 Nanotubes. Int. J. Photoenergy 2013, 2013, 745301. [Google Scholar] [CrossRef]
- Lai, C.W. Photocatalysis and Photoelectrochemical Properties of Tungsten Trioxide Nanostructured Films. Sci. World J. 2014, 2014, 843587. [Google Scholar] [CrossRef] [PubMed]
- Pan, D.; Xiao, S.; Chen, X.; Li, R.; Cao, Y.; Zhang, D.; Pu, S.; Li, Z.; Li, G.; Li, H. Efficient Photocatalytic Fuel Cell via Simultaneous Visible-Photoelectrocatalytic Degradation and Electricity Generation on a Porous Coral-like WO3/W Photoelectrode. Environ. Sci. Technol. 2019, 53, 3697–3706. [Google Scholar] [CrossRef]
- Hao, L.; Li, F.; Hu, T.; Hu, Y.; Zhao, Q.; Guan, S.; Lu, Y. WO3 Films Prepared by Anodic Oxidation in Acid Electrolytes and Their Photocatalytic Activity of Organic Dye Degradation. J. Mater. Sci. Mater. Electron. 2022, 33, 2921–2931. [Google Scholar] [CrossRef]
- Guo, Y.; Quan, X.; Lu, N.; Zhao, H.; Chen, S. High Photocatalytic Capability of Self-Assembled Nanoporous WO3 with Preferential Orientation of (002) Planes. Environ. Sci. Technol. 2007, 41, 4422–4427. [Google Scholar] [CrossRef] [PubMed]
- Martins, A.S.; Guaraldo, T.T.; Wenk, J.; Mattia, D.; Zanoni, M.V.B. Nanoporous WO3 Grown on a 3D Tungsten Mesh by Electrochemical Anodization for Enhanced Photoelectrocatalytic Degradation of Tetracycline in a Continuous Flow Reactor. J. Electroanal. Chem. 2022, 920, 116617. [Google Scholar] [CrossRef]


Disclaimer/Publisher’s Note: The statements, opinions and data contained in all publications are solely those of the individual author(s) and contributor(s) and not of MDPI and/or the editor(s). MDPI and/or the editor(s) disclaim responsibility for any injury to people or property resulting from any ideas, methods, instructions or products referred to in the content. |
© 2025 by the authors. Licensee MDPI, Basel, Switzerland. This article is an open access article distributed under the terms and conditions of the Creative Commons Attribution (CC BY) license (https://creativecommons.org/licenses/by/4.0/).