Abstract
Tetraethoxy orthosilicate (TEOS) was used not only as a precursor of silica, but also as an agent which reinforces the skeleton of silica-gel to prepare an aerogel and resultant silica and silica-alumina with large pore size and pore volume. In this gel skeletal reinforcement, the strength of silica aerogel skeleton was enhanced by aging with TEOS/2-propanol mixed solution to prevent the shrink of the pores. When silica aerogel was reinforced by TEOS solution, the pore diameter and pore volume of calcined silica could be controlled by the amount of TEOS solution and reached 30 nm and 3.1 cm3/g. The results from N2 adsorption measurement indicated that most of pores for this silica consisted of mesopores. Silica-alumina was prepared by the impregnation of an aluminum tri-sec-butoxide/2-butanol solution with obtained silica. Mixed catalysts were prepared by the combination of β-zeolite (26 wt%) and prepared silica-aluminas with large mesopore (58 wt%) and subsequently the effects of their pore sizes on the catalytic activity and the product selectivity were investigated in catalytic cracking of n-dodecane at 500 °C. The mixed catalysts exhibited not only comparable activity to that for single zeolite, but also unique selectivity where larger amounts of branched products were formed.
1. Introduction
In recent years, excess amounts of heavy oils are coming out and their utilization has been one of the problems. The major treatment process of those heavy oils is catalytic cracking, which produces high octane gasoline with a lower sulfur content. In general, a desulfurization unit is put after the FCC (Fluid Catalytic Cracking) unit, in order to decrease the sulfur content, because sulfur regulation in gasoline is very severe: less than 10 ppm. However, the octane number decreases because this unit decreases the olefin content. To overcome this situation the production of a larger amount of branched products is effective because such products have higher octane numbers and do not decrease the octane number by the insertion of a desulfurization unit. Therefore, the development of novel catalysts which have high selectivity for branched products in catalytic cracking has been needed [1,2]. It is well known that catalysts in FCC generally include not only zeolite as a major component but also silica-alumina as a matrix [3]. Although zeolite is a very active catalyst [4], the pore size of zeolite is relatively small. The pores of zeolite, which mainly consist of micropores, are disadvantageous to carry and diffuse hydrocarbons with large molecular structures, such as vacuum gas oil or atmospheric residue [5,6]. Although silica-alumina is used to control the activity of zeolite or selectivity of catalytic cracking reactions, there are fewer academic studies of silica-alumina than those of zeolite in this field [1,2,7,8,9,10]. Recently, we have reported that silica-aluminas with about 5 nm of mesopore prepared using malic acid influence the production of branched hydrocarbons in catalytic cracking of n-dodecane [1,2]. Hosseinpour et al. [9], and Q. Tang et al. [10], have also reported the matrix effect. However, these reports are not enough to understand the role of the matrix in catalytic cracking.
On the other hand, the sol-gel method of preparing various inorganic materials has been extensively studied [11], and, among them, much attention has been focused on the preparation of silica and silica-alumina aerogels because of their large surface area, high porosity, low bulk density, extremely low thermal conductivities etc. [12,13,14,15,16,17]. In the preparation of these materials, supercritical or subcritical conditions [12,13,14,15,16] and alkoxysilylation [14,15] or methylsilylation [17,18,19] are used to inhibit the extensive shrinkage of large pores at the removal process of entrapped solvent from the wet gel. In particular, alkoxysilylation and methylsilylation are promising methods because they can produce aerogels at ambient pressure by inhibiting rapid hydrolysis and the successive condensation which leads to pore shrinkage. Although these methods include the concept of the gel skeletal reinforcement as a major effect, the importance of this concept was not necessarily stressed and has not been described in detail. Further, most of these reports are related to the preparation of bulk materials and there are very few reports where prepared extremely large mesopores have been utilized for various catalyses or as supports for catalysts.
In the previous report, we examined whether only the gel skeletal reinforcement was needed to make silica aerogels with extremely large mesopores, or whether the subcritical condition, using a rigidly sealed container, would also be needed simultaneously with the gel skeletal reinforcement. It was demonstrated that the very large mesopore could be made using only the gel skeletal reinforcement without the subcritical condition [20]. However, the method to control the pore size of large mesopores has not been established yet. The purpose of this research is to control the pore size of silica and silica-alumina by the gel skeletal reinforcement and to prepare large mesopore materials which promote the rapid diffusion of molecules and the preferential formation of branched hydrocarbons when used in catalytic cracking as matrices. In the gel skeletal reinforcement, the strength of the silica gel skeleton was effectively enhanced by aging with a TEOS/2-propanol mixed solution with inhibition of pore shrinkage. Consequently, the silicas with large mesopore were prepared, and their pore sizes were controlled by the amount of the TEOS/2-propanol solution. Their catalytic properties—that is, the effects of the presence of such a large mesopore on the activity and product selectivity in the catalytic cracking of n-dodecane—were investigated. A preliminary result appears in the literature [21].
2. Experimental Section
2.1. Preparation of a Catalyst
The reagents for the preparation of the gel were tetraethyl orthosilicate (min. 95%(GC), TEOS, Nacalai Tesque Co. Ltd.), aluminum tri-sec-butoxide (min.98%, ASB, Tokyo Kasei Kogyo Co. Ltd.), ion-exchange water (prepared with Auto still AW 200, Yamato Co. Ltd.) and 2-propanol (GR, Nacalai Tesque Co. Ltd.).
Silica-alumina was synthesized by the acid-base-catalyzed sol-gel process, including the gel skeletal reinforcement according to the flow chart in Figure 1. A typical method was as follows: TEOS was used as a silica precursor. Into the TEOS (16.56 g)/2-propanol (19.06 g) solution, 0.1 wt% HCl (23.24 g) at 25 °C was added, and the mixture was stirred for 30min in the sealed bottle. After pH of the solution was adjusted to 5 by adding aqueous NH3 solution, the gelation was performed at 50 °C. After gelation, temperature was maintained for 5 h. Then the gel was immersed in deionized water at 50 °C for 24 h. After that, the gel was taken out of the water. The gel was cut into fragments of a few millimeters and washed with 2-propanol for 5 min, five times at 50 °C, to thoroughly remove the remaining water in the pores. After that, the gel was maintained in 80% TEOS/20% 2-propanol solution at 50 °C for 48 h. The weight ratio of TEOS for the gel skeletal reinforcement in this solution was 100, 200 or 362 for 100 of TEOS silica precursor. That is: 100 means that the amount of TEOS in the reinforcement solution was the same as the amount of TEOS silica precursor. 80% TEOS/20% 2-propanol reinforcement solution was removed and the reinforced gel was washed with 2-propanol for 5 min, five times at 50 °C to remove the remaining 80% TEOS/20% 2-propanol solution. After maintaining the obtained gel at 70 °C for 72 h, the silica-gel was calcined at 600 °C for 3 h. Aluminum species was introduced into the prepared silica using 2-butanol solution of ASB by impregnation to form 5 wt% Al2O3 in silica-alumina after successive calcination at 600 °C for 3 h. Synthesized silica-alumina was mixed with alumina sol (as an alumina binder, Cataloid AP-1, Shokubai Kasei), β-zeolite (SiO2/Al2O3 (mol/mol) 37, Na2O 0.1 wt%, crystal size 0.05 micrometer, mean particle size 5 micrometer, cation type H+, HSZ-940HOA, Tosoh Co. Ltd.) and 2-propanol. It was shaped into a cylindrical pellet (diameter 0.5 mm, length <2 mm) after kneading. The prepared pellets were calcined at 600 °C for 3 h. The amounts of silica-alumina, alumina from the binder, and zeolite in the mixed catalyst were 58, 16 and 26 wt%, respectively.
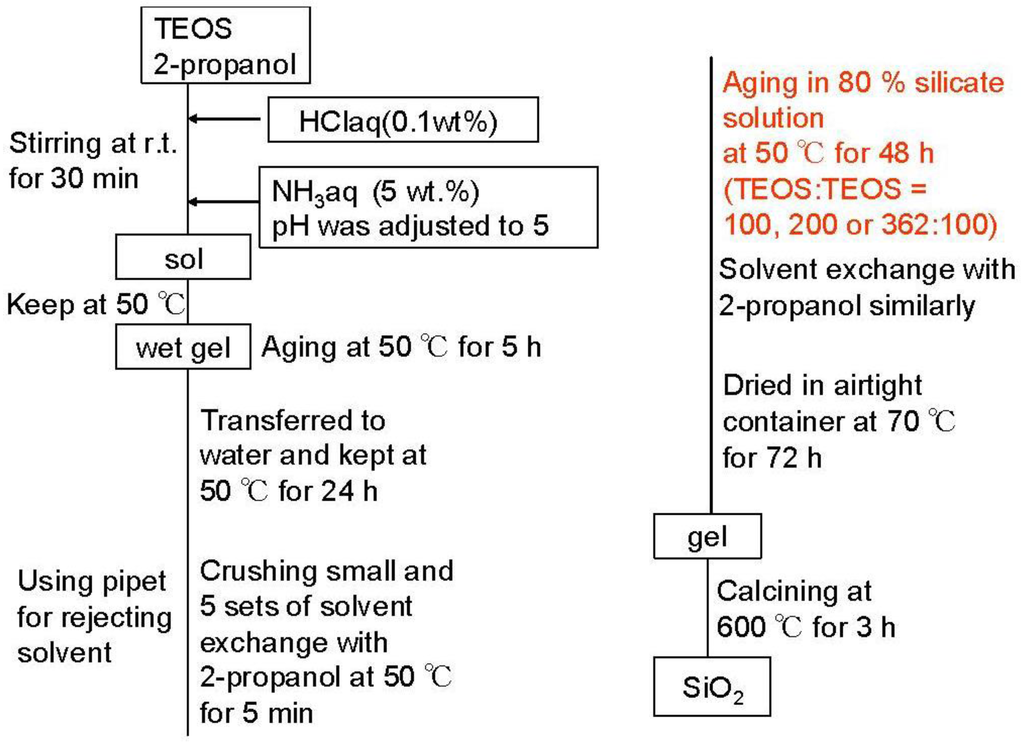
Figure 1.
Flowchart for preparation of SiO2.
Figure 1.
Flowchart for preparation of SiO2.

In naming of samples, the weight ratio of 100, 200 or 362 of reinforcing TEOS against 100 of TEOS silica precursor was represented in front of SiO2. For silica-alumina samples, SA was used instead of SiO2. For the mixed catalyst with zeolite and the binder, MAT- was represented in front of sample name of SA.
2.2. Characterization of a Catalyst
XRD: X-ray diffraction patterns of the samples were obtained on a Rigaku RAD-C diffractometer using nickel-filtered CuKα X-ray source radiation (λ = 1.5405 Å) and operated at 40 kV and 100 mA under the following conditions: scan mode CONTINUOUS, slit (SS)1°(DS)1°(RS)0.3 mm, present time 1 s, scan speed 2°/min, measurement range 2θ = 10–70°.
N2 adsorption: The N2 adsorption measurement of a calcined sample was performed using a BELSORP mini II (Nihon BEL Co. Ltd.). Total surface area, pore volume and pore distribution were calculated by the BET methods. To estimate those for mesopore, the BJH method was used. The sample was degassed under 10−2 kPa at 350 °C for 3 h before N2 adsorption measurement.
NH3 adsorption: The amount of NH3 adsorption was measured by the pulse method using GC-TCD in order to determine the amount of acid sites and the dispersion of Al. 0.04 g of a calcined sample was packed into a fixed bed reactor, heated to 600 °C at a heating rate of 10°C/min under 60 mL/min He stream and held for 3 h. After that, the reactor was cooled to 100 °C and 1.5 cc of NH3 pulse was introduced using a six-way valve until the amount of NH3 detected became constant. Temperature programmed desorption (TPD) of adsorbed NH3 was measured by heating the catalyst to 600 °C at a heating rate of 10 °C/min under 60 mL/min He stream.
TEM: TEM images were measured using H-9000 (Hitachi).
2.3. Catalytic Cracking Reaction
The activity of a catalyst and the selectivity of products in catalytic cracking of n-dodecane were investigated. The typical procedure is as follows: 1 g of catalyst was packed into a fixed-bed reactor (stainless tube, length 30 cm, inner diameter 8 mm, outer diameter 10 mm). The detail reaction apparatus has been described elsewhere [1,2]. The glass wool and quartz sand were packed in the upper and lower sides of the catalyst. The reactor was heated to 500 °C at a heating rate of 10°C/min under 30 mL/min of N2 stream. After stopping the N2 stream, n-dodecane was introduced at a rate of 1.1 mL/min for 80 s. After that, 30 mL/min of N2 was introduced again at 500 °C for 20 min. Liquid products were collected in a cold trap at −10 °C (for silica-alumina single use) or −50 °C (for zeolite single use or a mixed catalyst with zeolite). Gas products were collected into the tedlar bag with N2. The liquid and gas products were analyzed by GC-FID (Shimadzu GC-2014). Measurement conditions were as follows: injection temperature 250 °C, detector temperature 320 °C, ATTN 1, injection press. 158 kPa, column flow 1.56 mL/min, line spread 27.64 cm/s, total flow 320 mL/min, split ratio 200, column BP-1, column length 60 m, column diameter 0.25 mm, film thickness 0.5 micrometer, column initial temp 0 °C 16 min, heating rate 2°C/min, final temp 228 °C, liquid sample 0.2 microliter, gas sample 0.5 mL. Referring to JIS K 2536-2 and the analyses of the standard gasoline supplied from the Japan Petroleum Institute and the standard hydrocarbon gases supplied from GL science Co. Ltd. enabled the determination of all products. Most products were smaller than n-dodecane. The amount of coke on a used catalyst was measured from its weight loss after calcination at 500 °C for 12 h. The minimum conversion was estimated by the amount of recovered products against the feed amount of n-dodecane for all the catalysts.
3. Results and Discussion
3.1. Characterization of Silicas and Silica-Aluminas with Large Mesopore
Figure 2 shows the XRD patterns of zeolite, mixed catalysts and silica-aluminas. There is no peak in XRD patterns of synthesized silica and silica-alumina, and it was confirmed that they were amorphous. XRD patterns of the mixed catalysts showed the peaks of zeolite, indicating that the crystal structure of zeolite was maintained. Results from N2 adsorption are summarized in Table 1. Figure 3 shows the N2 adsorption-desorption isotherms. When the gel was not reinforced (0SiO2), resultant SiO2 showed the typical IV type isotherm, indicating that mesopore has been formed. When the gel was reinforced (100, 200 or 362SiO2), a resultant SiO2 showed an isotherm between IV type and III type. There was hysteresis in the isotherm, indicating that mesopore has also been formed, although the adsorption ability for an adsorbent may be lower than that of 0SiO2. H When silica-gel was reinforced by TEOS solution, silica with large mesopores was prepared. For example, BJH surface area, pore volume and pore diameter (PD) for 100SiO2 were 721 m2/g, 2.51 cm3/g and 18.5 nm, respectively, and were maintained after impregnation of Al species. Without the gel skeletal reinforcement, these three values were 703 m2/g, 1.30 cm3/g and 7.1 nm (PD), respectively. The porosity of the material can be increased considerably by removing water completely before aging in 2-propanol solvent. However, surface areas, pore volumes and pore diameters of silica and silica-alumina prepared with the gel skeletal reinforcement were considerably large compared with those for conventional silica and silica-alumina. For example, three values of ref.SA (JRC-SAH-1 supplied from Catalysis Society of Japan), which is prepared by a conventional method using water glass and aluminum sulfate, were 537 m2/g, 0.86 cm3/g, and 6.2 nm(PD), respectively.
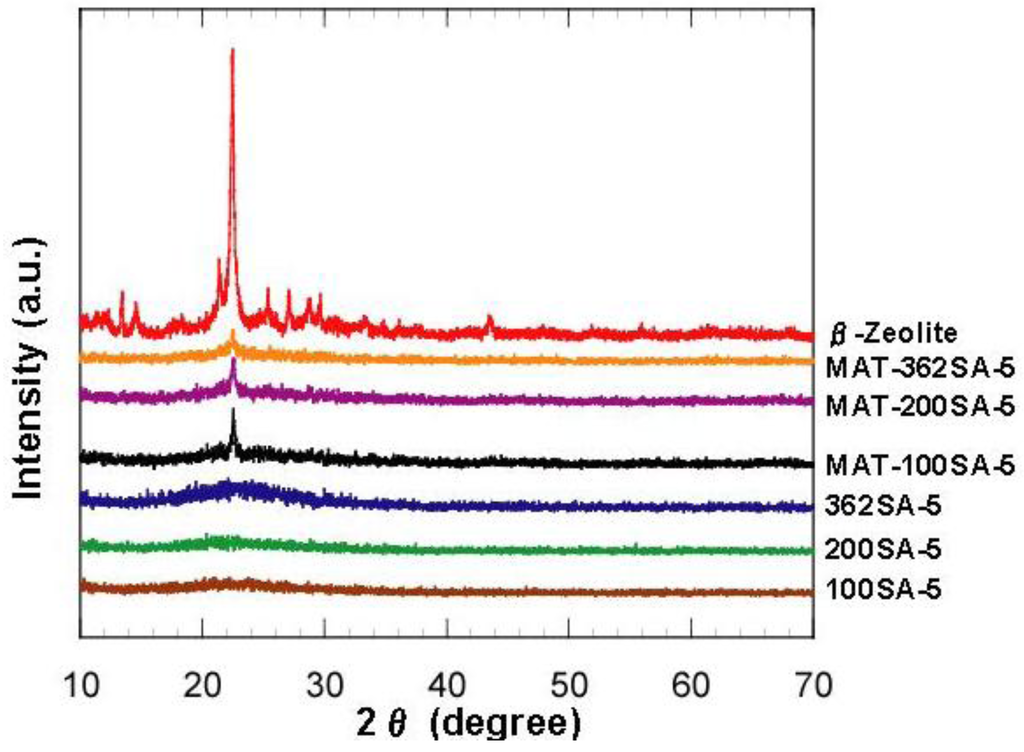
Figure 2.
XRD patterns of zeolite, mixed catalysts and silica-aluminas.
Figure 2.
XRD patterns of zeolite, mixed catalysts and silica-aluminas.


Table 1.
Surface areas, pore volumes and pore diameters of silica, silica-alumina, zeolite and mixed catalysts. In naming samples, the weight ratio of 100, 200 or 362 of reinforcing TEOS against 100 of TEOS silica precursor was represented in front of SiO2. For silica-alumina samples, SA was used instead of SiO2. For the mixed catalyst with zeolite and the binder, MAT- was represented in front of sample name of SA.
| Catalyst | BET | BJH | |||||
|---|---|---|---|---|---|---|---|
| Surface area (m2/g) | Pore volume (cm3/g) | Pore diameter (nm) | Surface area (m2/g) | Pore volume (cm3/g) | Pore diameter (nm) | ||
| 0SiO2 | 837 | 1.43 | 6.8 | 703 | 1.3 | 7.1 | |
| 100SiO2 | 754 | 2.57 | 13.7 | 721 | 2.51 | 18.5 | |
| 200SiO2 | 598 | 2.94 | 19.7 | 578 | 2.9 | 28.3 | |
| 362SiO2 | 588 | 3.14 | 21.4 | 555 | 3.09 | 32.6 | |
| 100SA-5 | 737 | 2.49 | 13.5 | 719 | 2.43 | 18.5 | |
| 200SA-5 | 569 | 3.11 | 21.8 | 634 | 3.08 | 28.3 | |
| 362SA-5 | 621 | 3.04 | 19.6 | 560 | 2.96 | 28.3 | |
| MAT-100SA-5 | 567 | 1.5 | 10.6 | 467 | 1.42 | 12.1 | |
| MAT-200SA-5 | 530 | 1.6 | 12.1 | 394 | 1.52 | 24.5 | |
| MAT-362SA-5 | 512 | 1.8 | 14.1 | 376 | 1.7 | 32.6 | |
| ref.SA | 457 | 0.87 | 7.6 | 537 | 0.86 | 6.2 | |
| beta-Zeolite | 613 | 0.32 | 2.1 | 24 | 0.07 | 3.3 | |
| MAT-(ref.SA) | 765 | 0.64 | 5.7 | 340 | 0.57 | 6.2 | |

Figure 3.
N2 adsorption-desorption isotherm. (a) Silica; (b) Silica-alumina.
Figure 3.
N2 adsorption-desorption isotherm. (a) Silica; (b) Silica-alumina.

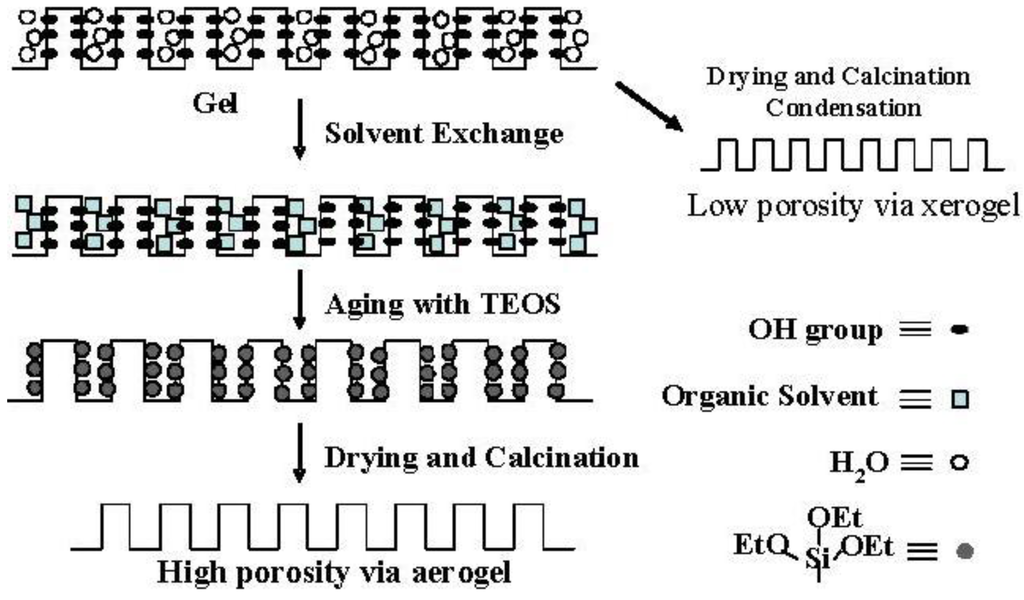
Figure 4.
Conceptual scheme of the gel skeletal reinforcement.
Figure 4.
Conceptual scheme of the gel skeletal reinforcement.


Figure 5.
BJH pore-size distribution of silica and silica-alumina. Solid line: silica; Dotted line: silica-alumina; rp: pore radius.
Figure 5.
BJH pore-size distribution of silica and silica-alumina. Solid line: silica; Dotted line: silica-alumina; rp: pore radius.
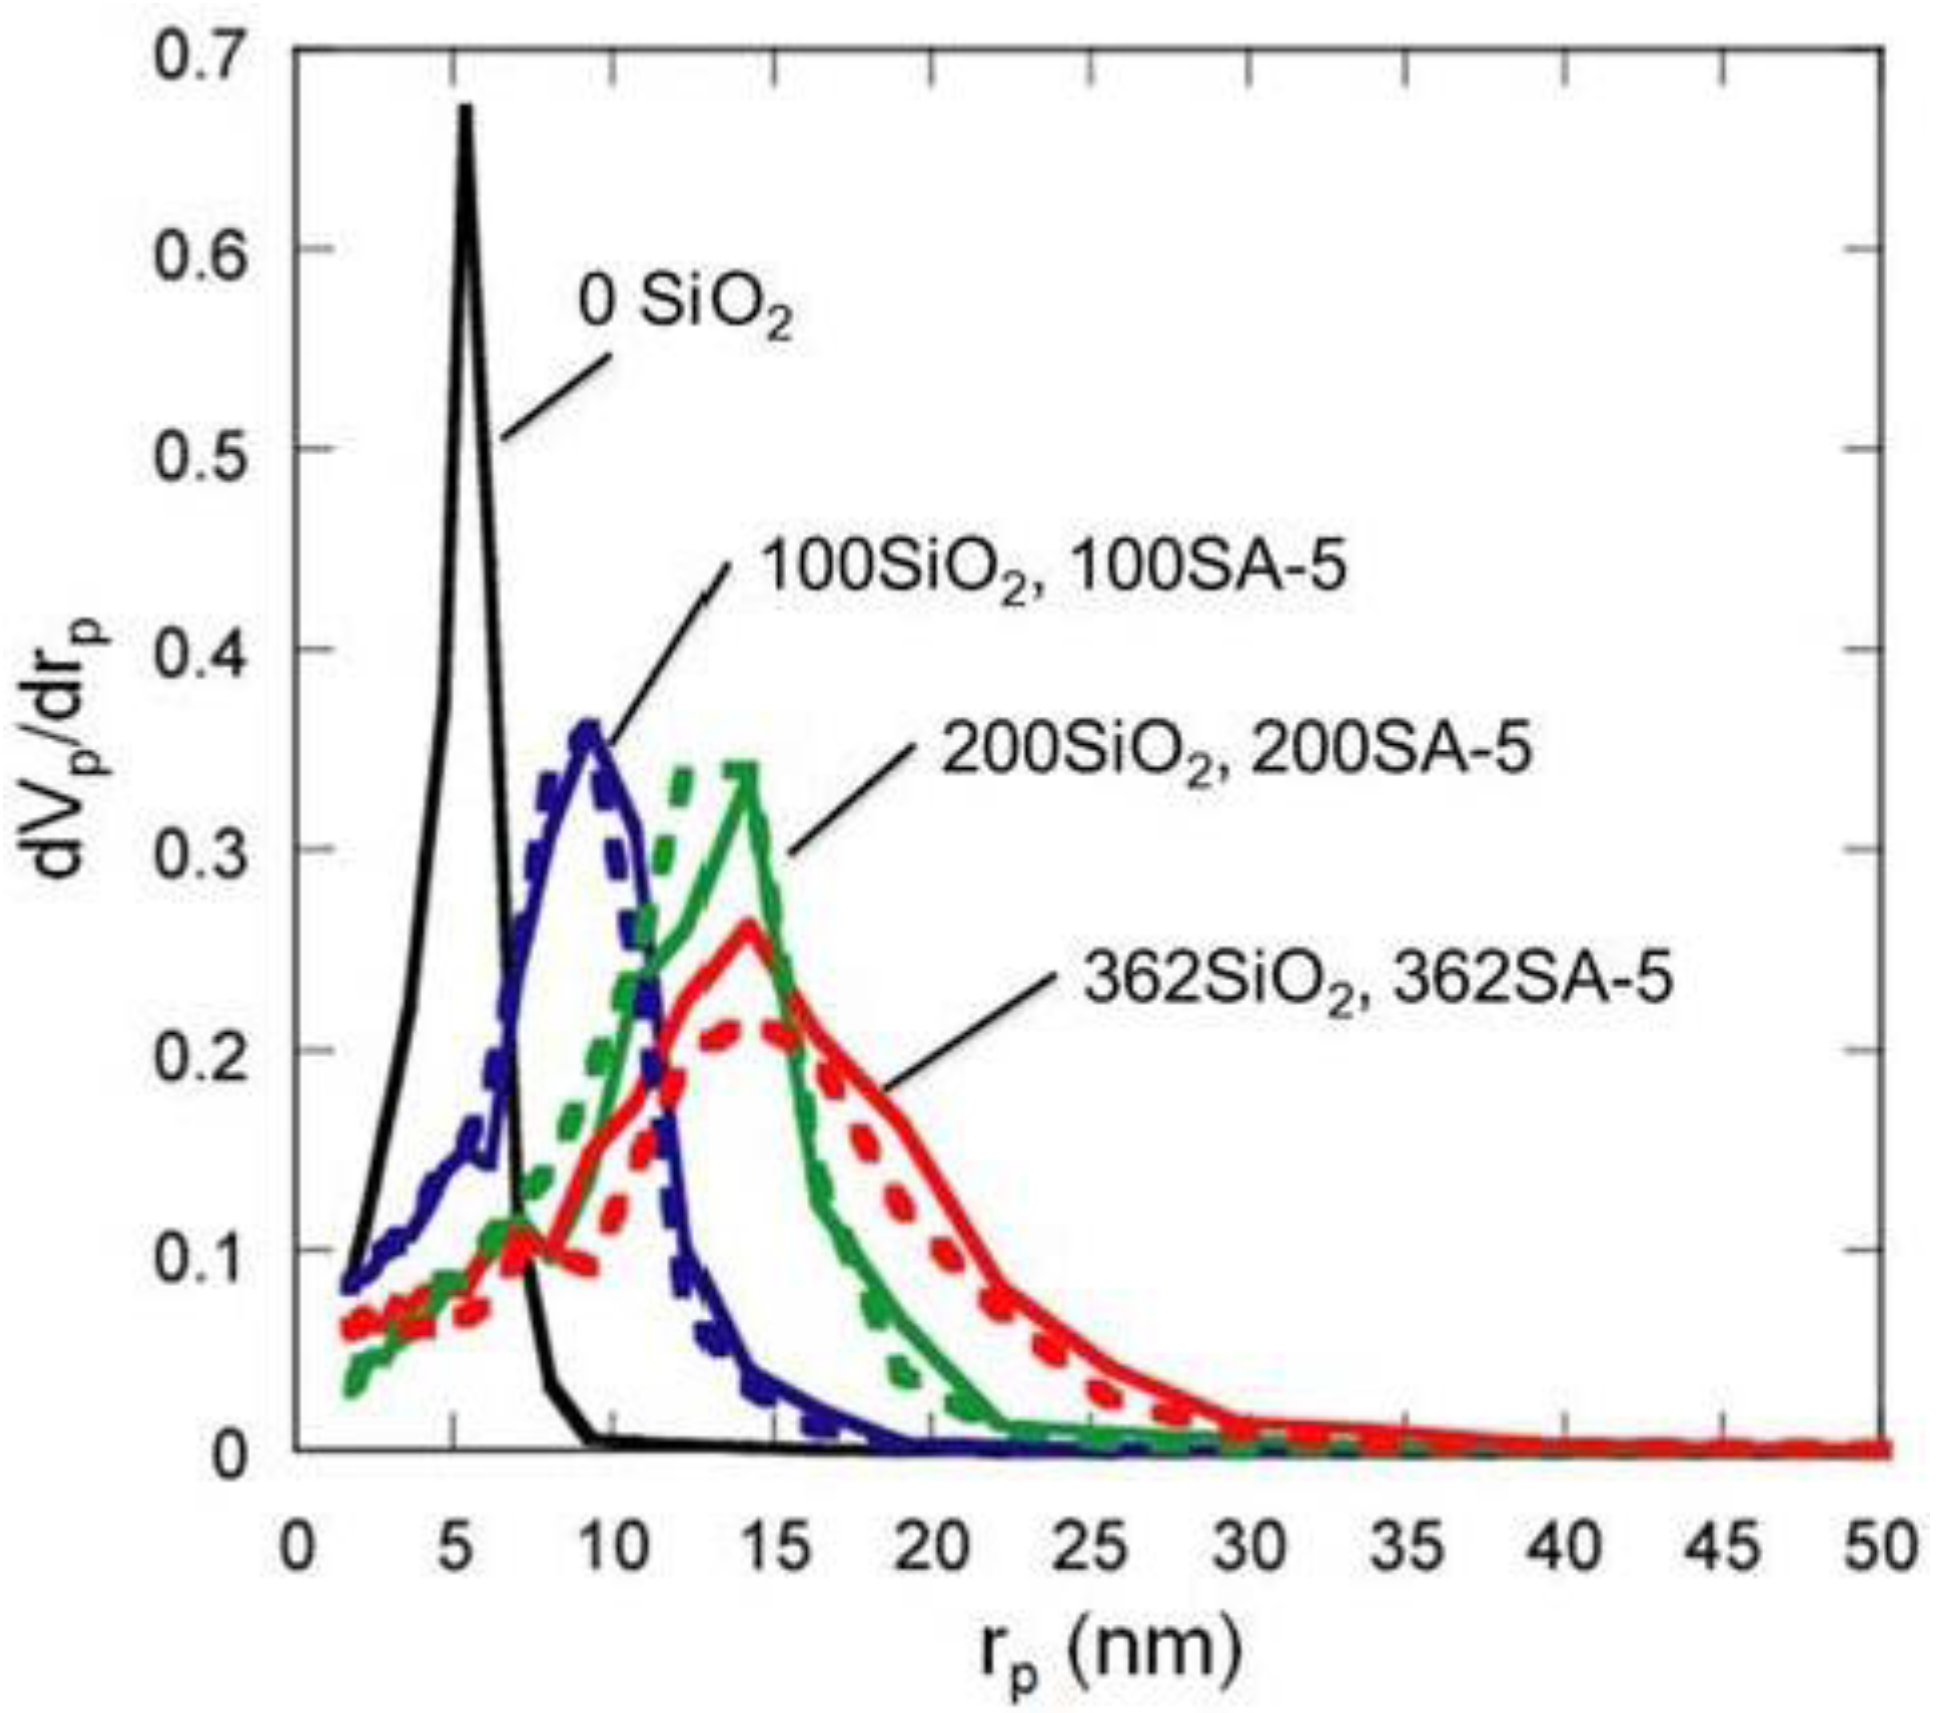

Figure 6.
Comparison of BJH pore-size distribution for silica-alumina, mixed catalyst and zeolite. rp: pore radius.
Figure 6.
Comparison of BJH pore-size distribution for silica-alumina, mixed catalyst and zeolite. rp: pore radius.
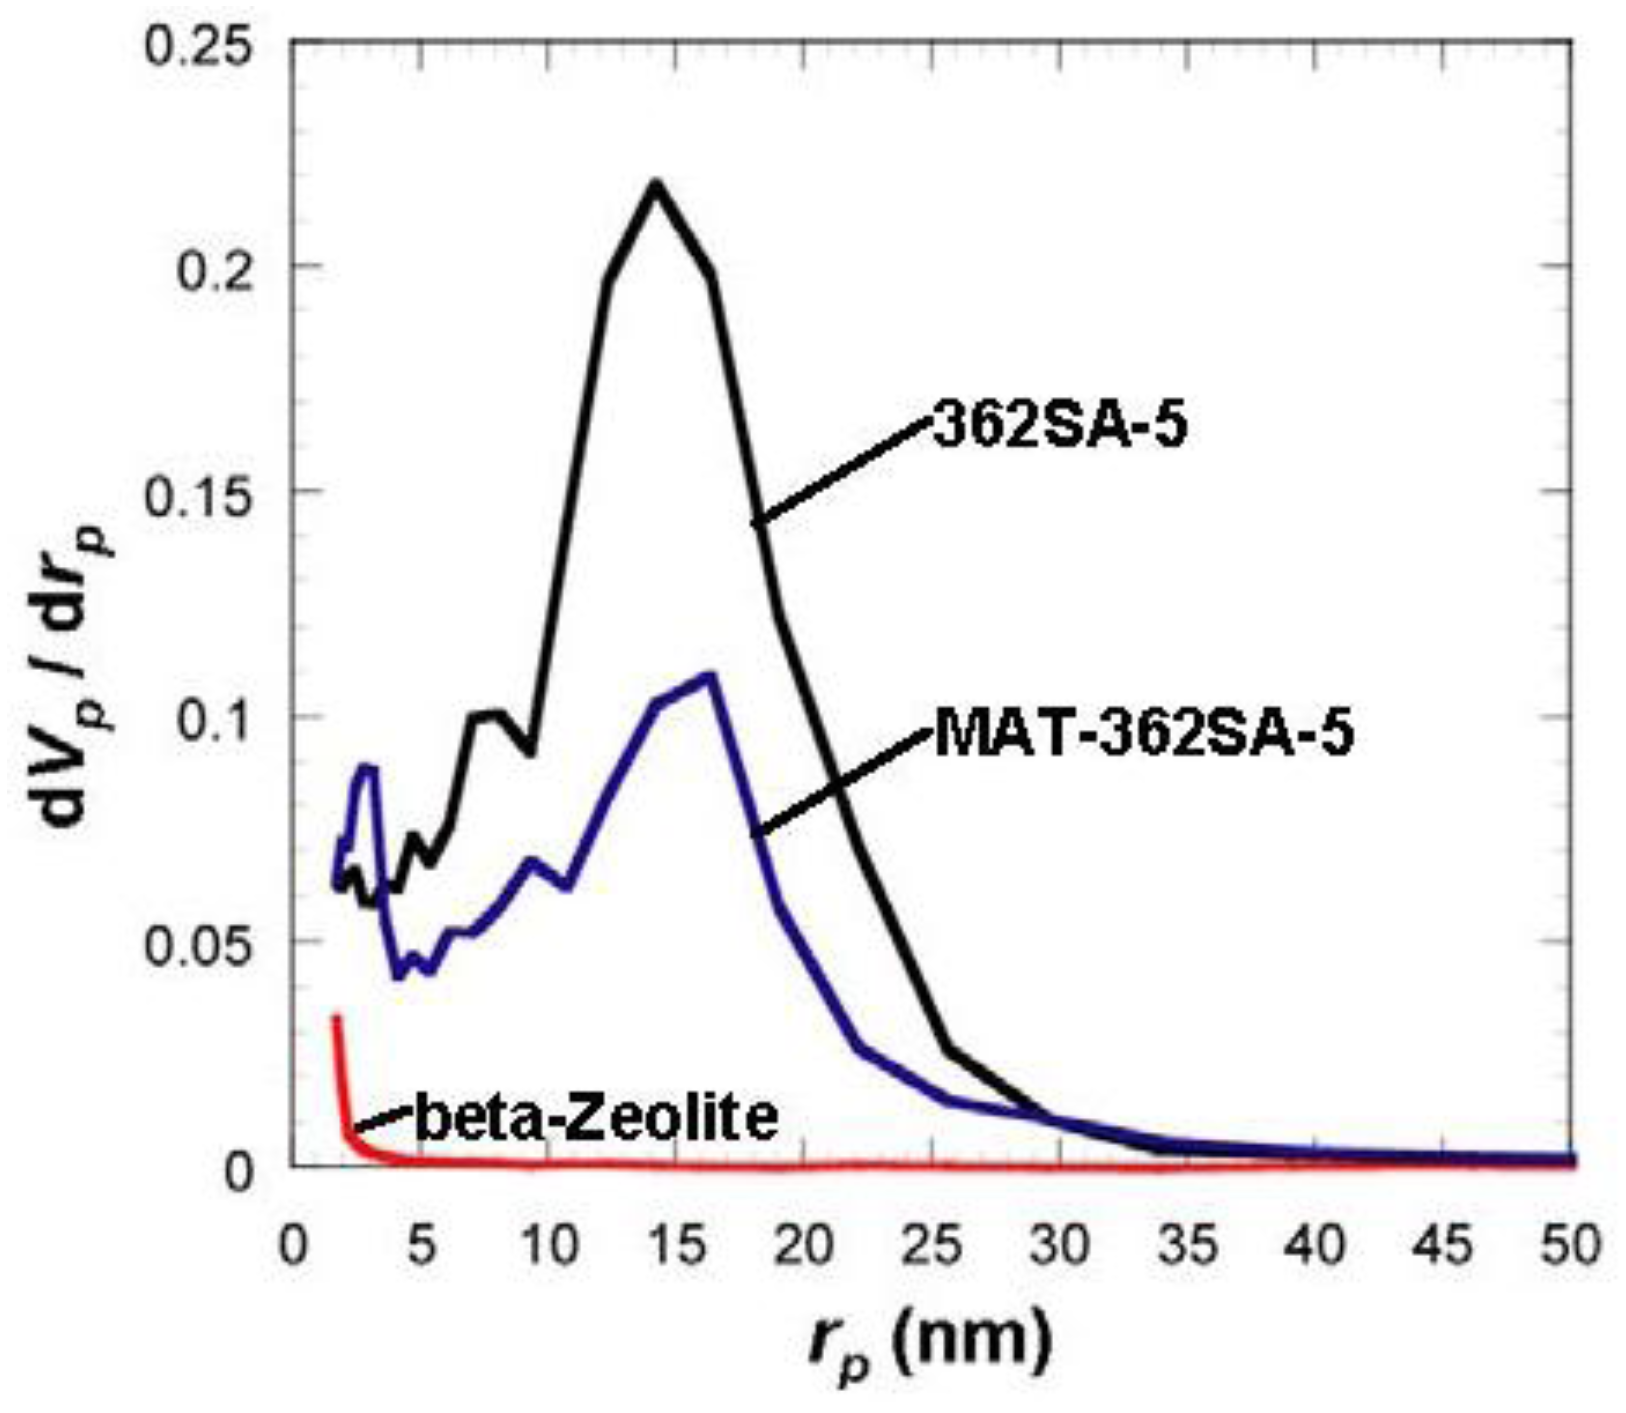
Although the Ostwald ripening effect to strengthen a gel surface is often described [12,13,14,15,16,17,18,19], our results suggest that the thorough removal of water in the inside of the gel and the gel skeletal reinforcement are essential for making large mesopores. Figure 4 shows the conceptual scheme of the gel skeletal reinforcement. The thorough removal of water in the inside of the gel in solvent exchange inhibits the hydrolysis of reinforcing TEOS/2-propanol solution. The surface silanol is modified by TEOS to form the new surface covered by triethoxysilyl groups which inhibit the further condensation of the gel skeletal structure in the absence of water. Surface areas and pore volumes by the BET method were almost the same as those by the BJH method, indicating that most pores of silicas and silica-aluminas prepared by the gel skeletal reinforcement consist of mesopores. Figure 5 shows the BJH pore size distribution of silica and silica-alumina. Silica and silica-alumina had larger and broader pore size distribution with increasing amounts of TEOS solution for reinforcement. When 362 wt% TEOS was used for reinforcement, the pore volume and pore diameter measured by the BJH method reached about 3 cm3/g and 30 nm, respectively. To our knowledge, such high values for materials calcined at 600 °C for 3 h have never been obtained with any other methods. Although some papers reported higher porosity of materials [6,7,8], thermal histories for the materials were about 200 °C even at maximum, which is much lower than our condition: 600 °C for 3 h. When silica-aluminas were mixed with zeolite and alumina sol (binder), surface areas and pore volumes of mesopores measured by the BJH method decreased; however almost the same pore diameters and pore distributions were maintained, as shown in Figure 6.
3.2. Catalytic Cracking Performance of the Mixed Catalysts with Zeolite
The catalytic cracking was performed and the results are shown in Table 2. Figure 7 and Figure 8 show the yields for paraffins, olefins, naphthenes and aromatics on catalytic cracking, and the distribution of carbon numbers on catalytic cracking, respectively. The conversion of n-dodecane with single zeolite was 84%, and the yield of paraffins was much larger than those of olefins and aromatics as shown in Figure 7. This shows that significant hydrogen transfer to olefins in the formation of aromatics proceeded. When silica-alumina was used in cracking of n-dodecane, the conversion was only a few percent and the selectivity for olefin was rather high for each catalyst (see supplemental materials). The results show that the ability of cracking and hydrogen transfer in the catalytically active sites is limited to an extremely low level for single silica-alumina. When mixed catalysts were prepared with zeolite and silica-alumina with large mesopore, the comparable activities were obtained in cracking of n-dodecane, although the mixed catalyst included only 26 wt% of zeolite. The conversion of dodecane for the mixed catalyst, MAT-362SA-5, was 83%, which was almost the same as that for single zeolite, indicating that the presence of larger mesopores in the mixed catalyst promoted the diffusion of reactant molecules effectively. As shown in Figure 7, the difference between the product distributions of the mixed catalysts and the single zeolite was not so large although the yield of paraffins for the mixed catalysts was slightly less than that of the single zeolite. To clarify the difference between the mixed catalysts and the single zeolite or the mixed catalyst using a conventional silica-alumina (refSA), the product distribution of gas (C1-C4) and gasoline (C5-C11) fractions and some parameters in the gasoline fraction were compared and the results are summarized in Table 2. In the mixed catalysts using the gel skeletal reinforcement, MAT-100SA-5 and MAT-200SA-5, the distribution of gasoline increased although the conversions slightly decreased. The product distribution of the mixed catalyst, MAT-362SA-5, was very similar to that of single zeolite, probably because the conversion was similar to that of a single zeolite. However, the major differences were observed in the yields of multi-branched products and single-branched products (Table 2) and the ratio of those yields (m/s) (Figure 9) for the mixed catalysts, which are important factors to increase the research octane number (RON) [1]. In particular, the m/s ratios of the mixed catalysts using the gel skeletal reinforcement were much larger than those for single zeolite and the mixed catalyst with conventional silica-alumina (Figure 9). The approximate linear relationship can be found between the m/s ratios and the values of pore diameters of these catalysts in Figure 9. These results suggest that the presence of larger mesopores in the matrix of the cracking catalysts would promote not only the diffusion of reactant molecules to approach acid sites of zeolite and to produce bulky branched products, but also the effective elimination of the branched products to prevent the excess cracking of those products.
Table 2.
Product distribution and catalytic properties of catalyst. Temperature 500 °C, Catalyst 1 g, n-dodecane, 1.3 mL/min, 80 s, WHSV 58.5 h−1.
| Catalyst | Product distribution (%) | Parameters in gasoline fraction | |||||||
|---|---|---|---|---|---|---|---|---|---|
| C1-C4 | Gasoline (C5-C11) | C12- | Conv. (%) | NH3b (10−4 mol/g) | Olefin/Paraffin | iso-/n- | Yield of single branch (%) | Yield of multi branch (%) | |
| beta-Zeolite | 58 | 42 | 0.5 | 84(90) | 6.2(8.9) | 0.46 | 2.2 | 19 | 1.2 |
| MAT (ref.SA) | 47 | 53 | 0.6 | 78(81) | 5.8(8.4) | 0.76 | 1.9 | 21 | 1.8 |
| MAT-100SA-5 | 38 | 62 | 0.2 | 60(62) | 5.1(4.9) | 0.67 | 2 | 21 | 2.4 |
| MAT-200SA-5 | 41 | 58 | 0.5 | 73(75) | 5.4(4.9) | 0.55 | 2.4 | 23 | 3 |
| MAT-362SA-5 | 56 | 44 | 0.1 | 83(85) | 4.1(4.7) | 0.58 | 2 | 19 | 3 |
a Total conversions including coke appear in parentheses; b Measured by NH3 TPD. The amounts of NH3 adsorbed by a pulse method appear in parentheses.

Figure 7.
Yields for Paraffins, Olefins, Naphthenes and Aromatics on catalytic cracking. Temperature 500 °C, Catalyst 1 g, n-dodecane 1.3 mL/min, 80 s, WHSV 58.5 h−1.
Figure 7.
Yields for Paraffins, Olefins, Naphthenes and Aromatics on catalytic cracking. Temperature 500 °C, Catalyst 1 g, n-dodecane 1.3 mL/min, 80 s, WHSV 58.5 h−1.
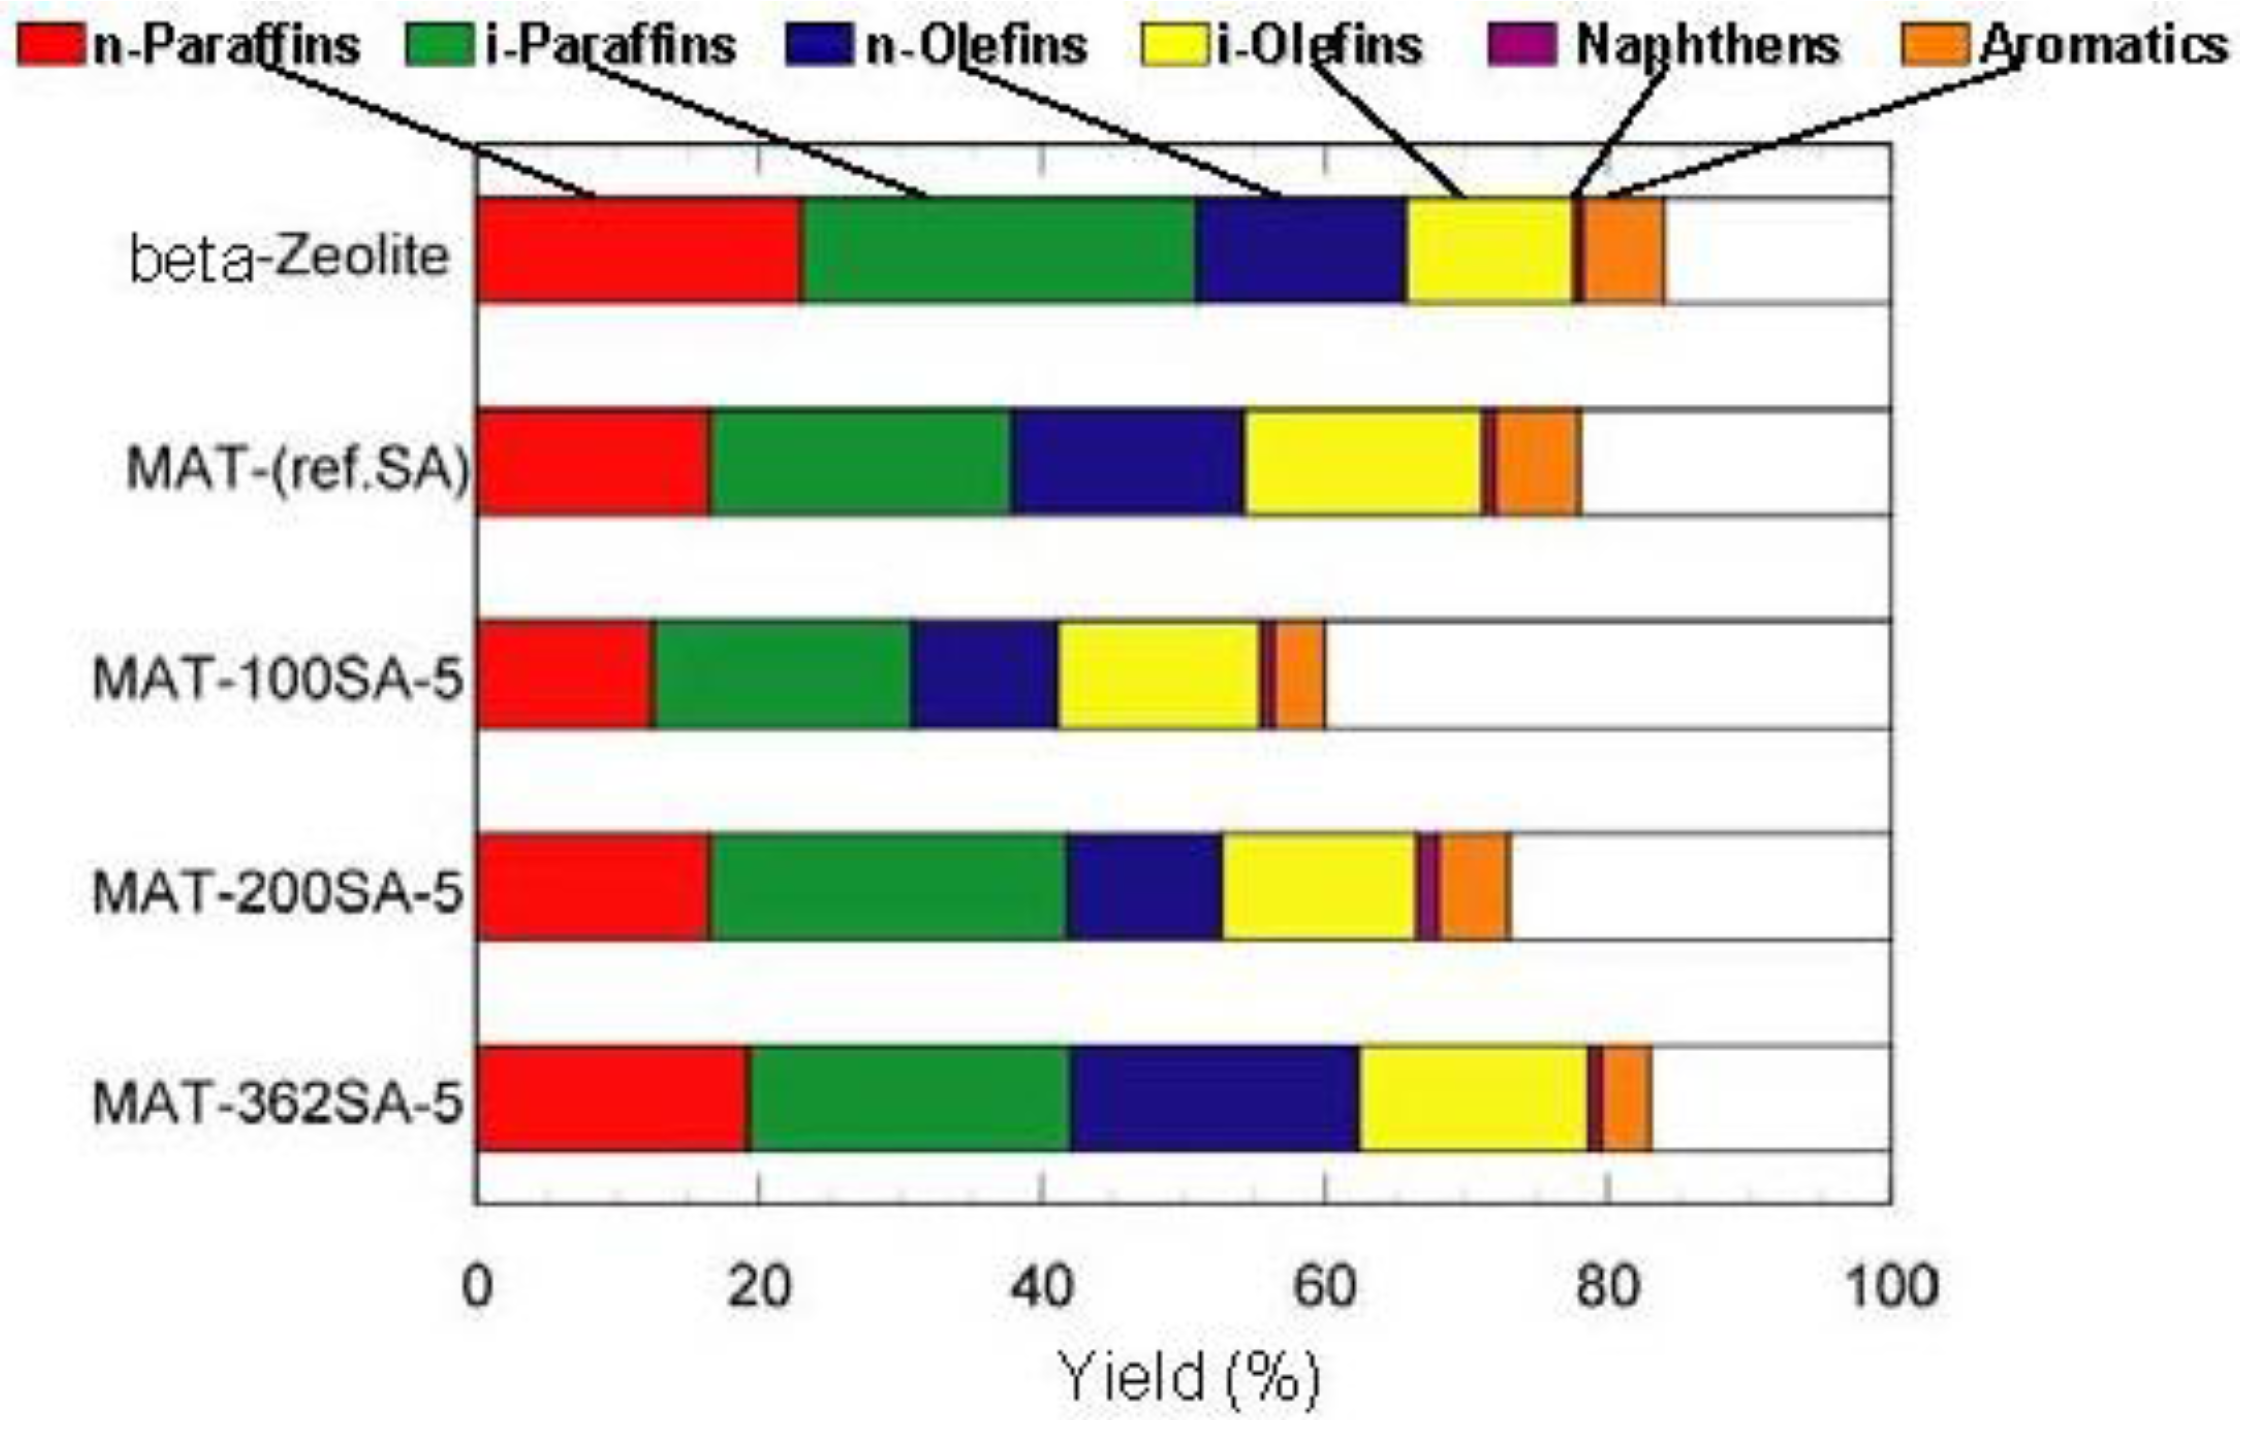

Figure 8.
Distribution of carbon numbers on catalytic cracking. Temperature 500 °C, Catalyst 1 g, n-dodecane 1.3 mL/min, 80 s, WHSV 58.5 h−1.
Figure 8.
Distribution of carbon numbers on catalytic cracking. Temperature 500 °C, Catalyst 1 g, n-dodecane 1.3 mL/min, 80 s, WHSV 58.5 h−1.
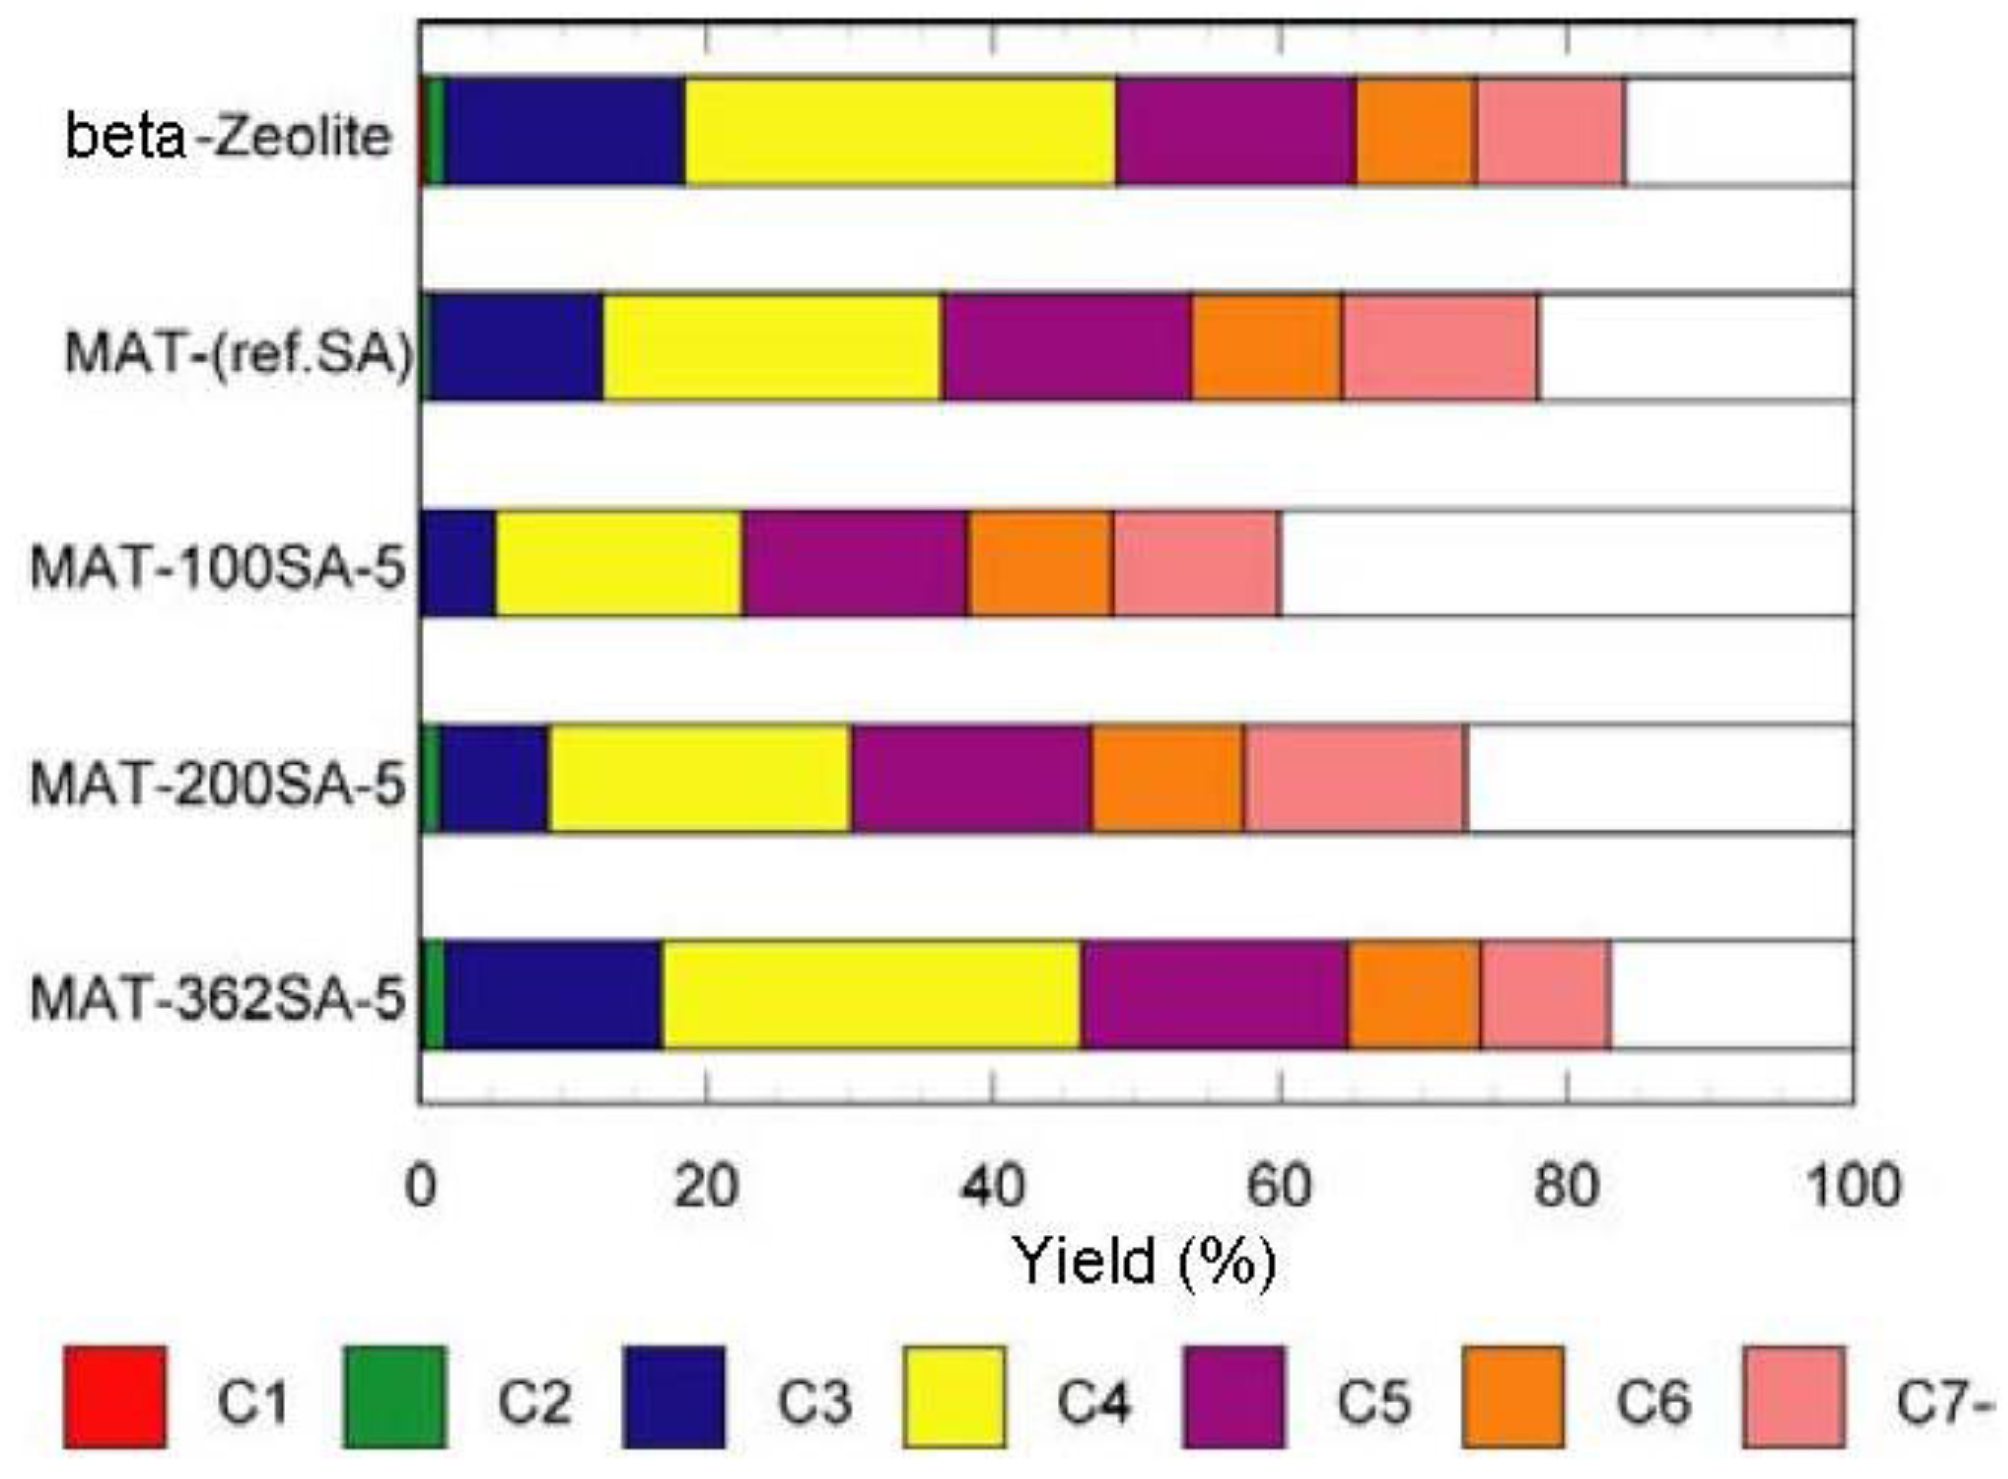
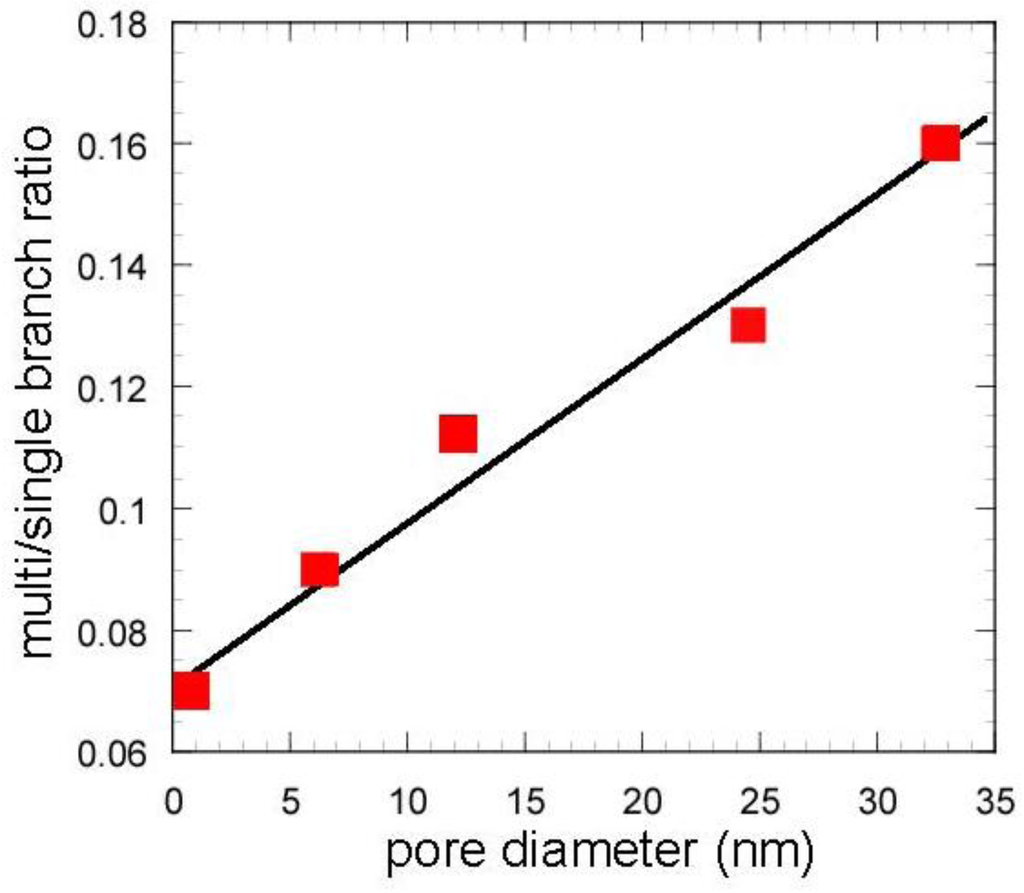
Figure 9.
Effect of pore diameter on multi/single branch ratio. Except zeolite, values in the horizontal line represent peaks of BJH pore diameter.
Figure 9.
Effect of pore diameter on multi/single branch ratio. Except zeolite, values in the horizontal line represent peaks of BJH pore diameter.

Figure 10 shows the NH3-TPD profiles of zeolite and the mixed catalysts. Two peaks are usually observed and a peak observed at the higher temperature (about 400 °C) is assigned to NH3 chemisorbed at acid sites [22]. It seems that the height of this peak of MAT-362SA at the higher temperature was higher than those of other peaks of this catalyst. In contrast, the peaks of other catalysts observed at the higher temperature were lower than those at the lower temperature. The amounts of NH3 desorbed from the mixed catalysts were slightly lower than that for zeolite as shown in Figure 10 and Table 2. Further, the tailing in a TPD profile was observed above 500 °C for the mixed catalyst. Although the relationship with the activity and selectivity is not clear at the present time, these profiles may be related to catalytic performance.
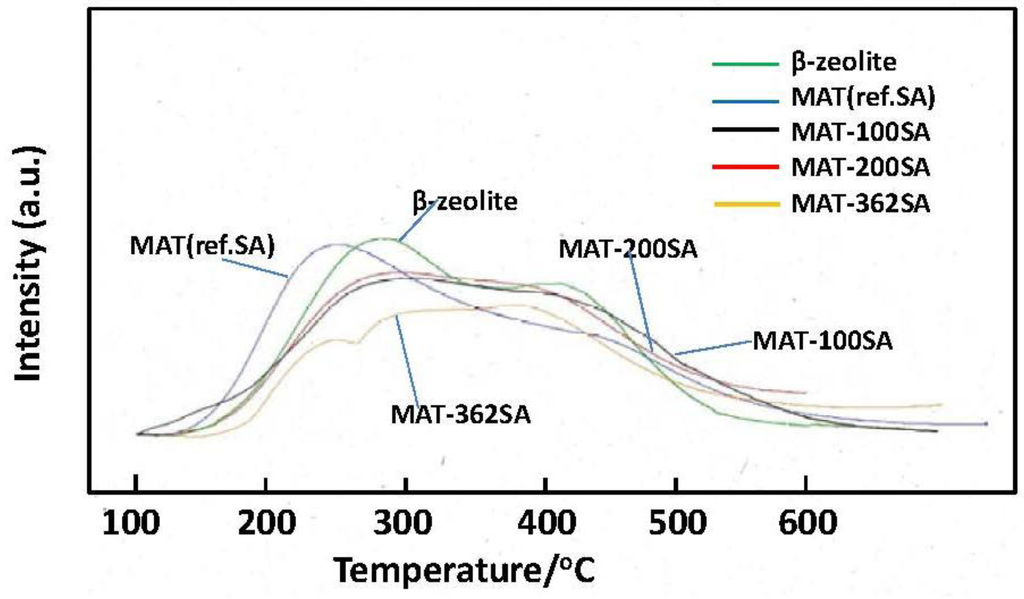
Figure 10.
NH3-TPD profiles of beta zeolite and mixed catalysts.
Figure 10.
NH3-TPD profiles of beta zeolite and mixed catalysts.

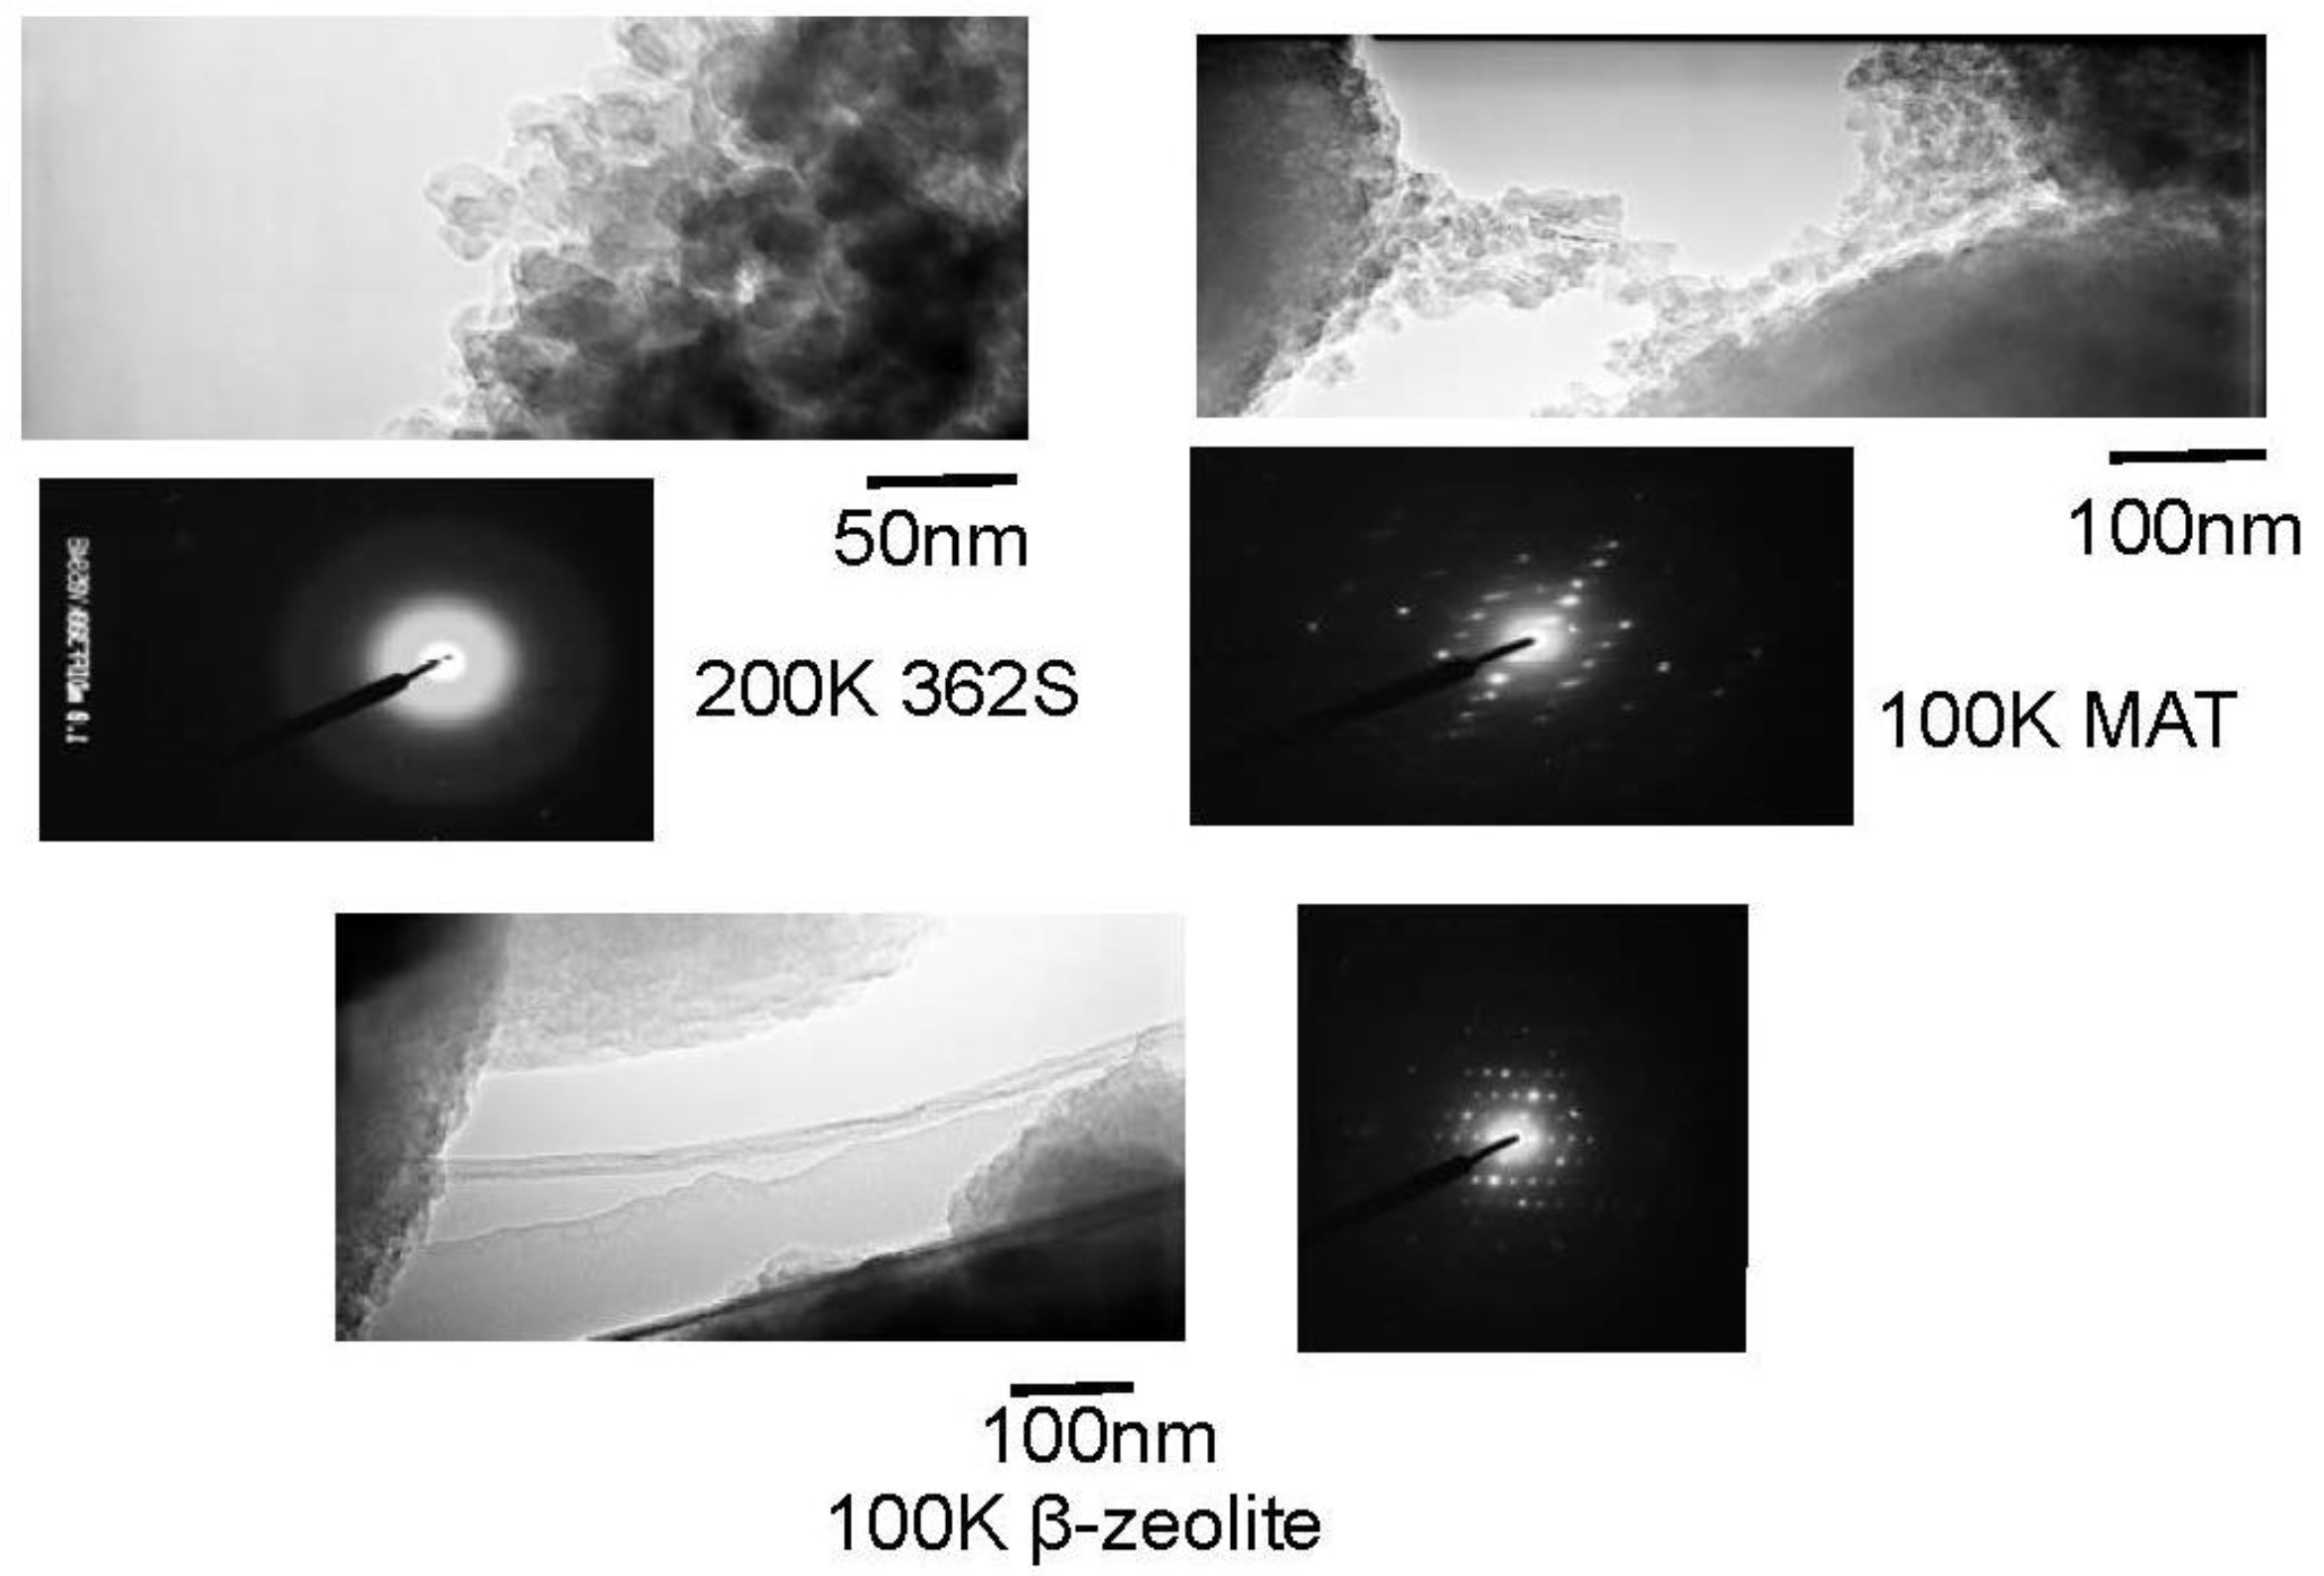
Figure 11 shows TEM images of silica, mixed catalyst and β-zeolite. Silica with large pore (362SiO2) did not show a diffractive pattern, while the mixed catalyst showed a slightly obscure diffractive pattern and zeolite clear one, indicating that the crystal structure of zeolite is maintained in the mixed catalyst. Further, the TEM images of silica and mixed catalyst show the round shape of each particle and it can be considered that the space between these particles represents mesopores, while the TEM image of zeolite did not show a round shape, indicating that zeolite is well mixed and dispersed with silica-alumina.
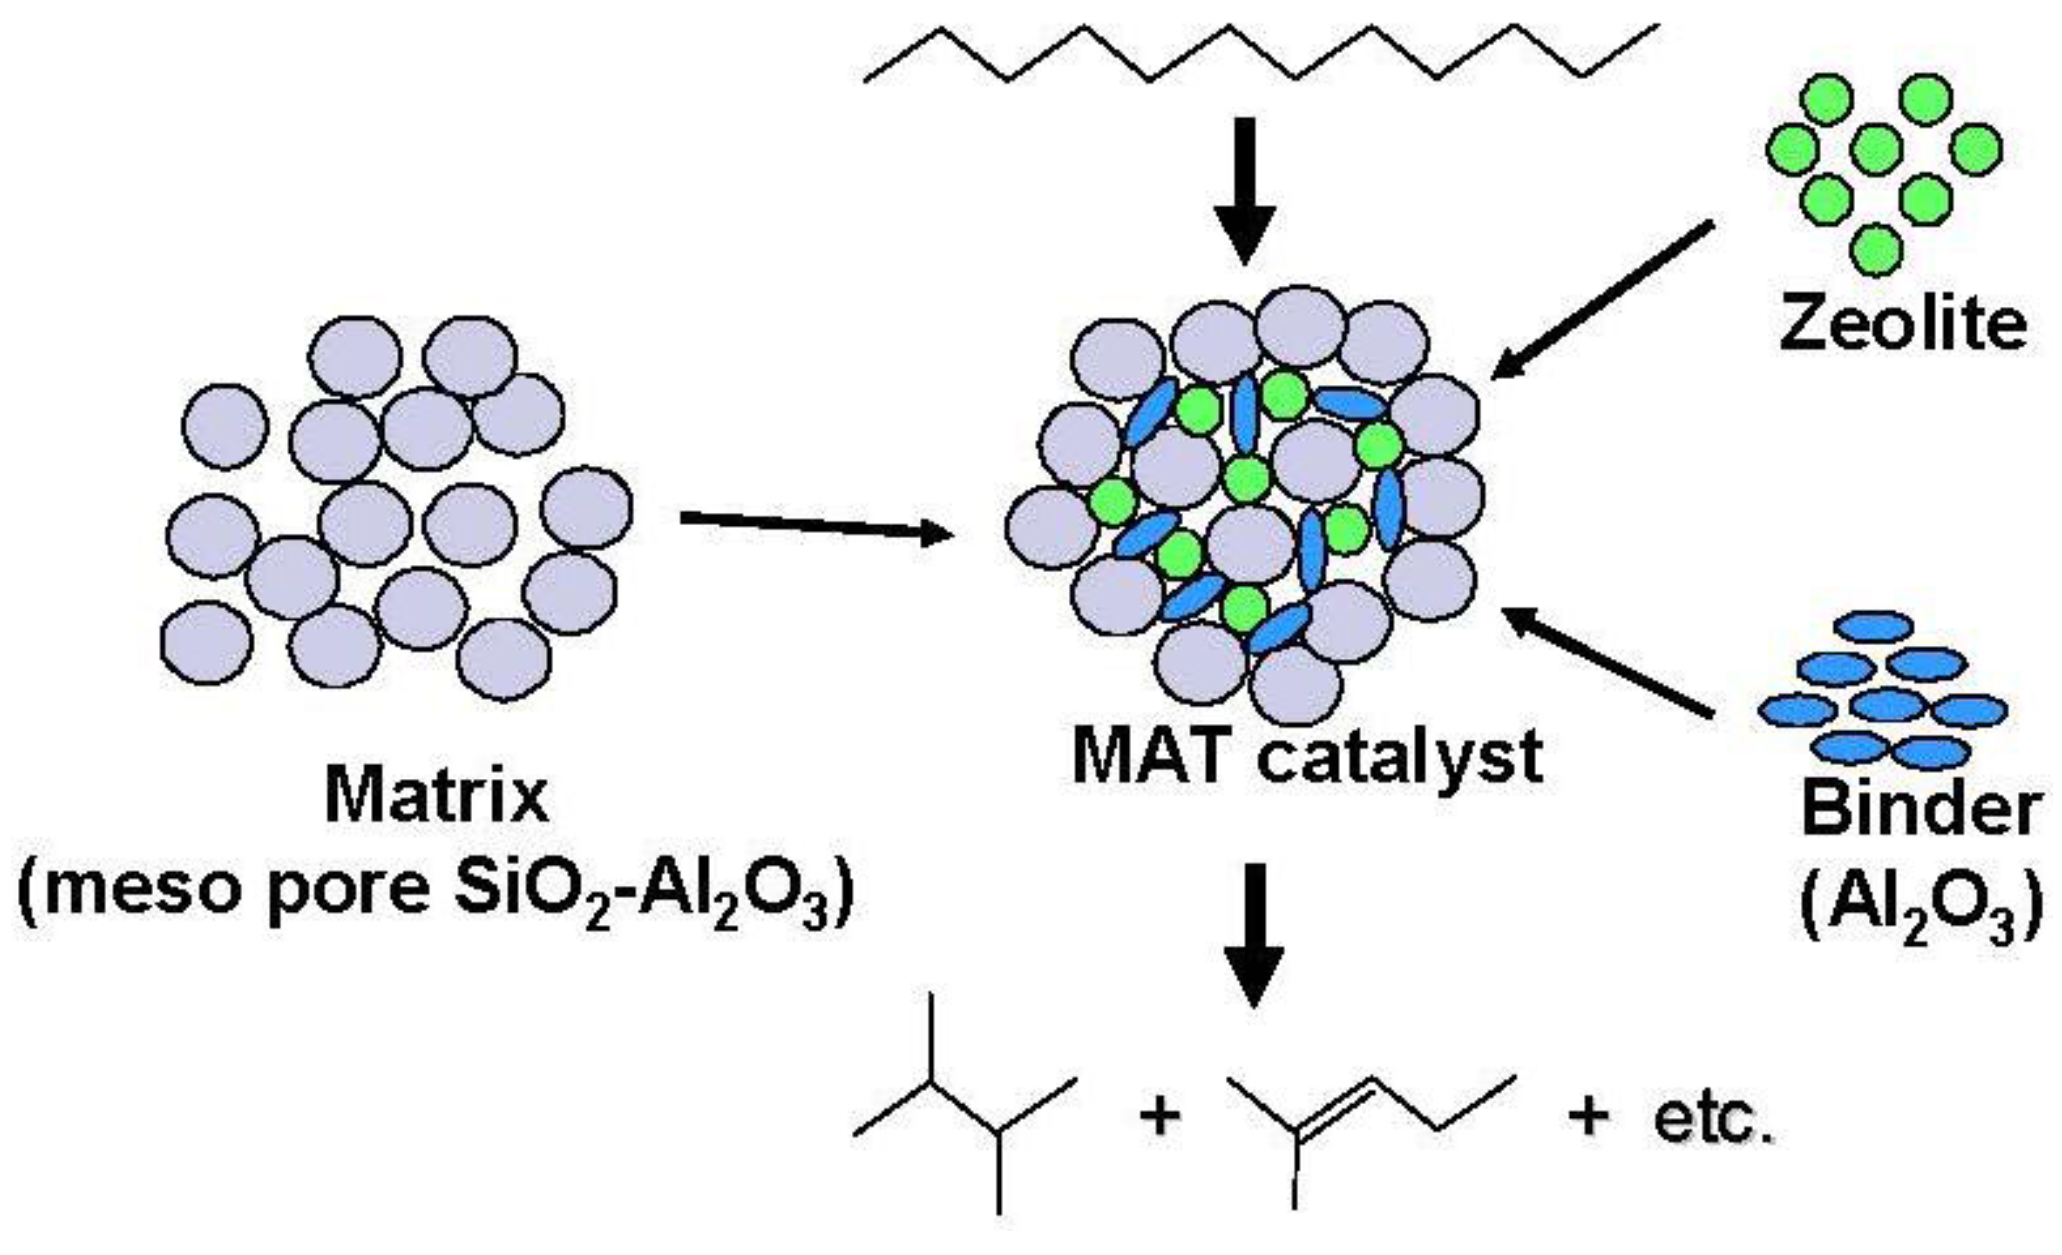
A proposed model structure of a catalytic cracking catalyst is illustrated in Figure 12 [1,2]. A smaller amount of zeolite is embedded into the larger amount of matrix and acid sites on the matrix are effectively considered to crack saturated hydrocarbons into reactive olefins. The olefins formed were small, but may be adsorbed on acid sites of zeolite to effectively inhibit the rapid reaction of other reactive molecules, such as aromatics and the formation of coke by polymerization. If the amount of zeolite is large or zeolite is located in the upper bed, excess amount of olefin will be formed, which may lead to the rapid deactivation of the catalyst system. It has been reported that if the appropriate amount of reactive molecules such as olefins is present in a feed, the cracking of saturated hydrocarbons is promoted [3]. Therefore, primary cracking of n-dodecane on silica-alumina is likely to promote secondary cracking on zeolite and inhibit coke formation, even if the activity of silica-alumina is quite low. The distance for transfer of hydrocarbons inside the catalyst may be longer if the pore size of the matrix is larger. Further, the presence of larger spaces in the larger pores facilitates isomerization. Acid sites with the appropriate amount and strength on the matrix could also promote isomerization, as well as inhibit overcracking of olefins and branched paraffins. In our previous report, it was suggested that the primary reaction occurred in acid sites of the matrix because the reactivity of the mixed catalyst was very similar to that in the experiment where the matrix bed and the zeolite bed were separated and the former was put on the next upper site of the latter (that is, silica-alumina→zeolite (SA→Z)) [1]. Therefore, dodecane is initially decomposed to produce olefin and paraffin on the acid sites of the matrix. Olefins interact with acid sites of zeolite to produce carbenium ions which undergo further cracking and related reactions. This reaction may effectively inhibit direct reaction of paraffin with acid sites of zeolite and decrease the coke formation. A similar example using amorphous silica and Y zeolite was also reported [9]. When amorphous silica-alumina was put on the upper side of the zeolite in the cracking of 1,3,5-triisopropylbenzene, the catalyst system showed higher activity, lower coke formation and lower CO generation than a physical mixture of zeolite and silica-alumina or 100% zeolite. When only zeolite with strong acid sites was used, deactivation occurred because of coke formation. It is considered that when silica-alumina was used at the upper side to zeolite, primary cracking occurred to produce propylene which reacted with acid sites on zeolite and inhibited the direct reaction of aromatic compounds with effectively strong acid sites. These results suggest the important role of primary reaction on the matrix component.

Figure 11.
TEM images of silica, mixed catalyst and β-zeolite.
Figure 11.
TEM images of silica, mixed catalyst and β-zeolite.
It was reported that new acid sites were formed by embedding wet zeolite into alumina and silica-alumina and that the recrystallization of the zeolite component resulted in high hydrothermal stability and catalytic activity [8]. This catalyst system exhibited higher activity than the physical mixture of zeolite and matrix components. In the preceding paragraph, it was mentioned that the SA→Z and mixed catalyst systems exhibited very similar selectivities and properties for products [1]. The activity of the latter was higher than that of the former, indicating that embedding of zeolite into silica-alumina increased the activity.

Figure 12.
Structure and reactivity of a mixed catalyst (MAT catalyst) using a matrix amorphous silica-alumina, zeolite and binder alumina.
Figure 12.
Structure and reactivity of a mixed catalyst (MAT catalyst) using a matrix amorphous silica-alumina, zeolite and binder alumina.
On the other hand, the promotion of diffusion in the inside of the pore of catalyst is very important. In the present study, the formation of the branched products was promoted with the use of the matrix with larger pore size, indicating that this effect may be derived from the relative ease of the elimination of branched product. The rapid transfer of bulky branched products, which are easier to be cracked, effectively inhibits further cracking.
3.3. Concerning Reaction Mechanisms
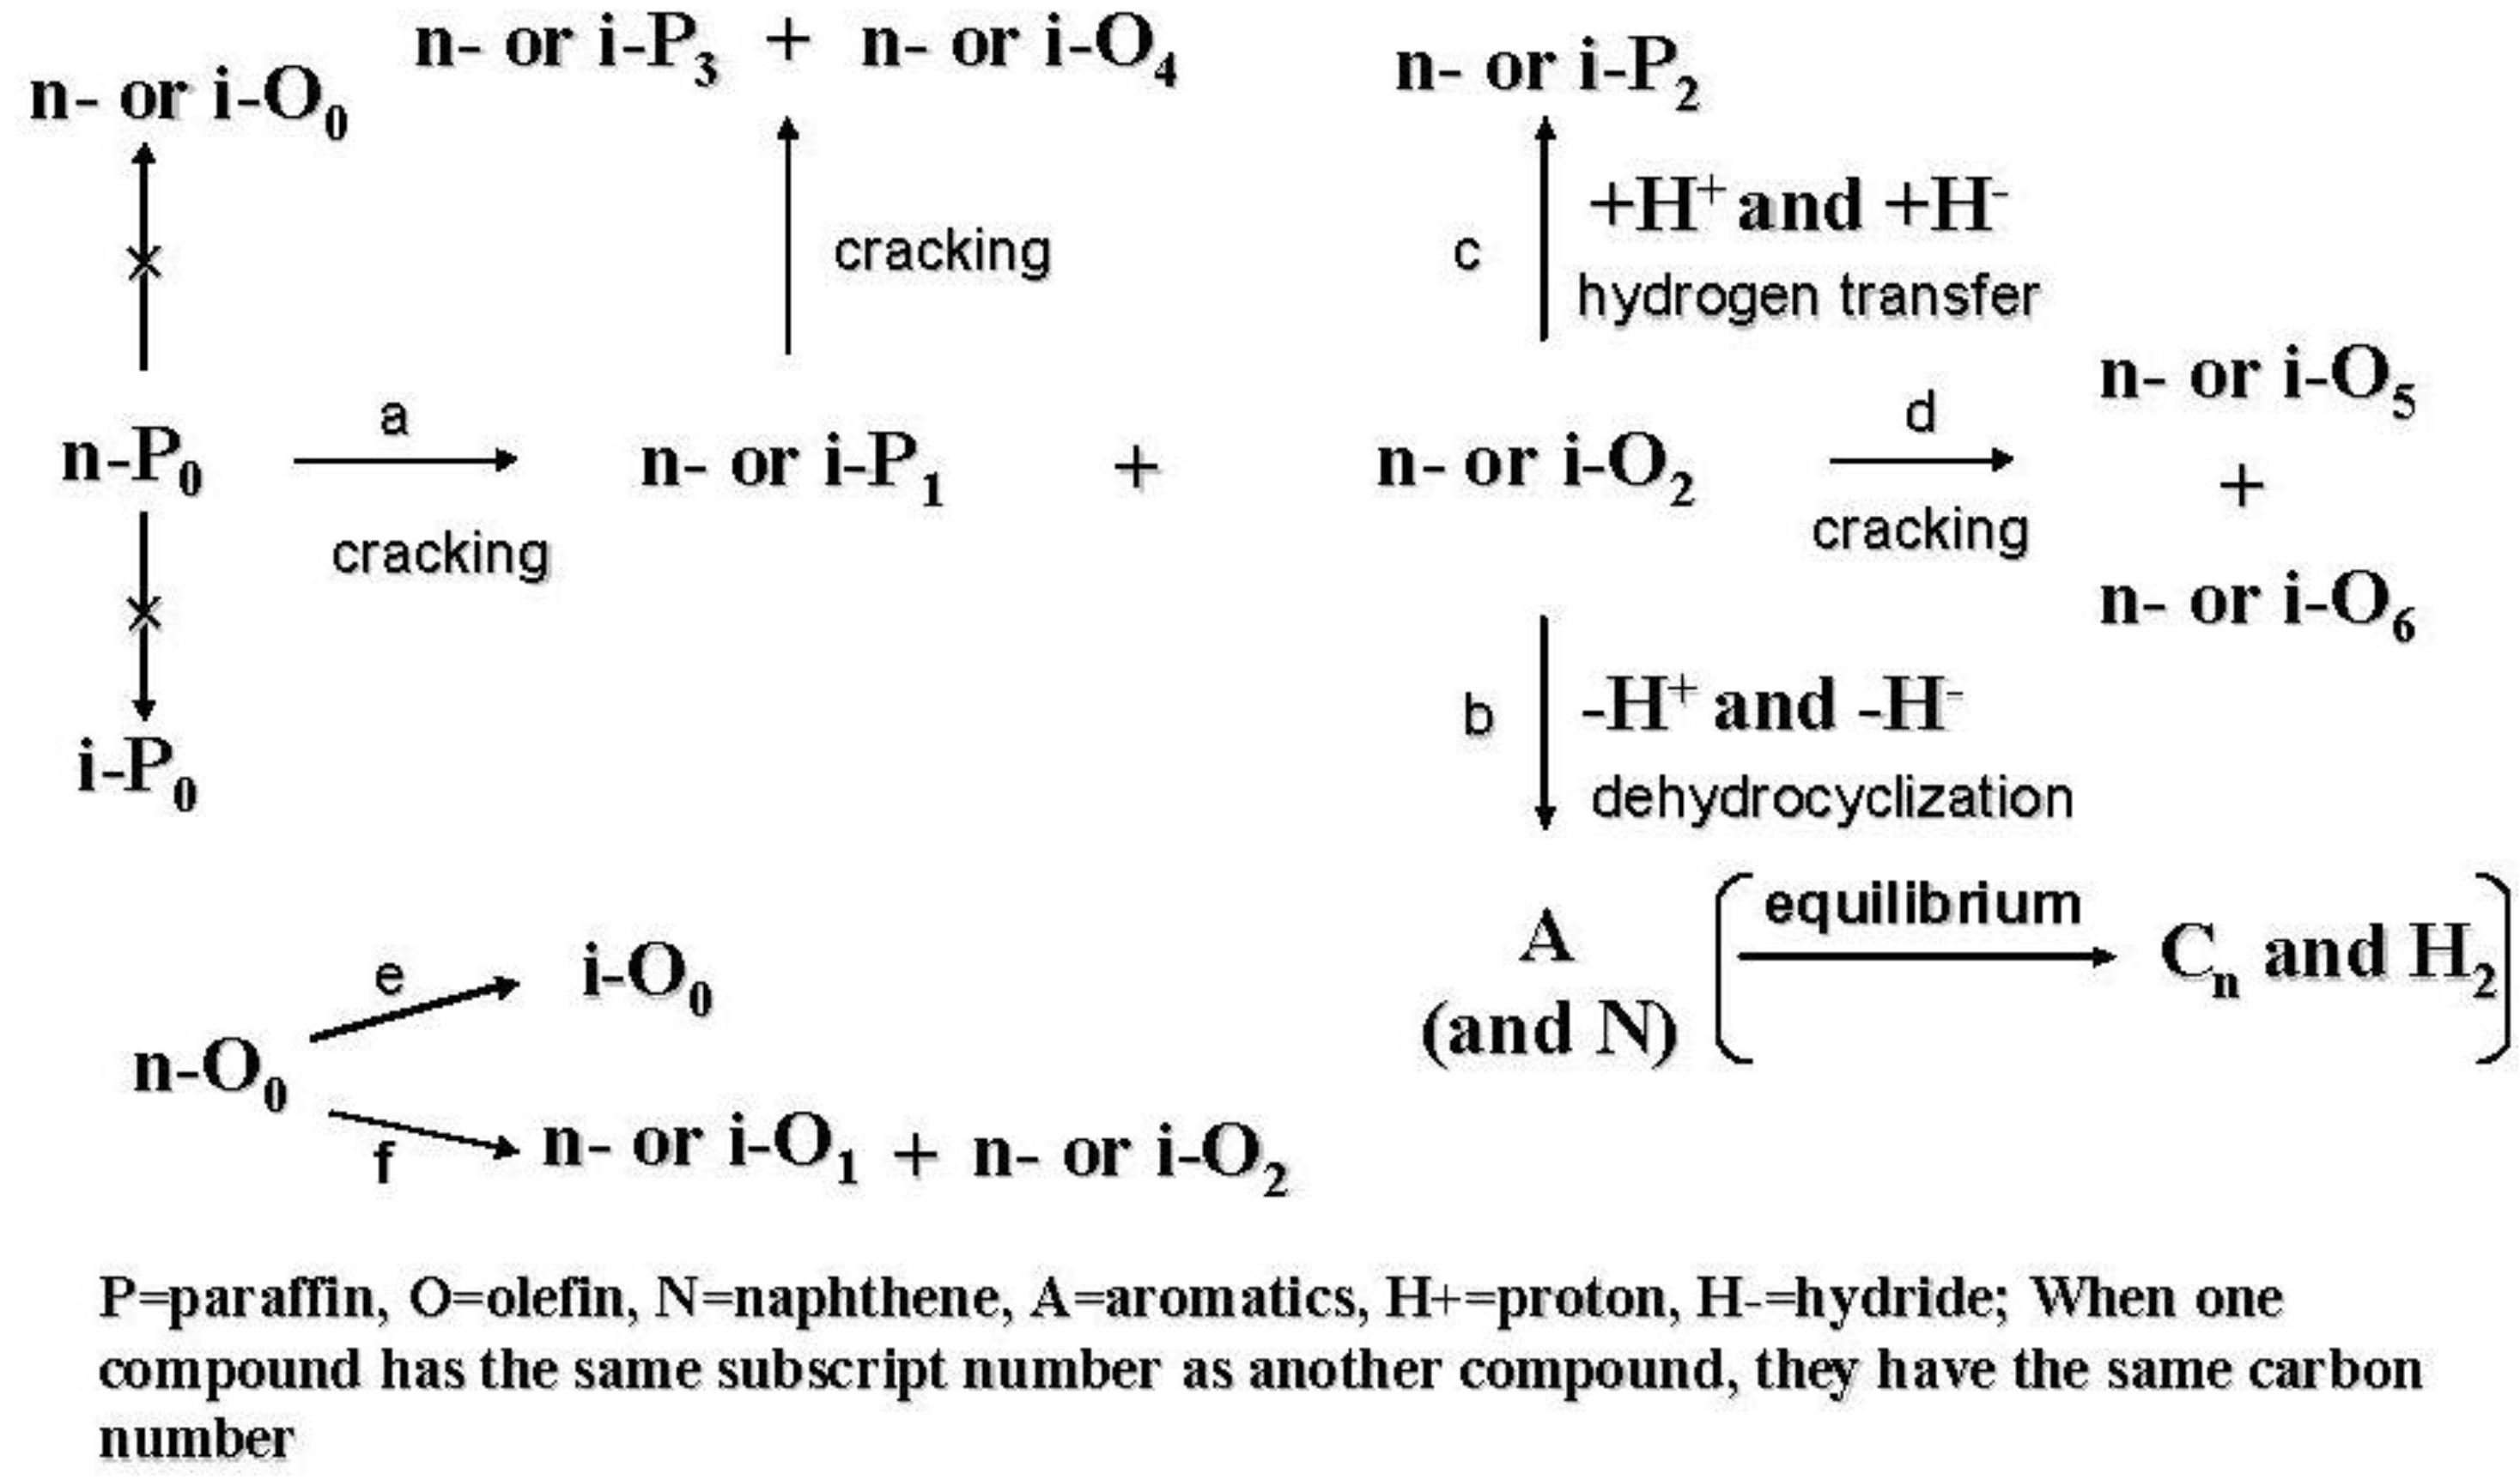
The proposed reaction pathway of catalytic cracking is illustrated in Figure 13 [1,2]. The n-paraffin molecule undergoes cracking to form paraffin and olefin molecules at the ratio 1:1. The olefin may undergo dehydrocyclization and eliminate H+ and H− to give an aromatic compound. The eliminated H+ and H− are supplied to another olefin in the system to form another paraffin. This route is called hydrogen transfer. If the initially formed paraffin is cracked again, another paraffin and another olefin are formed at 1:1. Cracking of the initially formed olefin forms two olefin molecules. If there is no hydrogen transfer, the formation of aromatic and olefin molecules will increase. However, a catalyst with high ability for hydrogen transfer increases the formation of paraffin molecules. Since the hydrogen transfer occurred appropriately the o/p ratio in the gasoline fraction was lower than 1 in our system. Isomerization may occur with each process of cracking, hydrogen transfer, dehydrogenation, and cyclization. Not only the amount and strength of acid sites, but also the steric effect related to pore structure (size and shape) is very important for this isomerization. From this point of view, the mixed catalysts in our system exhibited a higher ability for hydrogen transfer to form larger amounts of paraffin as the o/p ratios for these catalysts were relatively lower in Table 2. Further, the presence of the larger pores and appropriate acid sites in these catalysts also promoted isomerization and increased the iso/n ratio and multi-branched products as shown in Table 2.
Figure 14 shows the reaction pathways of carbenium ions in the catalytic cracking of n-paraffin which has generally been accepted [3]. In Figure 14a, hydride abstraction initially forms a carbenium ion which undergoes cracking to form an olefin and a primary carbenium ion (route I). Although the primary carbenium ion hardly undergoes cracking, isomerization or hydride transfer occurs to produce a secondary or tertiary carbenium ion, which undergoes further cracking to give olefin and primary carbenium ion [3]. In contrast to this mechanism, it was stated that the primary carbenium was not formed because its stability is very low [23,24]. In that case, since cracking occurs so as to form a secondary or tertiary carbenium ion, a tertiary carbon or a quarternary carbon at β position of the carbenium ion is cracked (route II in Figure 14a). This means that branched products are lost with increasing cracking rate. However, it has generally been accepted that hydrocarbons with higher molecular weight are cracked faster and produce larger amounts of branched products [3,25,26]. In the mechanism with the formation of the primary carbenium ion in catalytic cracking (Figure 14a route I and III), branched products do not decrease with cracking. On the other hand, in order to explain the formation of branched products without the formation of the primary carbenium ion, it is also suggested that cracking and isomerization occur simultaneously through the reaction pathway, including 1,3-hydride shift and 1,2-hydride shift, as well as β scission (Figure 14b) [23,24]. We believe both routes I and II exist because branched products increased first and then decreased with increasing pore size, as shown in Table 2. The maximum yield of branched products was obtained in MAT-200SA-5 which exhibited medium conversion.

Figure 13.
Reaction pathways in catalytic cracking of n-paraffin.
Figure 13.
Reaction pathways in catalytic cracking of n-paraffin.
Corma reported that amorphous silica-alumina with mesopores had lower hydrothermal stability and the acid property was also weak [27]. However, simultaneous usage of zeolite and amorphous silica-alumina maintained the crystallinity of zeolite and recrystallized zeolite, indicating that amorphous silica-alumina still has great potential for use in catalytic cracking [8]. On the other hand, growing zeolite crystals with mesopores was tried, using zeolite with micropores as a seed crystal or by assembling zeolite precursor [10,28,29,30,31,32]. Surface-active agents, such as tetraalkylammonium salts were used with the seed crystals to grow the zeolite structure, and higher hydrothermal stability was obtained, compared with MCM-41, which had lower hydrothermal stability. However, insufficient information is available for catalytic cracking. For example, although direct catalytic cracking of heavy oil was sometimes performed, the differences between catalysts are difficult to identify. In many cases, only cracking of alkylbenzene was performed and the cracking of saturated hydrocarbons, of which large amounts are included in heavy oil, has hardly been discussed. In our results, the cracking reactivity of saturated hydrocarbon on mesoporous catalysts, including amorphous silica-alumina and zeolite, can be investigated and described. It was shown that the presence of both large mesopores and an appropriate amount of aluminum component in matrix promoted the formation of branched products.
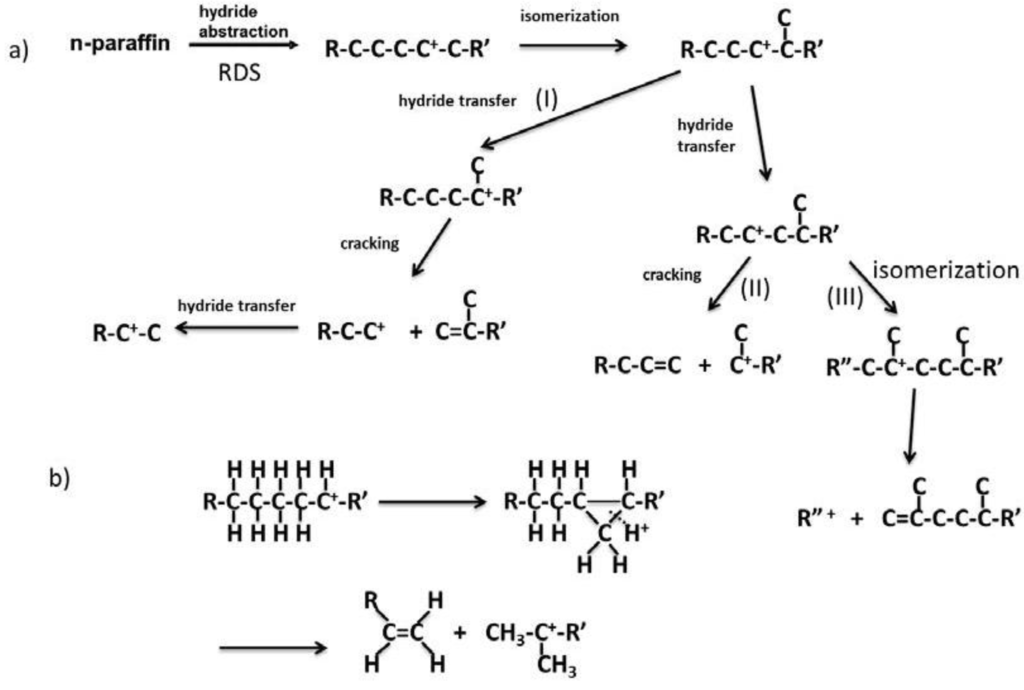
Figure 14.
Reaction pathway of carbenium ion in catalytic cracking of n-paraffin.
Figure 14.
Reaction pathway of carbenium ion in catalytic cracking of n-paraffin.

In our studies, the formation of branched paraffin was especially noted. When the cracking of VGO and AR is considered, the gasoline produced will undergo further hydrodesulfurization. The olefins in the gasoline are expected to be hydrogenated at hydrodesulfurization and the RON value of the gasoline will decrease. To overcome this situation, the catalyst must be designed to increase the RON value by increasing branched paraffin formation. Although the desired formulation of gasoline is unknown, this must be an important factor in the development to increase the RON value by branched paraffin formation. The development of catalysts, with selectivity for branched paraffins, will also be very important to obtain the stability of diesel oil at lower temperature. The technology can be applied to hydrocracking of WAX produced in the GTL process.
4. Conclusions
Gel skeletal reinforcement to prepare mesopores with large pore diameter and pore volume was developed by the reaction of silica aerogel with TEOS. The pore diameter and pore volume of silica calcined at 600 °C could be controlled by the amount of TEOS solution for reinforcement and reached 30 nm and 3.1 cm3/g, respectively, indicating that most of pores for this silica consisted of mesopores. Silica-aluminas with the same pore size distribution were also prepared using ASB. The catalytic performance for catalytic cracking of n-dodecane was investigated at 500 °C. The mixed catalyst derived from β-zeolite and silica-alumina with large mesopore exhibited not only comparable activity to that for single zeolite but also the linear relationship between the formation of branched products and pore size.
Acknowledgments
This work was sponsored by the Japan Petroleum Energy Center under a subsidy of the Ministry of Economy, Trade and Industry. The authors are deeply thankful to Kohei Nakajima, and Motoki Hirado for their experimental work.
Conflict of Interest
The authors declare no conflict of interest.
References
- Ishihara, A.; Negura, H.; Hashimoto, T.; Nasu, H. Catalytic property of amorphous silica-alumina prepared using malic acid as a matrix in catalytic cracking of n-dodecane. Appl. Catal. A Gen. 2010, 388, 68–76. [Google Scholar] [CrossRef]
- Ishihara, A.; Negura, H.; Inui, K.; Hashimoto, T.; Nasu, H. Catalytic property of amorphous silica-alumina prepared using dicarboxylic and tricarboxylic acids as a matrix in catalytic cracking of n-dodecane. J. Jpn. Petrol. Inst. 2011, 54, 189–200. [Google Scholar] [CrossRef]
- Gates, B.C.; Katzer, J.R.; Schuit, G.C.A. Catalytic Cracking. In Chemistry of Catalytic Processes; McGraw-Hill: New York, NY, USA, 1979; pp. 1–111, Chapter 1. [Google Scholar]
- Inagaki, S.; Takechi, K.; Kubota, Y. Selective formation of propylene by hexane cracking over MCM-68 zeolite catalyst. Chem. Commun. 2010, 46, 2662–2664. [Google Scholar] [CrossRef]
- Rajagopalan, K.; Habib, E.T., Jr. Understand FCC matrix technology. Hydrocarb. Process. 1992, 9, 43–46. [Google Scholar]
- Sato, S.; Morimoto, Y.; Takatsuka, T.; Hashimoto, H. Matrix pore structure and bottom cracking capability of residue FCC catalysts. Sekiyu Gakkaishi 1986, 29, 60–65. [Google Scholar] [CrossRef]
- Falco, M.; Morgado, E.; Amadeo, N.; Sedran, U. Accessibility in alumina matrices of FCC catalysts. Appl. Catal. A 2006, 315, 29–34. [Google Scholar] [CrossRef]
- Kubicek, N.; Vaudry, F.; Chiche, B.H.; Hudec, P.; Renzo, F.D.; Schulz, P.; Fajula, F. Stabilization of zeolite beta for fcc application by embedding in amorphous matrix. Appl. Catal. A 1998, 175, 159–171. [Google Scholar] [CrossRef]
- Hosseinpour, N.; Mortazavi, Y.; Bazyari, A.; Khodadadi, A.A. Synergetic effects of Y-zeolite and amorphous silica-alumina as main FCC catalyst components on triisopropylbenzene cracking and coke formation. Fuel Process. Technol. 2009, 90, 171–179. [Google Scholar] [CrossRef]
- Tan, Q.; Bao, X.; Song, T.; Fan, Y.; Shi, G.; Shen, B.; Liu, C.; Gao, X. Synthesis, characterization, and catalytic properties of hydrothermally stable macro-meso-micro-porous composite materials synthesized via in situ assembly of preformed zeolite Y nanoclusters on kaolin. J. Catal. 2007, 251, 69–79. [Google Scholar] [CrossRef]
- Sakka, S. Chapter I Dense and Porous Materials. In Handbook of Sol-Gel Science and Technology, Processing Characterization and Applications; Kluwer Academic Publishers: Norwell, MA, USA, 2005; Volume III, pp. 3–26. [Google Scholar]
- Rigacci, A.; Einarsrud, M.-A.; Nilsen, E.; Pirard, R.; Ehrburger-Dolle, F.; Chevalier, B. Improvement of the silica aerogel strengthening process for scaling-up monolithic tile production. J. Non-Cryst. Sol. 2004, 350, 196–201. [Google Scholar] [CrossRef]
- Reichenauer, G. Thermal aging of silica gels in water. J. Non-Cryst. Sol. 2004, 350, 189–195. [Google Scholar] [CrossRef]
- Smitha, S.; Shajesh, P.; Aravind, P.R.; Kumar, S.R.; Pillai, P.K.; Warrier, K.G.K. Effect of aging time and concentration of aging solution on the porosity characteristics of subcritically dried silica aerogels. Microporous Mesoporous Mater. 2006, 91, 286–292. [Google Scholar] [CrossRef]
- Aravind, P.R.; Mukundan, P.; Pillai, P.K.; Warrier, K.G.K. Mesoporous silica-alumina aerogels with high thermal pore stability through hybrid sol-gel route followed by subcritical drying. Microporous Mesoporous Mater. 2006, 96, 14–20. [Google Scholar] [CrossRef]
- He, F.; Zhao, H.; Qu, X.; Zhang, C.; Qiu, W. Modified aging process for silica aerogel. J. Mater. Process Technol. 2009, 209, 1621–1626. [Google Scholar] [CrossRef]
- Sarawade, P.B.; Kim, J.-K.; Kim, H.-K.; Kim, H.-T. High specific surface area TEOS-based aerogels with large pore volume prepared at an ambient pressure. Appl. Surf. Sci. 2007, 254, 574–579. [Google Scholar] [CrossRef]
- Hilonga, A.; Kim, J.-K.; Sarawade, P.B.; Kim, H.T. Low-density TEOS-based silica aerogels prepared at ambient pressure using isopropanol as the preparative solvent. J. Alloy. Compd. 2009, 487, 744–750. [Google Scholar] [CrossRef]
- Wei, T.-Y.; Chang, T.-F.; Lu, S.-Y.; Chang, Y.-C. Preparation of monolithic silica aerogel of low thermal conductivity by ambient pressure drying. J. Am. Ceram. Soc. 2007, 90, 2003–2007. [Google Scholar] [CrossRef]
- Ishihara, A.; Nakajima, K.; Hirado, M.; Hashimoto, T.; Nasu, H. Nanocatalysis for Fuels and Chemicals; The American Chemical Society: Washington, DC, USA, 2012; pp. 51–60. [Google Scholar]
- Ishihara, A.; Nakajima, K.; Hirado, M.; Hashimoto, T.; Nasu, H. Novel method for generating large mesopores in an amorphous silica-alumina by controlling the pore size with the gel skeletal reinforcement and its catalytic cracking properties as a catalyst. Chem. Lett. 2011, 40, 68–70. [Google Scholar] [CrossRef]
- Niwa, M.; Katada, N. Measurements of acidic property of zeolites by temperature programmed desorption of ammonia. Catal. Surv. Jpn. 1997, 1, 215–226. [Google Scholar] [CrossRef]
- Ono, Y.; Yashima, T. Science and Engineering of Zeolite; Kodansha Scientific: Tokyo, Japan, 2000; p. 127. (in Japanese) [Google Scholar]
- Sie, S.T. Acid-Catalyzed cracking of paraffinic hydrocarbons. 1. Discussion of existing mechanisms and proposal of a new mechanism. Ind. Eng. Chem. Res. 1992, 31, 1881–1889. [Google Scholar] [CrossRef]
- Takatsuka, T. Private communication, Shinshu University: Nagano Prefecture, Japan, 2012.
- Ishihara, A.; Kimura, K.; Inui, K.; Owaki, A.; Hashimoto, T.; Nasu, H. Catalytic cracking of VGO by β- and ZSM-5 zeolite containing silica-alumina using a curie point pyrolyzer. Catal.Commun. 2012, in press. [Google Scholar]
- Corma, A. From microporous to mesoporous molecular sieve materials and their use in catalysis. Chem. Rev. 1997, 97, 2373–2419. [Google Scholar] [CrossRef]
- Liu, Y.; Zhang, W.; Pinnavaia, T.J. Steam-Stable aluminosilicate mesostructures assembled from zeolite type Y seeds. J. Am. Chem. Soc. 2000, 122, 8791–8792. [Google Scholar] [CrossRef]
- Liu, Y.; Zhang, W.; Pinnavaia, T.J. Steam-Stable MSU-S aluminosilicate mesostructures assembled from zeolite ZSM-5 and zeolite beta seeds. Angew. Chem. Int. Ed. 2001, 40, 1255–1258. [Google Scholar] [CrossRef]
- Han, Y.; Wu, S.; Sun, Y.; Li, D.; Xiao, F.; Liu, J.; Zhang, X. Hydrothermally stable ordered hexagonal mesoporous aluminosilicates assembled from a triblock copolymer and preformed aluminosilicate precursors in strongly acidic media. Chem. Mater. 2002, 14, 1144–1148. [Google Scholar] [CrossRef]
- Zhang, Z.; Han, Y.; Xiao, F.; Qiu, S.; Zhu, L.; Wang, R.; Yu, Y.; Zhang, Z.; Zou, B.; Wang, Y.; et al. Mesoporous aluminosilicates with ordered hexagonal structure, strong aciditiy, and extraordinary hydrothermal stability at high temperatures. J. Am. Chem. Soc. 2001, 123, 5014–5021. [Google Scholar]
- Frunz, L.; Prins, R.; Pirngruber, G.D. ZSM-5 precursors assembled to a mesopourous structure and its subsequent transformation into a zeolitic phase-from low to high catalytic activity. Microporous Mesoporous Mater 2006, 88, 152–162. [Google Scholar] [CrossRef]
© 2012 by the authors; licensee MDPI, Basel, Switzerland. This article is an open-access article distributed under the terms and conditions of the Creative Commons Attribution license (http://creativecommons.org/licenses/by/3.0/).