Abstract
In the present study, the local atomic structure of a Nb3Sn superconductor sample has been probed by X-ray absorption fine structure (XAFS) as a function of hydrostatic pressure (from ambient up to 26 GPa) using a diamond anvil cell set-up. The analysis of the Nb-K edge extended X-ray absorption fine structure (EXAFS) data was carried out combining standard multi shell structural refinement and reverse Monte Carlo method to provide detailed in situ characterization of the pressure-induced evolution of the Nb local structure in Nb3Sn. The results highlight a complex evolution of Nb chains at the local atomic scale, with a peculiar correlated displacement of Nb–Nb and Nb–Nb–Nb configurations. Such a local effect appears related to anomalies evidenced by X-ray diffraction in other superconductors belonging to the same A15 crystallographic structure.
1. Introduction
Nb3Sn is a brittle intermetallic material belonging to the class of the A15 compounds (space group -) that in 1954 reached a superconducting transition temperature of Tc ≈ 18 K [1]. Even more important, is its capability to carry high current densities > 103 A/mm2 [2], allowing to make compact magnets reaching high critical fields up to 30 T [3,4], essential for high field superconductor applications. These properties contributed to make Nb3Sn the most widely used high field superconductor in top science projects (CERN High luminosity LHC project [5], ITER [6] project) and industrial applications (NMR instruments, compact cyclotrons), with a record production in the period 2009–2014 of 150 Tons/Year for the ITER toroidal field magnets only [7]. The exceptional requirements of these magnet-based projects revamped the interest in this material and considerable efforts are now undertaken to further improve their critical performances and efficiencies during the applications [8,9,10]. In particular, the effects of strains (axial, transverse, hydrostatic) on , and the electrical resistivity, which may be caused by thermal contractions and strong Lorentz forces due to the high currents, were extensively explored [4,9,11,12,13,14,15]. However, less is known about the structural modifications induced by pressure, especially on the crystallographic and atomic scale [15,16,17]. These informations are crucial for achieving accurate model of the Nb3Sn properties. As a matter of fact, density functional theory (DFT) calculations have shown that squeezing the structure actually affects the phonon spectra and electronic density of states of Nb3Sn [15]. However, accurate models require deep knowledge about the atomic structure at the crystallographic and atomic (local) scale.
Recently, structural changes have been highlighted in different A15 compounds as a function of pressure. High pressure X-ray diffraction (HP-XRD) experiments [15], carried out on technological Nb3Sn wires, showed an anomaly in the unit cell volume compression (around 5 GPa) not associated with any structural phase transition. A similar effect, ascribed to isostructural transitions, was observed around 15 GPa for other A15 systems, e.g., Nb3Ga [18] and Nb3Al [19]. Whereas, low temperature (T = 10 K) HP-XRD measurements, performed on a slightly non stoichiometric Nb3Sn1−x single crystal, have evidenced structural instabilities around 3 GPa, suggesting a dimerization of Nb–Nb chains, providing alternating shorter/longer Nb–Nb pairs [17]. Recent simulations on Nb3Al suggested the - phase to be energetically not favoured with respect to the C2/C [20] phase, where the lower symmetry allows for distortions of the Nb chains.
The XRD technique provides accurate long-range order structural characterization, but misses details about the local atomic structure, i.e., the average relative atomic arrangement [21]. These details can be assessed exploiting the X-ray absorption fine structure (XAFS) spectroscopy, a chemically selective technique, sensitive to the local atomic structure. However, to the best of our knowledge, XAFS literature data on Nb3Sn are quite rare, even at ambient pressure/temperature conditions [22,23].
In this work, Nb K-edge HP-XAFS was used to obtain further insight on the atomic structure of Nb3Sn between ambient pressure (AP) and 26 GPa. XAFS data analysis was carried out combining well established multi-shell data refinement [24] and Reverse Monte Carlo (RMC) approach [25]. In this way, it was possible to build a 3D model of Nb3Sn structural details around the Nb sites, and to extract further information on the pressure-dependence of the relative arrangements of Nb neighbors (many-body distribution functions) in the structure.
2. Materials and Methods
X-ray absorption spectroscopy (XAS) measurements were performed at the beamline BM23 [26] of the European Synchrotron Radiation Facility (ESRF) at the Nb K-edge (18.986 keV). The X-ray beam was focused down to 3 × 3 μm2 using the micro-XAS facility the data of which were collected in transmission mode using two gas filled ionization chambers to measure both the incident () and transmitted () X-ray intensities. For sake of comparison, additional Nb K-edge XAS spectra were measured at the P65 beamline (Petra-III, DESY synchrotron radiation facility in Hamburg, Germany) [27] on powder of the same sample, in standard transmission geometry at ambient conditions.
A membrane diamond anvil cell (DAC) was equipped with nano-polycrystalline diamonds [28,29] with a culet size of 400 μm. The gasket was prepared from a pre-indented and laser drilled stainless steel foil. The Nb3Sn samples were obtained from a polycrystalline bulk piece sintered by Hot Isostatic Pressure (HIP) technique (2 kbar Argon pressure at 1250 °C for 24 h) at the University of Geneva [30]. A grain size of about 20 μm and a composition very close to stoichiometry (24.8 at.% Sn) were determined from SEM/EDS analysis. A sharp superconducting transition was observed at 17.9 K by AC susceptibility. Finally, a Rietveld refinement yielded a lattice constant at ambient conditions of 5.291 Å and a Bragg–Williams [31] long-range order parameter S of 0.98. Further details on the synthesis procedure and preliminary characterization can be found in Ref. [32]. Samples from the same batch were characterized by means of microwave measurements [33], yielding a normal state resistivity 14.8 ·, a critical temperature Tc = 17.8 K and an extrapolated upper critical field , giving of ≃ 27 T [34], in full agreement with the accepted values [4] for pure Nb3Sn. The sample for the XAS measurements was prepared by grinding a piece of Nb3Sn bulk in an agate mortar to obtain a fine powder. The latter was then squeezed between two diamond anvils in order to obtain a thin and homogeneous pellet which was cut and loaded in the DAC’s high pressure chamber. A ruby chip was placed a few μm away from the sample and used as pressure gauge. Once the good quality of the sample loading was checked by means of X-rays (providing an absorption jump of 0.3 at the Nb K-edge), the high pressure chamber of the DAC was filled with Ne gas to ensure good hydrostatic conditions for the investigated pressure range [35]. During the experiment, the pressure inside the DAC was measured, before and after each energy scan, using the ruby fluorescence method [36], following the calibration of Dorogokupets and Oganov [37]. High pressure measurements (HP) were carried out at room temperature at seven pressure values in the range between 0.3 GPa and 26 GPa. In order to get a good statistics, the data at each pressure point was obtained by collecting at least four energy spectra, which were checked for energy scale alignment and then averaged.
For each pressure point (AP and HP data), the experimental absorption signals were treated along the standard procedures for pre-edge background subtraction, edge jump normalization and extraction of the structural extended X-ray absorption fine structure (EXAFS) signal using the ESTRA software suite [38]. The pre-edge background was modelled with a straight line calculated by fitting the data in the interval 18.788–18.908 keV before the edge. The obtained background was then subtracted from the total signal, obtaining . The edge energy , defining the origin of the photo-electron wave-vector k = ( = electron mass), was selected at the first inflection point of the absorption edge (maximum of the first derivative) and refined during the fit. The post edge atomic absorption background () was calculated fitting a N-knots polynomial spline through the data. The structural EXAFS signal was finally calculated as: . In order to avoid artefacts coming from the signal extraction, the same procedure and normalization parameters were used to extract the EXAFS signal from all the data at different pressures. The -weighted experimental spectra at the measured pressures are presented in Figure 1 along with the moduli of their Fourier transforms (FT) and best fits (see below). The sample homogeneity is crucial for reliable XAFS analysis, the good agreement between HP and AP data underlining the good quality of the spectra Figure 1). Furthermore, the agreement between structural parameters obtained from the analysis of AP and 0.3 GPa data confirms the reliability and reproducibility of the analysis procedures.
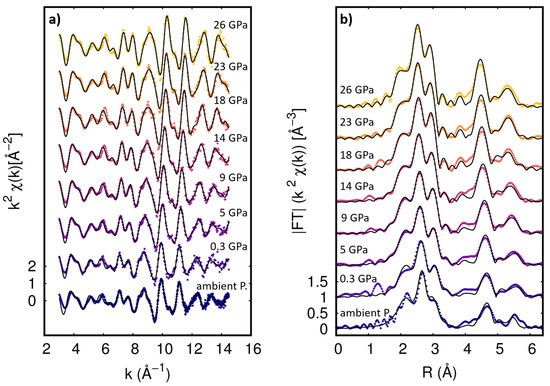
Figure 1.
(a) Experimental (dots) and best fit (lines) Nb K-edge -weighted extended X-ray absorption fine structure (EXAFS) spectra as a function of pressure. (b) Moduli of the FT of -weighted EXAFS spectra (dots) and best fit curves (full lines). In each frame the corresponding pressures are marked and the curves are vertically shifted for sake of clarity.
2.1. Standard EXAFS Data Analysis
The quantitative EXAFS data analysis was firstly carried out following a standard multi-shell [24,39] data analysis procedure using the program FitEXA [38]. The -weighted raw spectra were fitted in the 3–14.5 Å−1 k-range to the model function . The non-linear least-square data refinement and error analysis has been implemented using the MINUIT routine package [40]. The theoretical EXAFS function is given by a sum of partial contributions (coordination shells) , each being calculated from the standard EXAFS formula [38]:
This model is valid in the case of small and harmonic (Gaussian) disorder [41] and assumes each contribution originating from a Gaussian shaped coordination shell defined by three structural parameters: the multiplicity number , the average coordination distance and the mean square relative displacement (MSRD) factor . The semi-empirical amplitude reduction factor takes into account for many body losses, after preliminary tests it was fixed to 0.9 for all the data analysis. The theoretical amplitude (), phase () and mean free path () functions were calculated using the FEFF 8.2 program [42] using an atomic cluster based on the crystallographic Nb3Sn structure within the - space group [43]. The squeezing of the lattice parameters in the investigated pressure range [15] is less than 5% and it is expected to have a weak effect on the , and ; therefore they were not recalculated as a function of pressure.
In order to reduce the number of free parameters and the correlations among them (so improving the reliability of the obtained results) during the multi-shell EXAFS data fitting, constraints were imposed based on the crystallographic structure [39] of Nb3Sn. The adopted unit cell schematized in Figure 2 was cubic (edge length a). The Sn atoms were located at the cube corners and center, forming a body-centred cubic () lattice, while the Nb atoms were arranged in pairs along chains parallel to the x, y, and z axis, at the center of each face of the cube.
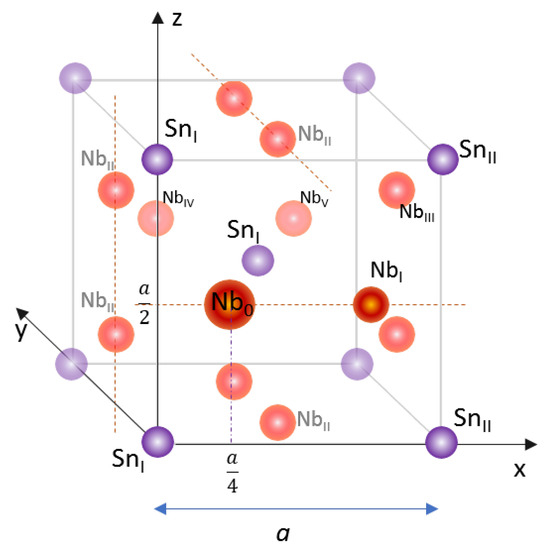
Figure 2.
Representation of the Nb3Sn structure, where Nb and Sn atoms are reported in light red and purple, respectively. For sake of clarity some of the atoms have been labelled following the nomenclature of Table 1, in order to identify the various paths used for the EXAFS analysis. The dimension of the Nb0 atom has been enhanced to help the reader finding the absorbing atom.
The three main peaks observed between 1.8 Å and 3.2 Å in the FT (uncorrected for the phase shift) were partially overlapping (Figure 1b). They were assigned to the first three neighboring shells around a generic Nb0 absorber in the A15 structure (Table 1), namely the two NbI along the Nb chain ( away from Nb0), the four SnI at the close cube corners and centers of adjacent cubes ( away) and the eight NbII on the close faces ( away). The features in the FT in the 3–6 Å region derived from single (SS) and multiple scattering (MS) contributions in the more distant region. For the analysis the SS and MS were selected on the basis of their amplitude and statistical significance in the fitting. In particular, the intense MS paths Nb0-NbI-NbIV and Nb-SnI-NbV, being enhanced by collinear arrangements (forward and double forward scattering) were considered in the fitting model. For sake of clarity, the neighboring shells assignment used for the EXAFS data analysis is resumed in Table 1, giving the atomic position relative to the generic Nb0 absorber at (1/4, 0, 1/2) in the unit cell.

Table 1.
Definitions of the seven neighboring shells used for the EXAFS data analysis calculated assuming the generic Nb0 absorber located at . The atom labels are those shown in Figure 2. For each shell, the labels of the neighboring atoms used in the text and the half path length R(a) as a function of the cube edge (lattice parameter) a are reported. For each atomic configuration contributing to the shell the multiplicity (N), the scattering model (single SS, or multiple MS, scattering) and the neighboring relative position respect to Nb0 (in units of the lattice parameter a) are shown. The scattering paths are also reported for sake of completeness (path) along with the relative intensity respect to the NbI shell as given by FEFF, the MS terms include the three and four leg paths.
Based on the crystallographic structure, the multiplicity numbers () of the various contributions were kept fixed. All the shell distances were constrained to the lattice parameter a (left free to vary) through the R(a) functions (Table 1), except the nearest neighbors distance. Indeed, due to the correlated disorder [41,44], it may depart from the expected crystallographic length. Double and triple scattering contributions (MS) (as well as SS one), were considered for the VI and VII shells. The MSRD factors were refined independently for the various shells.
After some preliminary tests, it was found that seven shells were enough to fit the data reproducing the main structural features observed in the FT graph up to 6 Å. An example of the best fit obtained at 23 GPa is presented in Figure 3, together with the partial contributions of the seven shells used in the analysis. The edge energy shift and the were kept fixed for all the spectra in order to improve the reliability of the observed trends on the structural parameters. During the EXAFS analysis, a total of 13 free parameters were used. The pressure-induced evolution of the Nb–Nb nearest neighbors () distance and the lattice parameter () are reported in Figure 4, together with the MSRD for the first (NbI) and the second (SnI) shells.
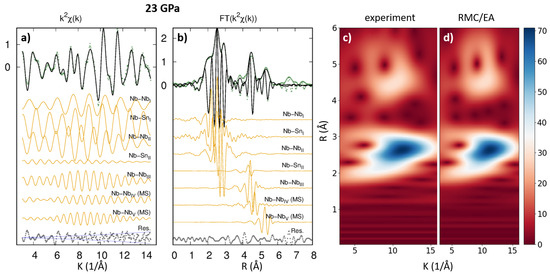
Figure 3.
Example of the best fit obtained at 23 GPa for the EXAFS signal of Nb3Sn at the Nb K-edge using the standard (left panels) and Reverse Monte Carlo (RMC) (right panels) analysis. In particular, (a,b) panels report the -weighted EXAFS signal and the corresponding Fourier transform (FT) moduli |FT|, respectively. In both the panels, the experimental data are reported as green dots, whereas the best fit curves as black lines. The partial contribution used in the analysis are shown (yellow lines), vertically shifted for sake of clarity. Right panels (c,d) show the -weighted Morlet wavelet transform for the experimental and CA-model from the RMC refinement. The Fourier transform (FT) moduli |FT| and the Back Fourier filtered (FF) curves obtained from the RMC refinement are shown in Figure S1 of the Supporting Information.
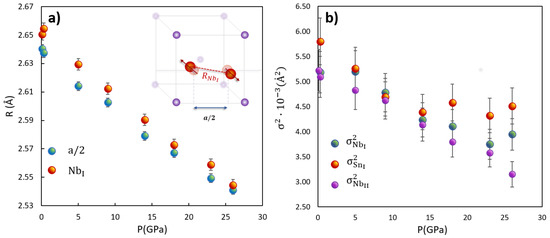
Figure 4.
(a) distance (orange symbols) and the parameters (light blue symbols) are shown. The is systematically larger than , signifying an anticorrelated Nb–Nb neighbor displacement perpendicularly to the Nb chain, as schematized in the inset. (b) The mean square relative displacement (MSRD) of the first (), second () and third () neighbors are shown as a function of pressure.
2.2. RMC Data Analysis
The RMC method is a simulation technique providing a 3D model of the atomic structure of a sample. This is obtained by minimizing the difference between the structure-related experimental signal and a configuration averaged (CA) theoretical curve calculated from the simulated atomic positions. The advantage of RMC with respect to other simulation techniques (such as standard Monte Carlo method or molecular dynamics), consists in the fact that it does not require any knowledge on the actual interatomic potentials of the material.
In the present study, the RMC analysis was performed using the EvAX suite [25]. This software combines an evolutionary algorithm (EA) with RMC, providing an optimized computational efficiency. EvAX was explicitly built for characterizing the local structural and thermal disorder in crystalline materials from the analysis of their experimental EXAFS signal within the multiple-scattering formalism [45]. It has already been successfully applied for the characterization of several systems [25,44,46].
In EvAX the configuration average EXAFS signal is obtained using the ab initio real space multiple scattering FEFF8.5L code [47], embedded in the EvAX distribution. The obtained signal is then compared with the experimental one (). The initial atomic configuration is generally defined according to the space group and lattice parameter of the selected material (- in this case). It is then possible to choose the size of the structural unit (supercell), its shape and boundary conditions. During the RMC refinement procedure, the atomic positions are randomly displaced and a new is calculated and compared to the , the new atomic configuration are accepted or discarded following a modified METROPOLIS algorithm [45]. In the present study the comparison between and has been carried out looking at the weighted squared differences between the configuration averaged theoretical and experimental spectra in both the k and R space, known as Morlet wavelet transform space (WT) [45]:
in this way, it was possible to improve the fitting constraints by taking into account the two-dimensional representation of the EXAFS signal with a simultaneous localization in the energy and frequency space domains. In order to implement the evolutionary algorithm, a population of several supercells is used whose structures are RMC refined and crossed at each generation using genetic rules so to massively improve the statistic of the simulation and makes the convergence of the procedure faster than standard RMC algorithms.
In the present study, EvAX simulations of the Nb K edge EXAFS data were performed using the Linux Cluster of the Department of Matematica e Fisica of the University Roma Tre. The minimization procedure has been performed in the -weighted WT [48], considering k between 3–16 Å−1 and R between 0–6 Å. The Nb3Sn crystallographic structure from Ref. [43] was used as the starting configuration for a population of 32 supercells, each one consisting of 3 × 3 × 3 cells with periodic boundary conditions, containing a total of 216 atoms (162 Nb + 54 Sn) per supercell. The theoretical EXAFS spectra were calculated considering MS paths with up to 4 scattering legs with 6 Å maximum length. At each RMC iteration, new supercell configurations were generated by randomly displacing all the atoms of the simulation box by a maximum displacement of 0.2 Å. The simulated annealing approach was used to efficiently reach the global minimum. The acceptance ratio of the new atomic configuration was not fixed but it decreased slowly following a cooling scheme. The length of the cooling scheme, set by the number of iterations after which only the atomic displacements improving the agreement between experiment and theory were accepted, was set to 1500. Figure 3c,d show an example of the -weight multi-shell data fit and RMC best fit in the WT space, obtained for the HP data at 23 GPa. The -weighted configuration averaged curve and its Fourier transform modulus, as obtained from the EvAX output for the HP data at at 23 GPa, are shown in the Supporting Material.
The n-body distribution functions () formalism [49] allows the description of the relative neighboring arrangements, providing a set of parameters containing their geometrical configurations. For example, the three-body configuration () is defined by two distances and the angle between them. The structural parameters defining the (interatomic distances and bond angles) and the corresponding statistical parameters (mean, variance, and anharmonic terms), are calculated directly from the 3D atomic models using a specifically written Python code with the NumPy [50] library package. In order to evaluate the simulation’s uncertainties, four independent RMC runs were performed using different seeds for the pseudo-random number generator [25]). The parameters and their uncertainties reported in Figure 5 correspond to the average values and standard deviations of those obtained from the different seeds.
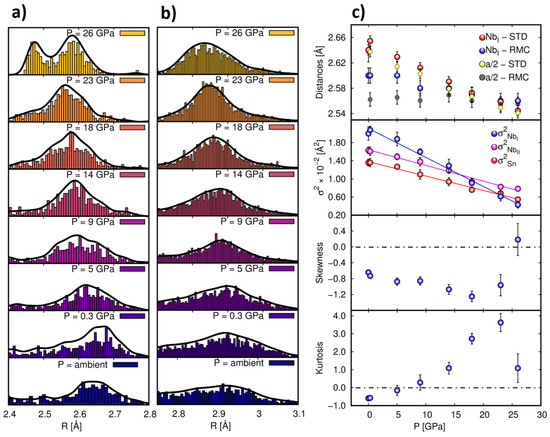
Figure 5.
Synthesis of the main RMC results. (a) and (b) distributions histograms as a function of pressure. (c) Top panel (Distance): pressure dependence of and compared to the one obtained from the standard analysis. (c) Second panel from the top (MSRD): pressure-induced evolution of the variance () of the first three shells as obtained from the RMC simulations. (c) Third panel from the top (Skewness): pressure-induced evolution of the asymmetry of the distribution of the Nb–Nb nearest neighbor pair distribution function. (c) Bottom panel (Kurtosis): pressure-induced evolution of the Kurtosis of the distribution of the first shell
3. Results and Discussion
The obtained EXAFS signal (weighted by ) and the corresponding Fourier transforms (FT) are reported in Figure 1. The effect of pressure was evident, with the squeezing of the distances in the FT and the corresponding expansion of the EXAFS oscillations in the reciprocal space. The experimental EXAFS signals were analyzed by using both the multi-shell data analysis [24,39,51] and the RMC/EA methods [25], in order to obtain detailed local structural and topological information.
Due to its intrinsic nature, the XAFS signal probed the local atomic structure around the absorbing atoms, providing the relative neighboring arrangement and the corresponding disorder around the average absorber [52]. Furthermore, owing to the strong interaction between the photo-excited electrons and the potentials of the neighboring atoms, the XAFS signal was sensitive to multiple scattering processes [47]. Therefore, the MS analysis could provide details about the topology of the local atomic structure around the absorber (bond angles, shape and orientation of coordination polyhedra, etc.) through the many body distribution functions () [25,49]. Such information is hidden from other structural probes, such as neutron and X-ray diffraction techniques [53]. The MS analysis could be a difficult task using standard EXAFS methods based on the multi-shell data refinement due to Provost et al. [54]: i. increasing number of required parameters; ii. increasing correlations among the structural parameters (as more distant neighbors are taken into account); iii. the failure of the small harmonic disorder model [41] and the occurrence of correlated disorder in SS and MS shells [41,55]. Imposing appropriate constraints (as detailed above) is a valuable way to obtain highly reliable structural information [24] but topological details can be elusive, especially when dealing with ordered structures characterized by a large number of non negligible MS contributions. Therefore, the RMC-based atomistic simulations helped deepen the topological details through the direct access to the 3D structural models. Below, the results obtained combining multi-shell and RMC EXAFS data analysis are discussed.
The main structural parameters obtained from the EXAFS data analysis are shown in Figure 4. The average lattice parameter and are shown for sake of comparison. The parameter a is the unique free parameter used to refine the further shells which are progressively less affected by the correlated disorder. It represents the analogous of the lattice parameter obtained by XRD and indeed, it matches well the experimental behavior reported in the analysis of technological Nb3Sn wires [15]. Noticeably, the Nb–Nb nearest neighbor distance is significantly larger than at low pressures but converges to with increasing pressure. Interestingly, the values of and found at 26 GPa coincide with the half of the lattice parameter obtained by HP-XRD at the same pressure, on Nb3Sn powders from technological wire sample [15]. Such a behavior suggests a general anticorrelated displacement of the Nb–Nb neighbors perpendicularly to the average Nb chain directions at ambient conditions (as schematized in the inset of Figure 4a). The application of an external pressure acts against this anticorrelation, by increasing the alignment of the Nb–Nb bonds with the cell axis. The average tilting angle of the Nb–Nb bond with respect to the Nb chain, calculated assuming a perpendicular anticorrelated displacement of the Nb–Nb pairs, decreases from 6.5(5)° at 0.3 GPa to 3(1)° at 26 GPa.
In order to take into account possible anharmonic effects, the additional cumulant expansion of the EXAFS formula was attempted for the data analysis of the NbI shell [41]. However, we found the correlations between the first cumulant (distance) and the third one (skewness), taking into account the asymmetry of the distribution, to be higher than 90%. The same is true for the correlations between , being the MSRD, and (Kurtosis) describing the tailedness of the distribution. This gave large uncertainties on the parameters making the results less reliable. Therefore, we did not use the cumulant expansion in the standard analysis but exploited the RMC analysis to obtain deeper structural details.
The plots in Figure 5 show the NbI (panel a) and SnI (panel b) pair distribution functions as obtained from the RMC models. The Nb0 and SnI distributions are broad and asymmetric at low pressures. Raising the pressure makes the distributions narrower and shortens the interatomic distances, visually showing the “squeezing” and the overall ordering of the structure. To obtain quantitative information about the local atomic structure around Nb atoms, we calculated the parameters characterizing the neighboring distributions (mean values, variances, higher moments of the distributions) as a function of pressure directly from the RMC structural models (see Figure 5c). The results obtained by RMC refinement of the EXAFS data measured at 0.3 GPa in DAC were fully consistent with those independently measured at AP on a standard set-up. This reinforces the confidence on the reproducibility of the data and the reliability of RMC analysis on independent data sets. However, from this data it is evident that at low pressures, the NbI distances, and the MSRD parameters calculated from the RMC atomic models differed from those obtained using the standard EXAFS analysis (Figure 5c, Distances and ).
To explain this discrepancy we must point out that, as discussed in the EvAX manual (http://www.dragon.lv/evax/), the structural parameters characterizing the atomic distribution (average interatomic distances, MSRD, and so on) estimated from the atomic configurations, cannot directly be compared with the results of standard EXAFS if the atomic distributions are asymmetric. This is due to the fact that Equation (1) is blind to non-Gaussian contributions [41], while the RMC model converges to the most disordered solution consistent with the experimental data [56]. In our case, absolute differences are expected between the two methods, especially for the low pressure data, where the atomic distributions appear broader and asymmetric. As the pressure squeezes the atomic distributions, the results of RMC and standard EXAFS analysis converge to similar values.
In order to prove the consistency between the present RMC and standard analysis, we considered the obtained from the RMC structure at AP and the corresponding experimentally obtained and we fitted both signals following the standard EXAFS formula. The obtained results are reported in Figure 6 and Table 2. The good agreement between the structural parameters obtained fitting the experimental and the RMC signal confirmed how the above mentioned discrepancy was liked due to the different sensibility of the two methods. In fact, while the absolute values obtained from RMC and the standard EXAFS analysis differed, the overall structural behavior was confirmed. In particular, the distances (Figure 5c—Distance panel) at low pressures result was larger than the calculated from the average next neighbor Nb distances. However, such a difference decreases with the increasing pressure and, similarly to the standard analysis case, at high pressures. This confirms the model of anticorrelated Nb–Nb displacement along directions perpendicular to the Nb chains.
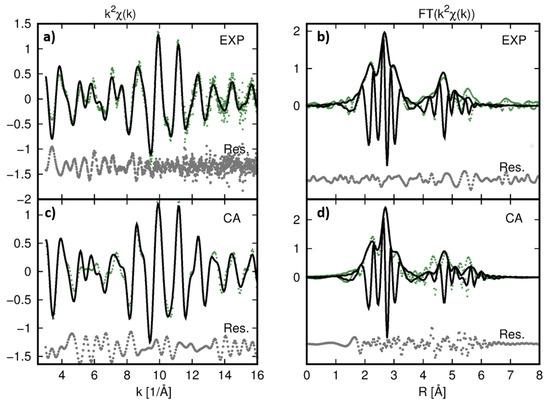
Figure 6.
Best fit of the AP data comparing the (top figures: (a,b)) and (bottom figures: (c,d)). In particular, (a,c) panels report the -weighted EXAFS signal and (b,d) panels their corresponding Fourier Trasform (FT) moduli |FT|. In both the panels, the experimental data are reported as green dots, the best fit curves as black lines and the residuals are reported as grey dots at the bottom of the figures.
Table 2.
Comparison between the structural parameters obtained from the EXAFS and RMC fit of the experimental AP data and from the EXAFS fit of the curve.
Considering the pair distribution functions obtained from the RMC model in Figure 5, it was possible to observe a bimodal distribution appearing at 26 GPa, with two sharp peaks with . We therefore tried to improve the standard EXAFS analysis of the data at 26 GPa considering a bimodal distribution for the NbI shell. During the fit, two distances were refined with the same multiplicity numbers () and MSRD (). The obtained fit is shown in Figure 7 and the corresponding results are reported in Table 3 along with the square residual function , a statistical indicator representing the best fit quality [38]. The distances (Table 3) matched well those in Figure 5a) and were half of the MSRD of the single shell model. This demonstrated the consistency between RMC and the standard EXAFS analysis and reinforces the reliability of the analysis procedures. It is important to notice that, as the double shells model slightly improved the fitting by about 5%, the number of free parameters increased by one. To evaluate the statistical significance of the best fit improvement we evaluated the associated Fisher F function [57]:
where and are the number of free parameters in the fit with single or double NbI shell, and the corresponding square residual functions and is the number of independent experimental points in the fit [57]. The experimental corresponded to a p-value , which established that the double shell model was not statistically justified in the standard analysis despite the improvement of the residual function.
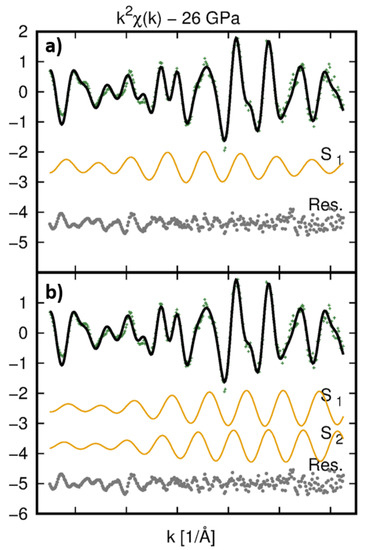
Figure 7.
Best fit of the data at 26 GPa. In panel (a) the best fit obtained with a single shell model is reported while panel (b) shows the fit obtained with a bimodal distribution model of the NbI shell. In both the panels, the experimental data are reported as green dots and the best fit curves as a black line. The contributions used to fit the NbI shell (S1 for the single shell model, S1 and S2 for the bimodal distribution model) are reported by orange lines vertically shifted for clarity. The contributions from the other coordination shells are not shown for sake of clarity. The best fit residuals () are reported as grey dots at the bottom of the panels.
Table 3.
Quantitative parameters obtained from the EXAFS fit of the data at 26 GPa. The results obtained with a single shell model and a bimodal distribution model are compared. Parameters indicated with * were constrained during the analysis. The multiplicity number N was fixed to 2 for the single shell model while for the bimodal distribution model it was constrained to 1 for each shell. In the bimodal distribution model the parameters was left free to vary for each shelll and the of the two contributions was constrained to be the same. In the last column of the table the parameters indicates the best fit quality.
The MSRD calculated for the first three shells (, , ) are shown in Figure 5c—MSRD. They were all larger than those found in Figure 4. As discussed above such a discrepancy must be attributed to the different sensitivity of the standard EXAFS formula and RMC refinement to the atomic distribution functions. However, the three MSRD data decreased under raising pressure, pointing out to an overall ordering of the structure. At lower pressure, the was the largest of the three but it decreased upon pressure increase as /GPa. Whereas, the and were both decreasing with the same (slower) rate of /GPa. To understand this effect we note that the MSRD measured by EXAFS for an hypothetical pair of atoms was [41,44]:
where is the average atomic displacement of the i-th atom around its equilibrium position in the crystallographic structure, is the atomic displacement correlation function (). In this formula means the A and B atomic displacements were uncorrelated, whereas () means that A and B atoms were displaced in the same (opposite) direction(s). The atomic displacement of distant neighbor shells was likely uncorrelated () [52], so that the more rapid decrease of was in agreement with the reduction of anti-correlated displacement of Nb atoms perpendicular to the Nb chain discussed above, and even suggested a positive correlation when raising the pressure above 23 GPa.
The higher moments of the NbI distribution were calculated directly from the 3D atomic models (Figure 5c—Skewness and Kurtosis). At ambient pressure, the NbI pair distribution is strongly asymmetric (Skewness ), with a broad tail at low R. Under applied pressures (up to 20 GPa), the asymmetry slightly increased (Skewness absolute value), then it suddenly decreased and vanished at 26 GPa. The pressure-induced evolution of the Kurtosis showed an initial negative value at AP and 0.3 GPa. When raising the pressure, its value increased systematically up to 23 GPa then suddenly dropped down once 26 GPa are reached. These findings established a complex pressure-induced evolution of the Nb–Nb pair distribution functions and pointed out an anomaly above 23 GPa. Noticeably, no structural changes were found by XRD in the same pressure range, underlining the local nature of these changes.
Further details about the local atomic arrangement around the Nb atoms are obtained by looking at the three body distribution functions , in particular by looking at the order along the Nb chains. The sensitivity of EXAFS to the of the Nb–Nb–Nb triangles was high because the MS signal was enhanced by the focusing effect on the central atom.
The RMC atomic model allowed the geometrical parameters defining the Nb–Nb–Nb arrangement to be directly calculated, in particular, the two Nb–Nb shorter bonds , , and the angle between them . In Figure 8 (panels b) the distribution is presented. It is possible to observe how its average value increased from in the low pressure RMC models (AP and 0.3 GPa) up to for the highest pressure model (26 GPa). This trend was in agreement with the standard EXAFS analysis and confirmed that a higher pressure not only squeezed the structure (interatomic distances) but also reduced the anticorrelated displacement of the Nb neighbors perpendicular to the Nb chains. Additional qualitative information can be derived by looking at the vs. plots (Figure 8a: panels) providing a view of the Nb–Nb–Nb displacement correlation along the chains. At low pressures (AP and 0.3 GPa) the vs. points were quite randomly scattered. Raising the pressure to 5 GPa established a peculiar trend in the vs. distribution with two different atomic displacement models: A fraction of configurations were arranged close to the center of the panels () and were weakly correlated; The remaining fraction of point roughly aligned along the plot’s diagonal, suggesting a configuration where and varied in an anti-correlated way: larger correspond to shorter and vice versa, with the relative difference between and being . We emphasize how this finding established an evolution of the Nb–Nb–Nb up to 5 GPa, in the same pressure region where anomalies in the compressibility of the Nb3Sn (technological wires) have been reported [15].
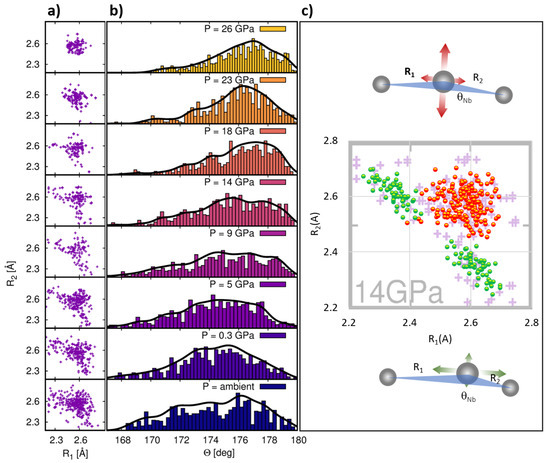
Figure 8.
Pressure induced evolution of the distances (a) and corresponding angles (b). Explanatory model (c) of the correlated disorder for distribution compared with the experimental data obtained from RMC model at 14 GPa (background). The points are calculated by randomly displacing Nbc. For the red points the average distances are the same and the random displacement is preferentially perpendicular to the Nb chain (as schematized in the top scheme). For the green points the average distances are different and the random displacement is preferentially parallel to the Nb chain (as schematized in the bottom scheme).
In order to represent the Nb–Nb–Nb behavior above 5 GPa, we built a qualitative model as schematized in the right panels of Figure 8c: i. a fraction of Nb–Nb–Nb configuration (highlighted in red) corresponds to Nb-Nbc-Nb isosceles triangles () with Nbc randomly displaced, preferentially in the direction perpendicular to the Nb chains (Figure 8c, top scheme). ii. The other fraction (highlighted in green), was associated to the asymmetric arrangement of Nbc (with or ) where the Nbc was randomly displaced, preferentially in the direction parallel to the Nb chains, thus providing a local dimerization of the Nb–Nb bonds (Figure 8c, bottom scheme). The results of such a simulation are shown for the 14 GPa analysis in Figure 8c (center panel) for sake of qualitative comparison. Under compression, the fraction of anticorrelated configurations decreased also reducing . The fraction of dimerized configurations disappeared at 23 GPa. Upon further compression (up to 26 GPa) the R2 vs. R1 distribution results were more squeezed. In particular, the value of the average distribution of became very close to (Figure 4 and Figure 5). Interestingly, while a fraction of the configurations was localized at the points , at such a pressure a novel correlation mode was established, where shorter (around 2.5 Å) and sharper R2 vs. R1) distances were associated to longer (around 2.6 Å) and wider () distances, corresponding to the bimodal distribution highlighted in Figure 5.
Briefly the analysis of the Nb K-edge EXAFS data carried out combining traditional and RMC approaches provided a deep insight on the evolution of the local atomic structure around the Nb atoms in Nb3Sn as a function of pressure. In particular, the EXAFS data analysis showed an anticorrelated displacement of Nb atoms perpendicularly to the Nb chains which decreased when raising the applied pressure. Our results also suggested the loss of the cubic (-) symmetry at the local scale. Noticeably, recent ab initio simulations [58] showed that lower symmetry structures were energetically favoured with respect to the - in other A15 systems such as Nb3Al. In particular, the symmetry allowing anticorrelated Nb atom displacements perpendicularly to the Nb chains, was energetically favored with respect to the - one at ambient conditions and in a wide range of pressures. This work suggested that a similar behavior is observed in Nb3Sn at the local scale.
The RMC analysis provided a further insight into the local Nb3Sn structure thanks to the direct access to the 3D atomistic models. The analysis of the NbI nearest neighbors distributions pointed out non-Gaussian contributions (Figure 5), in particular, the negative Skewness () being associated to a fractions of closer Nb–Nb pairs. The Kurtosis parameter increased with raising pressure. Raising the pressure above 23 GPa sudden reduced the non-Gaussian contributions. This behavior is better understood looking at the parameters defining the three body distribution function of the the Nb–Nb–Nb chains (Figure 8). The RMC atomistic model suggested a bimodal behavior for the Nb–Nb–Nb configurations along the Nb chains: some of them depicted the symmetric displacement of the central Nb perpendicularly to the chain (isosceles triangles) coherently with the anticorrelated Nb–Nb displacement discussed above. Nevertheless a fraction of the Nb–Nb–Nb triangles had R1 ≠ R2, with . These scalene triangles produced the partial dimerization of the Nb chains. It is noticeable that recent single crystal HP-XRD measurements performed at low temperatures (10 K) [17] on a slightly non-stoichiometric Nb3Sn1−x demonstrated a pressure induced symmetry lowering to the space group at around 3 GPa where some of the Nb–Nb chains were dimerized in agreement with the present RMC EXAFS analysis. Our results coherently recognized that the anticorrelated displacement along the Nb–Nb–Nb chains was locally stabilized in that low pressure room temperature region. Finally, our EXAFS analysis showed that raising the pressure up to 26 GPa suppressed most of the local disorder.
4. Conclusions
In this study, the local atomic structure around Nb in Nb3Sn has been characterized in situ between ambient pressure and 26 GPa by XAS. The Nb K-edge EXAFS data were analysed using a standard multi-shell method, based on small Gaussian disorder model and a RMC method, providing a 3D atomic structural model. The results obtained from analysis carried out independently on the same sample, using different experimental set-up (AP and 0.3 GPa) are completely consistent. This demonstrates the reproducibility of the adopted procedures. The results of AP multishell EXAFS data analysis are in good agreement with previous literature [23]. The results obtained with RMC and the standard EXAFS analysis differ at low pressure, likely due to the different sensitivity of the two data analysis techniques to the structural disorder, and the presence of alarge non-Gaussian contributions. In fact, they become fully consistent at high pressures, where the sharper radial distributions are better described by the small Gaussian disorder model at the basis of the standard EXAFS formula. This strengthens the consistency between standard and RMC EXAFS analysis.
The results reported here provide a deep insight on the Nb local atomic structure, highlighting a complex behavior of Nb arrangement at the atomic scale which is not detectable by long range order probes such as X-ray diffraction. Noticeably, our EXAFS findings are coherent with novel details about the atomic structure of A15 systems which recently came to light [15,17,18,19].
It is worthwhile to note that the details of the phononic spectra and the electron density of states (DOS), both intimately related to the details of the atomic structure, are dominant in determining the stress-induced critical performance degradation of Nb3Sn [59,60,61]. The present results represent a new knowledge, relevant for providing accurate physical models in view of a better understanding of the superconductive properties, thus helping to individuate a route towards improving their critical properties.
Supplementary Materials
The following are available online at https://www.mdpi.com/article/10.3390/cryst11040331/s1.
Author Contributions
C.M. and S.A. conceived the experiment. S.A., R.L., R.T. and C.M. conducted the experiment. I.S. and C.M. analyzed the results. T.S. and R.F. prepared the sample. T.I. provided the nano-polycrystalline diamonds. E.S. collaborated in understanding the results. The manuscript is written through contributions of all authors. All authors have given approval to the final version of the manuscript.
Funding
This work has been carried out within the framework of the EUROfusion Consortium and has received funding from the Euratom Research and Training Programme 2014–2018 and 2019–2020 under grant agreement No 633053.The views and opinions expressed herein do not necessarily reflect those of the European Commission. S.A. acknowledges the support from the Natural Environment Research Council of Great Britain and Northern Ireland via grants NE/M000117/1 and NE/M00046X/1.
Institutional Review Board Statement
Not applicable.
Informed Consent Statement
Not applicable.
Data Availability Statement
Data are provided in the figures of the article.
Acknowledgments
The authors acknowledge the ESRF for provision of beamtime on the beamlines BM23 (proposal number: MA-3442) and J. Jacobs for DAC preparation.
Conflicts of Interest
The authors declare no conflict of interest.
Abbreviations
The following abbreviations are used in this manuscript:
| AP | Ambient Pressure |
| DAC | Diamond Anvil Cell |
| DFT | Density Functional Theory |
| DOS | Density of State |
| EA | Evolutionary Algorithm |
| EXAFS | Extended X-ray Absorption Fine Structures |
| FT | Fourier Transform |
| HP | High Pressure |
| MS | Multiple Scattering |
| MSRD | Mean square relative displacement |
| RMC | Reverse Monte Carlo |
| SS | Single Scattering |
| WT | Morlet wavelet transform space |
| XAFS | X-ray Absorption Fine Structures |
| XAS | X-ray Absorption Spectroscopy |
| XRD | X-ray Diffraction |
References
- Matthias, B.T.; Geballe, T.H.; Geller, S.; Corenzwit, E. Superconductivity of Nb3Sn. Phys. Rev. 1954, 95, 1435. [Google Scholar] [CrossRef]
- Kunzler, J.E.; Buehler, E.; Hsu, F.S.L.; Wernick, J.H. Superconductivity in Nb3Sn at High Current Density in a Magnetic Field of 88 kgauss. Phys. Rev. Lett. 1961, 6, 89–91. [Google Scholar] [CrossRef]
- Parrell, J.A.; Field, M.B.; Zhang, Y.; Hong, S. Advances in Nb3Sn strand for fusion and particle accelerator applications. IEEE Trans. Appl. Supercond. 2005, 15, 1200–1204. [Google Scholar] [CrossRef]
- Godeke, A. A review of the properties of Nb3Sn and their variation with A15 composition, morphology and strain rate. Supercond. Sci. Technol. 2006, 19, R68. [Google Scholar] [CrossRef]
- Bottura, L.; Rijk, G.; Rossi, L.; Todesco, E. Advanced accelerator magnets for upgrading the LHC. IEEE Trans. Appl. Supercond. 2012, 22, 4002008. [Google Scholar] [CrossRef]
- Vostner, A.; Salpietro, E. Enhanced critical current densities in Nb3Sn superconductors for large magnets. Supercond. Sci. Technol. 2006, 19, S90. [Google Scholar] [CrossRef]
- ITER Home Page. Available online: http://https://www.iter.org/factsfigures (accessed on 1 February 2021).
- Zhang, R.; Gao, P.; Wang, X.; Zhou, Y. First-principle study on elastic and superconducting properties of Nb3Sn and Nb3Al under hydrostatic pressure. AIP Adv. 2015, 5, 107233. [Google Scholar] [CrossRef]
- Ren, Z.; Gamperle, L.; Fete, A.; Senatore, C.; Jaccard, D. Evolution of T2 resistivity and superconductivity in Nb3Sn under pressure. Phys. Rev. B 2017, 95, 184503. [Google Scholar] [CrossRef]
- Quiao, L.; He, Y.; Wang, H.; Shi, Z.; Li, Z.; Xiao, G.; Yang, L. Effect on grain boundary deformation on the critical temperature degradation of superconducting Nb3Sn under hydrostatic pressure. J. Alloys Compd. 2021, 864, 158116. [Google Scholar] [CrossRef]
- Nishijima, G.; Watanabe, K.; Araya, T.; Katagiri, K.; Kasaba, K.; Miyoshi, K. Effect of transverse compressive stress on internal reinforced Nb3Sn superconducting wires and coils. Cryogenics 2005, 45, 653–658. [Google Scholar] [CrossRef]
- Lu, J.; Han, K.; Walsh, R.P.; Miller, J.R. IC Axial Strain Dependence of High Current Density Nb3Sn Conductors. IEEE Trans. Appl. Supercond. 2007, 17, 2639–2642. [Google Scholar] [CrossRef]
- Nijhuis, A.; van Meerdervoort, R.P.P.; Krooshoop, H.J.G.; Wessel, W.A.J.; Zhou, C.; Rolando, G.; Sanabria, C.; Lee, P.J.; Larbalestier, D.C.; Devred, A.; et al. The effect of axial and transverse loading on the transport properties of ITER Nb3Sn strands. Supercond. Sci. Technol. 2013, 26, 084004. [Google Scholar] [CrossRef]
- Zhang, W.J.; Liu, Z.Y.; Liu, Z.L.; Cai, L.C. Melting curves and entropy of melting of iron under Earth’s core conditions. Phys. Earth Planet. Inter. 2015, 244, 69–77. [Google Scholar] [CrossRef]
- Loria, R.; Marzi, G.D.; Anzellini, S.; Muzzi, L.; Pompeo, N.; Gala, F.; Silva, E. The Effect of hydrostatic pressure on the superconducting and structural properties of Nb3Sn: Ab-initio modeling ans SR-XRD investigation. IEEE Trans. Appl. Supercond. 2017, 27, 8400305. [Google Scholar] [CrossRef]
- Chu, C.W. Pressure-Enhanced Lattice Transformation in Nb3Sn Single Crystal. Phys. Rev. Lett. 1974, 33, 1283–1286. [Google Scholar] [CrossRef]
- Svitlyk, V.; Mezouar, M. Pressure-Induced Symmetry Lowering in Nb3Sn1−x Superconductor. 2020. Available online: http://xxx.lanl.gov/abs/2011.14982 (accessed on 23 March 2021).
- Mkrtcheyan, V.; Kumar, R.; Baker, J.; Connolly, A.; Antonio, D.; Cornelius, A.; Zhao, Y. High pressure transport and structural studies on Nb3Ga superconductor. Physica B 2015, 459, 21–23. [Google Scholar] [CrossRef]
- Yu, Z.; Li, C.; Liu, H. Compressibility anomaly in the superconducting material Nb3Al under high pressure. Physica B 2012, 407, 3635–3638. [Google Scholar] [CrossRef]
- Mao, J.; Chen, Y. Ground-state crystal structures of superconducting Nb3Al and the phase transformation under high pressures. J. Appl. Phys. 2018, 124, 173902. [Google Scholar] [CrossRef]
- Bunker, G. Introduction to XAFS. A Practical Guide to X-ray Absorption Fine Structure Spectroscopy; Cambridge University Press: Cambridge, UK, 2010. [Google Scholar]
- Sakashita, H.; Kamon, K.; Terauchi, H.; Kamijo, N.; Maeda, H.; Toyota, N.; Fukase, T. EXAFS Study on Premartensitic Phase in Nb3Sn. J. Phys. Soc. Jpn. 1987, 56, 4183–4187. [Google Scholar] [CrossRef]
- Heald, S.; Tarantini, C.; Lee, P.; Brown, M.; Sung, Z.; Ghosh, A.; Larbalestier, D. Evidence from EXAFS for different Ta/Ti site occupancy in high critical current density Nb3Sn superconductor wires. Sci. Rep. 2018, 8, 4798. [Google Scholar] [CrossRef]
- Battocchio, C.; Meneghini, C.; Fratoddi, I.; Venditti, I.; Russo, M.V.; Aquilanti, G.; Maurizio, C.; Bondino, F.; Matassa, R.; Rossi, M.; et al. Silver Nanoparticles Stabilized with Thiols: A Close Look at the Local Chemistry and Chemical Structure. J. Phys. Chem. C 2012, 116, 19571–19578. [Google Scholar] [CrossRef]
- Timoshenko, J.; Kuzmin, A.; Purans, J. EXAFS study of hydrogen intercalation into ReO3 using the evolutionary algorithm. J. Phys. Condens. Matter 2014, 26, 055401. [Google Scholar] [CrossRef] [PubMed]
- Mathon, O.; Beteva, A.; Borrel, J.; Bugnazet, D.; Gatla, A.; Hino, R.; Kantor, I.; Mairs, T.; Munoz, M.; Pasternak, S.; et al. The Time-resolved and Extreme-conditions XAS (TEXAS) facility at the European Synchrotron Radiation Facility: The energy-dispersive X-ray absorption spectroscopy beamline ID24. J. Synchrotron Radiat. 2015, 22, 1548–1554. [Google Scholar] [CrossRef] [PubMed]
- Welter, E.; Chernikov, R.; Herrmann, M.; Nemausat, R. A beamline for bulk sample x-ray absorption spectroscopy at the high brilliance storage ring PETRA III. AIP Conf. Proc. 2019, 2054, 040002. [Google Scholar] [CrossRef]
- Ishimatsu, N.; Matsumoto, K.; Maruyama, H.; Kawamura, N.; Mizumaki, M.; Sumiya, H.; Irifune, T. Glitch-free X-ray absorption spectrum under high pressure obtained using nano-polycrystalline diamond anvils. J. Synchrotron Radiat. 2012, 19, 768–772. [Google Scholar] [CrossRef]
- Irifune, T.; Kurio, A.; Sakamoto, S.; Inoue, T.; Sumiya, H. Ultrahard polycrystalline diamond from graphite. Nature 2003, 421, 599–600. [Google Scholar] [CrossRef]
- Spina, T. Proton Irradiation Effects on Nb3Sn Wires and Thin Platelets in View of High Luminosity LHC Upgrade. Ph.D. Thesis, Deparement de Physique de la Matiere Quantique (DQMP), Universite de Geneve, Geneva, Switzerland, 2015. [Google Scholar]
- Bragg, W.L.; Williams, E.J. The effect of thermal agitation on atomic arrangement in alloys. Proc. R. Soc. A 1934, 145, 699–730. [Google Scholar]
- Flükiger, R.; Spina, T.; Cerutti, F.; Ballarino, A.; Scheuerlein, C.; Bottura, L.; Zubavichus, Y.; Ryazanov, A.; Svetogovov, R.D.; Shavkin, S.; et al. Variation ofTc, lattice parameter and atomic ordering in Nb3Sn platelets irradiated with 12 MeV protons: Correlation with the number of induced Frenkel defects. Supercond. Sci. Technol. 2017, 30, 054003. [Google Scholar] [CrossRef]
- Alimenti, A.; Pompeo, N.; Torokhtii, K.; Spina, T.; Flükiger, R.; Muzzi, L.; Silva, E. Surface Impedance Measurements on Nb3Sn in High Magnetic Fields. IEEE Trans. Appl. Supercond. 2019, 29, 3500104. [Google Scholar] [CrossRef]
- Alimenti, A.; Pompeo, N.; Torokhtii, K.; Spina, T.; Flükiger, R.; Muzzi, L.; Silva, E. Microwave measurements of the high magnetic field vortex motion pinning parameters in Nb3Sn. Supercond. Sci. Technol. 2021, 34, 014003. [Google Scholar] [CrossRef]
- Klotz, S.; Chervin, J.C.; Munsch, P.; Le Marchand, G. Hydrostatic limits of 11 pressure. J. Phys. D Appl. Phys. 2009, 42, 075413. [Google Scholar] [CrossRef]
- Syassen, K. Ruby under pressure. High Press. Res. 2008, 28, 75–126. [Google Scholar] [CrossRef]
- Dorogokupets, P.I.; Oganov, A.R. Ruby, metals, and MgO as alternative pressure scales: A semiempirical description of shock-wave, ultrasonic, x-ray, and thermochemical data at high temperatures and pressures. Phys. Rev. B 2007, 75, 024115. [Google Scholar] [CrossRef]
- Meneghini, C.; Bardelli, F.; Mobilio, S. Estra-Fitexa: A Software Package for Exafs Data Analysis. Nucl Instrum. Methods Phys. Res. Sect. B Beam Interact. Mater. Atoms 2012, 285, 153–157. [Google Scholar] [CrossRef]
- Meneghini, C.; Matteo, S.D.; Monesi, C.; Neisius, T.; Paolasini, L.; Mobilio, S.; Natoli, C.R.; Metcalf, P.A.; Honig, J.M. Antiferromagnetic–paramagnetic insulating transition in Cr-doped V2O3 investigated by EXAFS analysis. J. Phys. Condens. Mat. 2009, 21, 355401. [Google Scholar] [CrossRef] [PubMed]
- James, F. MINUIT: Function Minimization and Error Analysis Reference Manual Version 94.1. CERN Program Library D506. 1994. Available online: http://cdssls.cern.ch/record/2296388/files/minuit.pdf (accessed on 23 March 2021).
- Fornasini, P.; Monti, F.; Sanson, A. On the cumulant analysis of EXAFS in crystalline solids research papers. J. Synchrotron Radiat. 2001, 8, 1214–1220. [Google Scholar] [CrossRef] [PubMed]
- Rehr, J.; Kas, J.; Vila, F.; Prange, M.; Jorissen, K. Parameter-free calculations of X-ray spectra with FEFF9. Phys. Chem. Chem. Phys. 2010, 12, 5503–5513. [Google Scholar] [CrossRef]
- Shirane, G.; Axe, J.D. Neutron Scattering Study of the Lattice-Dynamical Phase Transition in Nb3Sn. Phys. Rev. B 1971, 4, 2957–2963. [Google Scholar] [CrossRef]
- Kuzmin, A.; Timoshenko, J.; Kalinko, A.; Jonane, I.; Anspoks, A. Treatment of disorder effects in X-ray absorption spectra beyond the conventional approach. Radiat. Phys. Chem. 2020, 175. [Google Scholar] [CrossRef]
- Timoshenko, J.; Kuzmin, A.; Purans, J. Reverse monte carlo modeling of thermal disorder in crystalline materials from EXAFS spectra. Comput. Phys. Commun. 2012, 183, 1237–1245. [Google Scholar] [CrossRef]
- Jonane, I.; Cintis, A.; Kalinko, A.; Chernikov, R.; Kuzmin, A. Low temperature X-ray absorption spectroscopy study of CuMoO4 and CuMo0.90W0.10O4 using reverse monte-carlo method. Radiat. Phys. Chem. 2020, 175, 108411. [Google Scholar] [CrossRef]
- Rehr, J.; Albers, R.C. Theoretical approaches to x-ray absorption fine structure. Rev. Mod. Phys. 2000, 72, 621. [Google Scholar] [CrossRef]
- Timoshenko, J.; Kuzmin, A. Wavelet data analysis of EXAFS spectra. Comput. Phys. Commun. 2009, 180, 920–925. [Google Scholar] [CrossRef]
- Filipponi, A.; Di Cicco, A.; Natoli, C.R. X-ray-absorption spectroscopy and n-body distribution functions in condensed matter. I. Theory. Phys. Rev. B 1995, 52, 15122–15134. [Google Scholar] [CrossRef]
- Harris, C.R.; Millman, K.J.; van der Walt, S.J.; Gommers, R.; Virtanen, P.; Cournapeau, D.; Wieser, E.; Taylor, J.; Berg, S.; Smith, N.J.; et al. Array programming with NumPy. Nature 2020, 585, 357–362. [Google Scholar] [CrossRef]
- Meneghini, C.; Ray, S.; Liscio, F.; Bardelli, F.; Mobilio, S.; Sarma, D.D. Nature of “Disorder” in the Ordered Double Perovskite Sr2FeMoO6. Phys. Rev. Lett. 2009, 103, 046403. [Google Scholar] [CrossRef]
- Timoshenko, J.; Anspoks, A.; Cintins, A.; Kuzmin, A.; Purans, J.; Frenkel, A.I. Neural Network Approach for Characterizing Structural Transformations by X-Ray Absorption Fine Structure Spectroscopy. Phys. Rev. Lett. 2018, 120, 225502. [Google Scholar] [CrossRef]
- Egami, T.; Billinge, S. (Eds.) Underneath the Bragg Peaks, 2nd ed.; Pergamon Materials Series; Elsevier: Pergamon, Turkey, 2012; Volume 16. [Google Scholar]
- Provost, K.; Beret, E.; Muller, D.; Marcos, E.S.; Michalowicz, A. Impact of the number of fitted Debye-Waller factors on EXAFS fitting. J. Phys. Conf. Ser. 2013, 430, 012015. [Google Scholar] [CrossRef]
- Filipponi, A.; Di Cicco, A. X-ray-absorption spectroscopy and n -body distribution functions in condensed matter. II. Data analysis and applications. Phys. Rev. B 1995, 52, 15135–15149. [Google Scholar] [CrossRef] [PubMed]
- Tucker, M.G.; Keen, D.A.; Dove, M.T.; Goodwin, A.L.; Hui, Q. RMCProfile: Reverse Monte Carlo for polycrystalline materials. J. Phys. Condens. Matter 2007, 19, 335218. [Google Scholar] [CrossRef]
- Michalowicz, A.; Provost, K.; Laruelle, S.; Mimouni, A.; Vlaic, G. F-test in EXAFS fitting of structural models. J. Synchr. Radiat. 1999, 6, 233–235. [Google Scholar] [CrossRef]
- Mao, H.K.; Chen, X.J.; Ding, Y.; Li, B.; Wang, L. Solids, liquids, and gases under high pressure. Rev. Mod. Phys. 2018, 90, 015007. [Google Scholar] [CrossRef]
- Markiewicz, W. Elastic stiffness model for the critical temperature Tc of Nb3Sn including strain dependence. Cryogenics 2004, 44, 767–782. [Google Scholar] [CrossRef]
- Valentinis, D.F.; Berthod, C.; Bordini, B.; Rossi, L. A theory of the strain-dependent critical field in Nb3Sn, based on anharmonic phonon generation. Supercond. Sci. Technol. 2013, 27, 025008. [Google Scholar] [CrossRef]
- Godeke, A.; Hellman, F.; ten Kate, H.H.J.; Mentink, M.G.T. Fundamental origin of the large impact of strain on superconducting Nb3Sn. Supercond. Sci. Technol. 2018, 31, 105011. [Google Scholar] [CrossRef]


Publisher’s Note: MDPI stays neutral with regard to jurisdictional claims in published maps and institutional affiliations. |
© 2021 by the authors. Licensee MDPI, Basel, Switzerland. This article is an open access article distributed under the terms and conditions of the Creative Commons Attribution (CC BY) license (http://creativecommons.org/licenses/by/4.0/).