Article

A Characteristic Study of Polylactic Acid/Organic Modified Montmorillonite (PLA/OMMT) Nanocomposite Materials after Hydrolyzing

1
Department of Chemical Engineering, Army Academy, Taoyuan City 32092, Taiwan
2
Center for General Education, Chung Yuan Christian University, Taoyuan City 32023, Taiwan
3
Department of Chemical and Materials Engineering, Vanung University, Taoyuan City 32061, Taiwan
*
Author to whom correspondence should be addressed.
Crystals 2021, 11(4), 376; https://doi.org/10.3390/cryst11040376
Submission received: 27 February 2021 / Revised: 26 March 2021 / Accepted: 31 March 2021 / Published: 3 April 2021
(This article belongs to the Special Issue Disordered Crystalline Materials)

Abstract

:
In this study, the montmorillonite (MMT) clay was modified with NH4Cl, and then the structures were exfoliated or intercalated in a polylactic acid (PLA) matrix by a torque rheometer in the ratio of 0.5, 3.0, 5.0 and 8.0 wt%. X-ray diffraction (XRD) revealed that the organic modified-MMT(OMMT) was distributed successfully in the PLA matrix. After thermal pressing, the thermal stability of the mixed composites was measured by a TGA. The mixed composites were also blended with OMMT by a co-rotating twin screw extruder palletizing system, and then injected for the ASTM-D638 standard specimen by an injection machine for measuring the material strength by MTS. The experimental results showed that the mixture of organophilic clay and PLA would enhance the thermal stability. In the PLA mixed with 3 wt% OMMT nanocomposite, the TGA maximum decomposition temperature (Tmax) rose from 336.84 °C to 339.08 °C. In the PLA mixed with 5 wt% OMMT nanocomposite, the loss of temperature rose from 325.14 °C to 326.48 °C. In addition, the elongation rate increased from 4.46% to 10.19% with the maximum loading of 58 MPa. After the vibrating hydrolysis process, the PLA/OMMT nanocomposite was degraded through the measurement of differential scanning calorimetry (DSC) and its Tg, Tc, and Tm1 declined.

1. Introduction

Recently, biodegradable polymers have been intensively studied due to the depletion of fossil energy and its impacts on the environment [1,2,3]. Biodegradable polymers, defined by the American Society for Testing and Material (ASTM) as being degradable by reacting with microbes, such as germs and fungi, can re-nourish soils during composting. In other words, these polymers possess sustainability and eco-efficiency. Polylactic acid (PLA), one of the polymers, represents the best environmentally friendly product. It has a hydrolyzable ester functional group, enabling its waste to be naturally decomposed to H2O and CO2 during composting [4]. Therefore, PLA is so far the most economical and competitive biodegradable polymer [5,6,7,8,9,10].
PLA is a long-chained thermoplastic polyester, including α, β and γ structures [11,12], as shown in Figure 1. However, compared with traditional polymers, the applications of pure PLA is limited due to its rigid and less flexible characteristics [13,14,15,16,17]. In the industry, the procedures for manufacturing PLA are (1) hydrolysis of corn and wheat, (2) transfer of starch to glucose or maltose, (3) biological fermentation to obtain lactic acid monomer, (4) condensation or ring opening polymerization [18,19].
Organic modified montmorillonite (OMMT) has a large interlayer distance and lipophilicity. The properties not only decrease the surface energy of silicate, but also increase the affinity between OMMT layers and polymer molecular chains, and result in the uniform distribution of OMMT in the polymer substrate to form polymer/layered silicate (PLS) nanocomposites [20,21,22]. In the practical application, even the weight percentage of OMMT in PLS is less than 10 wt% (usually 3–5%), and the product’s stiffness, strength, heat resistance and mechanical properties can compete with conventional glass fibers or other mineral filling enhanced composites (filler content ≧ 30%) [23,24,25]. Furthermore, OMMT has outstanding brightness and transparency, because its nano-particle is smaller than the wave length of visible light [26,27].
The manufacture of PLS nanocomposites is called intercalation compounding, including intercalative polymerization and in-situ polymerization [28]. Intercalative polymerization can be categorized as monomer addition polymerization and monomer condensation, while in-situ polymerization can be classified into polymer solution intercalation and polymer melting intercalation. The purpose of manufacturing PLS is to accomplish intercalation dispersion, which keeps the ordered structure of layered silicate, or exfoliation dispersion. Because of that, the disordered structure causes the structure’s discrepancy and various properties [29].
So far, several researches have focused on the manufacture and properties investigation of PLA nanocomposites [30,31,32]. Bandyopadhyay et al. found that layered silicate, prepared by polymer melting intercalation, could be used as the barrier for blocking the gas, increasing the decomposition temperature (Tmax) of PLA/organic modified fluorine clay nanocomposites [33]. Sinha et al. investigated the heat deformation test (HDT) of PLA/organic modified synthesized fluorine mica nanocomposites and indicated that heat deformation was substantially improved by a small change of Tm [34]. Paul et al. studied the heat stability of PLA nanocomposites and found that the thermal stability increased primarily but then decreased as the content of OMMT increased [35,36]. The bio-degradation of PLA is usually complex. At first, the unstable bonds on the main chain are hydrolyzed to develop oligomers. Then, oligomers are further decomposed to H2O and CO2 when an appropriate enzyme exists. The above chain reaction of the hydrolysis of the polymer makes a huge impact on bio-degradation [4,9].
It is a major challenge in the chemical process to produce biodegradable nanocomposites with good quality and homogeneous blending quickly and in large quantities. Therefore, in this study, PLA/OMMT nanocomposites were prepared by a torque rheometer and a co-rotating twin screw extruder method—instead of the conventional solution blending method, in which a co-rotating twin screw extruder pelletizing system—was used for mechanical blending and molding by an injection mold to produce PLA/OMMT nanocomposites and specimens quickly and in large quantities. The nanocomposites were subsequently subjected to thermogravimetric analysis to measure their thermal stability. PLA/OMMT nanocomposites were immersed in phosphate solution at 37 °C to monitor the thermal properties before/after hydrolysis by differential scanning calorimetry (DSC), and finally, the hydrolyzed PLA/OMMT nanocomposites were subjected to a tensile strength test to determine the material strength.

2. Materials and Methods

2.1. Materials

PLA (molecular weight: 180,000~200,000 g/mol) was purchased from Wei Mon Industry Co., LTD, Hsinchu, Taiwan. The organic modified montmorillonite (PK-2023) was purchased from Paikong (Taiwan). The phosphate buffer solution (0.1 M) was purchased from Sigma-Aldrich Co., LTD, Berlin, Germany.

2.2. Preparation of Hot Pressed Film Specimen

40 g of PLA was blended with various amounts of OMMT (0, 0.5, 3, 5, 8 wt%) by a torque rheometer (Brabender, Model PL 2000, Hsinchu, Taiwan), and then cut into pellets. The sample was first poured into the feed tank according to the formula ratio in Table 1, and the mixing temperature (200 °C) was set for hot melting with a fixed speed of 50 rpm/min. After 2 min, the OMMT was poured into the feed tank for mixing, and the mixing sample was taken out after 6 min of mixing. After that, the nanocomposite was pressed (200 °C) to form the 0.5-mm thick specimen by a compression molding machine (HAS-100 TON, Hsinchu, Taiwan). The operation procedure of the hot press is as follows: raise the lower heating plate to a distance of about 1 cm from the upper heating plate and preheat the material for 2 min. Next, raise the lower heating plate pressure to 650–675 psi and hold for 30 s; then, raise the lower heating plate pressure to 1400–1450 psi and hold for 10 s. Relieve the pressure of the lower heating plate to an appropriate distance to take the object, remove the covered Teflon cloth and take out the film-like specimen. Finally, this specimen is sealed by aluminum foil and left in a dry cabinet.

2.3. Preparation of Injection Molding Specimen

4000 g of PLA was blended with various amounts of OMMT (0, 0.5, 3, 5, 8 wt%) by a co-rotating twin screw extruder pelletizing system (SHJ-36), and the parameters and conditions of the machine operation are shown in Table 2. The nanocomposite was then molded as a specimen by the injection molding machine (FS-90) according to the criterion of ASTM_D638 (Type 1), as shown Figure 2. The specimen was dried by the hot air oven under the temperature setting of 60 °C for 24 h, before being sealed by aluminum foil and left in a dry cabinet. The tensile strength variation of the tested specimen would be measured by the standard material testing system (810 MTS) under the setting conditions of a pulling speed of 5 mm/min and a clamping distance of 115 mm.

2.4. Decomposition Test

The pressed PLA/OMMT nanocomposite film with various OMMT amounts (0, 0.5, 3, 5, 8 wt%) was cut into specimens with the size of 30 mm in length, 5 mm in width and 0.5 mm in thickness. These specimens were soaked into the 20 mL phosphate buffer solution (PBS, pH = 7.4) and then put in the constant low temperature shaking bath (Dengyng DKW-40, Hsinchu, Taiwan) under the temperature setting of 37 °C for the designed periods (0, 3, 6, 9 weeks) for the decomposition test by DSC. The specimens were taken out before 3, 6 and 9 weeks later since the beginning of decomposition for the DSC test.

2.5. Property Analysis

2.5.1. Wide-Angle X-ray Diffraction (WAXD)

The value of X-ray diffraction 2θ could be determined through the Thermo ARL X’tra X-ray diffractometer. The interlayer distance (d) could be calculated according to Bragg’s equation (nλ = 2d sinθ). For analyzing the PLA/OMMT nanocomposite, the scanning range (2θ) was within 2~15°, and the scanning speed was 0.04°/min.

2.5.2. Transmission Electron Microscopy (TEM)

The samples for TEM analysis were prepared by placing the films of PLA/OMMT nanocomposites into epoxy resin capsules and by curing these capsules at 70 °C for 24 h in a vacuum oven. Then, the cured epoxy resin that contained the PLA/OMMT nanocomposites was a microtome with a Reichert-Jung Ultracut-E to form 60~90 nm-thick slices (Optische Werke AG Wien, Austria). Subsequently, one layer of carbon around 10 nm thick was deposited onto the slices, which were placed on 100-mesh copper nets for TEM observation using a JEOL 2010 instrument (Tokyo, Japan) that was operated at an accelerating voltage of 200 kV.

2.5.3. Thermogravimetric Analyzer (TGA)

The variation of decomposition temperature of the specimen would be measured by the thermogravimetric analyzer, Perkin Elmer TGA 7. The experimental conditions: sample volume was 5 mg; temperature ranged from 30 °C to 500 °C, heating rate was 10 °C/min, N2 and air flow rate were 20 mL/min.

2.5.4. Differential Scanning Calorimetry (DSC)

The behavior analysis of specimens during the melting and crystallizing processes could be practiced through the differential scanning calorimetry (Perkin–Elmer Pyris 6). The procedures comprised the following six stages.
1st stage: The specimen was kept at 30 °C for 1 min to reach the balanced condition.
2nd stage: The specimen was heated from 30 °C to 170 °C with the speed of 5 °C/min.
3rd stage: The specimen was kept at 170 °C for 1 min to eliminate the thermal history.
4th stage: The specimen was decreased from 170 °C to 30 °C with a speed of 20 °C/min.
5th stage: The specimen was kept at 30 °C for 1 min to reach the balanced condition.
6th stage: The specimen was heated from 30 °C to 170 °C with the speed of 5 °C/min.

3. Results and Discussion

3.1. Crystalline of PLA/OMMT Nanocomposites

The dispersion of OMMT in PLA could be measured by the XRD, and the result is shown in Figure 3. In Figure 3, the diffraction peak of modified OMMT was located at 2θ = 4.59 (d = 19.3 nm), and there was no significant diffraction peak for the pure PLA (Curve A-0.0%), indicating the non-crystal structure of pure PLA. After mixing PLA with various amounts of OMMT, the primary diffraction peak appeared at 2θ = 2.52 (d = 34.9 nm), indicating that the interlayer distance of OMMT was extended by 15.6 nm and the exfoliation in the PLA substrate had occurred. However, when the amount of OMMT was over 3.0 wt%, the diffraction peak of OMMT at 2θ = 4.59 also appeared. The intensity of this peak increased with the amount of OMMT, indicating that the dispersion of OMMT in PLA was not complete when its amount was larger than 3.0 wt%.

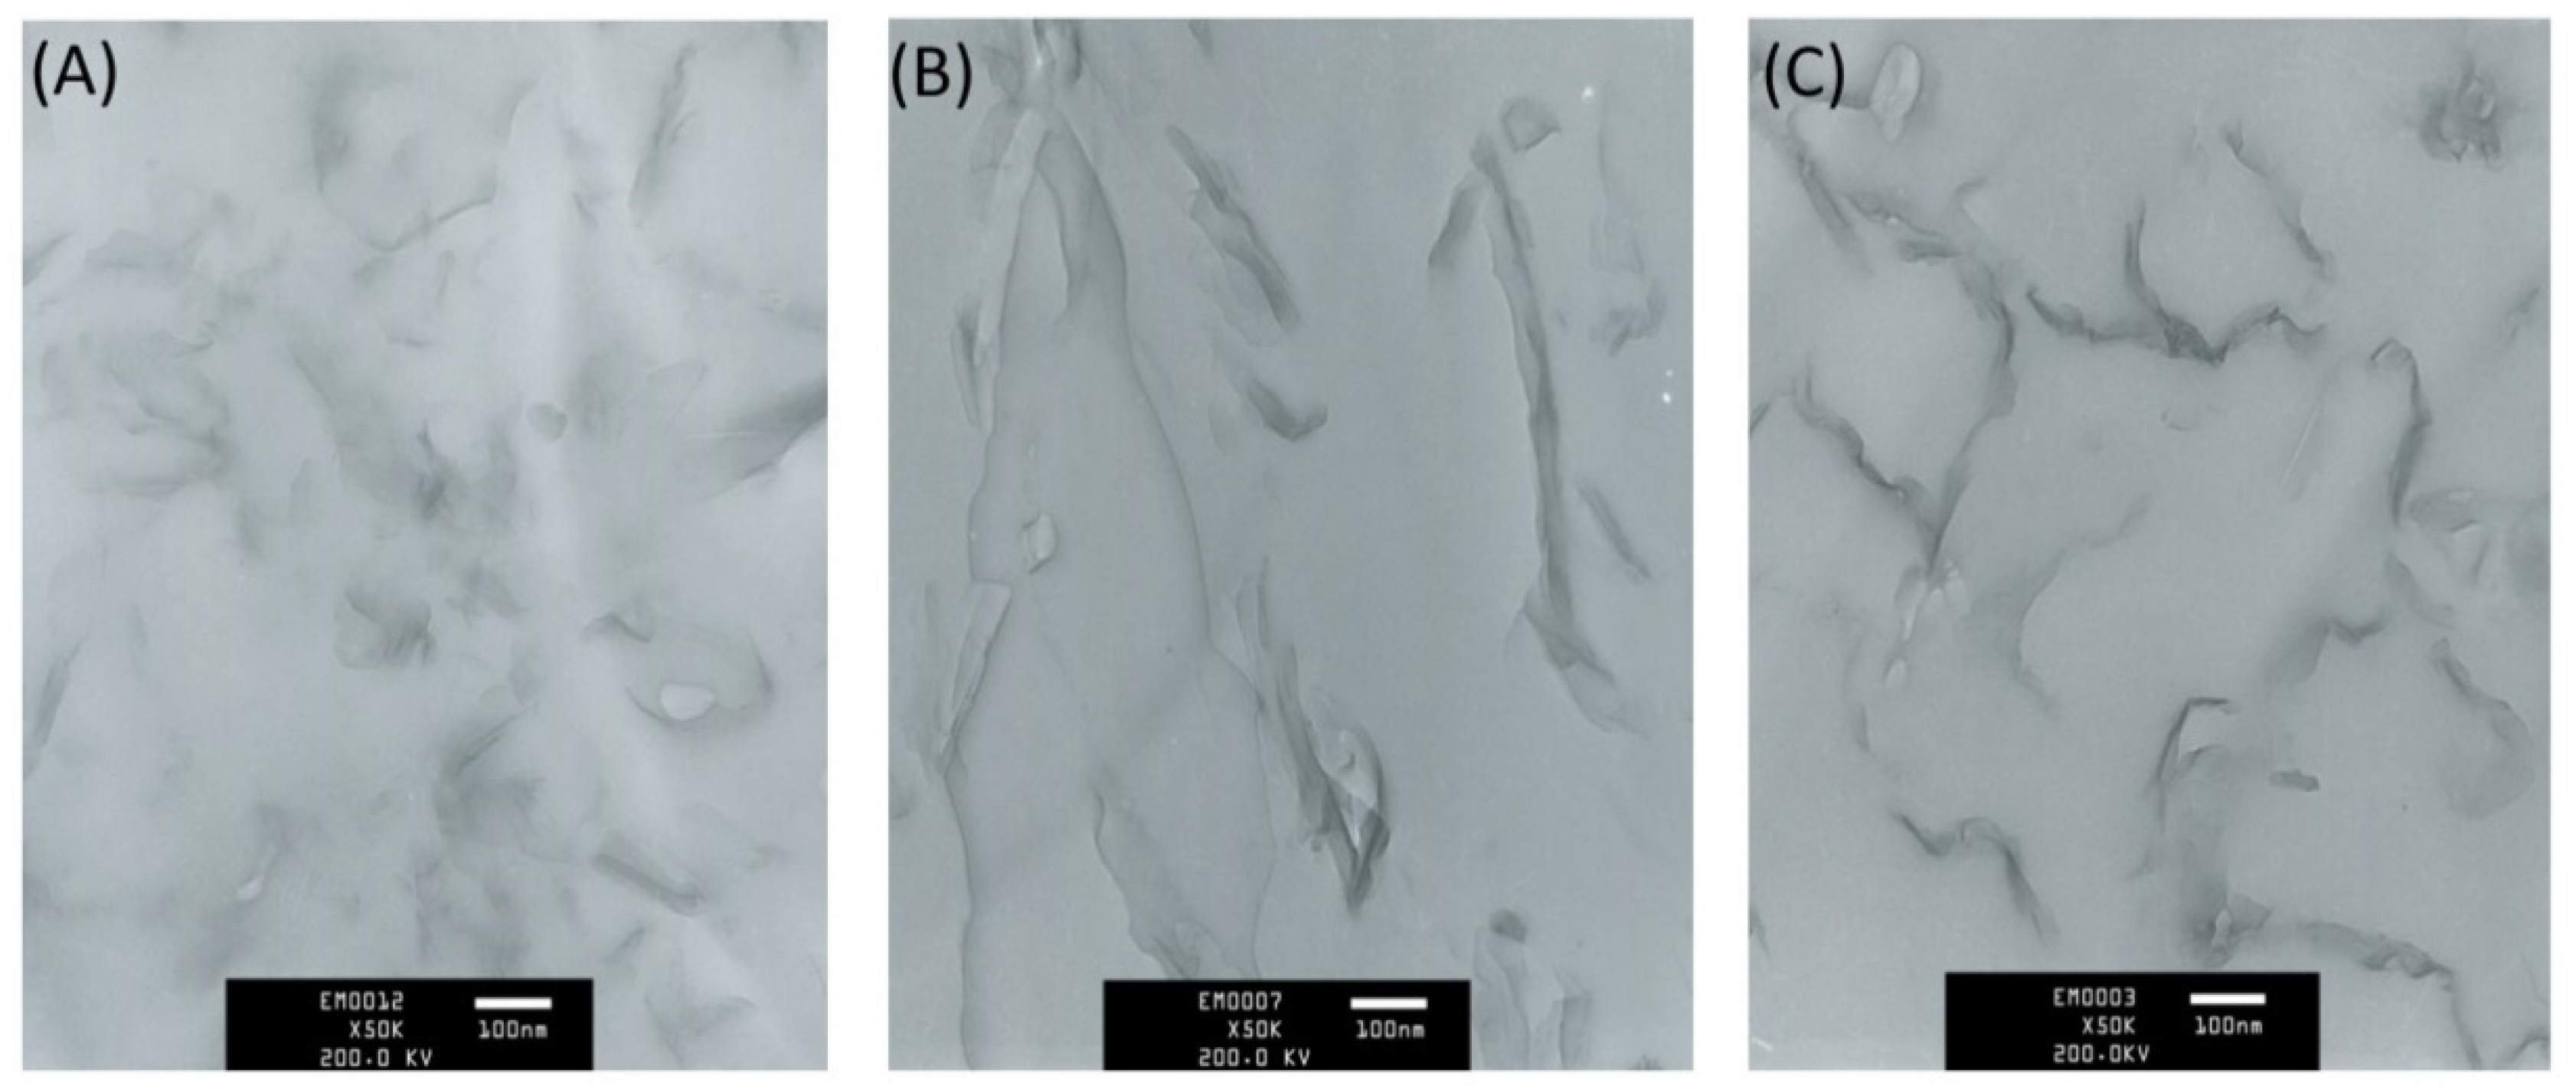
3.2. The Morphology of the PLA/OMMT Nanocomposites

After mixing with the torque rheometer, the PLA/OMMT nanocomposites can be examined by TEM to understand the change in the morphology of the composite material. The original OMMT of about 1 mm in diameter exhibited mostly an exfoliated silicate structure (100~200 nm) by the intercalation effect of PLA polymer chains, and the obvious black filaments or strips can be observed in the TEM image of Figure 4. Whether by adding 3%wt OMMT-(A), 5%wt OMMT-(B) or 8%wt OMMT-(C), it can be dispersed evenly. As the ratio of OMMT increases, the content of layered silicate also increases proportionally. As shown in Figure 5, the TEM image shows the morphology of the PLA/OMMT nanocomposites obtained by co-rotating the twin screw extruder, and the exfoliated silicate of the clay is evenly dispersed in the PLA to become a homogeneous composite material, which is helpful for the improvement of physicochemical and mechanical properties.

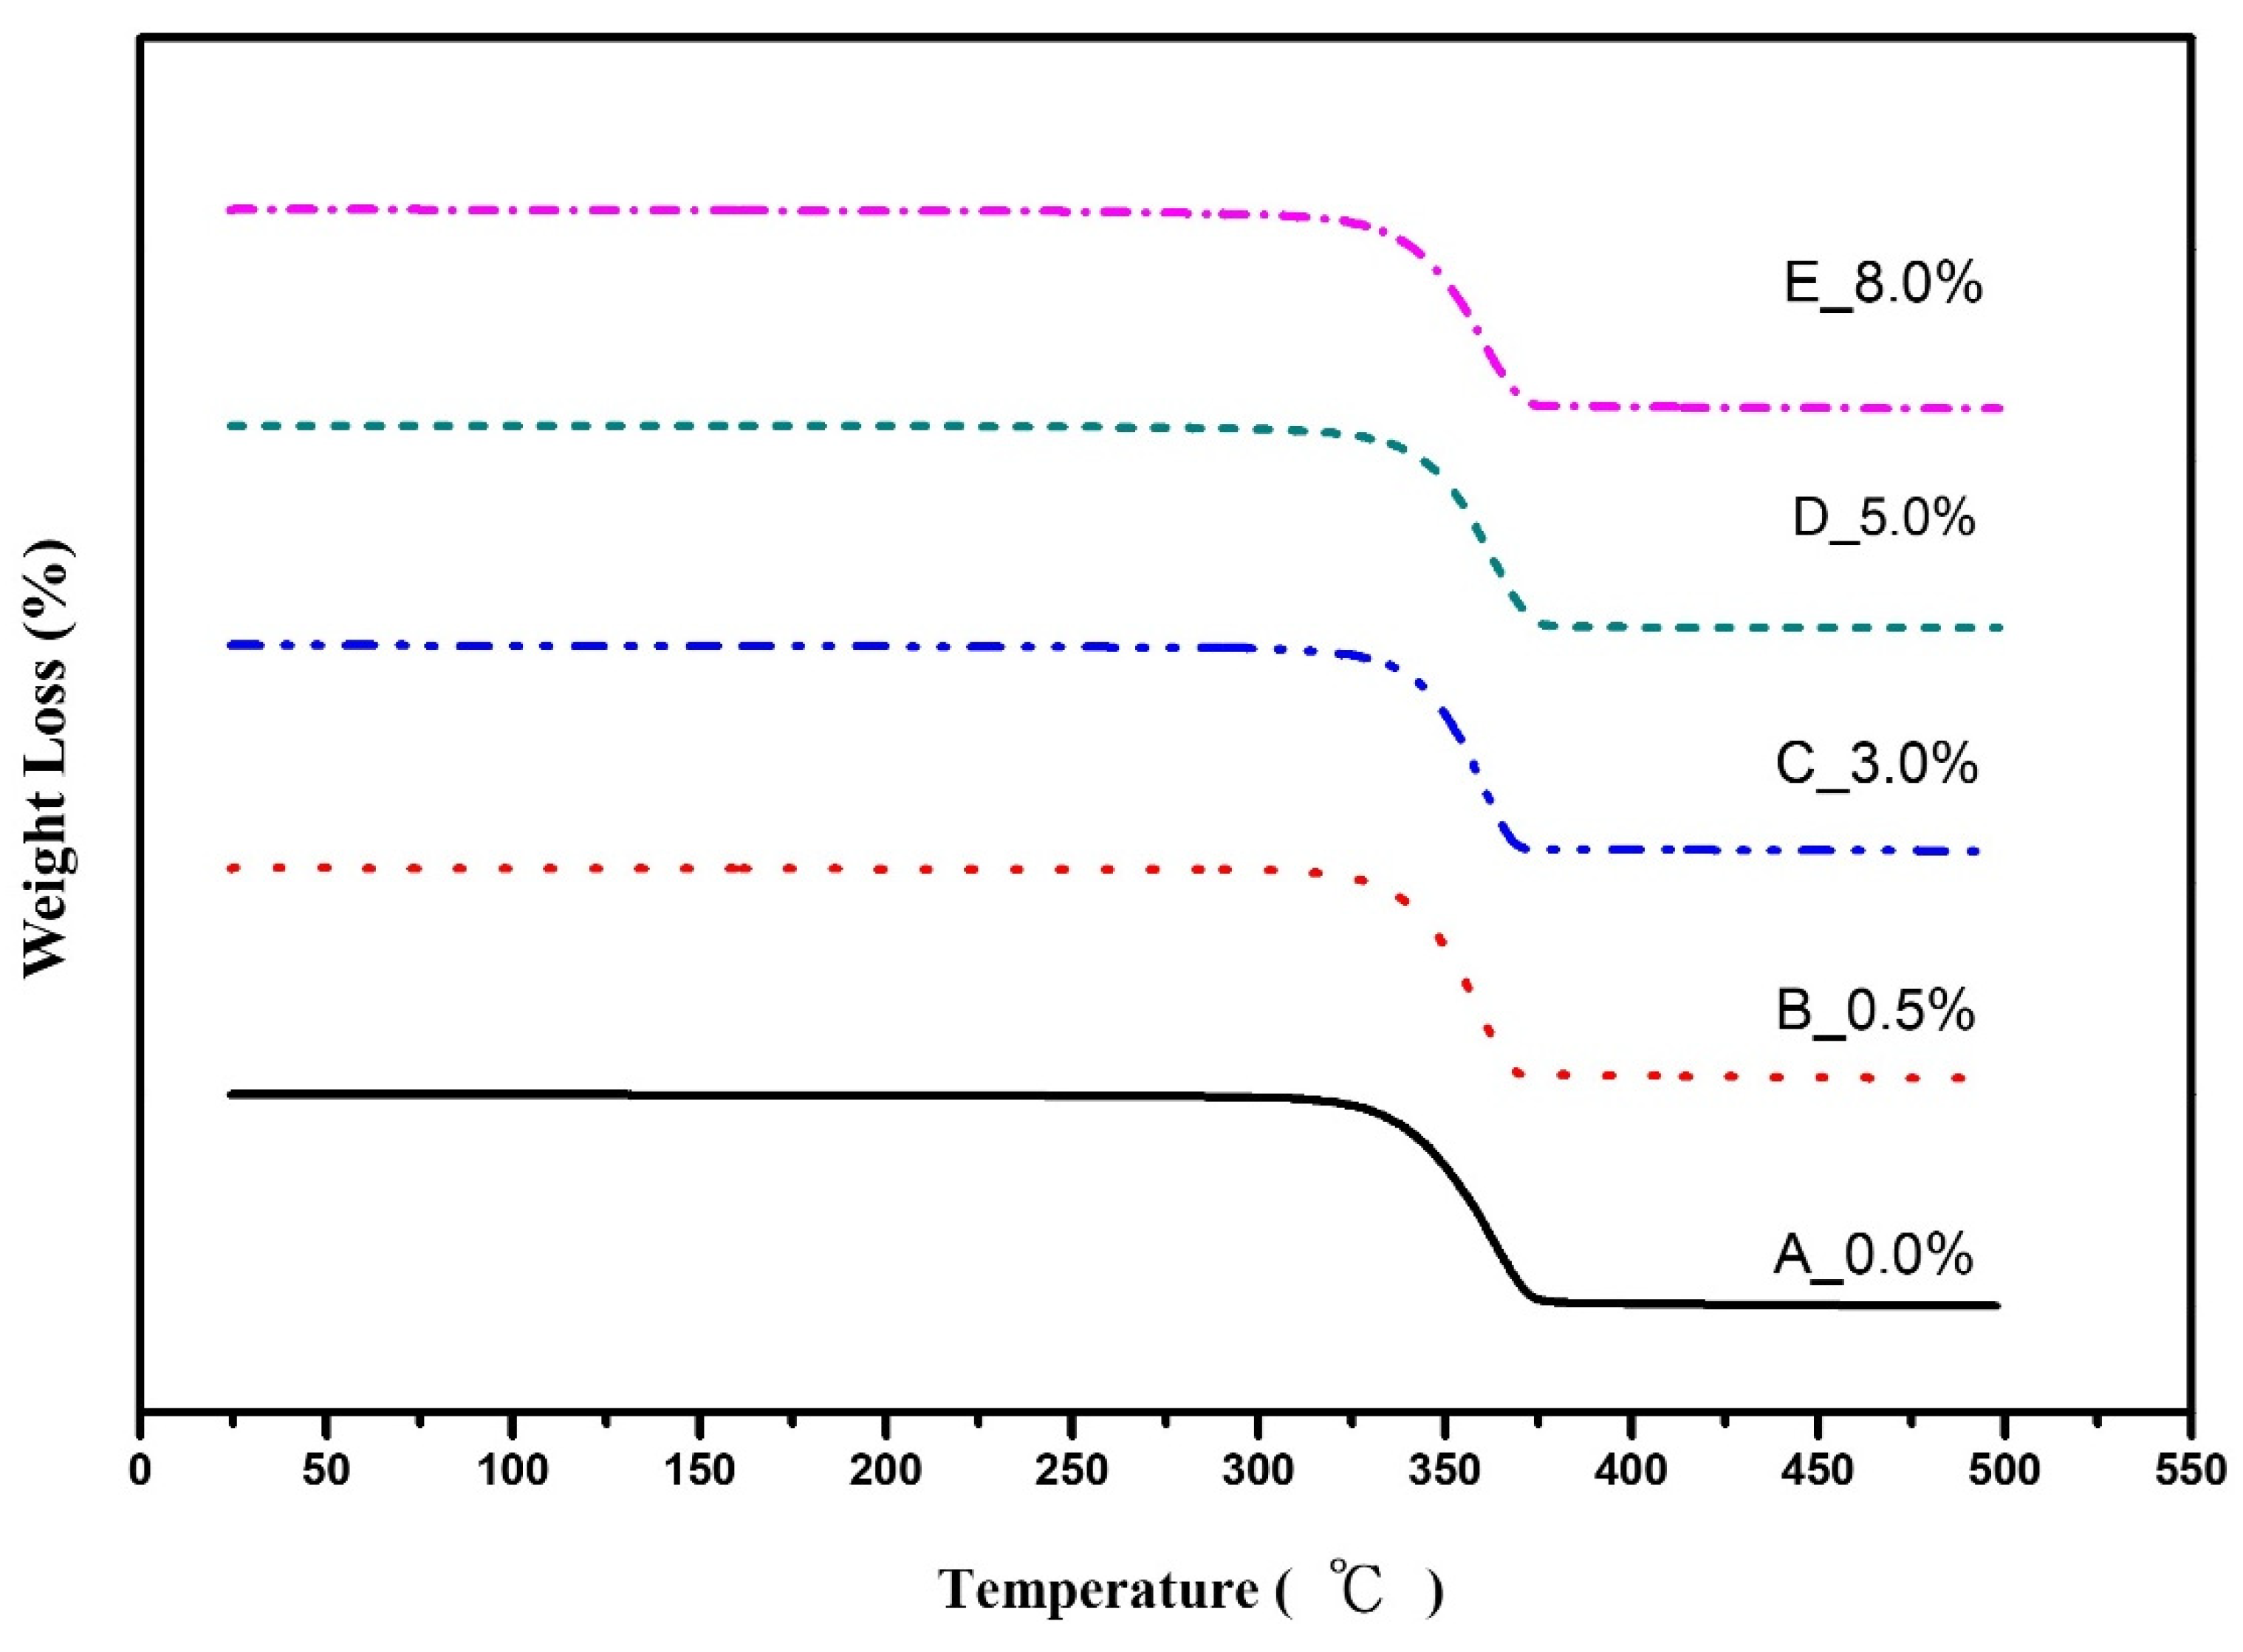
3.3. Heat Resistance

The heat resistance of the materials could be measured by a thermogravimetric analyzer (TGA). The thermogravimetry analysis results of pure PLA and PLA/OMMT nanocomposites with various OMMT amount are shown in Figure 6 and Table 3. In Figure 6, the degraded temperature of PLA (Tdeg) increased with the content of OMMT. The maximum Tmax (339.08 °C) appeared at the PLA/3 wt %OMMT nanocomposite. However, further increasing the wt% of OMMT would decrease the Tmax of PLA/OMMT nanocomposite. For instance, the Tmax of PLA/8 wt %OMMT was even lower than that of pure PLA. In Table 1, T5 wt% (the temperature at which the 5% weight loss occurred) increased with the adding amount of OMMT in PLA, and it reached the peak value of 326.48 °C at the PLA/3%OMMT nanocomposite. Nevertheless, T5% remained at 326.27 °C when the wt% of OMMT was larger than 3 wt%. This may be due to the fact that the nanocomposite structure was in the state of complete exfoliation with the small amount of OMMT (≤3 wt%), and this structure effectively improved the thermal stability of nanocomposites. When the OMMT amount was over the threshold limitation, however, the thermal stability could not be further improved. This suggested that the specific shape in limited regions of the PLA substrate causing the incomplete exfoliation of OMMT was the main reason [35,36].

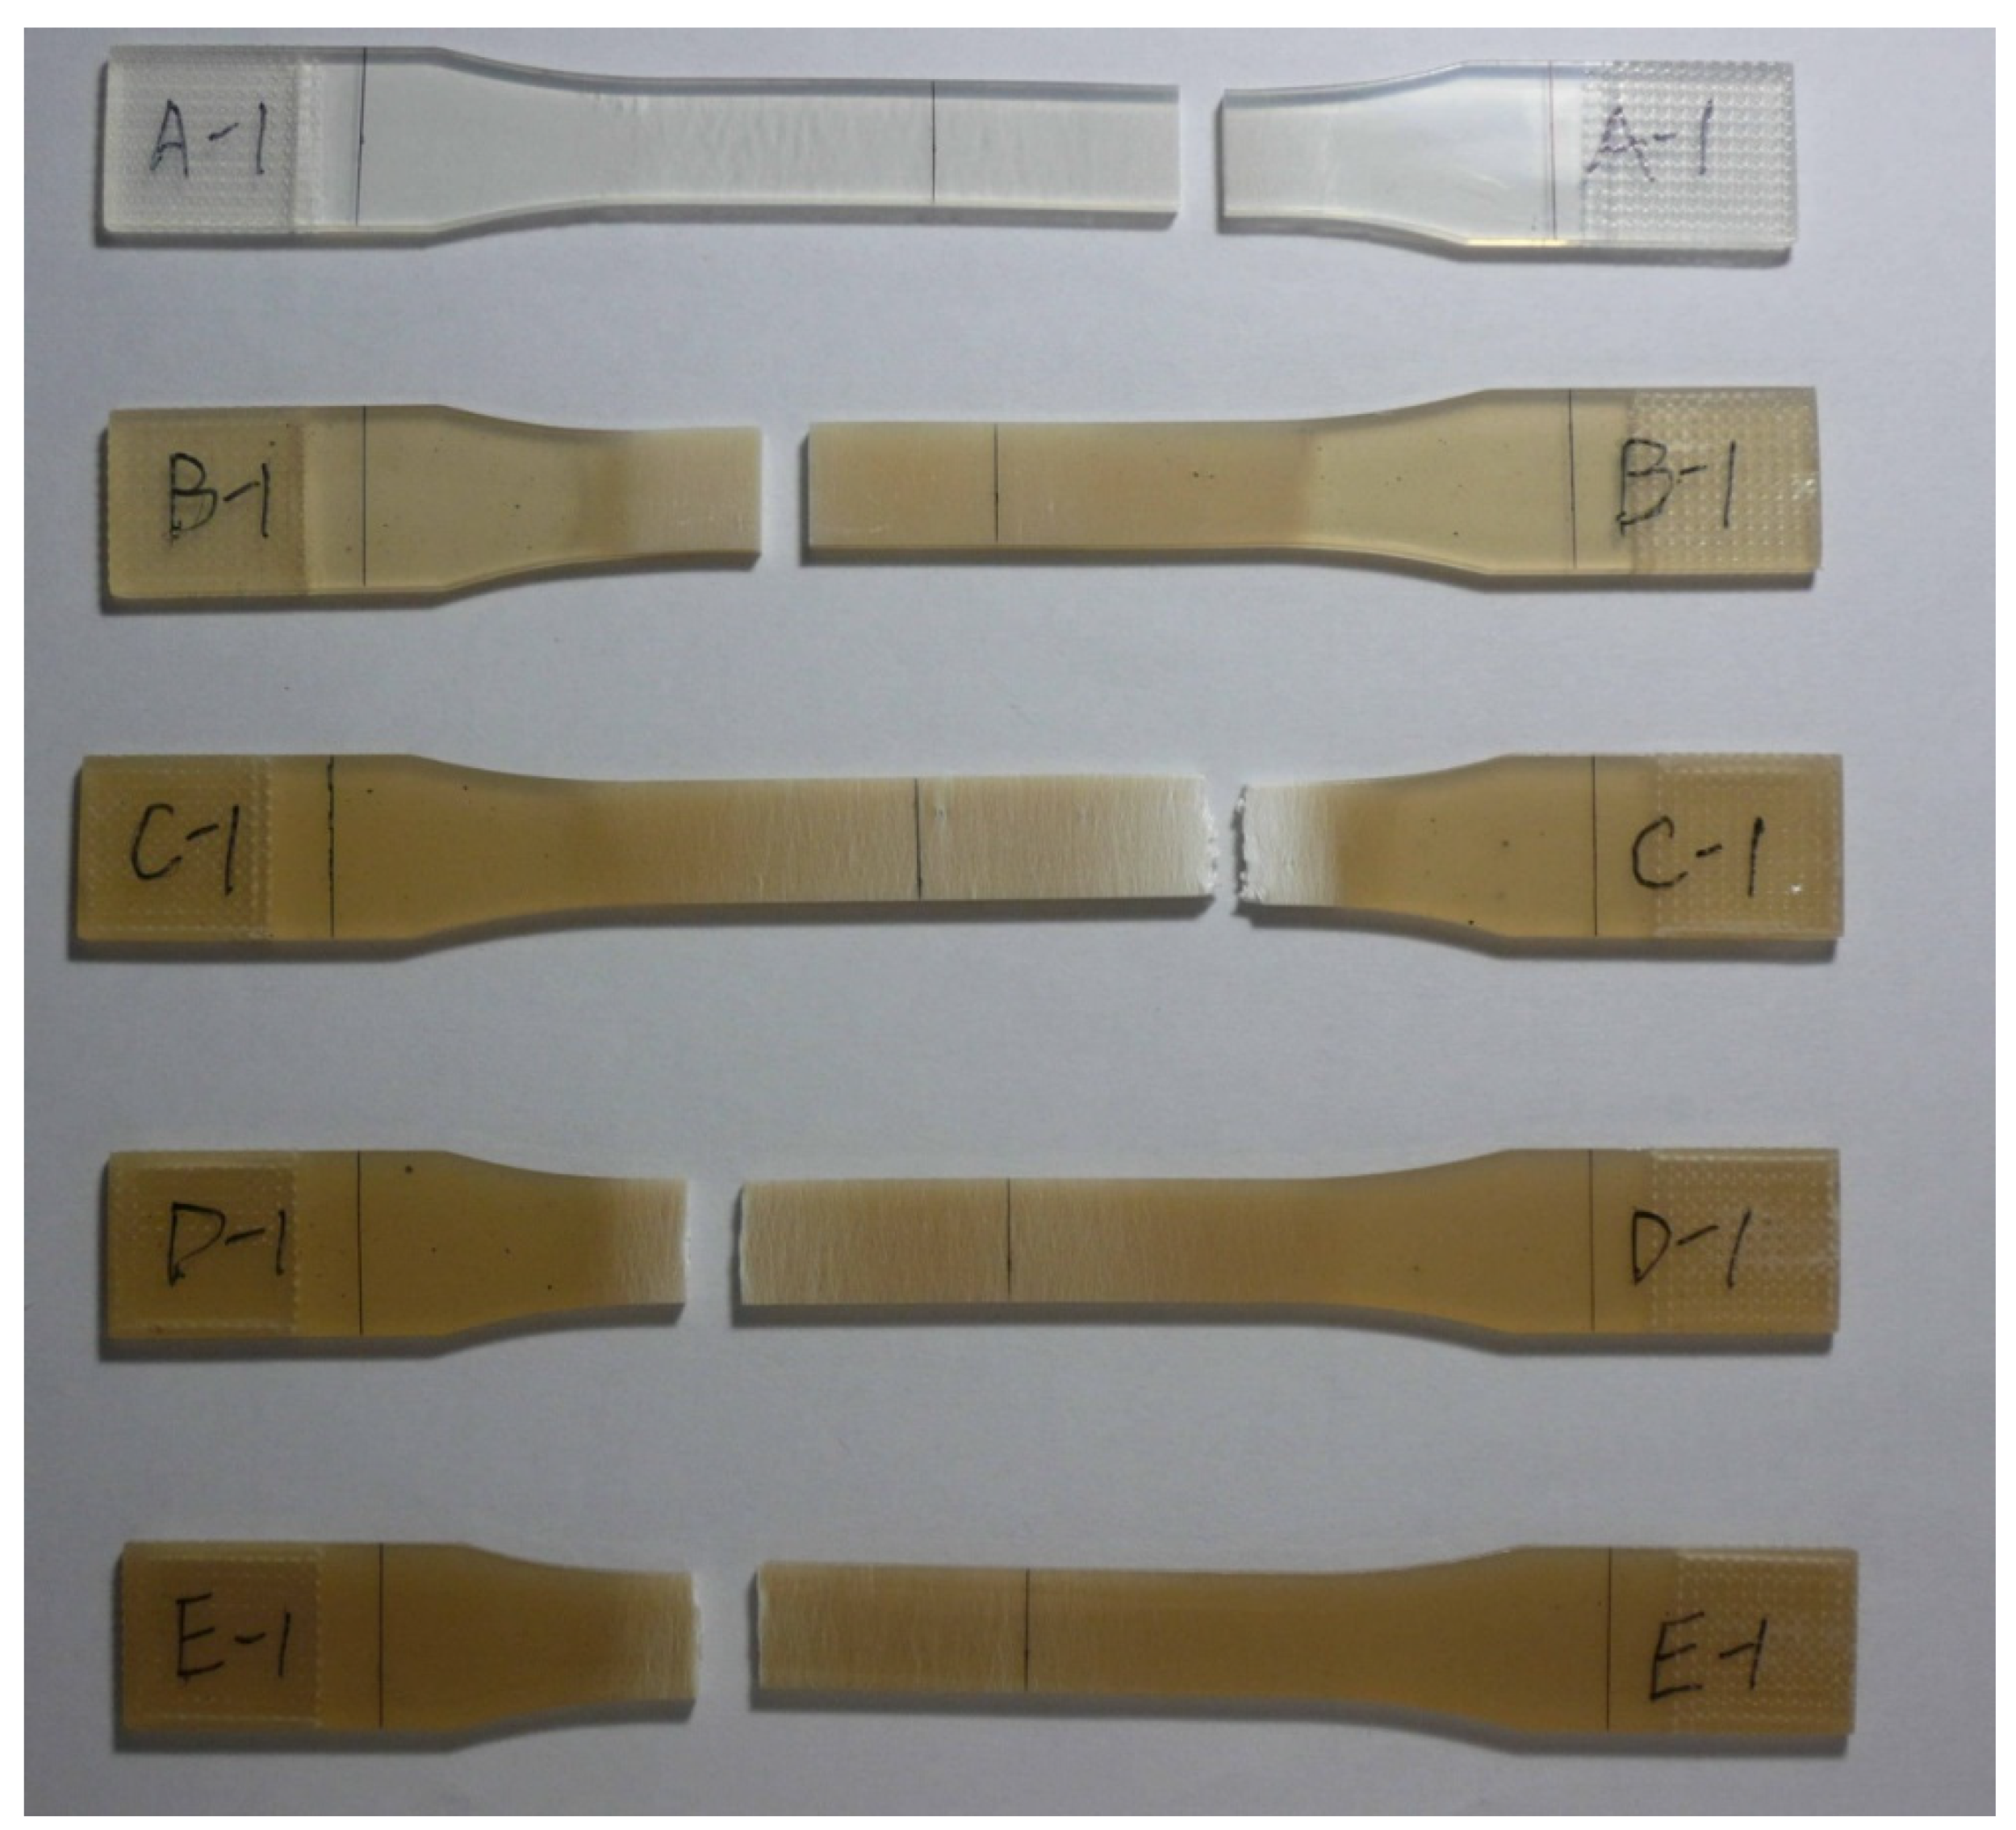
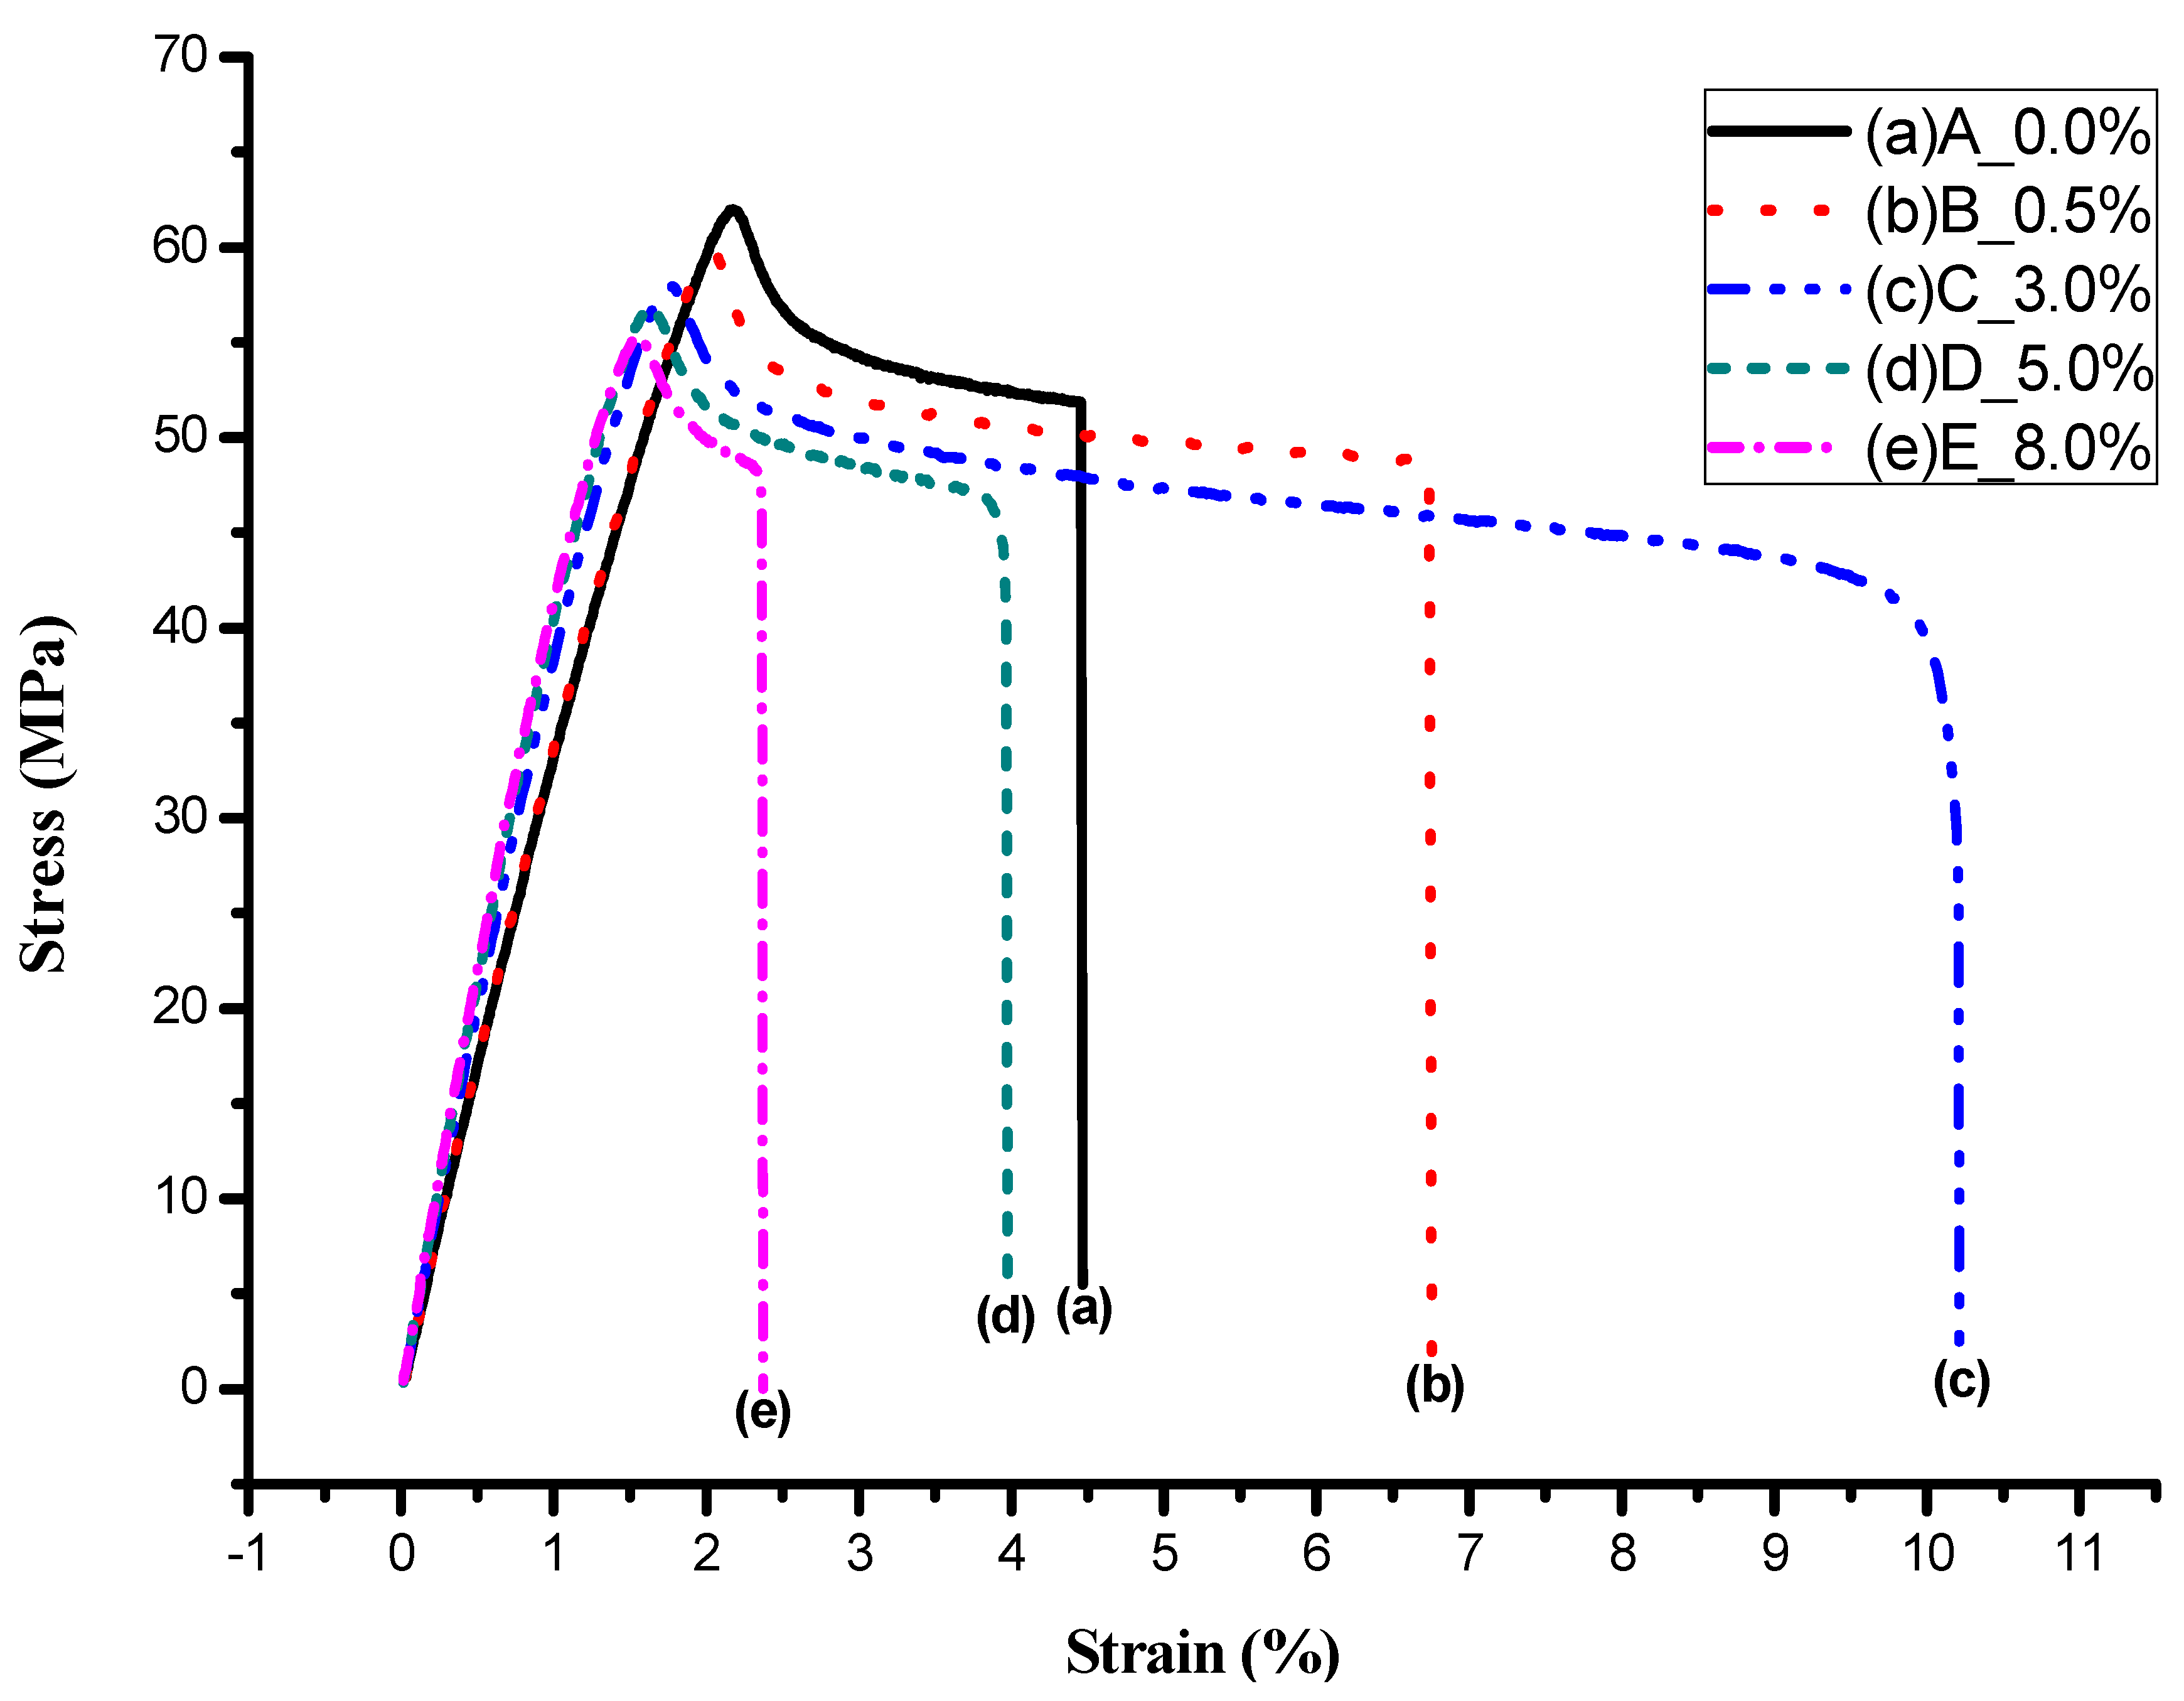
3.4. Tensile Strength

The tensile test is an important index for indicating the stiffness of a material. The MTS testing results of PLA and PLA/OMMT nanocomposites with various OMMT amounts are shown in Figure 7 and Figure 8. Table 2 illustrated the details. In Figure 8 and Table 4, when the amount of OMMT increased from 0 to 3.0 wt%, the elongation of PLA/OMMT nanocomposite samples rose from 4.46 to 10.19%. However, if the amount of OMMT was larger than 3.0 wt%, the elongation of PLA/OMMT nanocomposite samples would decline. This may be due to the fact that the overweight OMMT in PLA would cause incomplete exfoliation. Furthermore, the overweight OMMT would create more nuclei and defects in the crystals, accordingly, during cooling process, and result in the decrease of the tensile strength [37]. The pulling strength at breaking point is the so-called tensile strength. The specimen C-3.0 wt% had the lowest tensile strength, and its color around the breaking point clearly changed. This may be due to the fact that the larger tensile extension led to a serious shrinkage of the specimen, and thus reduced the tensile strength.

3.5. Hydrolysis

In general, the heat flow change during the process, such as specific heat, reaction heat, conversion heat, etc., could be measured directly by the DSC. The sample purity, reaction rate and crystallinity of a specimen could also be measured. In this research, the variation of heat properties before and after hydrolysis, including Tg, Tc and Tm of pure PLA and PLA/OMMT nanocomposites, were measured by DSC.

3.5.1. Before Hydrolysis

Figure 9 and Table 5 demonstrated the variations of Tg, Tc and Tm of pure PLA and PLA/OMMT nanocomposites before/after the hydrolysis process measured by DSC. In Table 5, the addition of OMMT would not affect the Tg of PLA. If the amount of OMMT was less than 3 wt%, the Tc of PLA/OMMT nanocomposites remained at 116.3 °C. However, if the amount of OMMT was higher than 5.0 wt%, the Tc of PLA/OMMT would ascend to 121.3 °C. Similar variations appeared for Tm at 148.2 °C and 149.5 °C, respectively. This may be due to the fact that the dispersion of OMMT in PLA would depend on the amount of OMMT. The structure of OMMT in PLA was the incomplete exfoliation, also affected by the thermal properties of OMMT.

3.5.2. After Hydrolysis

Figure 10 and Table 5 and Table 6 demonstrated the variations of Tg, Tc and Tm of the PLA/3.0 wt% OMMT nanocomposite, measured by DSC, passing through the hydrolysis process for 0, 3, 6 and 9 weeks. The Tg of the PLA/3.0 wt % OMMT nanocomposite decreased slightly with the period of the hydrolysis process. The total variation of Tg was low (−0.43 °C) after 9 weeks of hydrolysis process. The variation of Tc was −3.7 °C in this period. Figure 8-c indicated that the DSC testing results of PLA/3.0 wt% OMMT demonstrated the double melting peaks, and the strength of Tm2 was intensified with the increasing period of hydrolysis process. The lower melting peak, Tm1, decreased gradually, and the higher melting peak, Tm2, increased obviously. The presence of double melting peaks might indicate the existence of two crystals [37]. The higher melting peak, Tm2, might indicate the α-type crystalline with a denser and ordered structure.
Table 5 and Table 6 presented the DSC testing results of PLA/OMMT nanocomposites after several weeks of hydrolysis process. In general, after hydrolysis, the Tg, Tc and Tm1 of the PLA/OMMT nanocomposites would decrease, and the Tm2 would increase. In Table 5, except for pure PLA, the Tm1 of the same PLA/OMMT nanocomposites decreased with the increasing period of the hydrolysis process. This might be due to the fact that the ester function groups broke randomly on the polymer surfaces at the beginning of the hydrolysis process. With the elongation of the hydrolysis process, the polymer structure of PLA/OMMT nanocomposites was degraded, and its molecular weight decreased. The reason for the stronger Tm2 peak is that the crystalline phase of PLA becomes untidy when it is hydrolyzed, and the defective part will be decomposed first, while the undecomposed part will be rearranged more neatly when it reaches a higher temperature by DSC measurement, thus producing a larger crystalline peak and a slightly higher melting point. Moreover, in Table 6, the Tm1 of pure PLA increased after the hydrolysis process. The total variation of Tg, Tc and Tm1 of PLA/OMMT nanocomposites with higher OMMT wt% (≥ 5.0%) was larger than others after 9 weeks of hydrolysis process. It prevented the amount of OMMT from benefiting from the hydrolysis process. If the amount of OMMT was larger than 8%, the total variation of Tg and Tc decreased inversely, due to the weaker thermal properties and uneven dispersion of OMMT.

4. Conclusions

PLA contains the hydrolyzable ester function group, which could be hydrolyzed into lactic acid, and then metabolized into CO2 and H2O via Kreb’s cycle. These properties make PLA a biodegradable, bioresorbable and biocompatible product, which has become the most economical and competitive bio-degradable plastic. This research adopted PLA and OMMT as the substrate and reinforcing material, respectively, to prepare the PLA/OMMT nanocomposites by using a torque rheometer, a hot embossing machine, a co-rotating twin screw extruder, a pelletizing system and an injection molding machine. It was proved by XRD that the interlayer distance of OMMT could be expanded to 34.9 nm. However, the doping effect became worse if the amount of OMMT was larger than 5.0 wt%. For the heat resistance of the material, it was proved from the TGA testing results that the Tmax and T5% of the PLA/0.3 wt% OMMT nanocomposite were the highest values, of 339.08 and 326.48 °C, respectively. Meanwhile, for the stiffness of the material, the elongation of the same nanocomposite was 10.19%, the highest value among others, and the tensile strength remained optimal at this ratio. Therefore, doping the specific amount of OMMT in PLA could uplift the thermal stability, elongation and processability of the material.
The PLA/OMMT nanocomposites were soaked in the phosphate buffer solution of 37 °C for a certain period. After the hydrolysis process, the soaked nanocomposites passed the DSC test. The testing results indicated the double melting peak phenomenon of the nanocomposites, and the intensity of the double melting peak (Tm2) increased with the hydrolysis period, regardless of the amount of OMMT in the nanocomposites. In general, Tg, Tc and Tml declined, and Tm2 ascended after the hydrolysis process. This was due to the fact that the OMMT would benefit from the hydrolysis process, and the hydrolysis period was proportional to the decomposition level. In conclusion, the addition of OMMT in PLA could improve the performance of PLA, reduce the processing period and intensify the decomposition of waste. This may extend its application scopes on green materials.

Author Contributions

Data curation, J.-J.H. and H.-J.L.; Investigation, S.-M.H. and J.-J.H.; Methodology, J.-J.H. and A.-M.Z. All authors have read and agreed to the published version of the manuscript.

Funding

This research received no external funding.

Institutional Review Board Statement

Not applicable.

Informed Consent Statement

Not applicable.

Data Availability Statement

Not applicable.

Conflicts of Interest

The authors declare no conflict of interest.

References

  1. Nurul, M.F.; Jayaraman, K.; Bhattacharyya, D.; Mohamad, M.H.; Saurabh, C.K.; Hussin, M.H.; Abdul Khalil, H.P.S. Green composites made of bamboo fabric and poly (lactic) acid for packaging applications—A review. Materials 2016, 9, 435. [Google Scholar] [CrossRef]
  2. Youssef, A.M.; El-Sayed, S.M. Bionanocomposites materials for food packaging applications: Concepts and future outlook. Carbohydr. Polym. 2018, 193, 19–27. [Google Scholar] [CrossRef]
  3. Havstad, M.R. Chapter 5—Biodegradable Plastics. In Plastic Waste and Recycling; Letcher, T.M., Ed.; Academic Press: Cambridge, MA, USA, 2020; pp. 97–129. [Google Scholar]
  4. Weng, Y.X.; Jin, Y.J.; Meng, Q.Y.; Wang, L.; Zhang, M.; Wang, Y.Z. Biodegradation behavior of poly (butylene adipate-co-terephthalate)(PBAT), poly (lactic acid)(PLA), and their blend under soil conditions. Polym. Test. 2013, 32, 918–926. [Google Scholar] [CrossRef]
  5. Ncube, L.K.; Ude, A.U.; Ogunmuyiwa, E.N.; Zulkifli, R.; Beas, I.N. Environmental Impact of Food Packaging Materials: A Review of Contemporary Development from Conventional Plastics to Polylactic Acid Based Materials. Materials 2020, 13, 4994. [Google Scholar] [CrossRef] [PubMed]
  6. Farah, S.; Anderson, D.G.; Langer, R. Physical and mechanical properties of PLA, and their functions in widespread applications—A comprehensive review. Adv. Drug Deliv. Rev. 2016, 107, 367–392. [Google Scholar] [CrossRef] [Green Version]
  7. Dahman, Y. Poly (Lactic Acid): Green and Sustainable Plastics. Ferment. Technol. 2014, 2, e121. [Google Scholar] [CrossRef] [Green Version]
  8. Darie-Niţă, R.N.; Vasile, C.; Irimia, A.; Lipşa, R.; Râpă, M. Evaluation of some eco-friendly plasticizers for PLA films processing. J. Appl. Polym. Sci. 2016, 133, 43223. [Google Scholar] [CrossRef]
  9. Siakeng, R.; Jawaid, M.; Ariffin, H.; Sapuan, S.; Asim, M.; Saba, N. Natural fiber reinforced polylactic acid composites: A review. Polym. Compos. 2018, 40, 446–463. [Google Scholar] [CrossRef]
  10. Righetti, M.C.; Cinelli, P.; Mallegni, N.; Massa, C.A.; Aliotta, L.; Lazzeri, A. Thermal, Mechanical, Viscoelastic and Morphological Properties of Poly (lactic acid) based Biocomposites with Potato Pulp Powder Treated with Waxes. Materials 2019, 12, 990. [Google Scholar] [CrossRef] [Green Version]
  11. Alemán, C.; Lotz, B.; Puiggali, J. Crystal Structure of the α-Form of Poly(L-lactide). Macromolecules 2001, 34, 4795–4801. [Google Scholar] [CrossRef]
  12. Saeidlou, S.; Huneault, M.A.; Li, H.; Park, C.B. Poly(lactic acid) crystallization. Prog. Polym. Sci. 2012, 37, 1657–1677. [Google Scholar] [CrossRef]
  13. Betancourt, N.G.; Cree, D.E. Mechanical properties of poly (lactic acid) composites reinforced with CaCO3 eggshell based fillers. MRS Adv. 2017, 2, 2545–2550. [Google Scholar] [CrossRef] [Green Version]
  14. Aliotta, L.; Gigante, V.; Coltelli, M.B.; Cinelli, P.; Lazzeri, A. Evaluation of mechanical and interfacial properties of bio-composites based on poly (lactic acid) with natural cellulose fibers. Int. J. Mol. Sci. 2019, 20, 960. [Google Scholar] [CrossRef] [PubMed] [Green Version]
  15. McCutcheon, C.J.; Zhao, B.; Jin, K.; Bates, F.S.; Ellison, C.J. Crazing Mechanism and Physical Aging of Poly(lactide) Toughened with Poly(ethylene oxide)-block-poly(butylene oxide) Diblock Copolymers. Macromolecules 2020, 53, 10163–10178. [Google Scholar] [CrossRef]
  16. Nagarajan, V.; Mohanty, A.K.; Misra, M. Perspective on Polylactic Acid (PLA) based Sustainable Materials for Durable Applications: Focus on Toughness and Heat Resistance. ACS Sustain. Chem. Eng. 2016, 4, 2899–2916. [Google Scholar] [CrossRef]
  17. Odent, J.; Raquez, J.; Dubois, P. Highly Toughened Polylactide-Based Materials through Melt-Blending Techniques. In Biodegradable Polyesters; Fakirov, S., Ed.; Wiley-VCH Verlag GmbH & Co. KGaA: Berlin, Germany, 2015. [Google Scholar]
  18. Nyambo, C.; Mohanty, A.K.; Misra, M. Polylactide-based renewable green composites from agricultural residues and their hybrids. Biomacromolecules 2010, 11, 1645–1660. [Google Scholar] [CrossRef]
  19. Van den Berg, S.A.; Zuilhof, H.; Wennekes, T. Clickable Polylactic Acids by Fast Organocatalytic Ring-Opening Polymerization in Continuous Flow. Macromolecules 2016, 49, 2054–2062. [Google Scholar] [CrossRef]
  20. Hwang, J.J.; Liu, H.J. Influence of Organophilic Clay on the Morphology, Plasticizer-Maintaining Ability, Dimensional Stability, and Electrochemical Properties of Gel Polyacrylonitrile (PAN) Nanocomposite Electrolytes. Macromolecules 2002, 35, 7314–7319. [Google Scholar] [CrossRef]
  21. Cui, Y.; Kumar, S.; Rao Kona, B.; van Houcke, D. Gas barrier properties of polymer/clay nanocomposites. RSC Adv. 2015, 5, 63669–63690. [Google Scholar] [CrossRef]
  22. Francis, V.; Jain, P.K. Experimental investigations on fused deposition modelling of polymer-layered silicate nanocomposite. Virtual Phys. Prototyp. 2016, 11, 109–121. [Google Scholar] [CrossRef]
  23. Goh, K.; Heising, J.K.; Yuan, Y.; Karahan, H.E.; Wei, L.; Zhai, S.; Koh, J.X.; Htin, N.M.; Zhang, F.; Wang, R.; et al. Sandwich-Architectured Poly(lactic acid)–Graphene Composite Food Packaging Films. ACS Appl. Mater. Interfaces 2016, 8, 9994–10004. [Google Scholar] [CrossRef] [PubMed]
  24. Hamed, N.S.; Razavi, R.S.; Loghman-Estarki, M.R.; Ramazani, M. The effect of organoclay on the morphology and mechanical properties of PAI/clay nanocomposites coatings prepared by the ultrasonication assisted process. Ulrason. Sonochem. 2017, 38, 306–316. [Google Scholar]
  25. Sato, S.; Yamauchi, J.; Takahashi, Y.; Kanehashi, S.; Nagai, K. Effects of Nanofiller-Induced Crystallization on Gas Barrier Properties in Poly(lactic acid)/Montmorillonite Composite Films. Ind. Eng. Chem. Res. 2020, 59, 12590–12599. [Google Scholar] [CrossRef]
  26. Pluta, M. Morphology and properties of polylactide modified by thermal treatment, filling with layered silicates and plasticization. Polymer 2004, 45, 8239–8251. [Google Scholar] [CrossRef]
  27. Basu, A.; Nazarkovsky, M.; Ghadi, R.; Khan, W.; Domb, A.J. Poly(lactic acid)-based nanocomposites. Polym. Adv. Technol. 2016, 28, 919–930. [Google Scholar] [CrossRef]
  28. Chafidz, A.; Tamzysi, C.; Kistriyani, L.; Kusumaningtyas, R.D.; Hartanto, D. Mechanical Properties of PP/clay Nanocomposites Prepared from Masterbatch: Effect of Nanoclay Loadings and Re-Processing. Key Eng. Mater. 2019, 805, 59–64. [Google Scholar] [CrossRef]
  29. Nagy, D.; Kókai, E. Polymer-based nanocomposites with nanoclay. IOP Conf. Ser. Mater. Sci. Eng. 2018, 448, 012021. [Google Scholar] [CrossRef]
  30. Cao, Y.; Xu, P.; Lv, P.; Lemstra, P.J.; Cai, X.; Yang, W.; Dong, W.; Chen, M.; Liu, T.; Du, M.; et al. Excellent UV Resistance of Polylactide by Interfacial Stereocomplexation with Double-Shell-Structured TiO2 Nanohybrids. ACS Appl. Mater. Interfaces 2020, 12, 49090–49100. [Google Scholar] [CrossRef]
  31. De Azevedo Gonçalves Mota, R.C.; de Menezes, L.R.; da Silva, E.O. Poly(lactic acid) polymers containing silver and titanium dioxide nanoparticles to be used as scaffolds for bioengineering. J. Mater. Res. 2021. [Google Scholar] [CrossRef]
  32. Liu, C.; Shen, J.; Yeung, K.W.K.; Tjong, S.C. Development and Antibacterial Performance of Novel Polylactic Acid-Graphene Oxide-Silver Nanoparticle Hybrid Nanocomposite Mats Prepared By Electrospinning. ACS Biomater. Sci. Eng. 2017, 3, 471–486. [Google Scholar] [CrossRef]
  33. Li, F.; Zhang, C.; Weng, Y. Improvement of the Gas Barrier Properties of PLA/OMMT Films by Regulating the Interlayer Spacing of OMMT and the Crystallinity of PLA. ACS Omega 2020, 5, 18675–18684. [Google Scholar] [CrossRef] [PubMed]
  34. He, Y.; Xu, W.H.; Zhang, H.; Qu, J.P. Constructing Bone-Mimicking High-Performance Structured Poly(lactic acid) by an Elongational Flow Field and Facile Annealing Process. ACS Appl. Mater. Interfaces 2020, 12, 13411–13420. [Google Scholar] [CrossRef] [PubMed]
  35. Araújo, A.; Botelho, G.; Oliveira, M.; Machado, A.V. Influence of clay organic modifier on the thermal-stability of PLA based nanocomposites. Appl. Clay Sci. 2014, 88–89, 144–150. [Google Scholar] [CrossRef]
  36. Alves, J.L.; Rosa, P.T.V.; Realinho, V.; Antunes, M.; Velasco, J.I.; Morales, A.R. The effect of Brazilian organic-modified montmorillonites on the thermal stability and fire performance of organoclay-filled PLA nanocomposites. Appl. Clay Sci. 2020, 194, 105697:1–105697:8. [Google Scholar] [CrossRef]
  37. Huang, S.M.; Hwang, J.J.; Liu, H.J.; Lin, L.H. Crystallization Behavior of Poly(L-lactic acid)/Montmorillonite Nanocomposites. J. Appl. Polym. Sci. 2010, 117, 434–442. [Google Scholar] [CrossRef]
Figure 1. PLA molecular structure.
Crystals 11 00376 g001
Figure 2. MTS standard specimen according to the requirement of the American Society for Testing and Material (ASTM)-D638 (Type1).
Crystals 11 00376 g002
Figure 3. The X-ray diffraction of modified OMMT and various PLA/OMMT nanocomposites: (A) 0.0, (B) 0.5, (C) 3.0, (D) 5.0 and (E) 8.0 wt%, respectively.
Crystals 11 00376 g003
Figure 4. TEM image of the nanocomposites prepared by the torque rheometer. (A) PLA/3%OMMT, (B) PLA/5%OMMT and (C) PLA/8%OMMT.
Crystals 11 00376 g004
Figure 5. TEM image of the nanocomposites prepared by the co-rotating twin screw extruder. (A) PLA/3% OMMT, (B) PLA/5%OMMT and (C) PLA/8%OMMT.
Crystals 11 00376 g005
Figure 6. The TGA testing results of pure PLA and PLA/OMMT nanocomposites with various amounts of OMMT: (A) 0.0, (B) 0.5, (C) 3.0, (D) 5.0 and (E) 8.0 wt%, respectively.
Crystals 11 00376 g006
Figure 7. The breaking points of pure PLA and PLA/OMMT nanocomposite specimens with various amounts of OMMT after the MTS test.
Crystals 11 00376 g007
Figure 8. The stress-strain diagram of pure PLA and PLA/OMMT nanocomposites with various amounts of OMMT measured by MTS.
Crystals 11 00376 g008
Figure 9. The differential scanning calorimetry (DSC) testing results of pure PLA and PLA/OMMT nanocomposites with various amounts of OMMT. (ac) present the variations of Tg, Tc and Tm, respectively. In the diagrams, the characters of A, B, C, D and E typify the OMMT amounts of 0, 0.5, 3, 5 and 8 wt%, respectively.
Crystals 11 00376 g009
Figure 10. The DSC testing results of the PLA/3.0 wt%OMMT nanocomposite materials after the hydrolysis process. (ac) present the variations of Tg, Tc and Tm. In the diagrams, the numbers 0-C, 1-C, 2-C, and 3-C typify the hydrolysis processes of 0, 3, 6 and 9 weeks, respectively.
Crystals 11 00376 g010
Table 1. Polylactic acid (PLA)/organic modified montmorillonite (OMMT) blending formula in the torque rheometer.
Sample Label (Clay Ratio)A (0.0%)B (0.5%)C (3.0%)D (5.0%)E (8%)
PLA amount (g)4040404040
OMMT amount (g)00.21.223.2
Table 2. Co-rotating twin screw extruder parameter setting.
Sample LabelABCDE
PLA amount (g)40004000400040004000
OMMT amount (g)020120200320
Clay ratio (%)0.0%0.5%3.0%5.0%8.0%
Zone 1 temperature (°C)160160160160160
Zone 2 temperature (°C)163162160155150
Zone 3 temperature (°C)183182180175170
Zone 4 temperature (°C)188187185180178
Zone 5 temperature (°C)192192190185183
Zone 6 temperature (°C)184182180175173
Zone 7 temperature (°C)177177175170168
Feed chamber (°C)173172170165163
Melt pressure (MPa)11.3611.3611.3611.3611.36
Feeder speed (rpm)51~5451~5451~5451~5350~49
Pelletizing machine speed (rpm)150~160150~160150~160150~160150~160
Table 3. Tdeg and T5 wt% of pure PLA and PLA/OMMT nanocomposites with various amounts of OMMT measured by TGA.
TemperatureTdeg (°C)T5 wt% (°C)
OMMT wt%
0.0336.84325.14
0.5337.33325.94
3.0339.08326.48
5.0338.46326.27
8.0335.00326.27
Table 4. The MTS testing results of pure PLA and PLA/OMMT nanocomposites with various amounts of OMMT.
SamplesABCDE
OMMT (wt%)0.00.53.05.08.0
Specimen area A0 (mm2)40.9639.9439.6939.9140.32
Elongation (Lf-L0) (mm)2.543.845.812.261.35
Elongation at Break (%)4.466.7410.193.972.36
Loading Pmax (N)2538.22389.32301.92265.92226.5
Tensile Strength Pmax/A0 (MPa)61.9759.8258.0056.7755.22
Loading Pf (N)2123.61935.01163.31624.51891.9
Pulling Strength Pf/A0 (MPa)51.8548.4529.3140.7046.92
Table 5. The DSC testing results of pure PLA and PLA/OMMT nanocomposites with various amounts of OMMT after several weeks of hydrolysis process.
Hydrolysis WeekOMMT (wt%)Tg (°C)Tc (°C)Tm (°C)
Tm1Tm2
WEEK 00.058.98--148.2--
0.558.82116.3148.0--
3.058.93116.4148.2--
5.058.83121.3149.5--
8.058.76121.4149.5--
WEEK 30.058.45--148.4--
0.558.66114.7147.6152.3
3.058.65114.4147.8152.7
5.058.65116.5149.0152.9
8.058.12116.9148.3153.2
WEEK 60.058.96--148.5--
0.558.63112.6147.5152.7
3.058.47113.8147.1153.1
5.058.30115.2147.9153.2
8.057.43116.8147.5152.9
WEEK 90.058.65--149.0--
0.558.60112.7147.1153.1
3.058.50112.7146.3153.2
5.056.56113.0146.6153.2
8.056.99113.7145.9152.7
Table 6. The DSC testing results of pure PLA and PLA/OMMT nanocomposites with various amounts of OMMT after 9 weeks of hydrolysis process.
OMMT Amount (wt%)ΔTg (°C)ΔTc (°C)ΔTm (°C)
ΔTm1* ΔTm2
0.0−0.33--+0.8--
0.5−0.22−3.6−0.9+0.8
3.0−0.43−3.7−1.9+0.5
5.0−2.27−8.3−2.9+0.3
8.0−1.77−7.7−3.6+0.5
Notes: Scanning temperature range: (1) Tg: 40~80 °C, (2) Tc: 90~135 °C, Tm: 135~165 °C.
Publisher’s Note: MDPI stays neutral with regard to jurisdictional claims in published maps and institutional affiliations.

