Article

Optical Properties of CaNb2O6 Single Crystals Grown by OFZ*

1
China Electronic Product Reliability and Environmental Testing Research Institute, Guangzhou 510610, China
2
State Key Laboratory of Superhard Materials, College of Physics, Jilin University, Changchun 130012, China
*
Author to whom correspondence should be addressed.
Crystals 2021, 11(8), 928; https://doi.org/10.3390/cryst11080928
Submission received: 7 May 2021 / Revised: 12 June 2021 / Accepted: 17 June 2021 / Published: 10 August 2021
(This article belongs to the Section Inorganic Crystalline Materials)

Abstract

:
CaNb2O6 single crystals with an orthorhombic columbite structure are grown via an optical floating zone (OFZ) method. The as-grown crystals are colorless and free of low-angle grain boundaries and inclusions. They are transparent (up to 62%) in the visible to the infrared region (400–1000 nm) and have a low absorption coefficient (α = 1.56). The bandgap is determined as a direct transition and Eg = 4.28 eV. The wavelength-dependent refractive index and extinction coefficient of the CaNb2O6 crystals are derived from the obtained T and α spectra. Their photoluminescence spectra exhibit a strong and broad emission band centered at 465 nm.

1. Introduction

CaNb2O6 has an orthorhombic columbite structure and exhibits excellent microwave dielectric and optical properties [1,2,3]. Pure and doped CaNb2O6 have become attractive because of their potential applications in microwave (MW) circuitry and solid-state pumped lasers [4,5,6,7,8]. Polycrystal and nanocrystal samples have been prepared through many methods, such as solid-state reactions [9], polymerized complex methods [10,11,12,13], sol–gel processes [14,15], and solvothermal methods [9].
CaNb2O6 has been widely investigated [4,5,6,7,8,9,10,11,12,13,14,15]. However, its type of band gap transition has yet to be elucidated [9,16,17,18]. So far, CaNb2O6 samples with different forms, such as crystals, polycrystalline, and nanoparticles, have been investigated. However, some experimental results about band gap transition types are inconsistent [9,16]. In previous reports [19,20,21], data about the characterization of CaNb2O6 crystals are limited. Therefore, high-quality crystals should be grown to identify and investigate the intrinsic characteristics of CaNb2O6.
In 1968, CaNb2O6 crystals were grown via a chemical transport method [19] (crystal dimension: 1 mm × 0.2 mm × 0.5 mm); in 1998, they were fabricated through a flux method [20] (size: 0.8 mm × 0.8 mm × 0.05 mm). However, these methods have two problems: the size of the grown crystals is small, and impurities are unavoidable in the flux method. In 2004, R. de Almeida Silva et al. [21] grew CaNb2O6 crystals fiber through laser-heated pedestal growth. By this method, they avoided impurities, but they obtained small-dimension crystal fibers (Ø < 1 mm).
Considering the abovementioned factors, we grow CaNb2O6 single crystals via an OFZ method. In contrast to these methods, the OFZ method is more suitable for growing CaNb2O6 single crystals because of a crucible-free condition and an atmosphere-controllable environment [22,23,24,25,26,27]. The crystals grown through this method are free of impurity, sufficiently sized, and suitable for experimental measurements [28,29,30]. In the present work, pure CaNb2O6 single crystals were grown via the OFZ method. The optical properties of the grown crystals were also investigated.

2. Materials and Methods

The starting CaNb2O6 powders were prepared by calcining stoichiometric amounts of Nb2O5 (Alfa Aesar 99.9985%) and CaO (Alfa Aesar 99.99%) at 1500 K for 20 h with intermediate grinding. The CaNb2O6 powders were packed into a cylindrical shape rubber tube and then pressed hydrostatically up to 70 MPa in a cold isostatic pressure to form a cylindrical rod of 6–7 mm in diameter and 70 mm in length. The rods were sintered in air at 1500 K for 10 h and formed a polycrystalline ceramic rod used as the feed and support rods in the crystal growth procedure.
The crystals were grown in an optical floating zone furnace (CSI FZ-T-10000-H-VI-VP, Crystal systems, Inc, Yamanashi, Japan) equipped with four 1000W halogen lamps as the heating source. The growth conditions were as follows: the seed and feed rods were rotated in opposite directions at the rates of 10 and 20 rpm, respectively. The growth rate was 7.0 mm/h. The air flow of 0.1 L/min and the pressure of 0.1 MPa were applied. The CaNb2O6 crystals were grown by spontaneous nucleation.
The crystal structure was characterized using a Rigaku D/max-r A 12 kW X-ray diffractometer (XRD), Rigaku, Inc, Tokyo, Japan with Cu Ka radiation. A Bruker AXS D8 Discover with a GADDS X-ray diffractometer (XRD2), Bruker, Karlsruhe, Germany, was used to measure the orientation of the as-grown crystal. The Raman spectra were taken with a Jobin-Yvon HR800 micro-Raman spectrometer, Pair, France with an argon laser at 514.5 nm as the light source. The macroscopic defects such as low-angle grain boundaries and inclusions were observed with an Olympus Model BX-51, Olympus, Tokyo, Japan, polarizing microscope in transmission configuration. Room-temperature transmittance and absorption spectra were measured using a Shimadzu UV-VIS-1700 spectrophotometer Shimadzu, Tokyo, Japan in the range of 200–1000 nm. The photoluminescence spectra were measured by Jobin Yvon Fluoro Max-4 spectrophotometer equipped with a Xenon lamp.

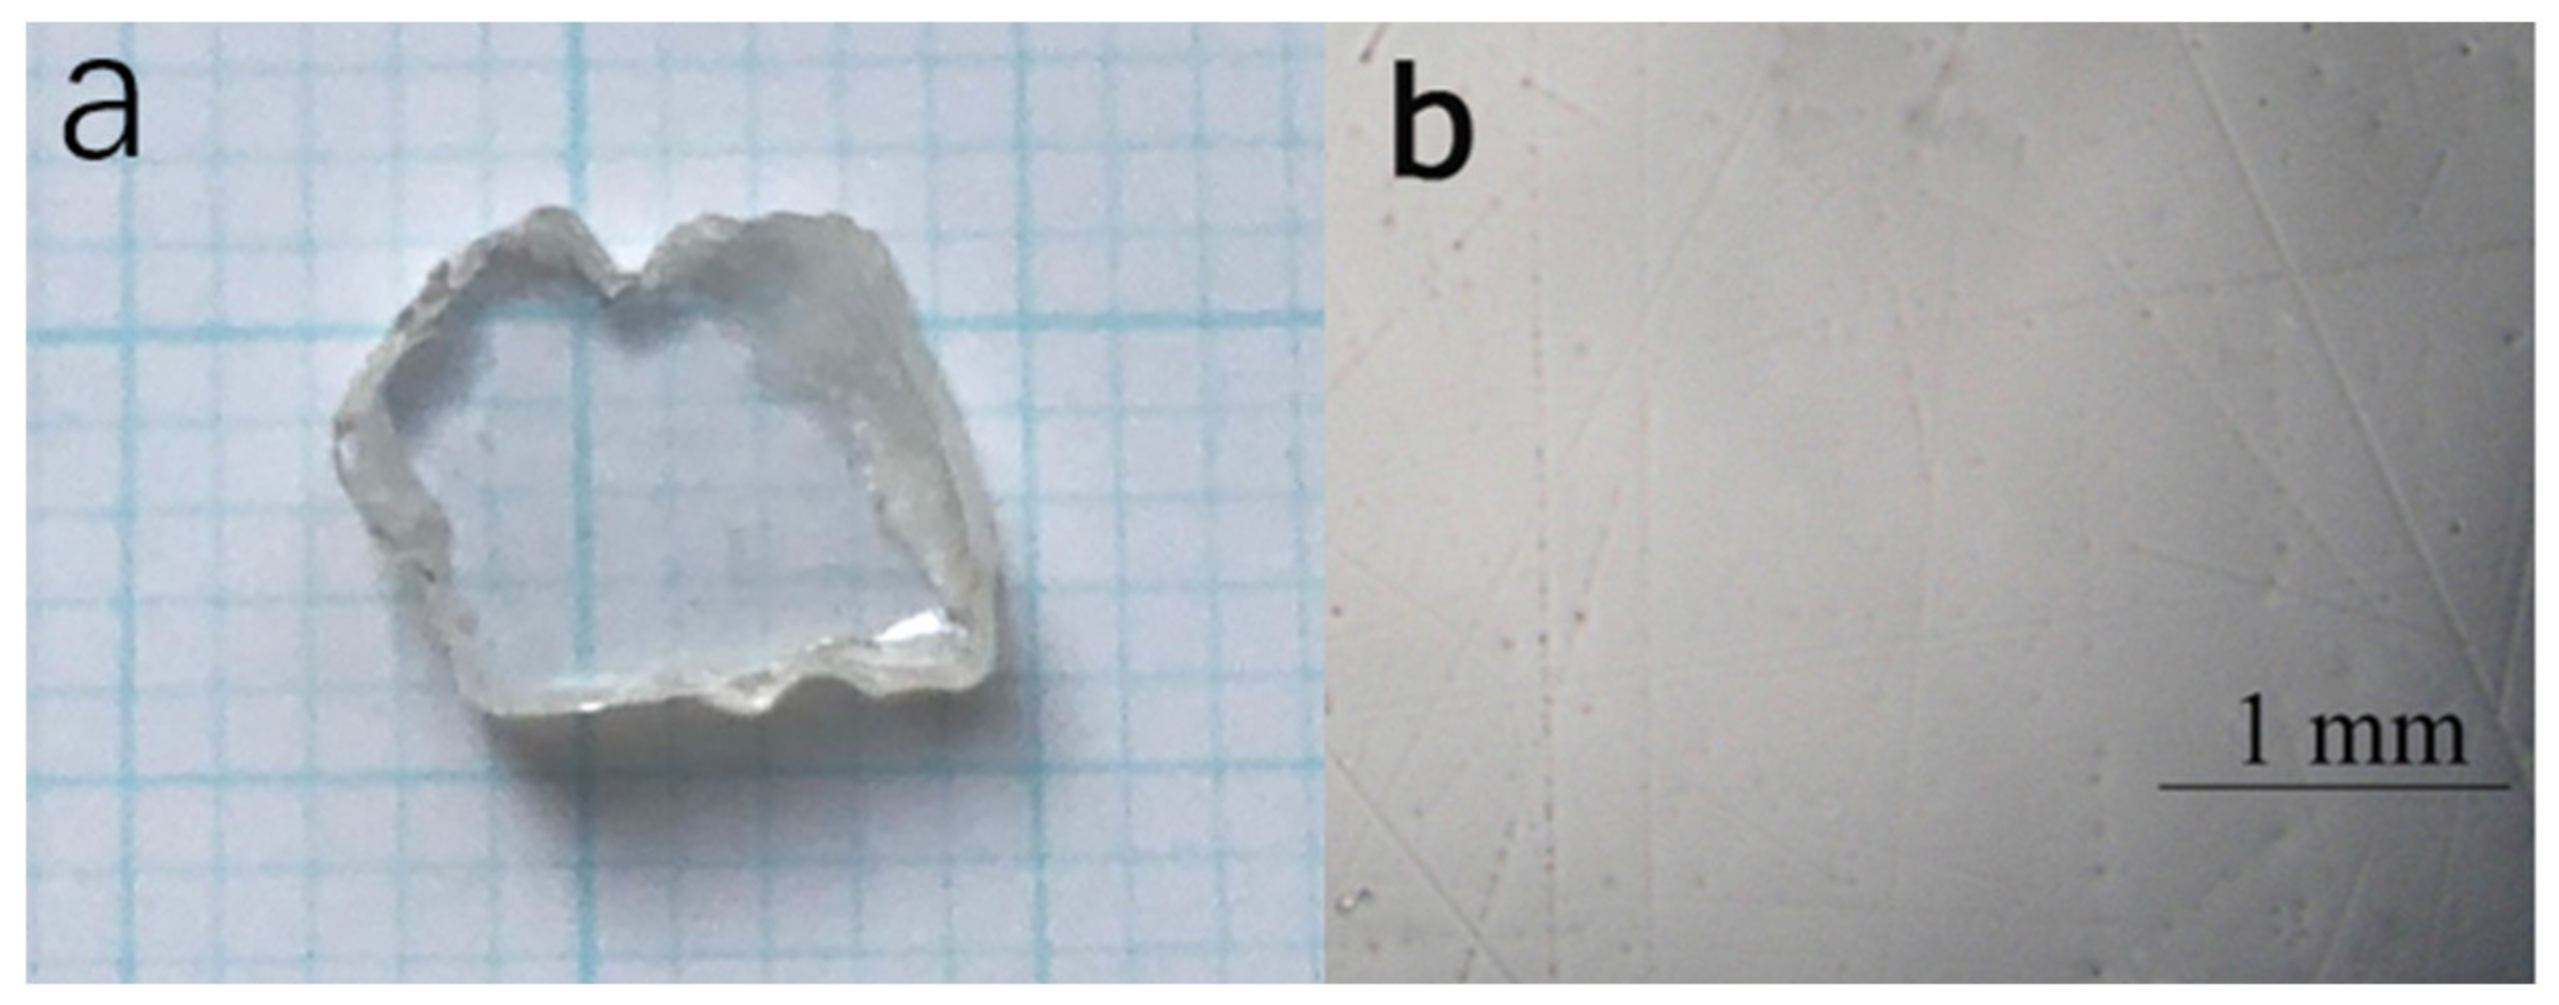
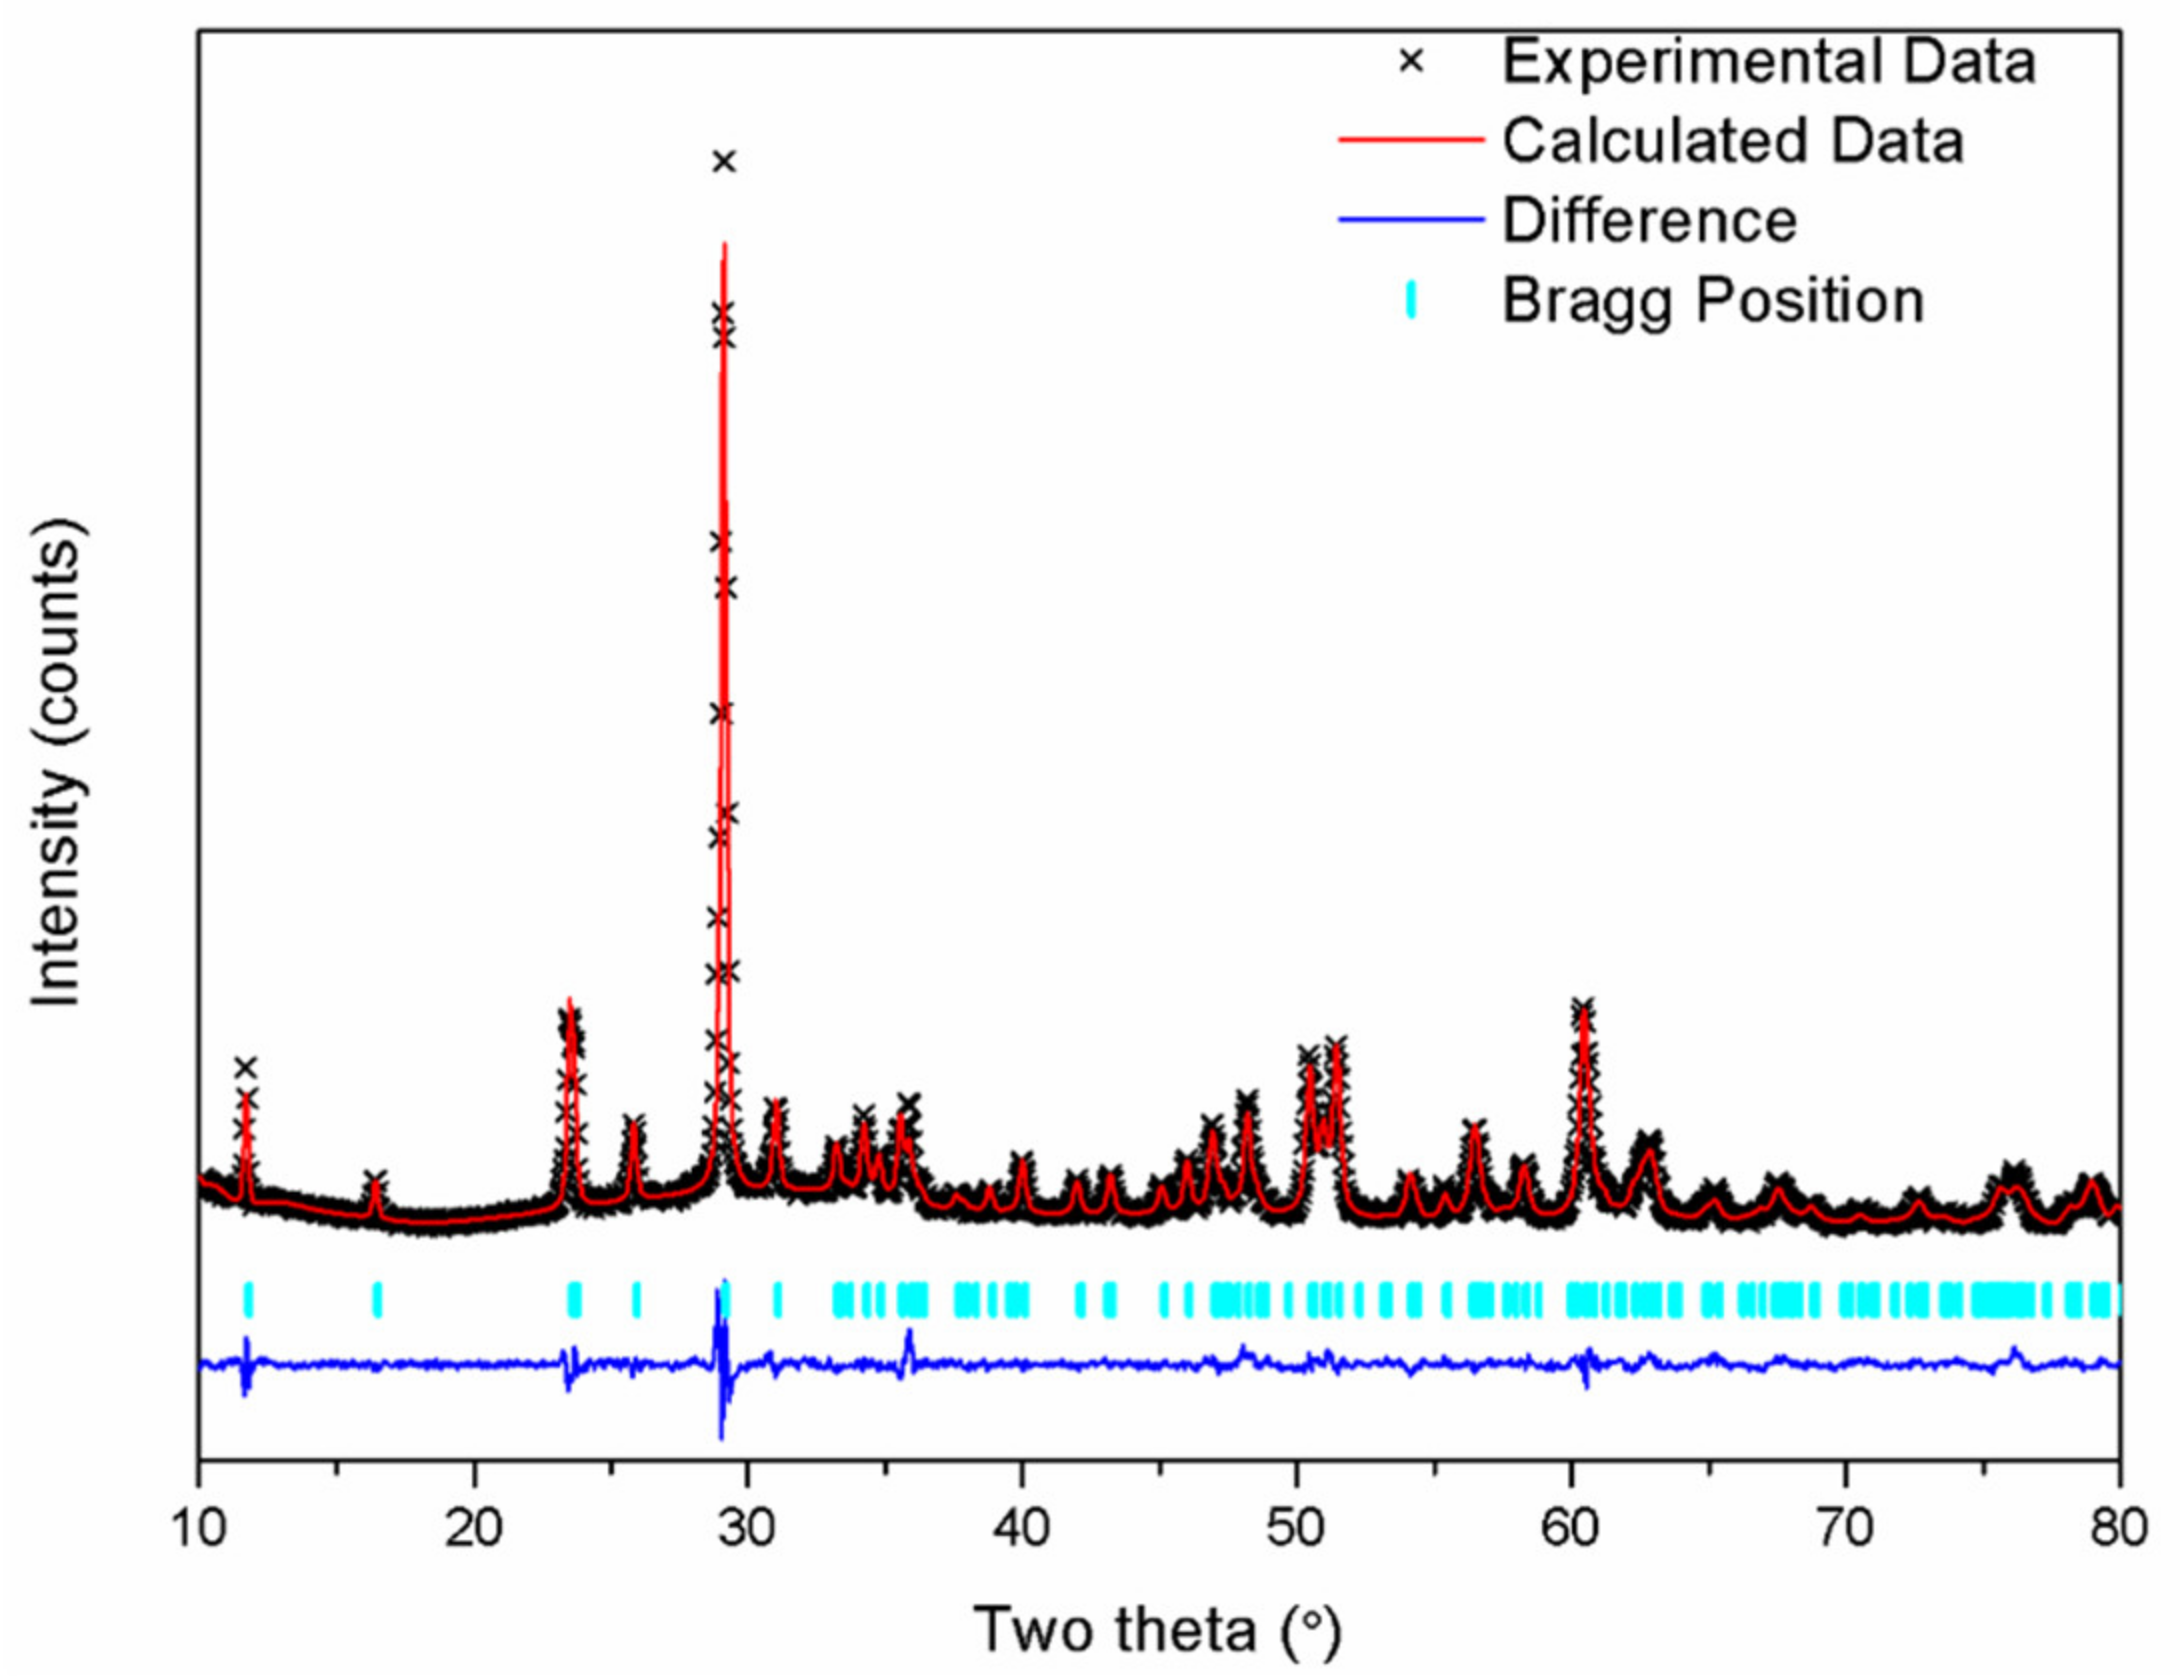
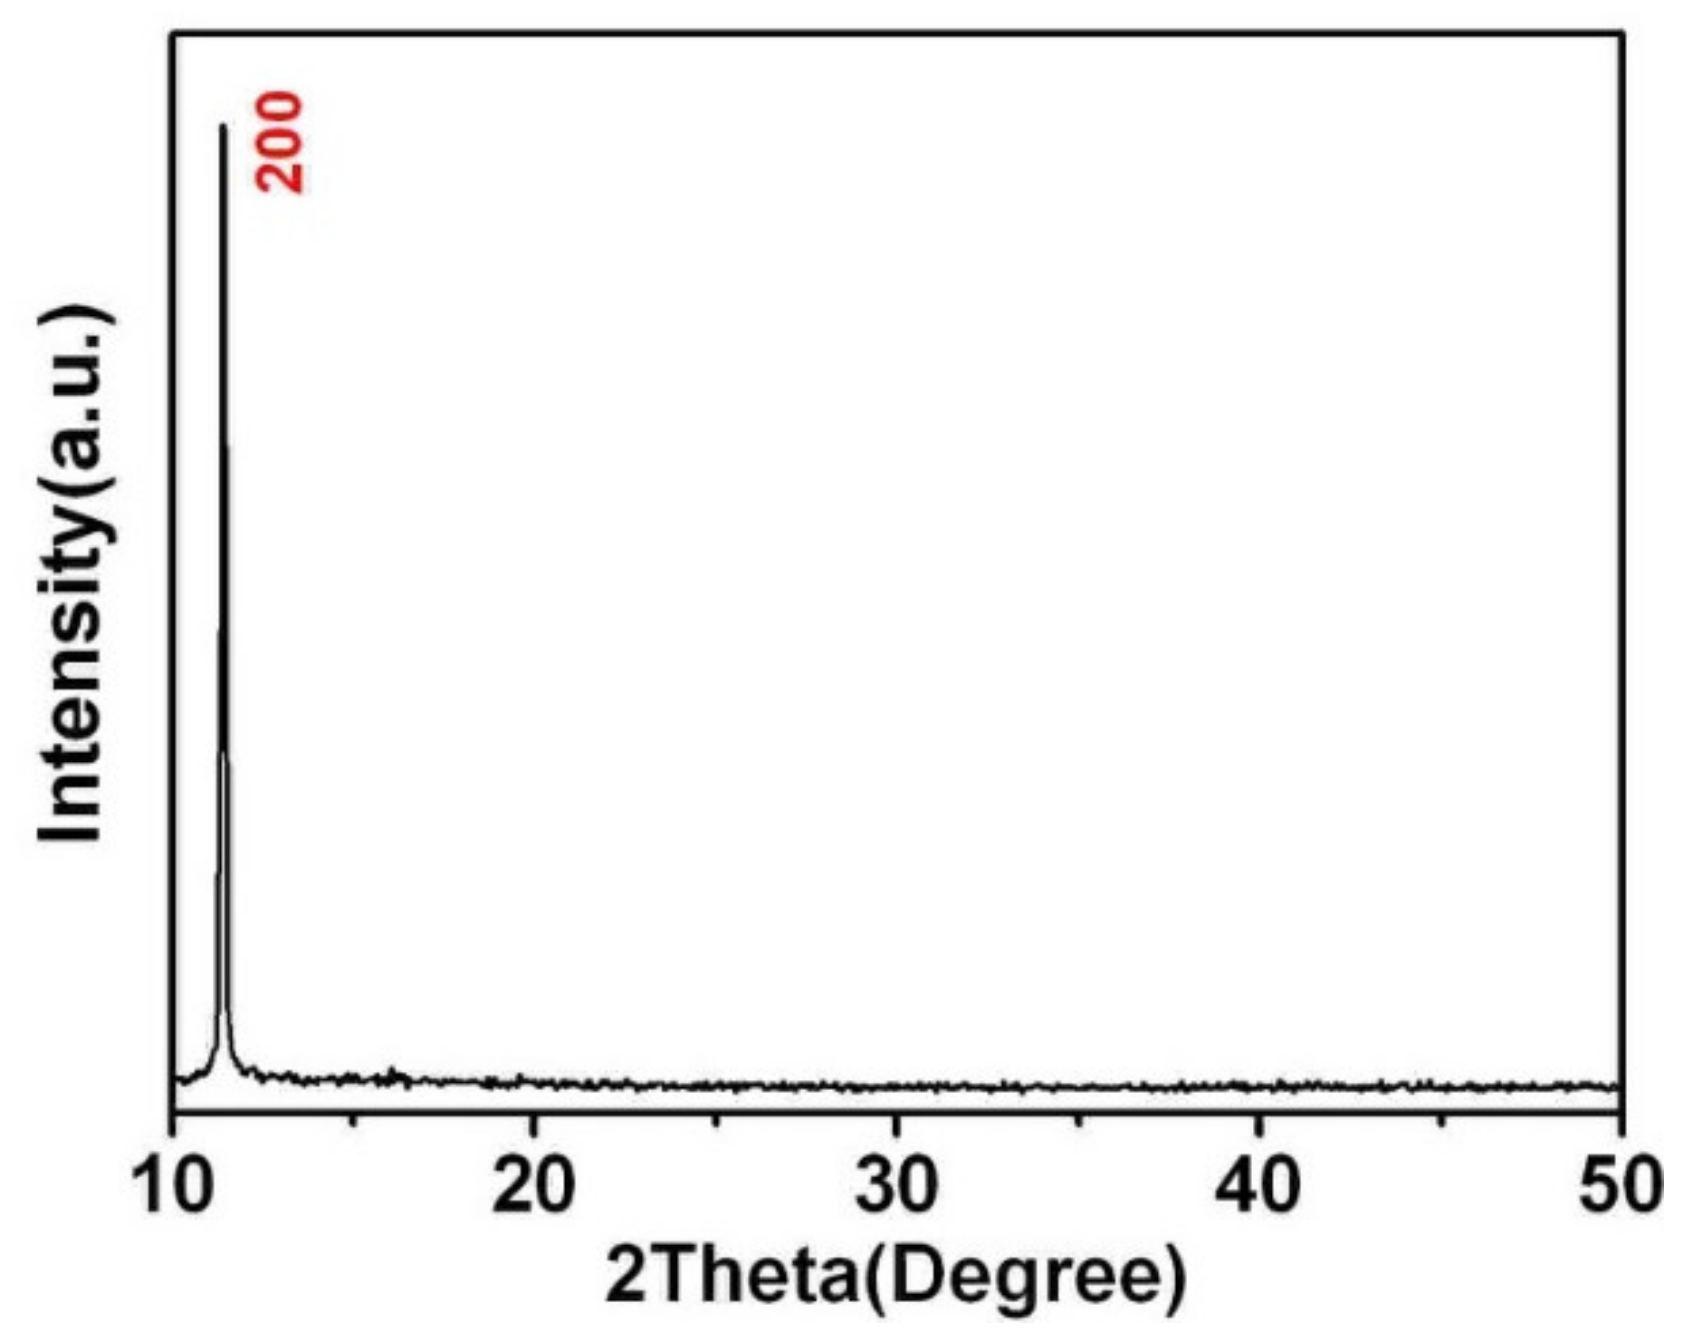
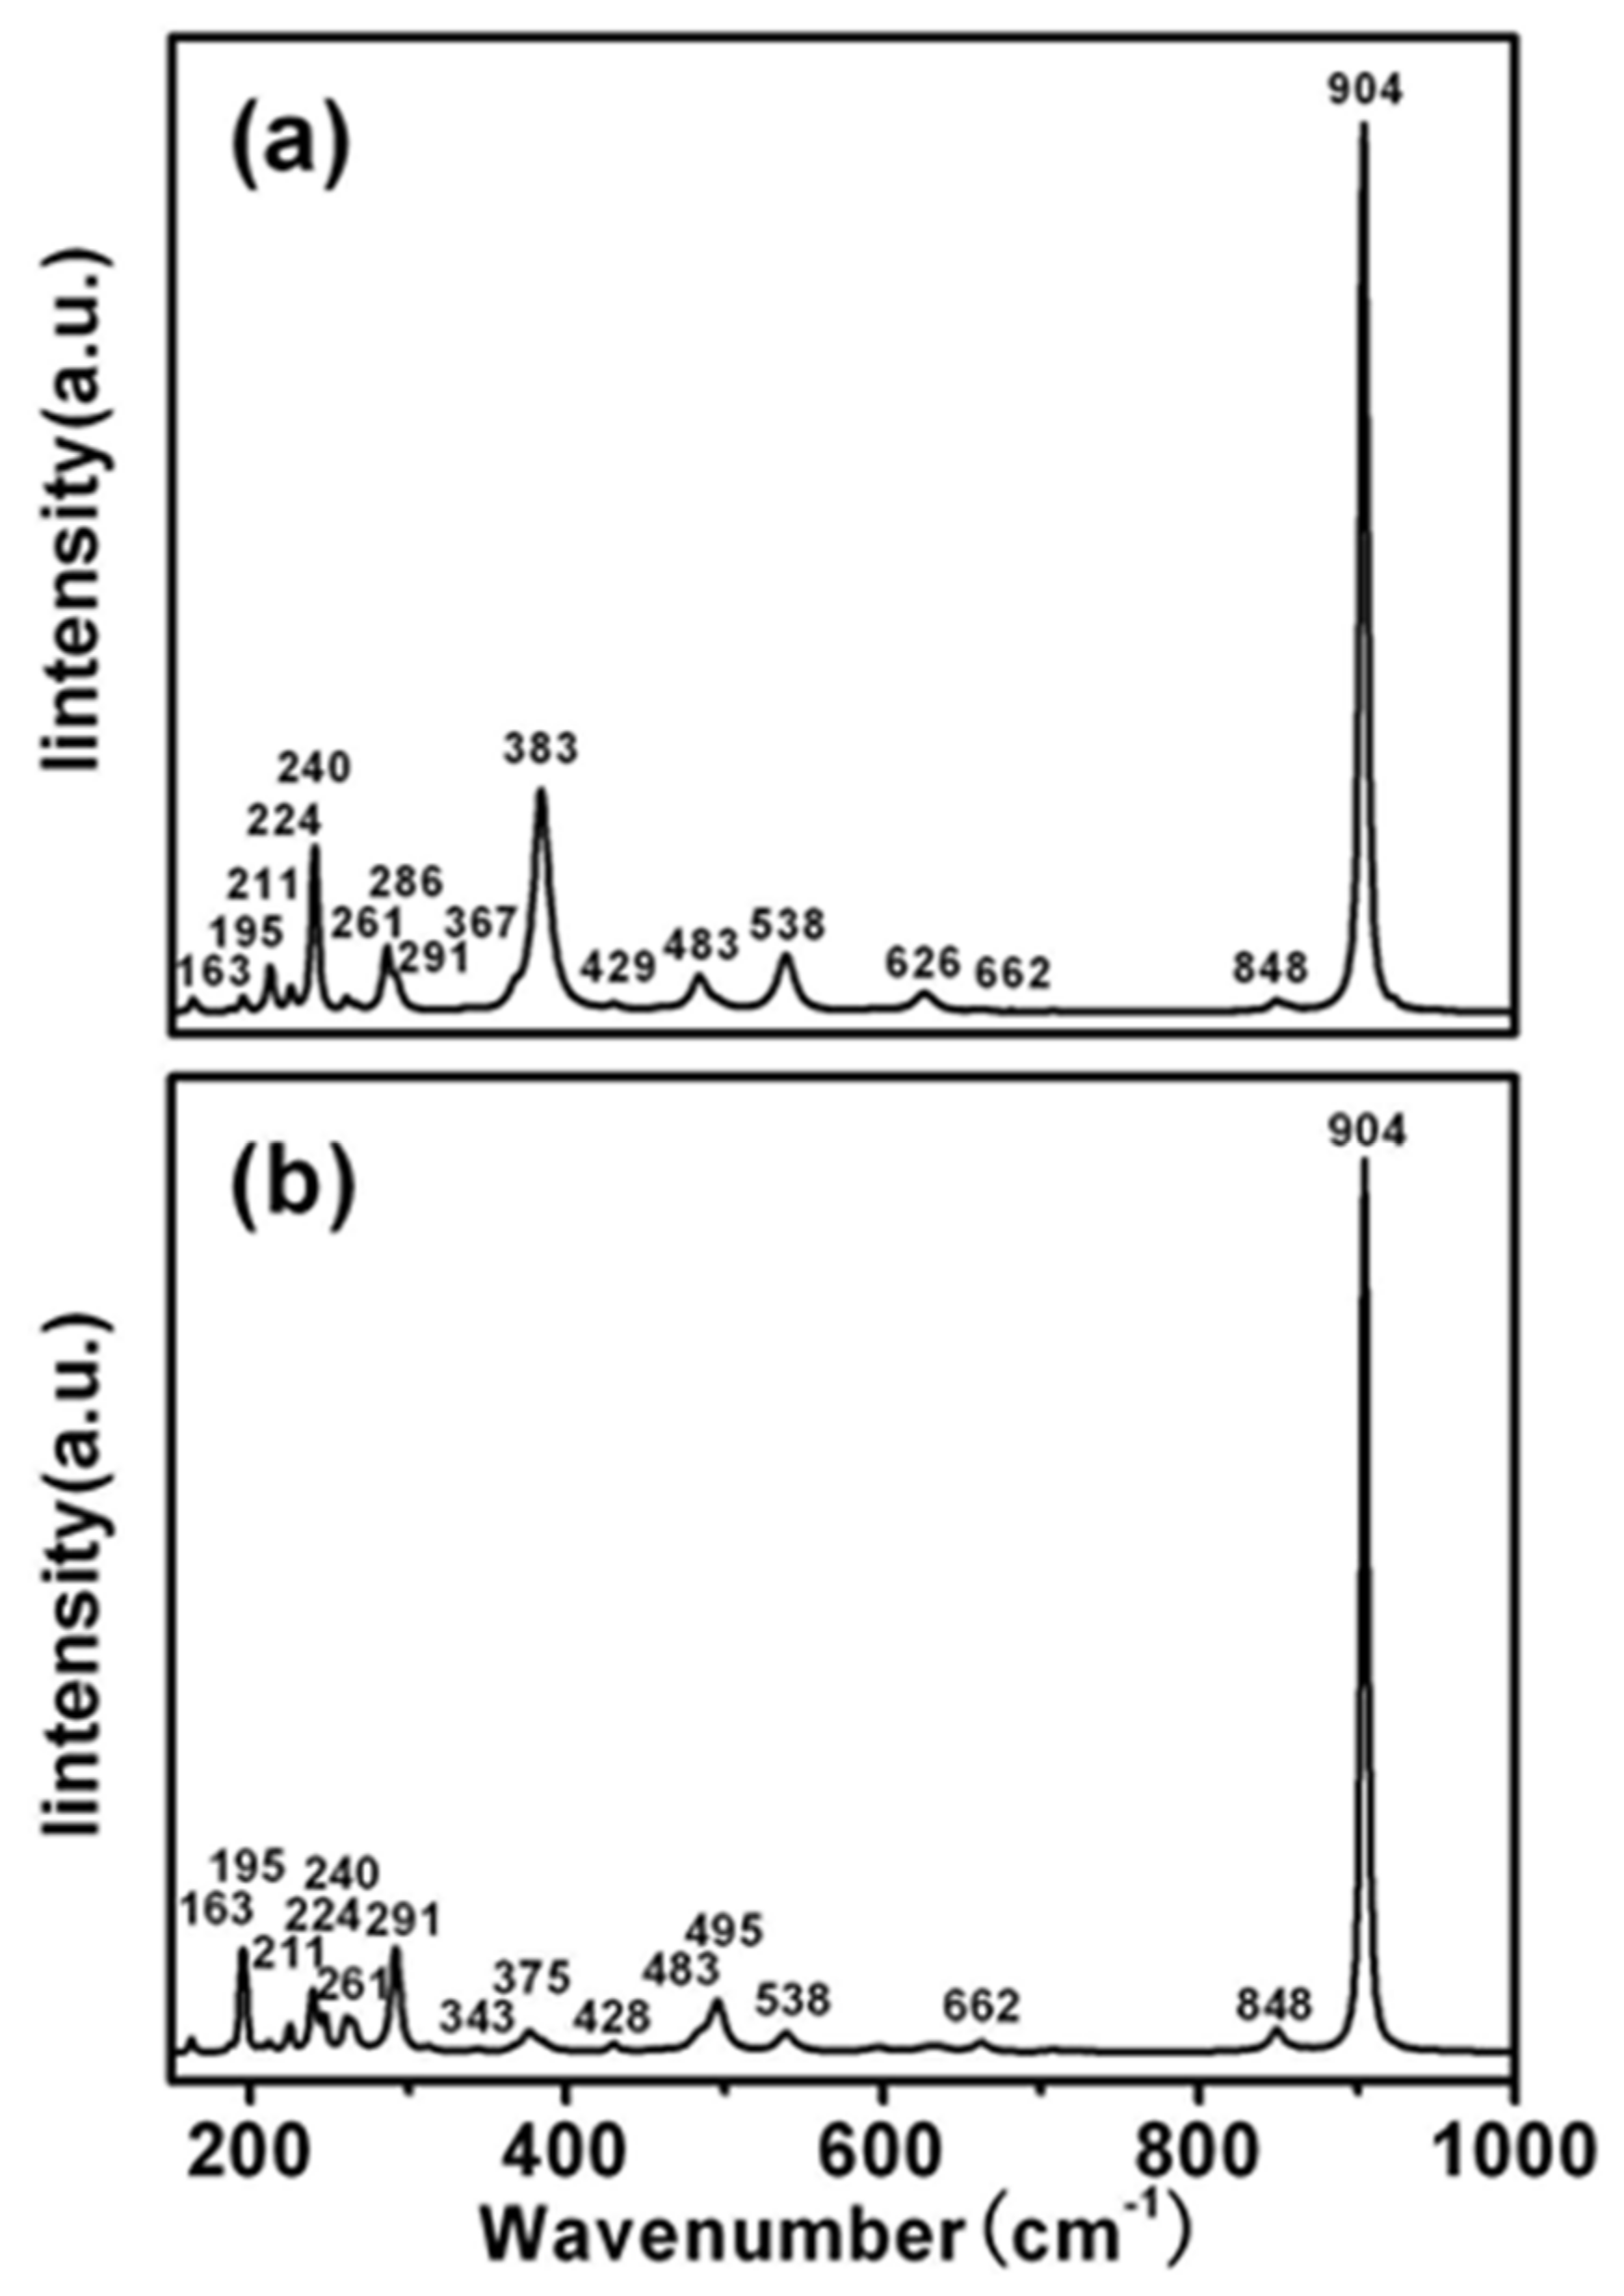
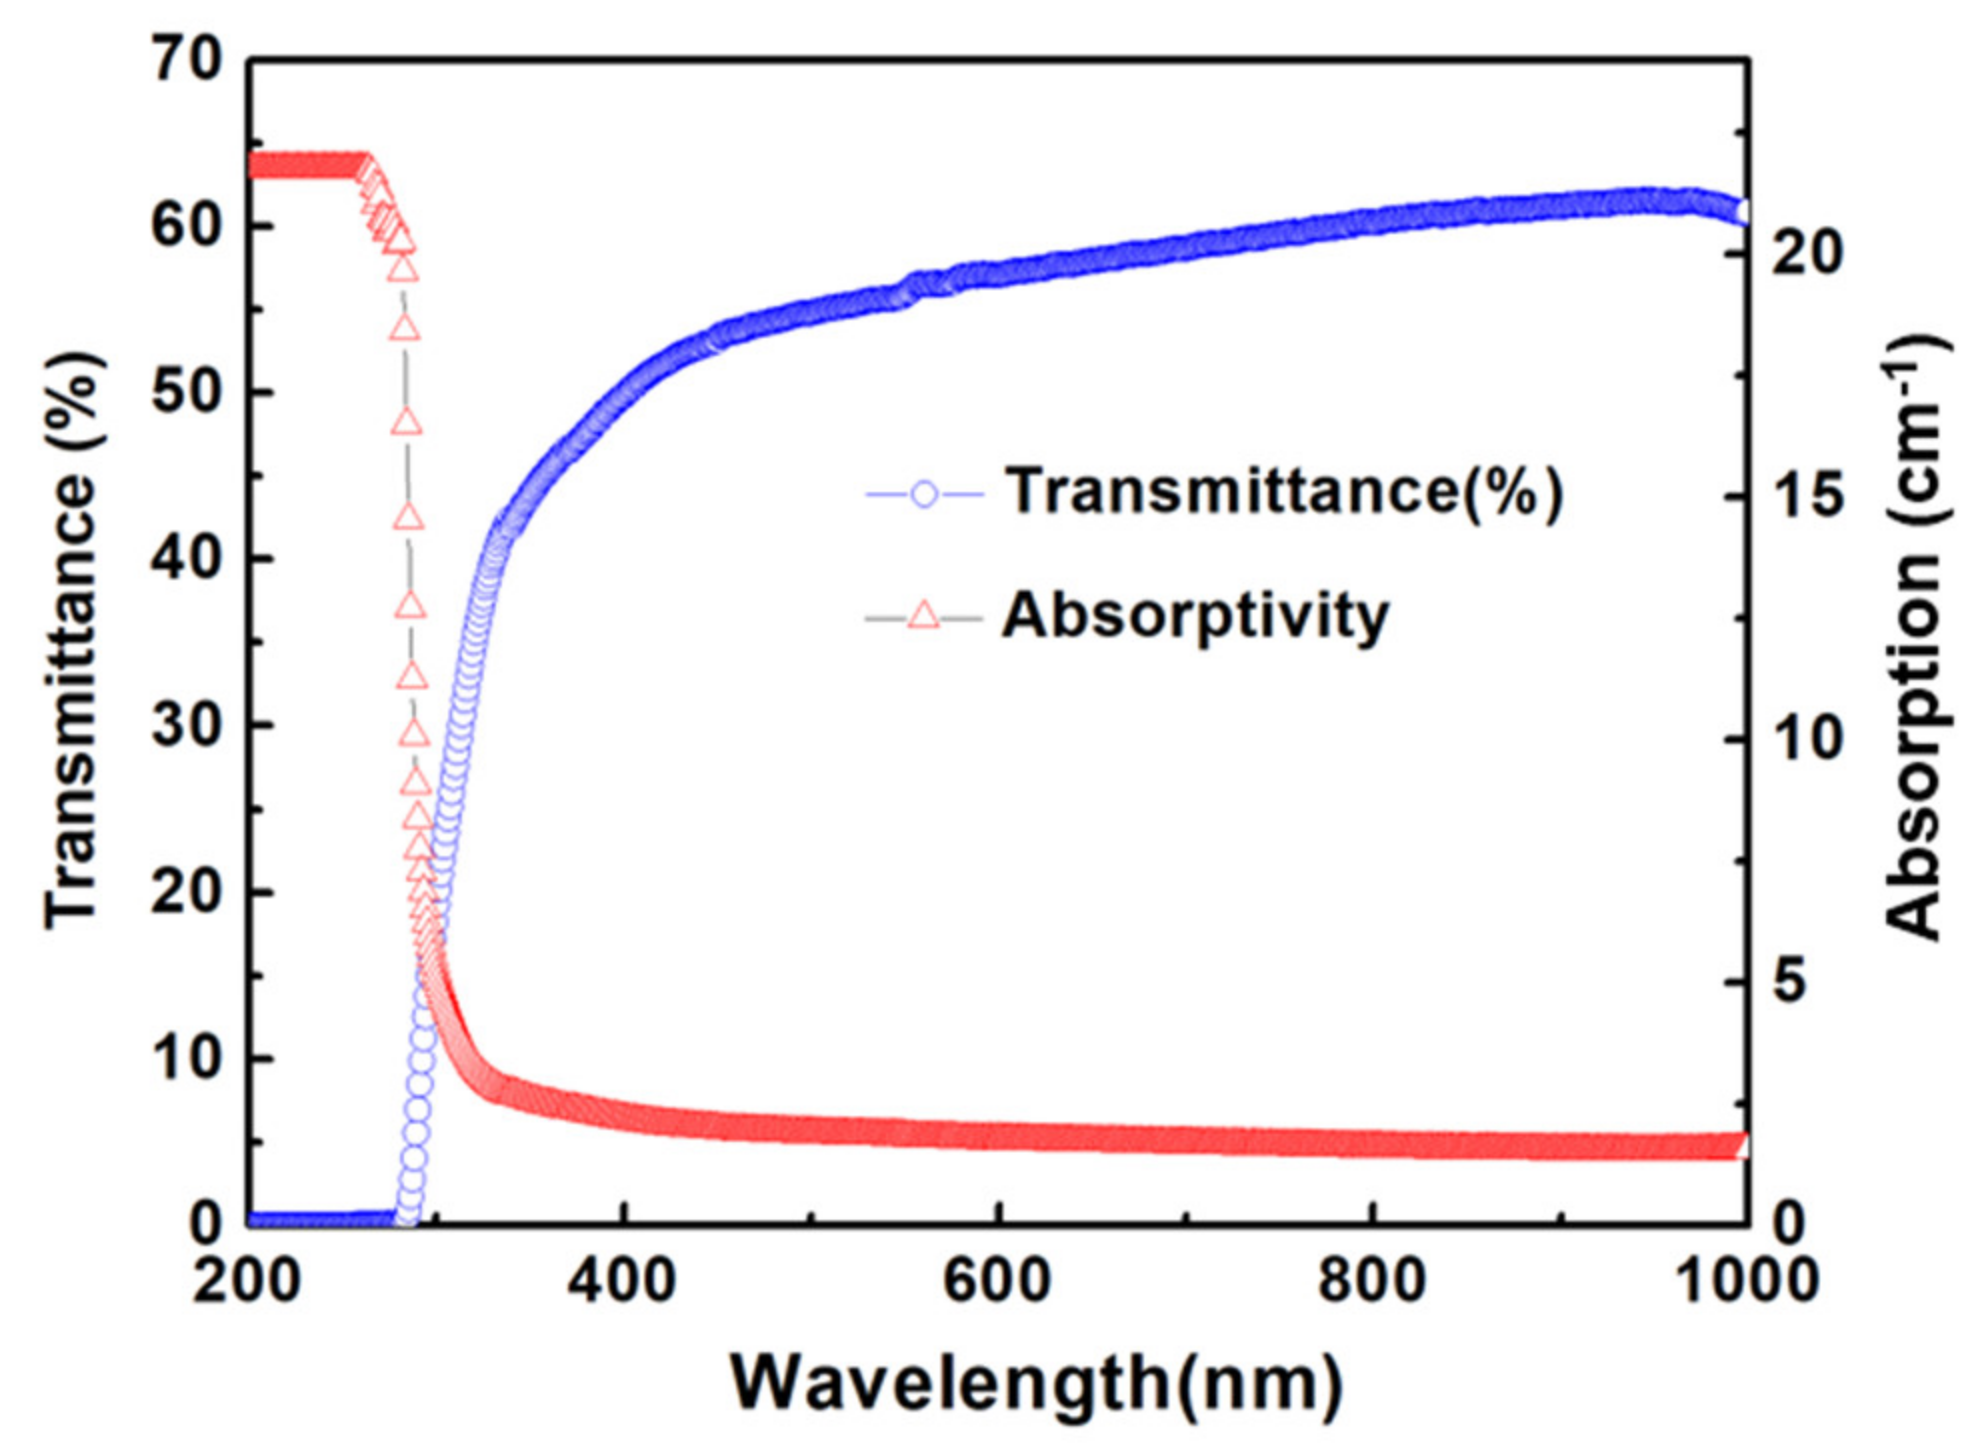
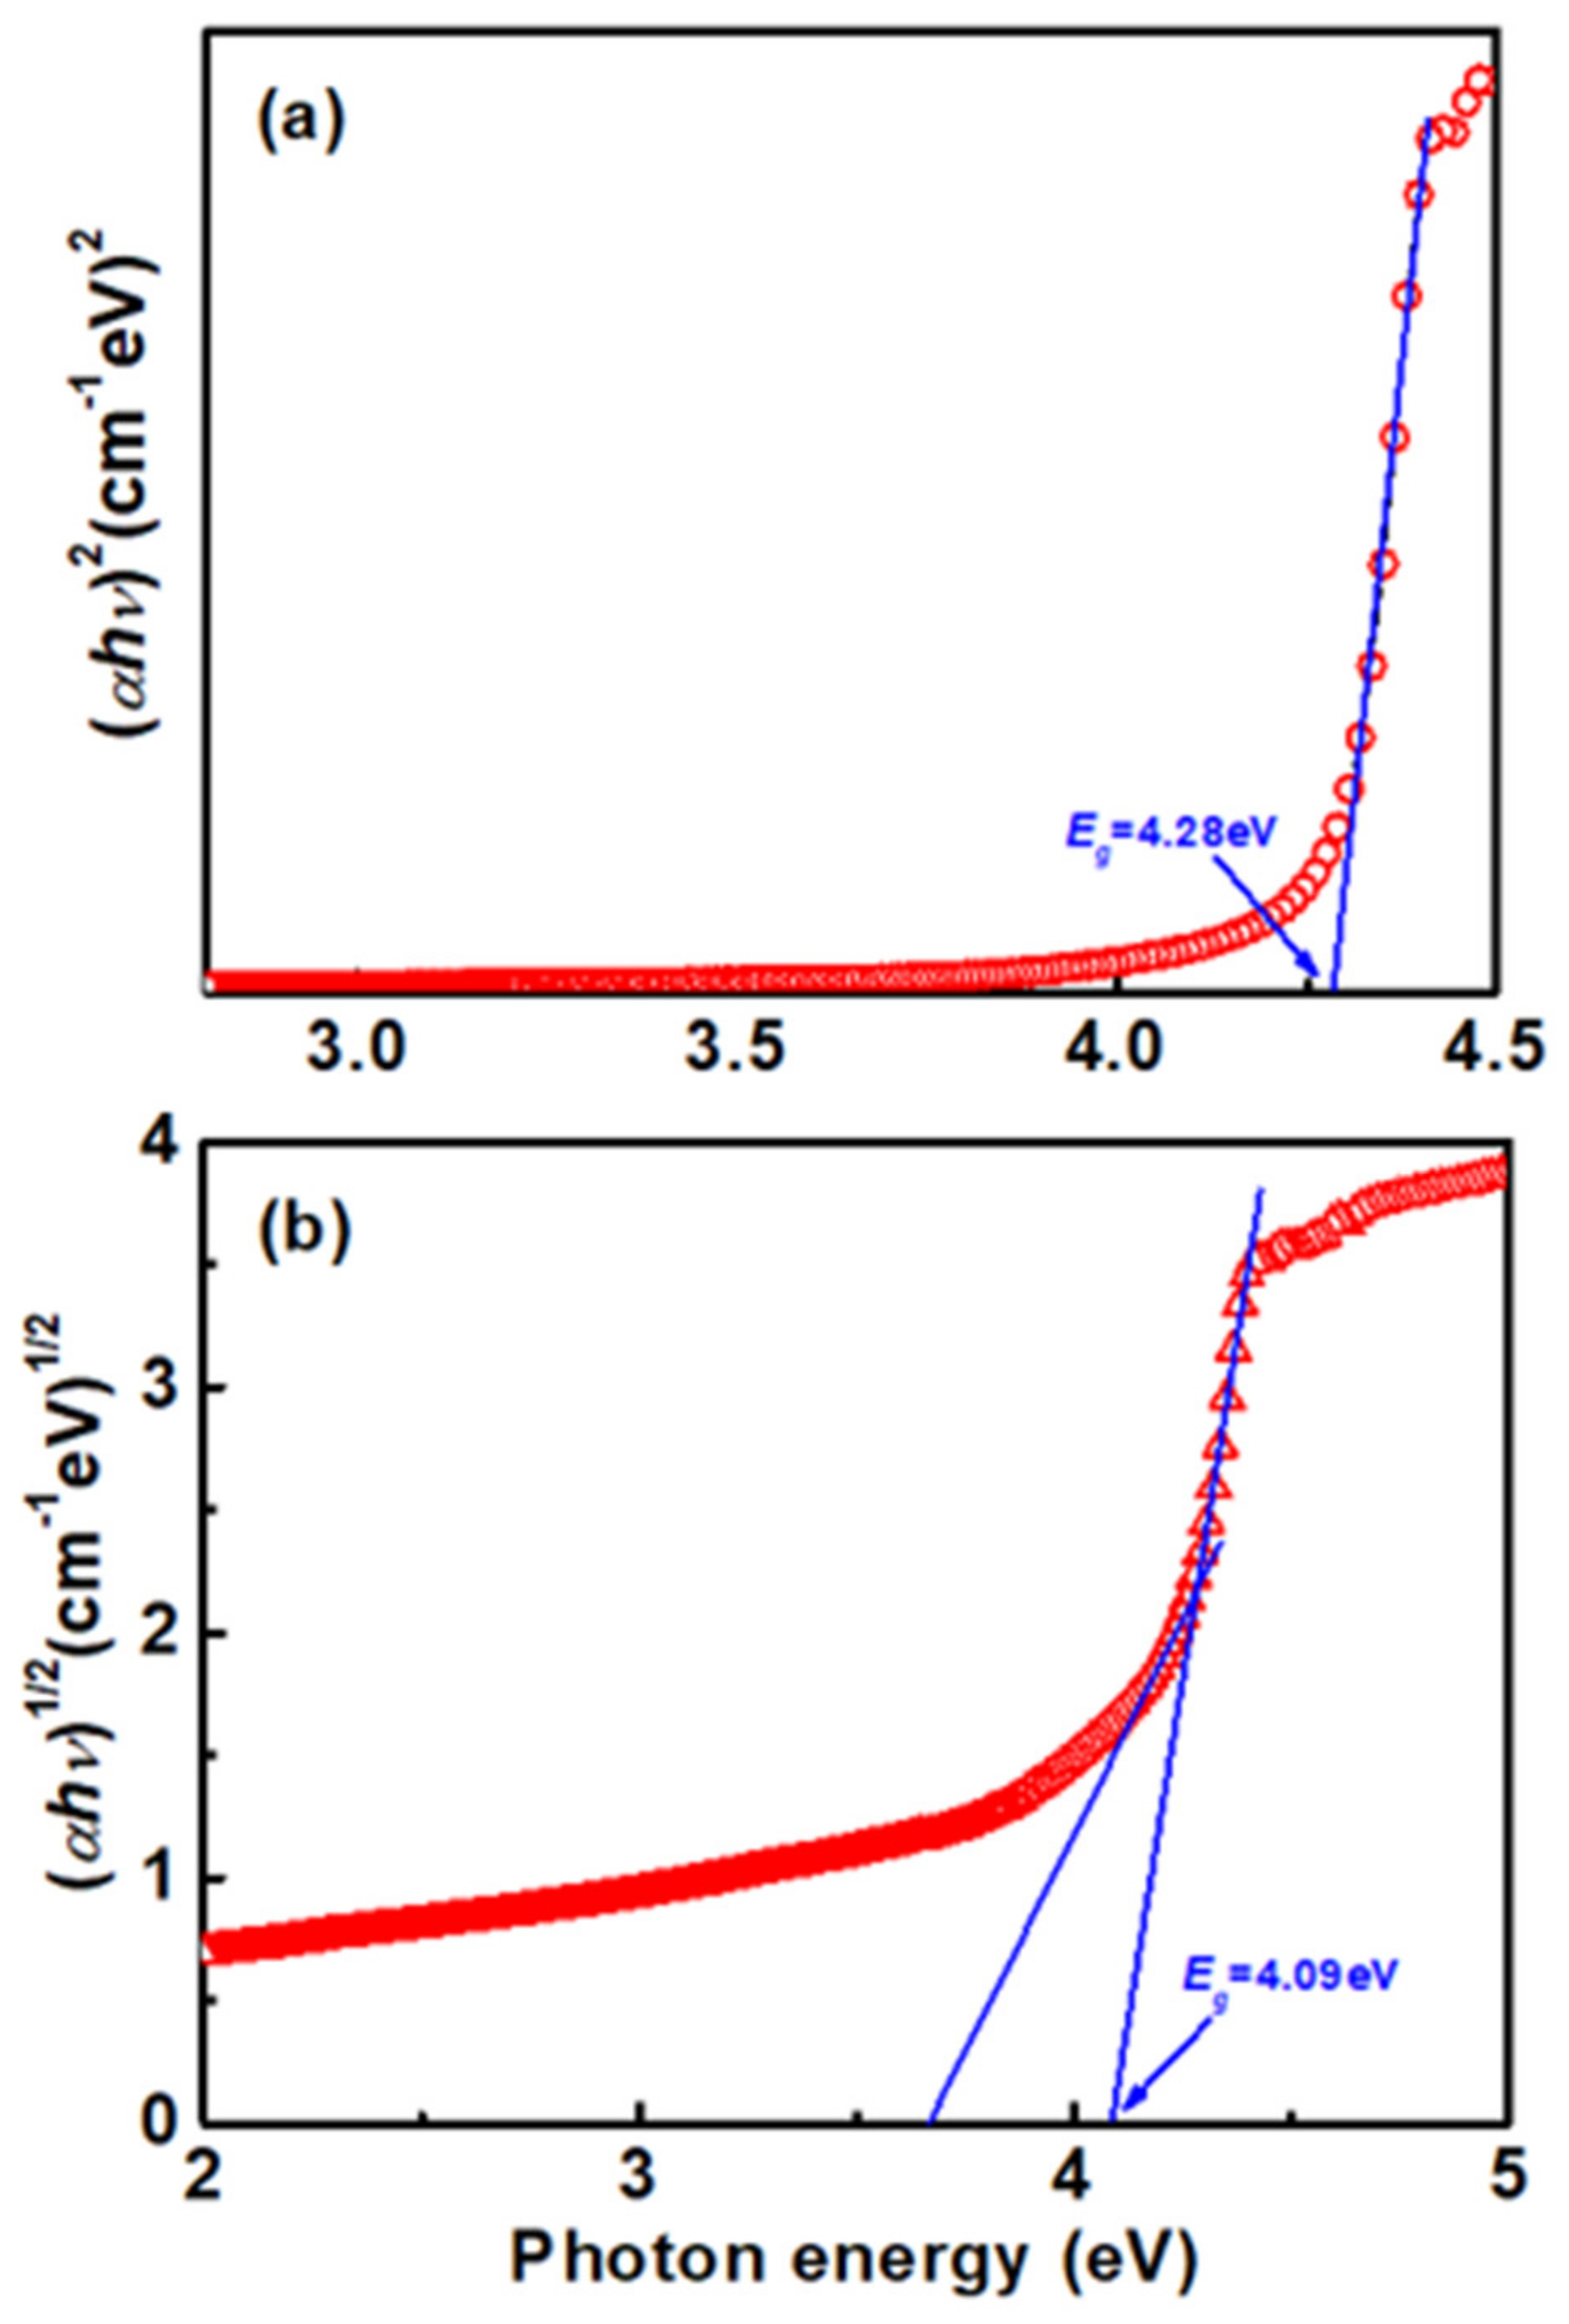
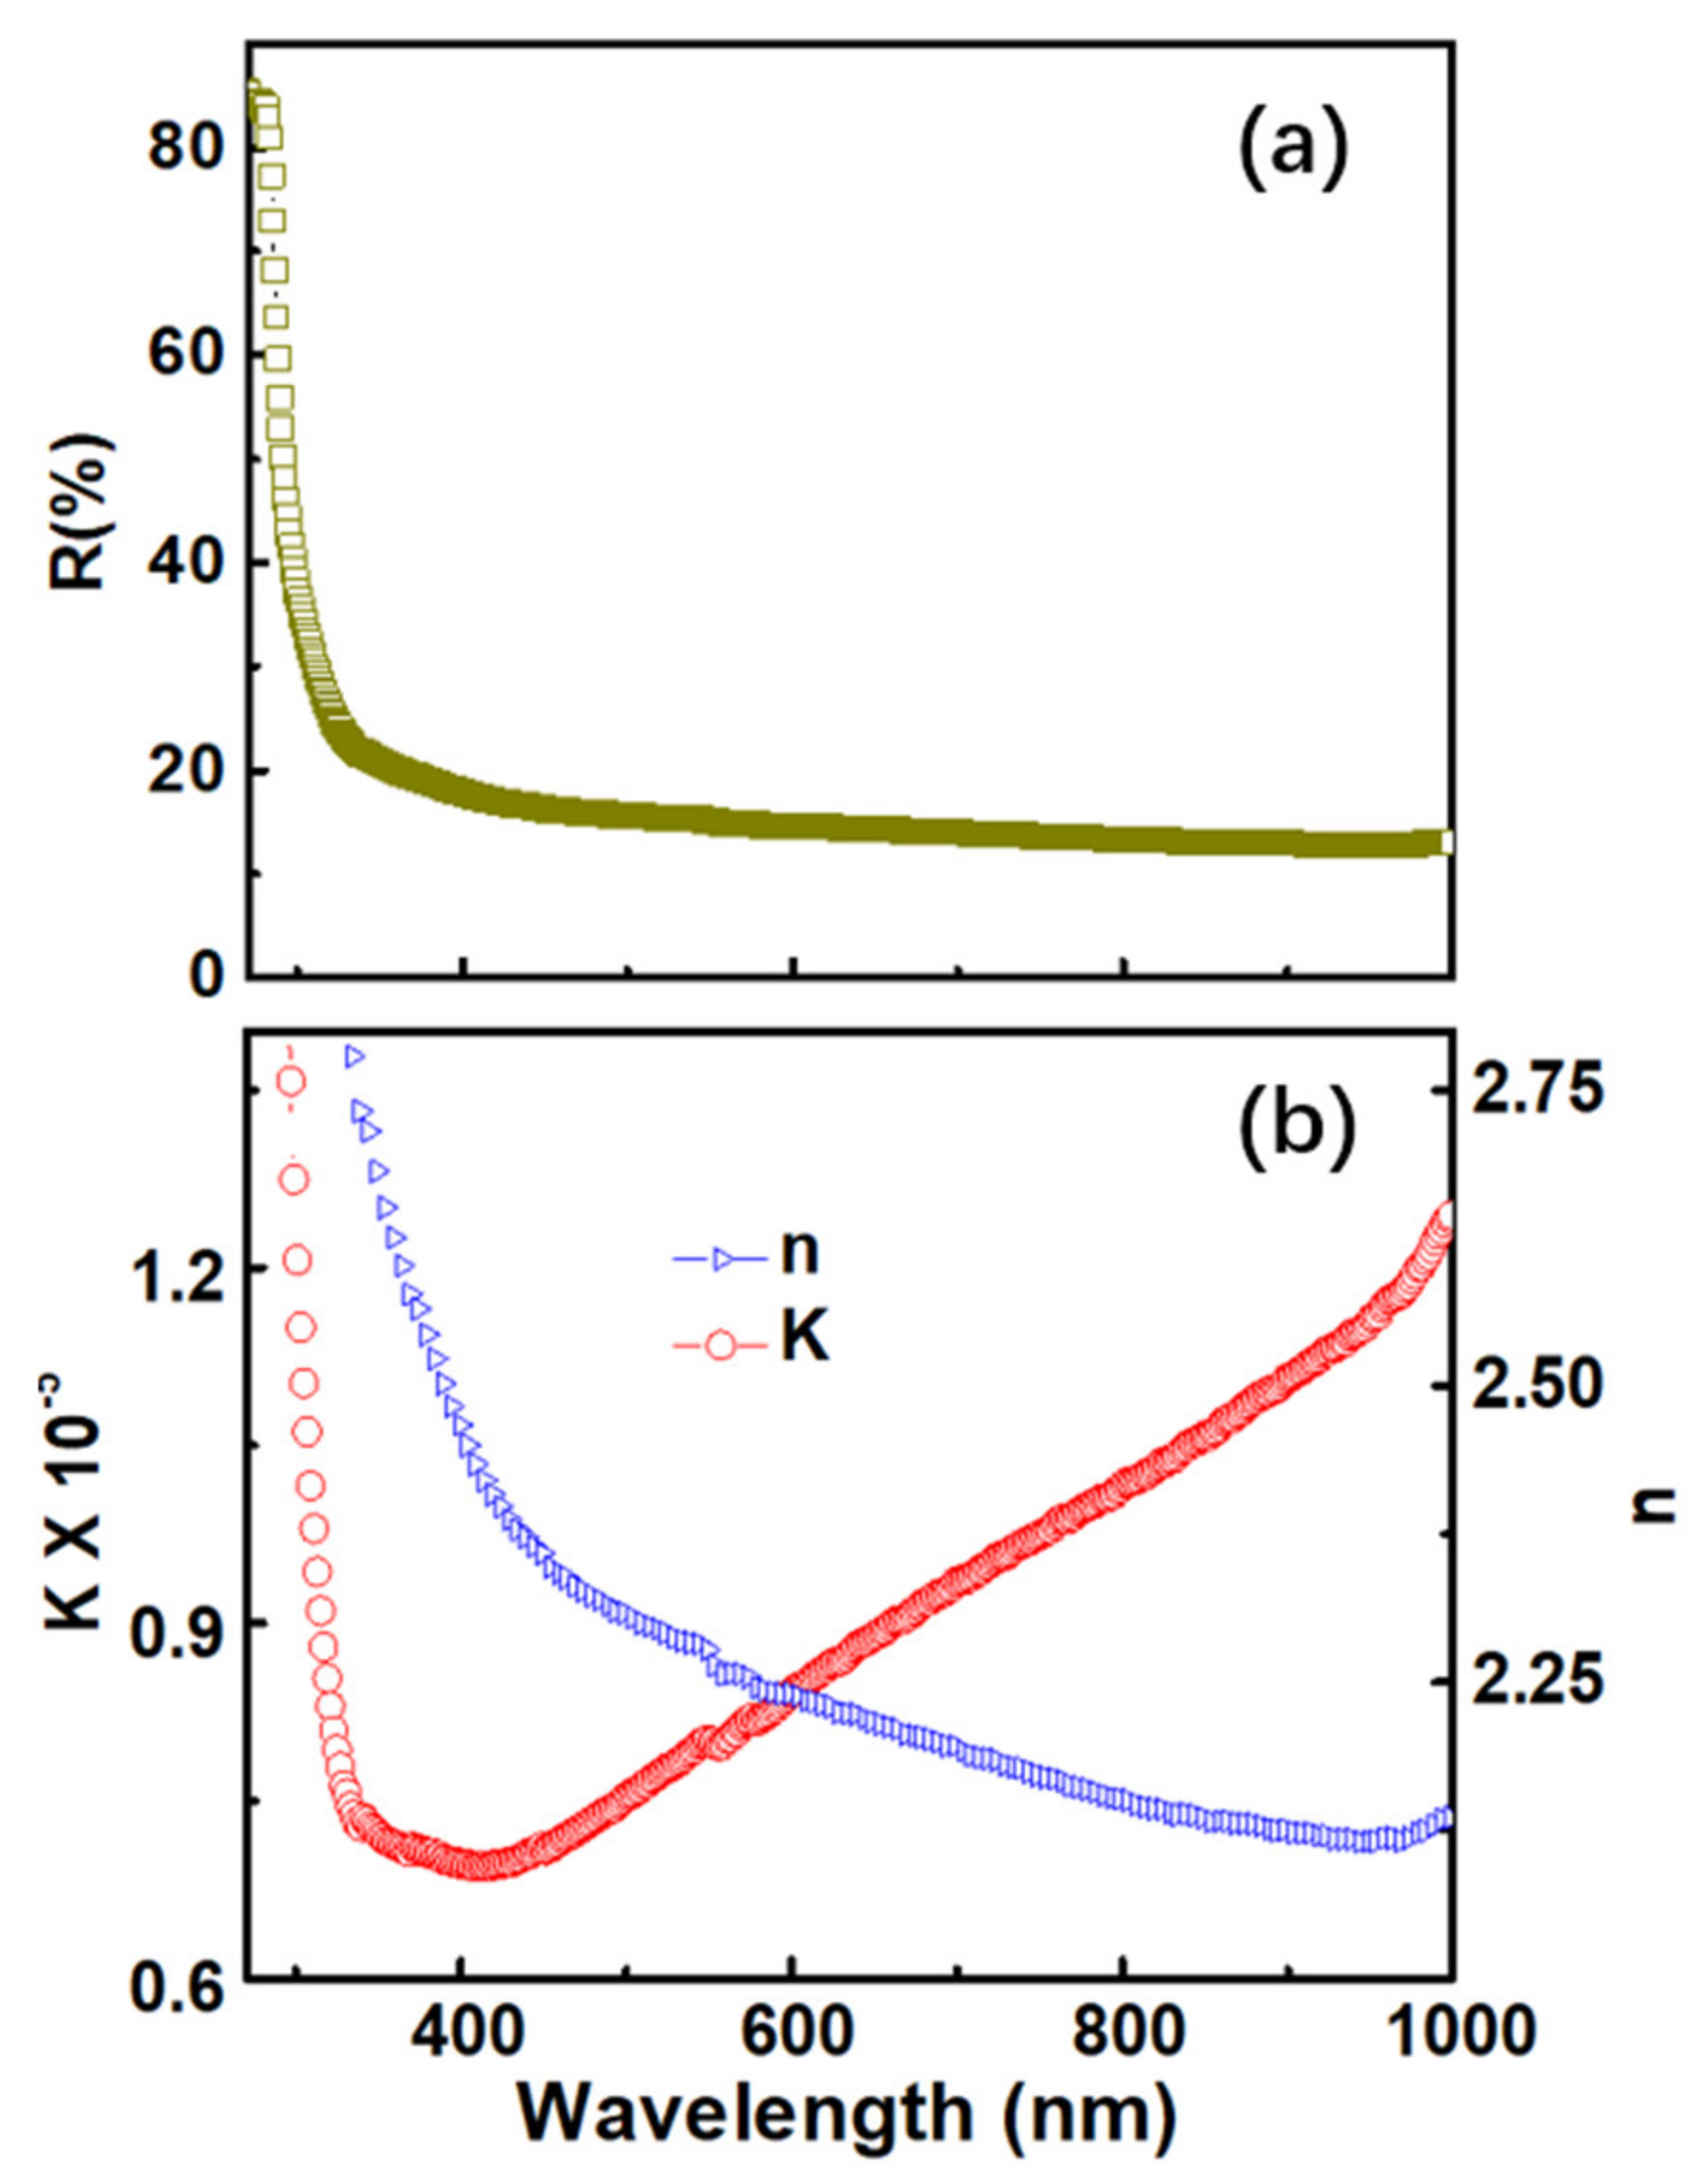
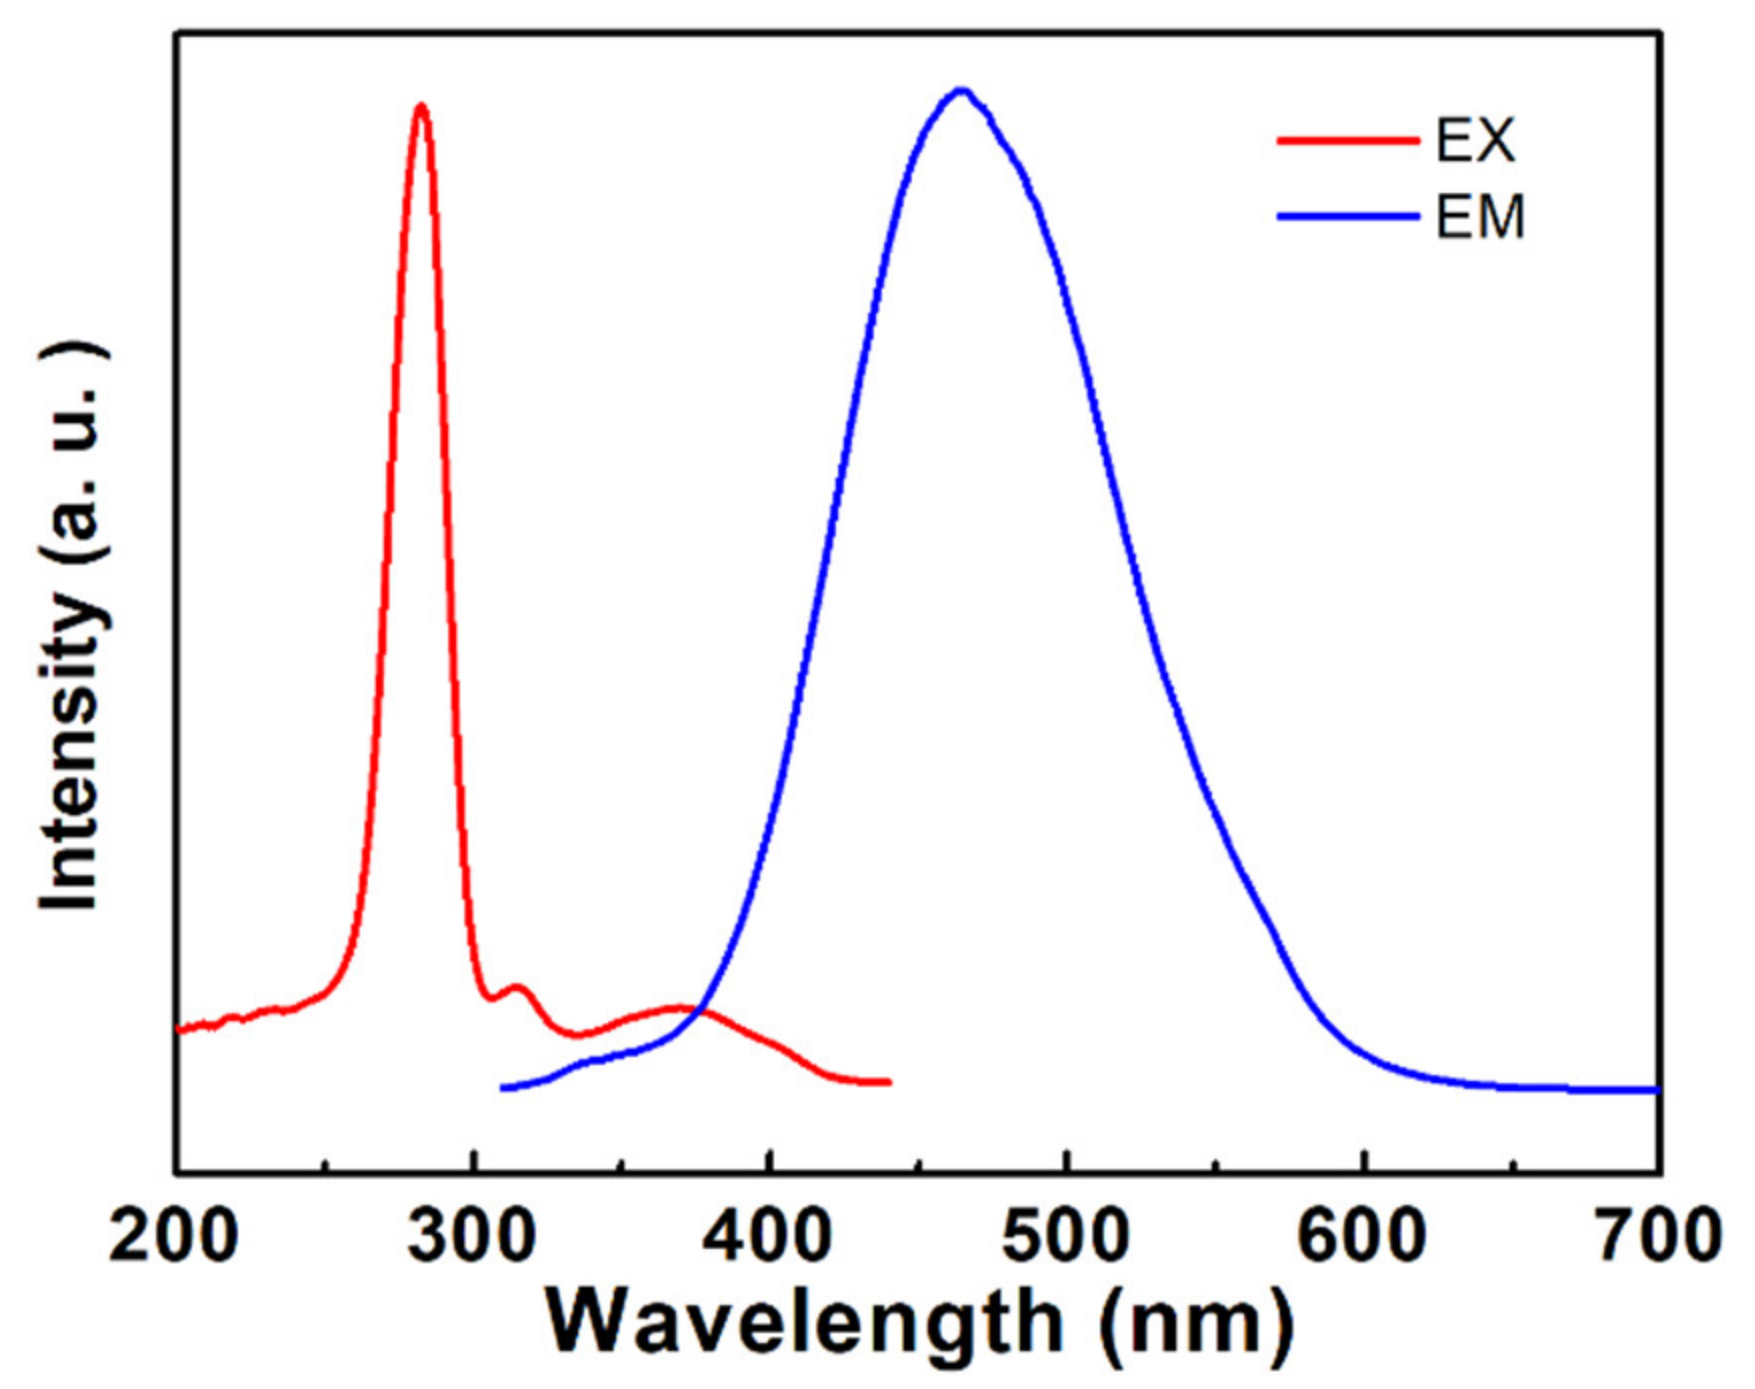
3. Results and Discussion

The crystals, as shown in Figure 1, were grown in an OFZ. The power needed to melt the rods was about 65.5% of the total output power of the lamps (1000 W). The as-grown rod was composed of several large domains, which were about Φ 6 mm × L 6 mm, colorless and transparent. For use in measurements, a crystal wafer was cut perpendicular to the growth direction, as shown in Figure 1a.
To study structure and components, the as-grown crystal was ground to powder and the powder XRD pattern of the as-grown crystal was shown in Figure 2. The XRD pattern of the powder sample was refined via the Rietveld method by using GASA software. The relative information is listed in Table 1. The size of the as-grown CaNb2O6 crystals are bigger than the previous literature reported [19,20,21].
To determine the direction of the cross-section of the CaNb2O6 wafer, XRD2 was conducted on the wafer. The detector of the XRD2 is two-dimensional, named GADDS, and is located at the Debye–Sherrer ring. When we measured the direction of the wafer, the direction of the incident X-ray and the GADDS was fixed at 20 and 160 Deg., respectively. In the range from 10 to 50 degrees, as shown in Figure 3, only one peak was observed, which can be indexed to the (2 0 0) plane. It indicates that the direction of the CaNb2O6 wafer is the a-axis. The macroscopic defects, such as the low-angle grain boundaries and inclusions of the as-grown crystal, were examined by polarized-light microscopy in the transmission configuration. Figure 1b shows a photograph of the wafer (Figure 1a). Neither inclusions nor low-angle grain boundaries are observed on the wafer. It was shown that the structural integrality of as-grown crystals is high.
The room-temperature Raman spectra on the cross-section and the side face of the wafer are shown in Figure 4. The spectra have the same bands corresponding to the reported vibration of CaNb2O6 [31]. There were obvious changes in the relative intensity of some vibration peaks in Figure 4a (a-axis) and Figure 4b (perpendicular to a-axis). In Figure 4a, Raman modes of 383 (B2g) and 240 (Ag) cm−1 are the third and second intense peaks, and in Figure 4b, the peaks intensity of 383 (B2g) and 240 (Ag) cm−1 became weak, while the peaks of 291 (Ag) and 195 (Ag) cm−1 are the second and third intense peaks [32,33]. However, in the powder samples, the intensity of these four peaks were all strong peaks. This reflects the anisotropy of the lattice vibrations and follows the selection rules for Raman. Based on the Raman selection rule, by adjusting the polarization direction of the incident laser and the outgoing laser and interacting them with the crystal, different vibration modes of the crystal can be selectively excited. The Raman spectra were also measured at the beginning, middle, and end of the as-grown single crystal rod. All the Raman spectra are the same. It indicated that the crystal is uniform from the beginning to the end of the crystal rod.
Figure 5 gives the transmission and absorption spectra of the CaNb2O6 crystal at room-temperature. The as-grown CaNb2O6 crystal is transparent (up to 62%) in the visible to the infrared region (400–1000 nm) and has a low absorption coefficient (α~1.56 cm−1). In the ultraviolet region (<300 nm), the absorption is high, α increasing steeply to 21.7 cm−1.
To understand the interbond transitions type of semiconductors, the absorption coefficient α is known to be related to the incident photon energy hv by the expression [34]:
α h ν = A ( h ν E g ) 1 n
where A is a constant. Eg is the band-gap of the material and the exponent n depends on the type of transition. The exponent n can take values of 2, 1/2, 2/3, and 1/3 for the allowed direct, the allowed indirect, the forbidden direct, and the forbidden indirect, respectively [35].
In previous works, two types of transition, the direct and the indirect transitions, were reported for CaNb2O6. Yu-Jen Hsiao extrapolated that CaNb2O6 was a direct transition for their nanocrystalline samples [16], while In-Sun Cho suggested an indirect transition for CaNb2O6 bulk powder samples by fitting the absorption curve [9,17]. The band gap reported was from 3.04 to 3.93 eV [18,36]. According to the references, the size of the calculated band gap is 3.67 eV and the (calculated) kind of transition is indirect [9]. To identify the nature of the transition type, we fitted the measured absorption of the as-grown crystals with n = 2 and n = 1/2, as shown in Figure 6a,b. Analyzing the fitting curve of Figure 6a,b, the fitting curve effect is achieved when n = 2. This result suggests that the CaNb2O6 is a direct band gap semiconductor. Extrapolation of the linear region gives the direct band gap of 4.28 eV. It is noteworthy that the band gap of 4.28 eV is much higher than that of polycrystalline, nanocrystalline, and fiber samples reported, which is the intrinsic characteristic of CaNb2O6.
Up to now, there was no study about the optical parameters of CaNb2O6. Therefore, we derived the refractive index and extinction coefficient by the transmittance and absorption spectra. In the transparent region, the transmission (T) relates the absorption coefficient (α) and the reflectance R of the crystal through the relation:
T = (1 − R)2 exp (− αd)/{1 − R2exp (− αd)}
The thickness d is 1.38 mm. For optical transitions, the absorption coefficient is deemed to be zero in 350–1000 nm. In this case, Equation (2) reduces to T = 1 − R/1 + R, and the value of R can be derived, as shown in Figure 7a.
The extinction coefficient (K) and the refractive index (n) can be calculated by the relations [37,38]:
K = α λ 4 π ; R = ( n 1 ) 2 + K 2 ( n + 1 ) 2 + K 2
where λ is the wavelength. Using Equation (3), K (λ) and n (λ) are obtained. Figure 7b shows the wavelength versus n and K of the CaNb2O6 crystal in 270–1000 nm. It can be found that in the visible to the infrared region (410–1000 nm), the refractive index is deemed to be nearly unchanged (n: 2.33–2.13) and the extinction coefficient increases with the increasing wavelength, K: 0.70−1.24 × 10⁻⁵.
Figure 8 presents the room temperature excitation and emission spectra of the as-grown crystals. One strong and narrow excitation bond appears at 282 nm, and a strong blue emission band centered at 465 nm forms under 282 nm excitation. Previous works revealed that one emission peak is located at around 460 nm, and an excitation peak is found at around 260 nm [9,16,17,18]. The luminescence of CaNb2O6 strongly depends on its crystal structure [15,39,40]. In the columbite structure of CaNb2O6, Ca and Nb cations surrounded by six oxygen atoms form CaO6 and NbO6 octahedra, respectively [41,42]. NbO6 octahedra are always found edge-sharing with other NbO6 octahedra, whereas CaO6 octahedra share common edges and vertices amongst themselves. NbO6 octahedra chains and CaO6 octahedra chains are found in layers [010]. NbO6 octahedra are linked via edges and vertices with CaO6 octahedra forming an independent zigzag chain along the c-axis [41]. Here, the edge-shared NbO6 octahedra are efficient luminescent centers of blue emission, which may be ascribed to the recombination of self-trapped excitons [41,42]. The stronger blue emission centered at 465 nm and the stronger excitation peak at 282 nm are consistent with those described in other studies. The emission center of the as-grown crystals is slightly higher than that of these polycrystalline samples. This finding can be attributed to the absence of impurities and microstructural defects of the as-grown crystals. Furthermore, no impurities and defective energy levels are found in the bandgap.

4. Conclusions

CaNb2O6 single crystals are grown through the OFZ. The as-grown CaNb2O6 crystals have an orthorhombic columbite structure. They are colorless, transparent, and free of low-angle grain boundaries and inclusions. The measured transmission is up to 62% in the visible-to-infrared region (400–1000 nm), and the absorption coefficient of α = 1.56 is low. The band gap energy is 4.28 eV, which is higher than that in previous reports. The wavelength-dependent refractive index and extinction coefficient of the CaNb2O6 crystals are derived from the obtained T and α spectra. The PL spectra of the CaNb2O6 crystals have a strong blue emission band centered at 465 nm. It originates from the edge-shared niobate octahedral group [NbO6]7− causing a self-trapped excitation effect.

Author Contributions

The sample preparation and most of the experiment and Data curation, G.F.; Supervision, D.X.; Writing—original draft, L.L. All authors have read and agreed to the published version of the manuscript.

Funding

Project supported by the National Key Research and Development Program (No. 2017YFA0403704), the National Natural Science Foundation of China (Grant No. 11304113, 11474127, 11574112), Inner Mongolia Major Basic Research Open Project (Grant No. 0406091701) and the Fundamental Research Funds for the Central Universities are greatly appreciated.

Data Availability Statement

Not applicable.

Conflicts of Interest

The authors declare no conflict of interest.

References

  1. Johnson, J.C.; Yan, H.; Schaller, R.D.; Petersen, P.B.; Yang, P.; Saykally, R.J. Near-field imaging of nonlinear optical mixing in single zinc oxide nanowires. Nano Lett. 2002, 2, 279–283. [Google Scholar] [CrossRef]
  2. Xiao, H.-M.; Fu, S.-Y.; Zhu, L.-P.; Li, Y.-Q.; Yang, G. Controlled synthesis and characterization of CuO nanostructures through a facile hydrothermal route in the presence of sodium citrate. Eur. J. Inorg. Chem. 2007, 1966–1971. [Google Scholar] [CrossRef]
  3. Yucai, H.J. Hydrothermal Synthesis of Nano Ce-Zr-Y Oxide Solid Solution for Automotive Three-Way Catalyst. Am. Ceram. Soc. 2006, 89, 2949. [Google Scholar] [CrossRef]
  4. Cao, A.M.; Hu, J.S.; Liang, H.P.; Wan, L.J. Self-Assembled Vanadium Pentoxide (V2O5) Hollow Microspheres from Nanorods and Their Application in Lithium-Ion Batteries. Angew. Chem. Int. Ed. 2005, 44, 4391–4395. [Google Scholar] [CrossRef]
  5. Rosi, N.L.; Mirkin, C.A. Nanostructures in Biodiagnostics. Chem. Rev. 2005, 105, 1547. [Google Scholar] [CrossRef] [PubMed]
  6. Favier, F.; Walter, E.C.; Zach, M.P.; Benter, T.; Penner, R.M. Hydrogen sensors and switches from electrodeposited palladium mesowire arrays. Science 2001, 293, 2227–2231. [Google Scholar] [CrossRef] [PubMed]
  7. Hoffmann, M.R.; Martin, S.T.; Choi, W.; Bahnemann, D.W. Environmental applications of semiconductor photocatalysis. Chem. Rev. 1995, 9, 69–96. [Google Scholar] [CrossRef]
  8. Wu, T.; Lin, T.; Zhao, J.; Hidaka, H.; Serpone, N. TiO2-assisted photodegradation of dyes. 9. Photooxidation of a squarylium cyanine dye in aqueous dispersions under visible light irradiation. Environ. Sci. Technol. 1999, 33, 1379. [Google Scholar] [CrossRef]
  9. Cho, I.S.; Bae, S.T.; Yim, D.K.; Kim, D.W.; Hong, K.S. Preparation, characterization, and photocatalytic properties of CaNb2O6 nanoparticles. J. Am. Ceram. Soc. 2009, 92, 506–510. [Google Scholar] [CrossRef]
  10. Miseki, Y.; Kato, H.; Kudo, A. Water splitting into H2 and O2 over Ba5Nb4O15 photocatalysts with layered perovskite structure prepared by polymerizable complex method. Chem. Lett. 2006, 35, 1052–1053. [Google Scholar] [CrossRef]
  11. Maeda, K.; Eguchi, M.; Youngblood, W.J.; Mallouk, T.E. Niobium oxide nanoscrolls as building blocks for dye-sensitized hydrogen production from water under visible light irradiation. Chem. Mater. 2008, 20, 6770–6778. [Google Scholar] [CrossRef]
  12. Zou, Z.G.; Arakawa, H. Direct water splitting into H2 and O2 under visible light irradiation with a new series of mixed oxide semiconductor photocatalysts. J. Photochem. Photobiol. A Chem. 2013, 158, 145. [Google Scholar] [CrossRef]
  13. Yoshino, M.; Kakihana, M. Polymerizable Complex Synthesis of Pure Sr2NbxTa2-xO7 Solid Solutions with High Photocatalytic Activities for Water Decomposition into H2 and O2. Chem. Mater. 2020, 14, 3369–3376. [Google Scholar] [CrossRef]
  14. Hsiaoa, Y.J.; Liu, C.W.; Daia, B.T.; Chang, Y.H. Sol–gel synthesis and the luminescent properties of CaNb2O6 phosphor powders. J. Alloys Compd. 2009, 475, 698–701. [Google Scholar] [CrossRef]
  15. Zhou, Y.Y.; Qiu, Z.F.; Lu, M.K.; Ma, Q.; Zhang, A.Y.; Zhou, G.J.; Zhang, H.P.; Yang, Z.S. Photoluminescence characteristics of pure and Dy-doped ZnNb2O6 nanoparticles prepared by a combustion method. J. Phys. Chem. C 2007, 111, 10190–10193. [Google Scholar] [CrossRef]
  16. Cho, I.-S.; Kim, D.W.; Cho, C.M.; An, J.-S.; Roh, H.-S.; Hong, K.S. Synthesis, characterization and photocatalytic properties of CaNb2O6 with ellipsoid-like plate morphology. Solid Stat. Sci. 2010, 12, 982–988. [Google Scholar] [CrossRef]
  17. Cho, I.-S.; Bae, S.T.; Kim, D.H.; Hong, K.S. Effects of crystal and electronic structures of ANb2O6 (A=Ca, Sr, Ba) metaniobate compounds on their photocatalytic H2 evolution from pure water. Inter. J. Hyd. Energy 2010, 35, 12954. [Google Scholar] [CrossRef]
  18. Emmenegger, P. Preparation of single crystals of CaNb2O6 by chemical transport. J. Cryst. Growth 1968, 2, 109–110. [Google Scholar] [CrossRef]
  19. Oishi, S.; Nagai, Y.; Ishizawa, N. Flux Growth of CaNb2O6 Crystals. Nippon Kagaku Kaishi 1998, 9, 598. [Google Scholar] [CrossRef] [Green Version]
  20. Silva, R.d.; de Camargo, A.S.S.; Cusatis, C.; Nunes, L.A.O.; Andreeta, J.P. Growth and characterization of columbite CaNb2O6 high quality single crystal fiber. J. Cry Grow. 2004, 262, 246–250. [Google Scholar] [CrossRef]
  21. Pless, J.D.; Erdman, N.; Ko, D.; Marks, L.D.; Stair, P.C.; Poeppelmeier, K.R. Single-crystal growth of magnesium orthovanadate, Mg3(VO4)2, by the optical floating zone technique. Cryst. Growth Des. 2003, 3, 615–619. [Google Scholar] [CrossRef]
  22. Majchrowski, A.; Swirkowicz, M.; Jaroszewicz, L.; Piasecki, M.; Kityk, I.V.; Brik, M.G. Crystal growth and spectroscopic studies of novel Yb-doped K5Nd (MoO4)4 single crystals. Mater. Lett. 2010, 64, 2363–2365. [Google Scholar] [CrossRef]
  23. Otani, S.; Aizawa, T. Floating-zone growth of CrB2 single crystals. J. Alloys Compd. 2008, 454, 147–149. [Google Scholar] [CrossRef]
  24. Prabhakaran, D.; Wondre, F.R.; Boothroyd, A.T. Preparation of large single crystals of ANb2O6 (A= Ni, Co, Fe, Mn) by the floating-zone method. J. Cryst. Growth 2003, 250, 72–76. [Google Scholar] [CrossRef]
  25. Li, L.; Yang, H.; Wang, D.; Feng, G.; Li, B.; Gao, Z.; Xu, D.; Ding, Z.; Liu, X. Large-size and high-quality Zn2TiO4 single crystal grown by the optical floating zone method. J. Cryst. Growth 2010, 312, 3561. [Google Scholar] [CrossRef]
  26. Islam, A.T.M.N.; Pieper, O.; Lake, B.; Siemensmeyer, K. Optical Floating-Zone Growth of Large Single Crystal of Spin Half Dimer Sr3Cr2O8. Cryst. Growth Des. 2010, 10, 465. [Google Scholar] [CrossRef]
  27. Yu, P.; Wu, A.; Su, L.; Guo, X.; Wang, Y.; Zhao, H.; Yang, Y.; Yang, Q.; Xu, J. Crystal growth and spectroscopic properties of MoO3 and WO3 doped Bi4Ge3O12 by optical floating zone method. J. Alloy. Compd. 2010, 503, 380–383. [Google Scholar] [CrossRef]
  28. Feng, H.; Ding, D.; Li, H.; Lu, S.; Pan, S.; Chen, X.; Ren, G. Growth and luminescence characteristics of cerium-doped yttrium pyrosilicate single crystal. J. Alloy. Compd. 2010, 489, 645–649. [Google Scholar] [CrossRef]
  29. Phan, M.H.; Franco, V.; Bingham, N.S.; Srikanth, H.; Hur, N.H.; Yu, S.C. Tricritical point and critical exponents of La0.7Ca0.3-xSrxMnO3 (x = 0, 0.05, 0.1, 0.2, 0.25) single crystals. J. Alloy. Compd. 2010, 508, 238–244. [Google Scholar] [CrossRef]
  30. Rudajevová, A.; Pospísil, J. Influence of anisotropy, the latent heat and the thermal history of alloy on martensitic transformation strain in Ni3Ta single crystal. J. Alloy. Compd. 2011, 509, 5500–5505. [Google Scholar] [CrossRef]
  31. Husson, E.; Dao, N.Q. Etude du Spectre Raman Polarise du Niobate de Calcium. C. R. Acad. Sci. C 1974, 279, 141. [Google Scholar]
  32. Husson, E.; Repelin, Y.; Dao, N.Q.; Brusset, H. Etude par spectrophotométries d’absorption infrarouge et de diffusion Raman des niobates de structure columbite. Spectrochim. Acta A 1977, 33, 995–1001. [Google Scholar] [CrossRef]
  33. Husson, E.; Repelin, Y.; Dao, N.Q.; Brusset, H. Normal coordinate analysis for CaNb2O6 of columbite structure. J. Chem. Phys. 1997, 66, 5173–5180. [Google Scholar] [CrossRef]
  34. Javed, A.; Hidetoshi, M.; Sher, A.; Jianding, Y.; Yasutomo, A.; Hiromoto, U. Optical Transmittance and Band Gap of Ferroelectric BaTi2O5 Bulk Glass. Chin Phys. Lett. 2008, 25, 4421. [Google Scholar]
  35. El-Korashy, A.; Abu El-Fadl, A. Temperature dependence of the optical band gap of nearly perfect K2ZnCl4 single crystals in the ferroelectric phase. Phys. B 1999, 271, 205. [Google Scholar] [CrossRef]
  36. Zhang, Y.; Liu, C.; Pang, G.; Jiao, S.; Zhu, S.; Wang, D.; Liang, D.; Feng, S. Hydrothermal Synthesis of a CaNb2O6 Hierarchical Micro/Nanostructure and Its Enhanced Photocatalytic Activity. Eur. J. Inorg. Chem. 2010, 2010, 1275. [Google Scholar] [CrossRef]
  37. Zhu, J.; Zhao, S.; Xiao, D.; Wang, X.; Xu, G. Optical absorption properties of doped lithium niobate crystals. J. Phys. Condens. Matter. 1992, 4, 2977. [Google Scholar]
  38. Matsumoto, Y.; Omae, M.; Watanabe, I.; Sato, E.I. Photoelectrochemical properties of the Zn-Ti-Fe spinel oxides. J. Electrochem. Soc. 1986, 133, 711. [Google Scholar] [CrossRef]
  39. Blasse, G. The luminescence of closed-shell transition-metal complexes. New developments. Struct. Bond 1980, 42, 1. [Google Scholar]
  40. Cao, J.; Ji, Y.; Li, J.; Zhu, Z.; You, Y.W.Z.; Tu, C. Crystal growth, Judd–Ofelt analysis and fluorescence properties of Tm3+: CaNb2O6 crystal. J. Lumin. 2011, 131, 1350–1354. [Google Scholar] [CrossRef]
  41. Li, L.; Feng, G.; Wang, D.; Yang, H.; Gao, Z.; Li, B.; Xu, D.; Ding, Z.; Liu, X. Optical floating zone method growth and photoluminescence property of MgNb2O6 crystal. J. Alloy. Compd. 2011, 509, L263–L266. [Google Scholar] [CrossRef]
  42. Srivastava, A.M.; Ackerman, J.F.; Beers, W.W. On the luminescence of Ba5M4O15 (M= Ta5+, Nb5+). J. Solid State Chem. 1997, 134, 187–191. [Google Scholar] [CrossRef]
Figure 1. Photographs of (a) a wafer cut perpendicular to the growth direction and (b) the wafer under polarizing microscope in the transmission configuration.
Crystals 11 00928 g001
Figure 2. Powder XRD pattern of a fraction of the crystal.
Crystals 11 00928 g002
Figure 3. XRD2 patterns of the wafer.
Crystals 11 00928 g003
Figure 4. (a) Raman spectra on the cross-section and (b) the side face of the wafer.
Crystals 11 00928 g004
Figure 5. The measured transmission and absorption spectra of the CaNb2O6 crystal at room temperature.
Crystals 11 00928 g005
Figure 6. (a) The variations in (αhν)2 vs. photon energy () and (b) (αhν)1/2 vs. photon energy for the as-grown CaNb2O6 crystal.
Crystals 11 00928 g006
Figure 7. (a) The derived reflectance index of the as-grown crystal, and (b) graphical variations of the refractive index and extinction coefficient as a function of the incident wavelength for the as-grown CaNb2O6 crystal.
Crystals 11 00928 g007
Figure 8. The room temperature excitation spectra with λem = 465 nm and emission spectra of CaNb2O6 crystal with λex = 282 nm.
Crystals 11 00928 g008
Table 1. Structure information from structure refined results.
SampleCaNb2O6
Space groupPbcn
a (Å)14.9861
b (Å)5.7482
c (Å)5.2253
Volume (Å3)450.130
Density (g/cm3)4.709
Rp0.0430
Rwp0.0566
X26.644
Publisher’s Note: MDPI stays neutral with regard to jurisdictional claims in published maps and institutional affiliations.

