Article

Experimental Analysis of Changes in Cement Mortar Containing Oil Palm Boiler Clinker Waste at Elevated Temperatures in Different Cooling Conditions

by
Muhammad Firdaus Anuar
1,2,
Payam Shafigh
1,
Azman Ma’amor
3,
Sumra Yousuf
4 and
Farid Wajdi Akashah
1,2,*
1
Centre for Building, Construction & Tropical Architecture, Faculty of Built Environment, Universiti Malaya, Kuala Lumpur 50603, Malaysia
2
Department of Building Surveying, Faculty of Built Environment, Universiti Malaya, Kuala Lumpur 50603, Malaysia
3
Chemistry Department, Faculty of Science, Universiti Malaya, Kuala Lumpur 50603, Malaysia
4
Department of Building and Architectural Engineering, Faculty of Engineering & Technology, Bahauddin Zakariya University, Multan 60000, Pakistan
*
Author to whom correspondence should be addressed.
Crystals 2021, 11(8), 988; https://doi.org/10.3390/cryst11080988
Submission received: 30 June 2021 / Revised: 11 August 2021 / Accepted: 16 August 2021 / Published: 20 August 2021

Abstract

:
Changes in cement-based materials containing waste after exposure to elevated temperatures are an important aspect that should be studied in developing sustainable construction materials. Modified cement-based materials obtained using the industrial waste present robust engineering properties can lead to sustainable development. This work evaluated the capacity of oil palm boiler clinker (OPBC) waste that had been produced during the palm oil extraction process as partial and full substitutions for natural sand to produce cement mortar. The mortar materials were cured under three different curing conditions and were then tested at a room temperature of approximately 27 °C and elevated temperatures of 200 °C to 1000 °C using an electric furnace. The specimens were maintained in the electric furnace under maximum temperatures for 2 h and were then cooled down with water or under ambient temperature. The changes in the forms of colour, weight, compressive strength, microstructure, mineralogical composition, and thermal conductivity were investigated. Test results showed that the compressive strength of OPBC mortars was generally higher than the strength of the control mortar after heat exposure. Water cooling exerted less damage to samples compared to air cooling. The results from field emission scanning electron microscopy–energy-dispersive X-ray spectroscopy demonstrated that the mineral composition varied at different temperatures. In conclusion, this work provides an extensive report and can be used as a guide in utilising OPBC as cementitious materials for future cement-based applications.

1. Introduction

Recently, the demands for and the advantages of sustainable manufacturing have propelled the incorporation of waste into newly recognised cement-based applications. This production approach for new cement-based materials provides greener and environmentally friendly alternatives and is a cost-effective manufacturing process [1]. In the past few years, has been widely proven that the utilisation of recycled waste materials to replace traditional synthetic primary components has solved the problem of waste material disposal and has economised these waste resources. The benefits of incorporating even only some parts of recycled waste materials into the production of construction materials are tremendous [2,3,4,5]. The rapid rise in urbanisation and construction projects has led to the excessive consumption of river sands as materials for building purposes, which consequently causes detrimental environmental impacts on rivers. The sand mining activities on rivers contribute to direct or indirect impacts, such as the destruction of floodplain habitats, followed ecosystem and physical changes and water pollution [6]. Therefore, river sand acting as aggregate in cement-based materials should be replaced by developing alternative materials.
Oil palm boiler clinker (OPBC) is a waste material produced from palm oil mills. Palm oil mills produce substantial waste, such as fibres, nutshells, and empty fruit bunches, from the incineration process used for oil extraction. Such waste may contribute to environmental problems, especially when they are not dumped and managed properly. In Malaysia, the palm oil industry is well known as the second largest in the entire world, after Indonesia. Thus, this industry is important given the economic contribution obtained through palm oil exports [7]. In Malaysia alone, approximately 4 million tonnes of this waste is produced annually [8]. Interestingly, OPBC waste exists as a stone-like material after the burning process to generate electricity in palm oil mills. In most studies, OPBC was crushed and sieved into smaller sizes to be used as a substitute aggregate in cement-based materials [9,10,11]. OPBC is lightweight [12,13] and porous [14] and has an irregular flaky shape [15] and a low thermal conductive property [16]; thus, it has great capability and potential to be developed as an alternative material to support the construction industry. The use of OPBC waste as a replacement for sand in cement-based materials would reduce the dependency on the natural sand obtained from river beds.
High temperature is a well-known risk for cement-based materials because the cement that is used can become unstable due to the dehydration process that occurs at a high temperature. Dehydrated cement can lead to the deterioration of buildings and could harm structures [17,18,19]. Immense work in the literature performed on OPBC concrete or mortar have usually only focused on its strength [9,12,20,21,22,23]. Other influencing variables, such as curing regime [24], replacement percentage [25,26], and cooling type after temperature exposure, can be analysed instead of only targeting the compressive strength of cement-based materials under high-temperature exposure [27,28,29]. Extensive investigation has been conducted to study the microstructure of cementitious composites after high-temperature exposure [30,31]. The factors that cause the deterioration of cement-based materials exposed to high temperatures include the physicochemical changes in cement paste and aggregate and the thermal incompatibility between them [32]. Choosing the appropriate materials, especially aggregates, is one of the most important factors in producing a strong temperature-resistant bond with cement paste at a high temperature to minimise the harmful effect of the temperature [33,34,35,36].
Although many studies have been performed to propose OPBC as an alternative for natural aggregates in cement-based applications, the potential of utilising OPBC waste as a fine aggregate in cement-based materials when exposed to elevated temperatures is seldom focused on and has not been thoroughly explored. Given that OPBC is a residue of burning palm oil waste in a temperature up to 800 °C [37,38], due to the high degree of burning, using this waste as aggregate in the production of construction materials, i.e., for plastering purposes, can lead to fire-resistive construction materials to ensure that a building is safe from fire accidents. Therefore, this study aims to evaluate the changes in cement mortars containing OPBC as fine aggregate under different elevated temperatures and cooling scenarios in comparison with ambient temperature. In addition, a highly sophisticated field emission scanning electron microscope (FESEM) and an energy-dispersive X-ray spectroscope (EDX or EDS) were used to investigate the morphological changes of the raw materials before and after exposure to elevated temperatures.

2. Materials and Methods

2.1. Materials

Chemical admixtures, including superplasticiser (SP), ordinary Portland cement (OPC), fine OPBC aggregates, natural sand, and tap water, were used in this study. Some properties of these materials are shown as follows:
Cement: Type I Portland cement, in accordance with MS522 Part 1:2003 [39], was used as a binder. The physical and chemical properties of the cement are presented in Table 1 and Table 2, respectively.
Aggregates: The OPBC and natural sand were used as fine aggregates. The aggregate grading is shown in Table 3 in comparison with the BS 882:1992 [40] requirements. The specific gravity of the natural sand and OPBC aggregate was 2.64 and 1.96, respectively. Therefore, the OPBC aggregate can be considered a lightweight aggregate compared to natural sand. Photos of the natural sand and OPBC aggregates are shown in Figure 1.
Chemical admixture: KAO Mighty 150 was used as SP for the mortar mixture to achieve a good mortar mixture flow.

2.2. Mortar Mixtures and Sample Preparation

All of the mortars had a cement-to-aggregate ratio of 1:3, and the water-to-cement ratio was set to 0.5. In the control mix with 100% natural sand, the sand was substituted with different percentages of OPBC aggregates between 0 and 100% at intervals of 25%. Owing to the differences in specific gravity of the two types of fine aggregates, the aggregate replacement was based on volume. Table 4 shows the mix proportions of all of the mortar mixtures.
Fine aggregates were added and mixed for approximately 5 min in a drum mixer. Cement was then added to the mixer and was mixed for another 5 min. Finally, water was slowly added to the drum mixer followed by the addition of SP. The flow table test was conducted during the 5-min intervals during the mixing processes. A 50 mm × 50 mm × 50 mm mould was filled with the prepared mortar in two layers. Each layer was vibrated on a vibration table. After 24 h, the mould was opened, and the samples were kept in three different curing conditions, i.e., full water (FW-C), partial water (PW-C), and air curing (A-C) conditions, as shown in Table 5. The room temperature and humidity were measured to be within 25 ± 3 °C and 65 ± 5%, respectively. After 28 days of curing, a compressive strength test was conducted using an ELE universal compressive strength testing machine with a load rate of 0.50 kN/s and a load limit of 2500 kN.

2.3. Heating Pattern

Approximately 120 samples that had been cured under different conditions were dried at 50 °C for 24 h before they were further exposed to the heating temperatures of 200 °C, 400 °C, 600 °C, 800 °C, and 1000 °C. A total of twelve samples were stored under standard room temperature as controls and for comparison purposes (four samples for each curing type). An NABER N200 model electrically heated furnace was used to heat the samples. The heated samples were sustained in the furnace for 2 h under each temperature condition to test the thermal stability. The heating rate of the furnace was selected as 5.0 °C/min, and the precision was set to ±4.5 °C.
After these samples were heated at the respective targeted temperatures, the furnace was turned off, and the samples were taken out for cooling. Then, half of the samples were allowed to cool naturally at ambient temperature, whilst the rest were cooled by running water until the ambient temperature was reached. Upon completion, the samples were placed into Ziploc bags.

2.4. Test of the Compressive Strength of Hardened Mortars

The compressive strength test results of the four 50 mm cube specimens were used to measure the average value of each mix. The tests on five different mortar batches were conducted using an ELE testing machine at a loading rate of 0.5 kN/s and a load of 2500 kN.

2.5. Microstructural Property Determination

Microstructural investigations were performed using a FESEM coupled with an EDX (FESEM–EDX). The FESEM–EDX analyses were conducted on the heated and unheated samples.

2.5.1. Microstructural Investigation

The microstructural, physical, textural, and morphological investigations were conducted by observing the captured images of the cement, sand, and OPBC aggregates. The microstructural analysis was performed on the powdered cement, sand, and OPBC aggregate samples that had been heated at the temperatures of 600 °C and 1000 °C. The samples under room temperature and without any heating were used for comparison. Changes in the microstructure of the samples were observed using an SU8000 FESEM (Hitachi, Tokyo, Japan) operated at an accelerating voltage of approximately 3 kV.

2.5.2. Mineral Composition Determination

The mineral composition distribution on specific scales was performed using EDX (Hitachi, Tokyo, Japan) on the powdered cement, sand, and OPBC aggregate samples heated at the temperatures of 600 °C and 1000 °C. The mineral compositions of these heated samples were compared to those of the unheated samples. The EDX analysis data were obtained at an accelerating voltage of 20 kV and a scan time of 60 s [41].

2.6. Thermal Conductivity Determination

The thermal conductivity of five different mortar mixes was measured using a KD2-PRO analyser (Decagon Device Inc., Pullman, WA, USA) and a TR1 needle. A total of two 200 mm × 100 mm cylinder samples were used to measure the k-value of the samples, and the average k-value was recorded. The k-value readings for all of the samples were taken at 15-min intervals to minimise error rates.

3. Results and Discussion

3.1. Consistency of Fresh Mix (Flow Table Test)

Figure 2 shows the flow test results of all of the mortar mixes. Although the SP dosage was higher in the mortar mixes with the OPBC aggregates, their flow value was less than that of the control mix (M1). Substantial SP was used in the OPBC mortar mixes because the OPBC aggregates were lightweight (the specific gravity of the OPBC aggregates was 1.96 and 1.89 kg/m3 in apparent and saturated surface dry conditions, respectively) with higher water absorption capacity than natural sand and porosities on the surface texture. Therefore, when the replacement level was increased, the flowability was decreased. To maintain mortar mixtures with good workability for all mixtures (a workability of approximately 125 ± 15 mm), more SP was used when the replacement level was increased. In the OPBC replacement levels of 25%, 50%, 75% and 100%, the flow values decreased by approximately 1.4%, 2.2%, 12.2%, and 19.4%, respectively, compared to those of the control mix. On the basis of the results, similar findings to those of prior studies conducted by other researchers were reached, i.e., the water absorption increased, and the workability of the OPBC mortar decreased compared to normal cement mortar [42,43].

3.2. Colour Changes

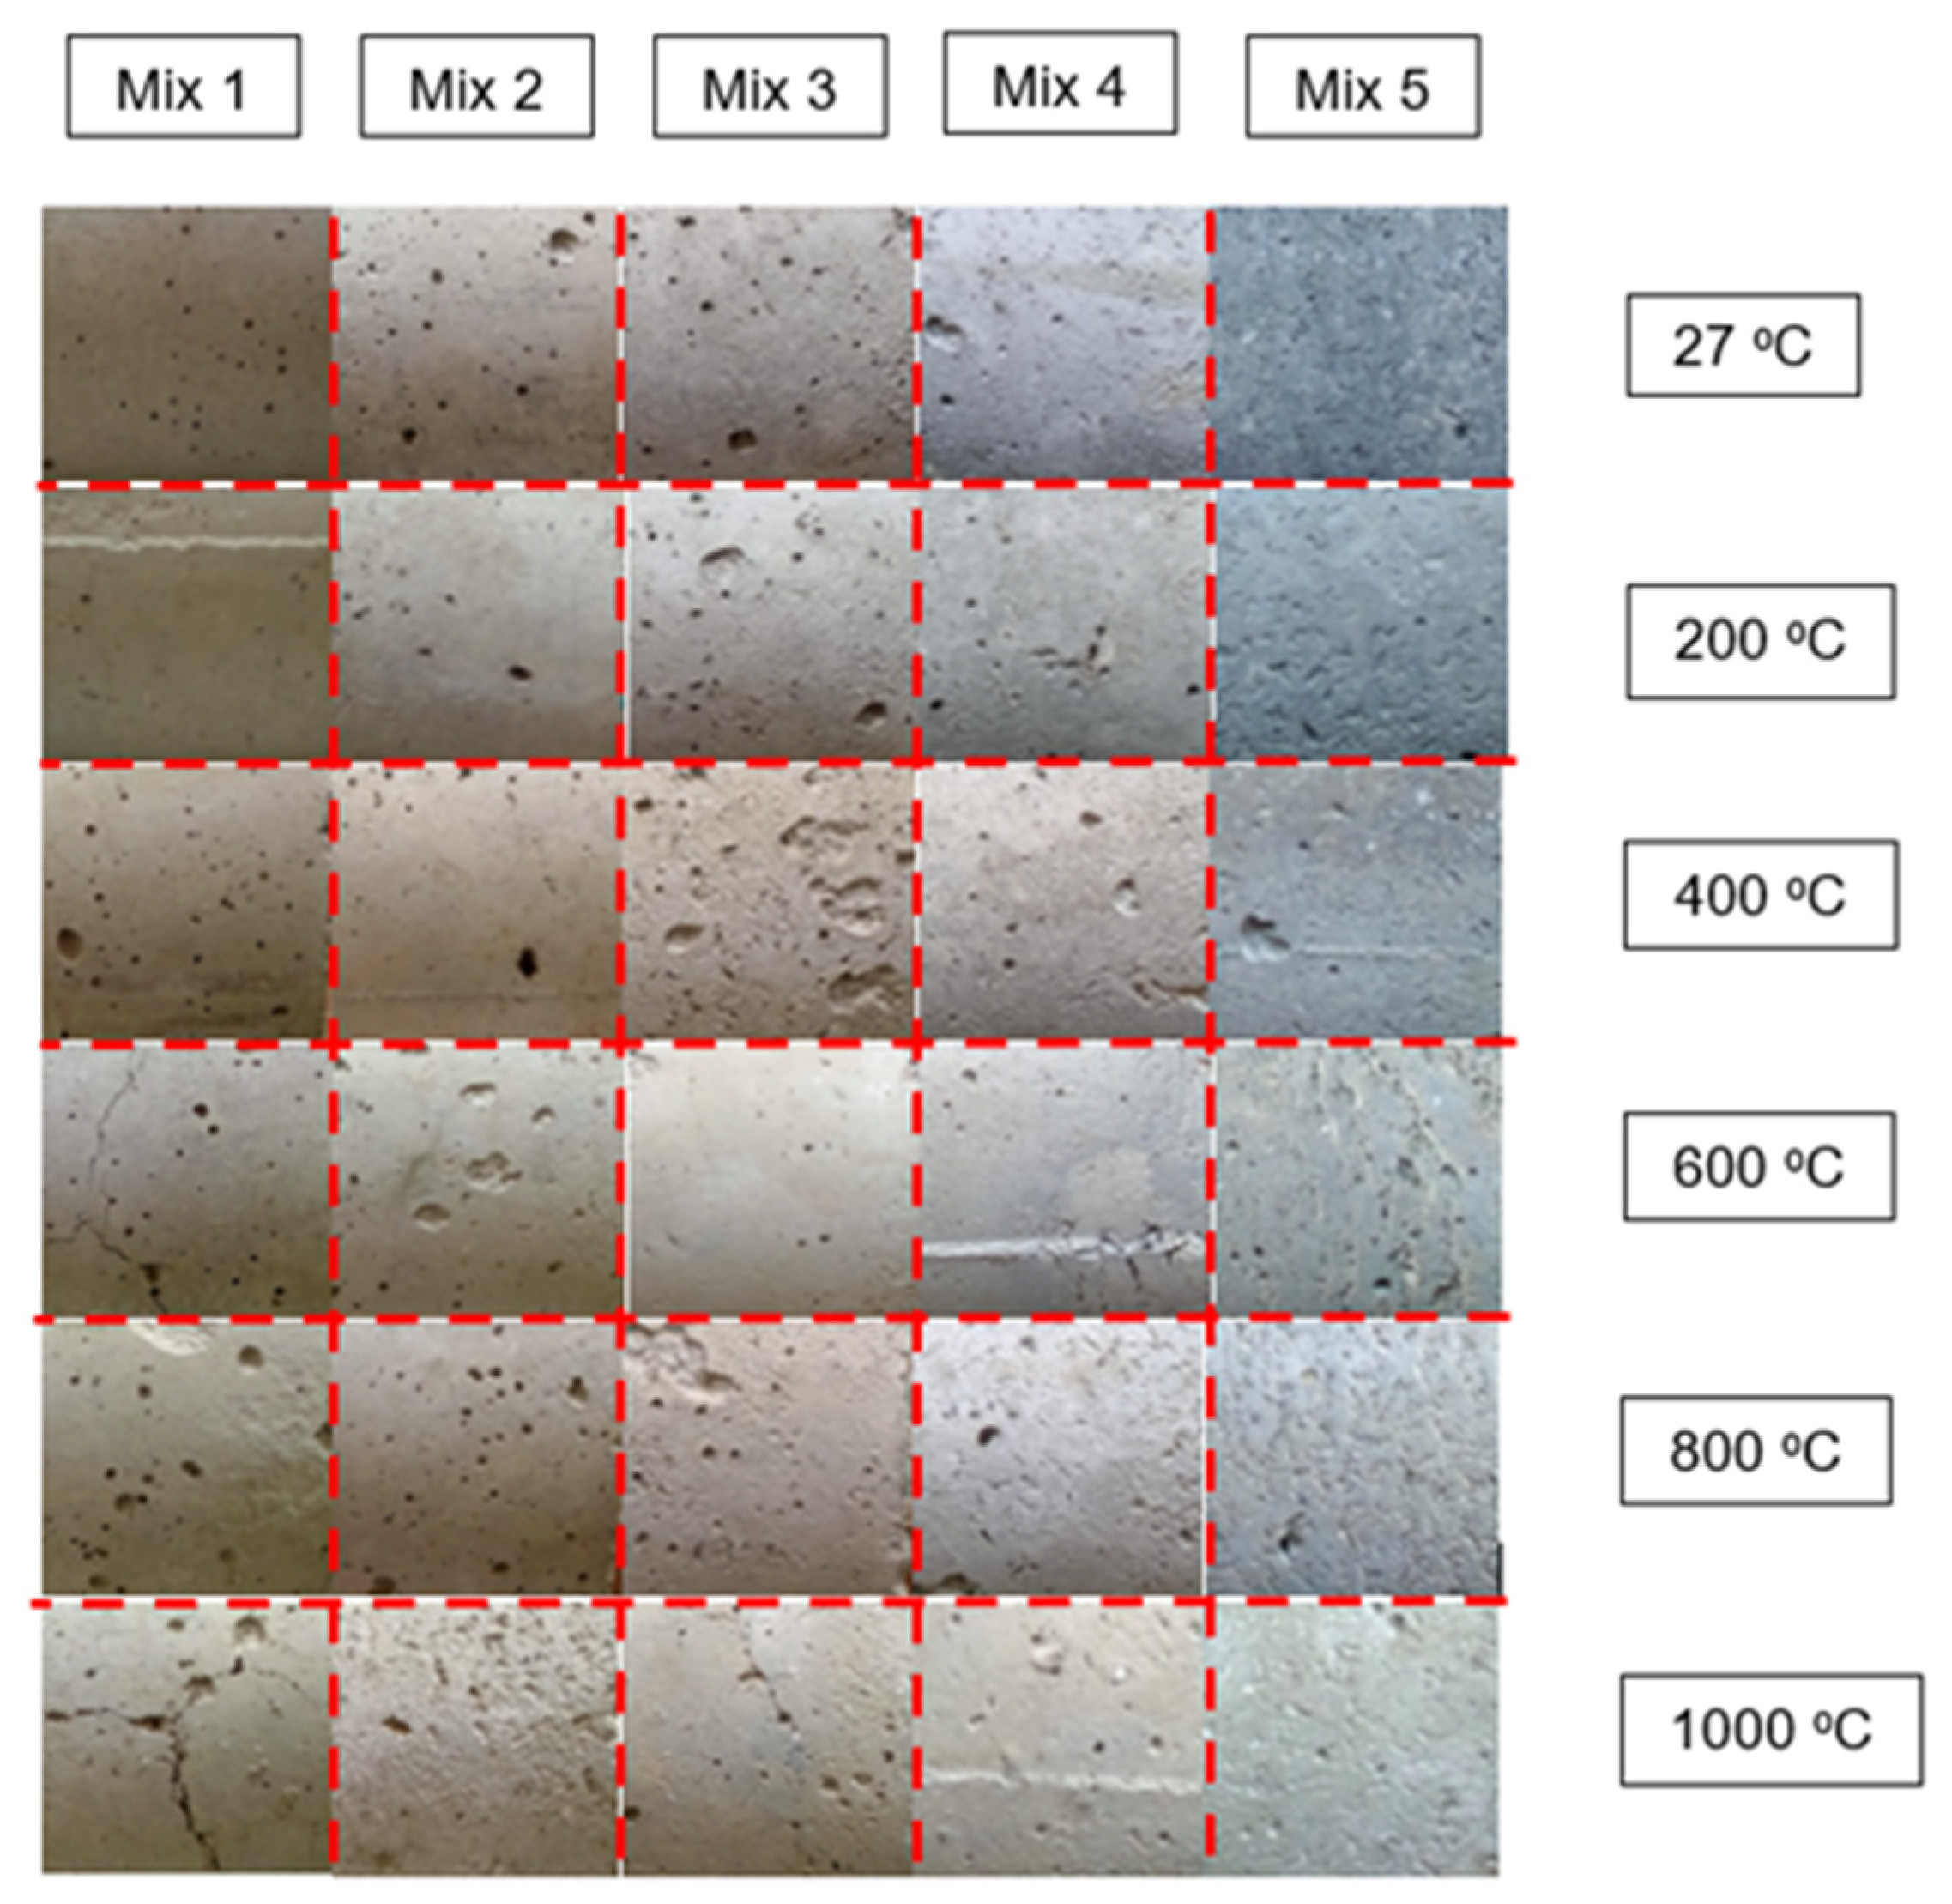
As shown in Figure 3, the colour of the samples changed as the temperature increased. The changes in the surface colour of the mortar samples after heating at different temperatures were probably due to the moisture and material reactions. From this observation, as the OPBC aggregate content increased in the control mortar, a darker the colour of the hardened sample was observed before heating. The heating of the samples at a temperature of up to 1000 °C with an interval of 200 °C resulted in higher lightness contrast in comparison with that of the samples at ambient temperature. This observation indicated that the colour of the samples did not fade at 200 °C, possibly due to the transport of liquid and vapor water in the samples during the cooling process. The samples gained moisture content through capillary absorption at low temperatures [44,45,46]. The colour of the samples started to change when they were subjected to the temperature of 400 °C. The samples heated at this temperature were clearly visible and reflected the first phase of dehydration. When the materials reached the temperature of 600 °C, the colour was smooth and continuously faded, especially for the OPBC mortar samples.
Generally, light pink colouration was observed on the surface of the samples with 100% natural sand aggregate when heated to above 600 °C, whereas the samples with 100% OPBC aggregate did not show any colour changes to pink. The sand aggregate started to experience a material reaction and subsequently caused pressure and chemical structure changes [47,48]. After the heat exposure to 600 °C, the natural sand material became light pink in colour. A similar colour change was observed in the mortars (M1–M4) containing natural sand aggregate. The visual determination of surface colour for M5 containing 100% OPBC aggregate showed a colour change from dark grey to light grey when heated from the ambient temperature to 1000 °C. Slight changes and differences in the lightness of the grey colouration were observed as the temperature increased. However, at the temperature between 600 °C and 800 °C, minimal colour change differences were determined. Therefore, the mortar samples began undergoing colour changes at 600 °C.
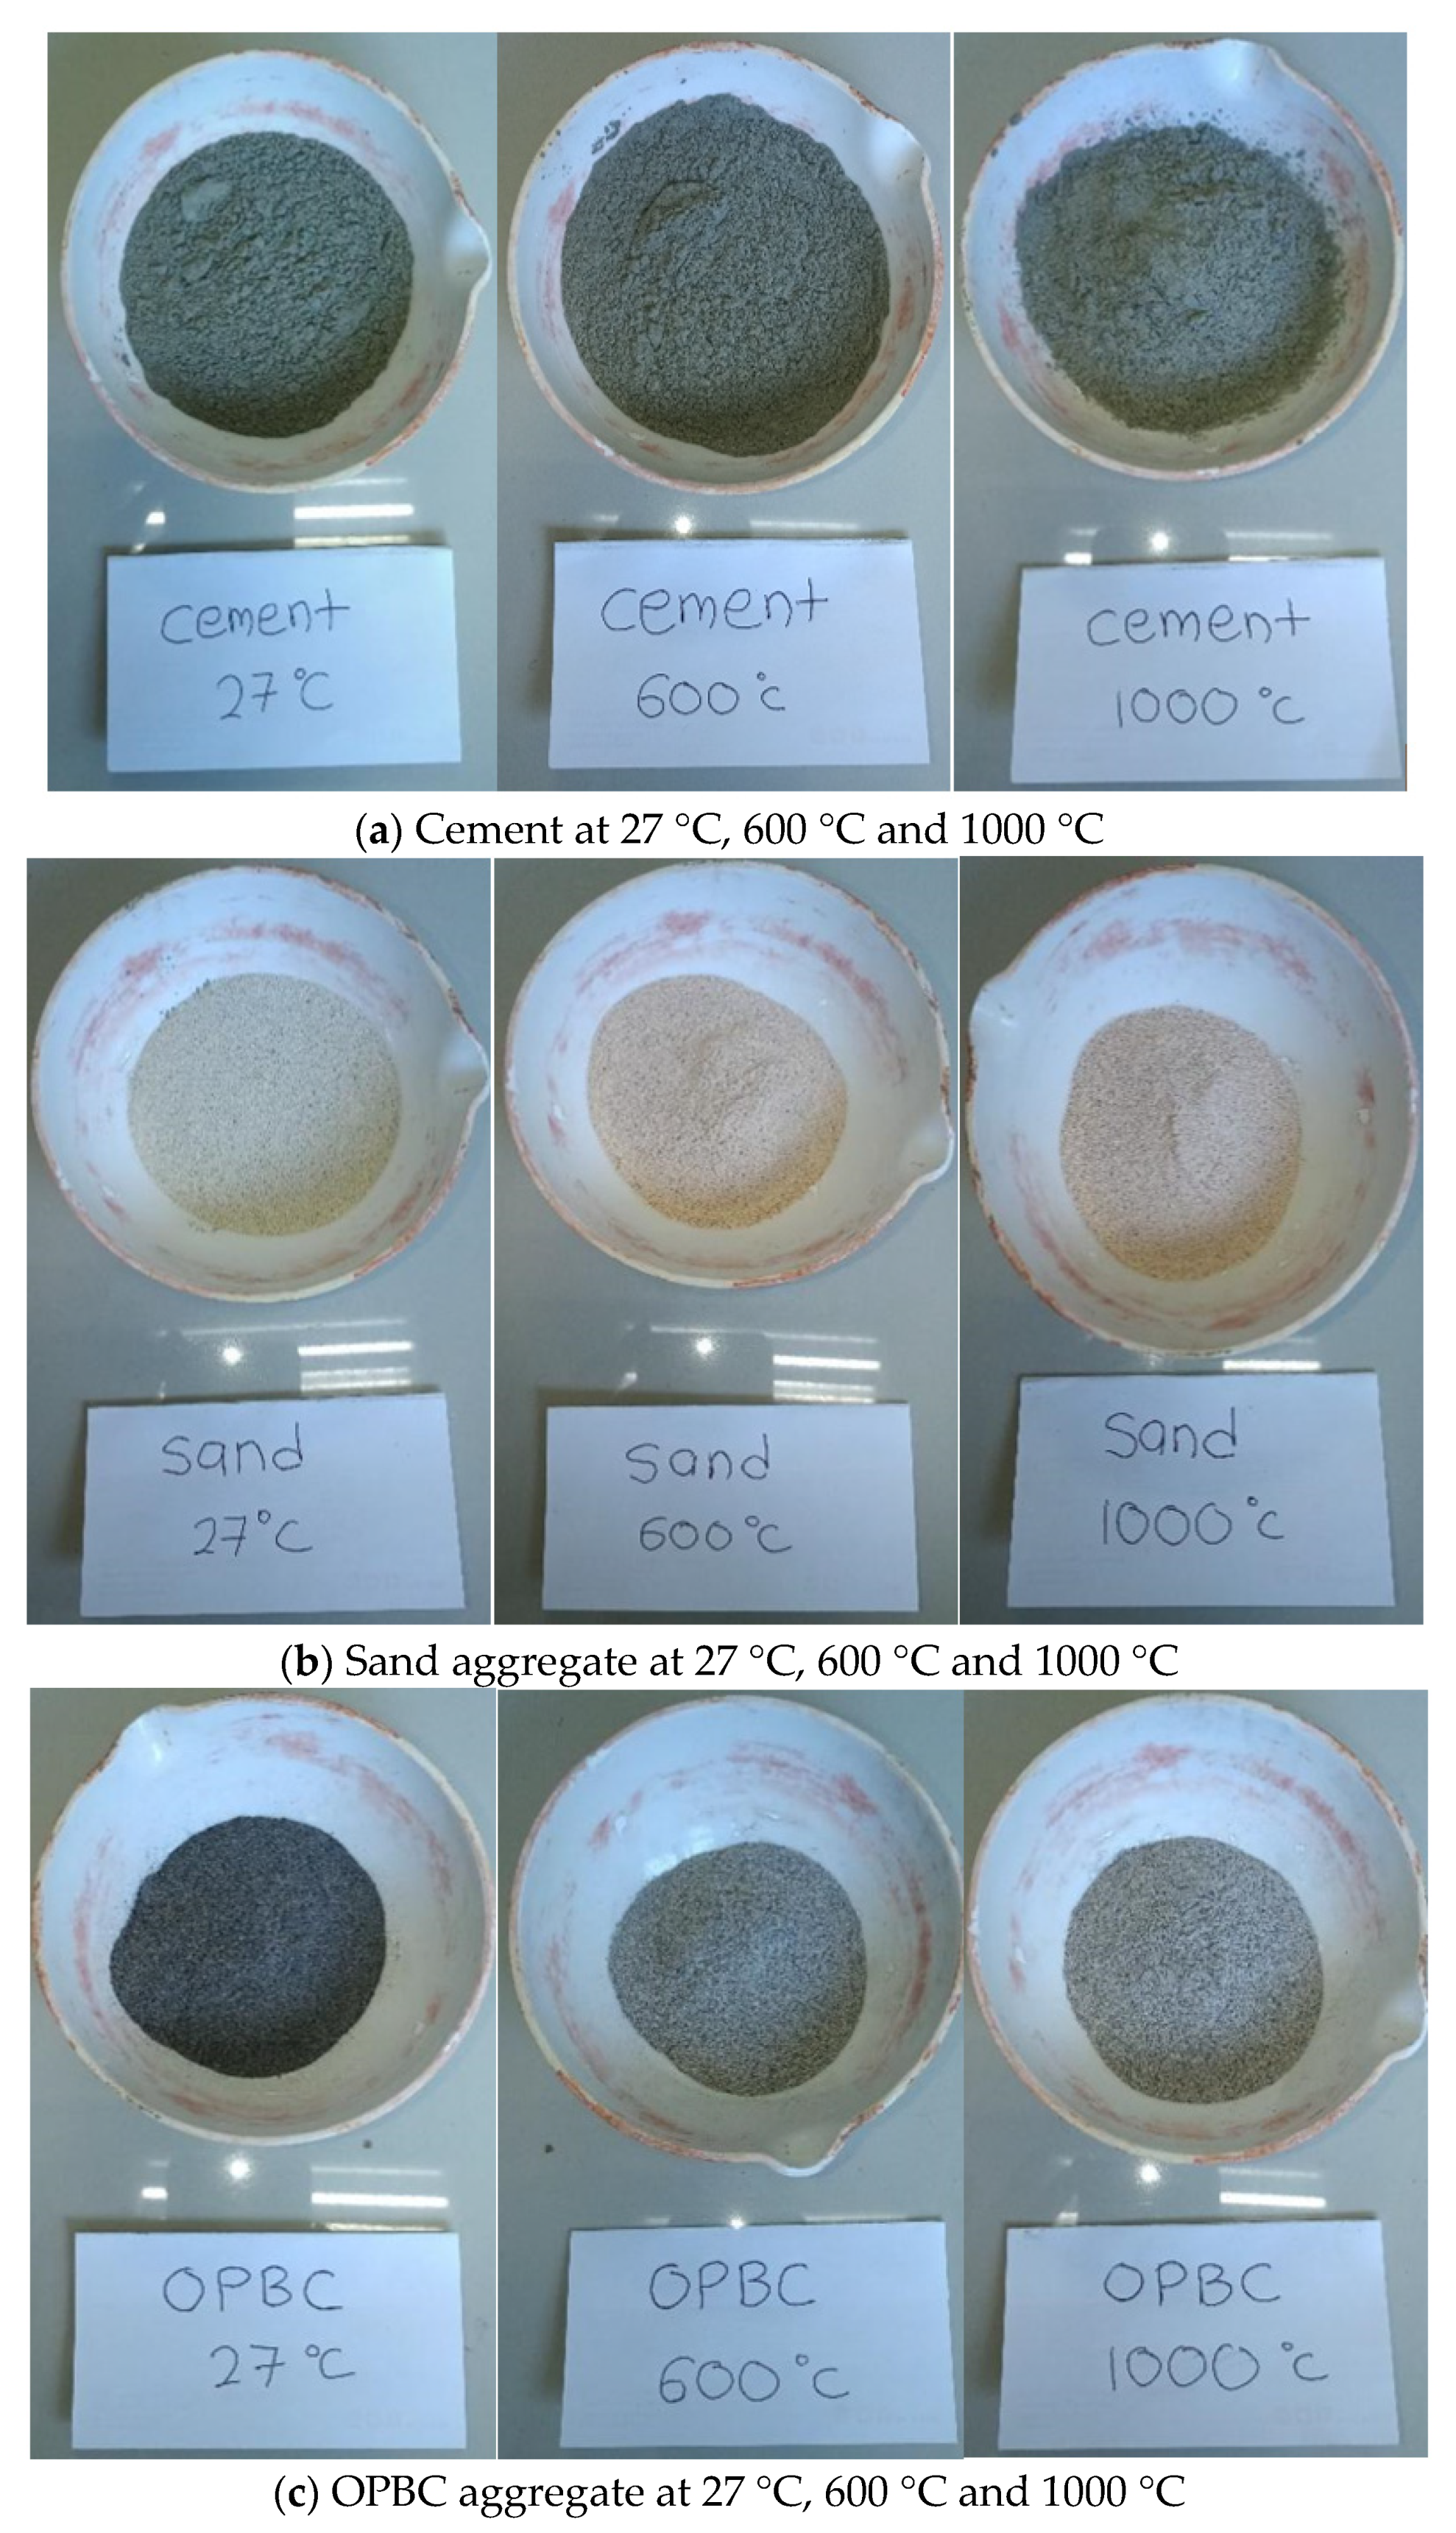
Moreover, the colour changes of constituent materials inside the mortar samples were studied. Figure 4 illustrates the colour changes of the OPC materials, natural sand, and OPBC aggregates at ambient temperature, 600 °C, and 1000 °C. From the ambient temperature to 1000 °C, the OPC powder experienced colour changes from light grey to dark grey, as shown in Figure 4a. Owing to the high temperature, the mineral compound inside OPC oxidised during heat reactions [48,49]. Figure 4b depicts the colour changes of sand aggregates from pale orange to pink. The possible reason behind the colour changes of sand aggregates at the temperatures of 600 °C and 1000 °C was the loss of moisture content within the pore space, leading to the dehydration of iron deposits from goethite to hematite [50]. As observed in Figure 4c, the OPBC aggregate changed from blackish to pale grey at 600 °C. Later, as the temperature increased to 1000 °C, the OPBC aggregate changed its colour from pale grey to light grey. This reaction occurred due to the iron ion that was activated whilst reducing the carbon ion content. Iron is usually perceived as dull and grey.

3.3. Mass Loss

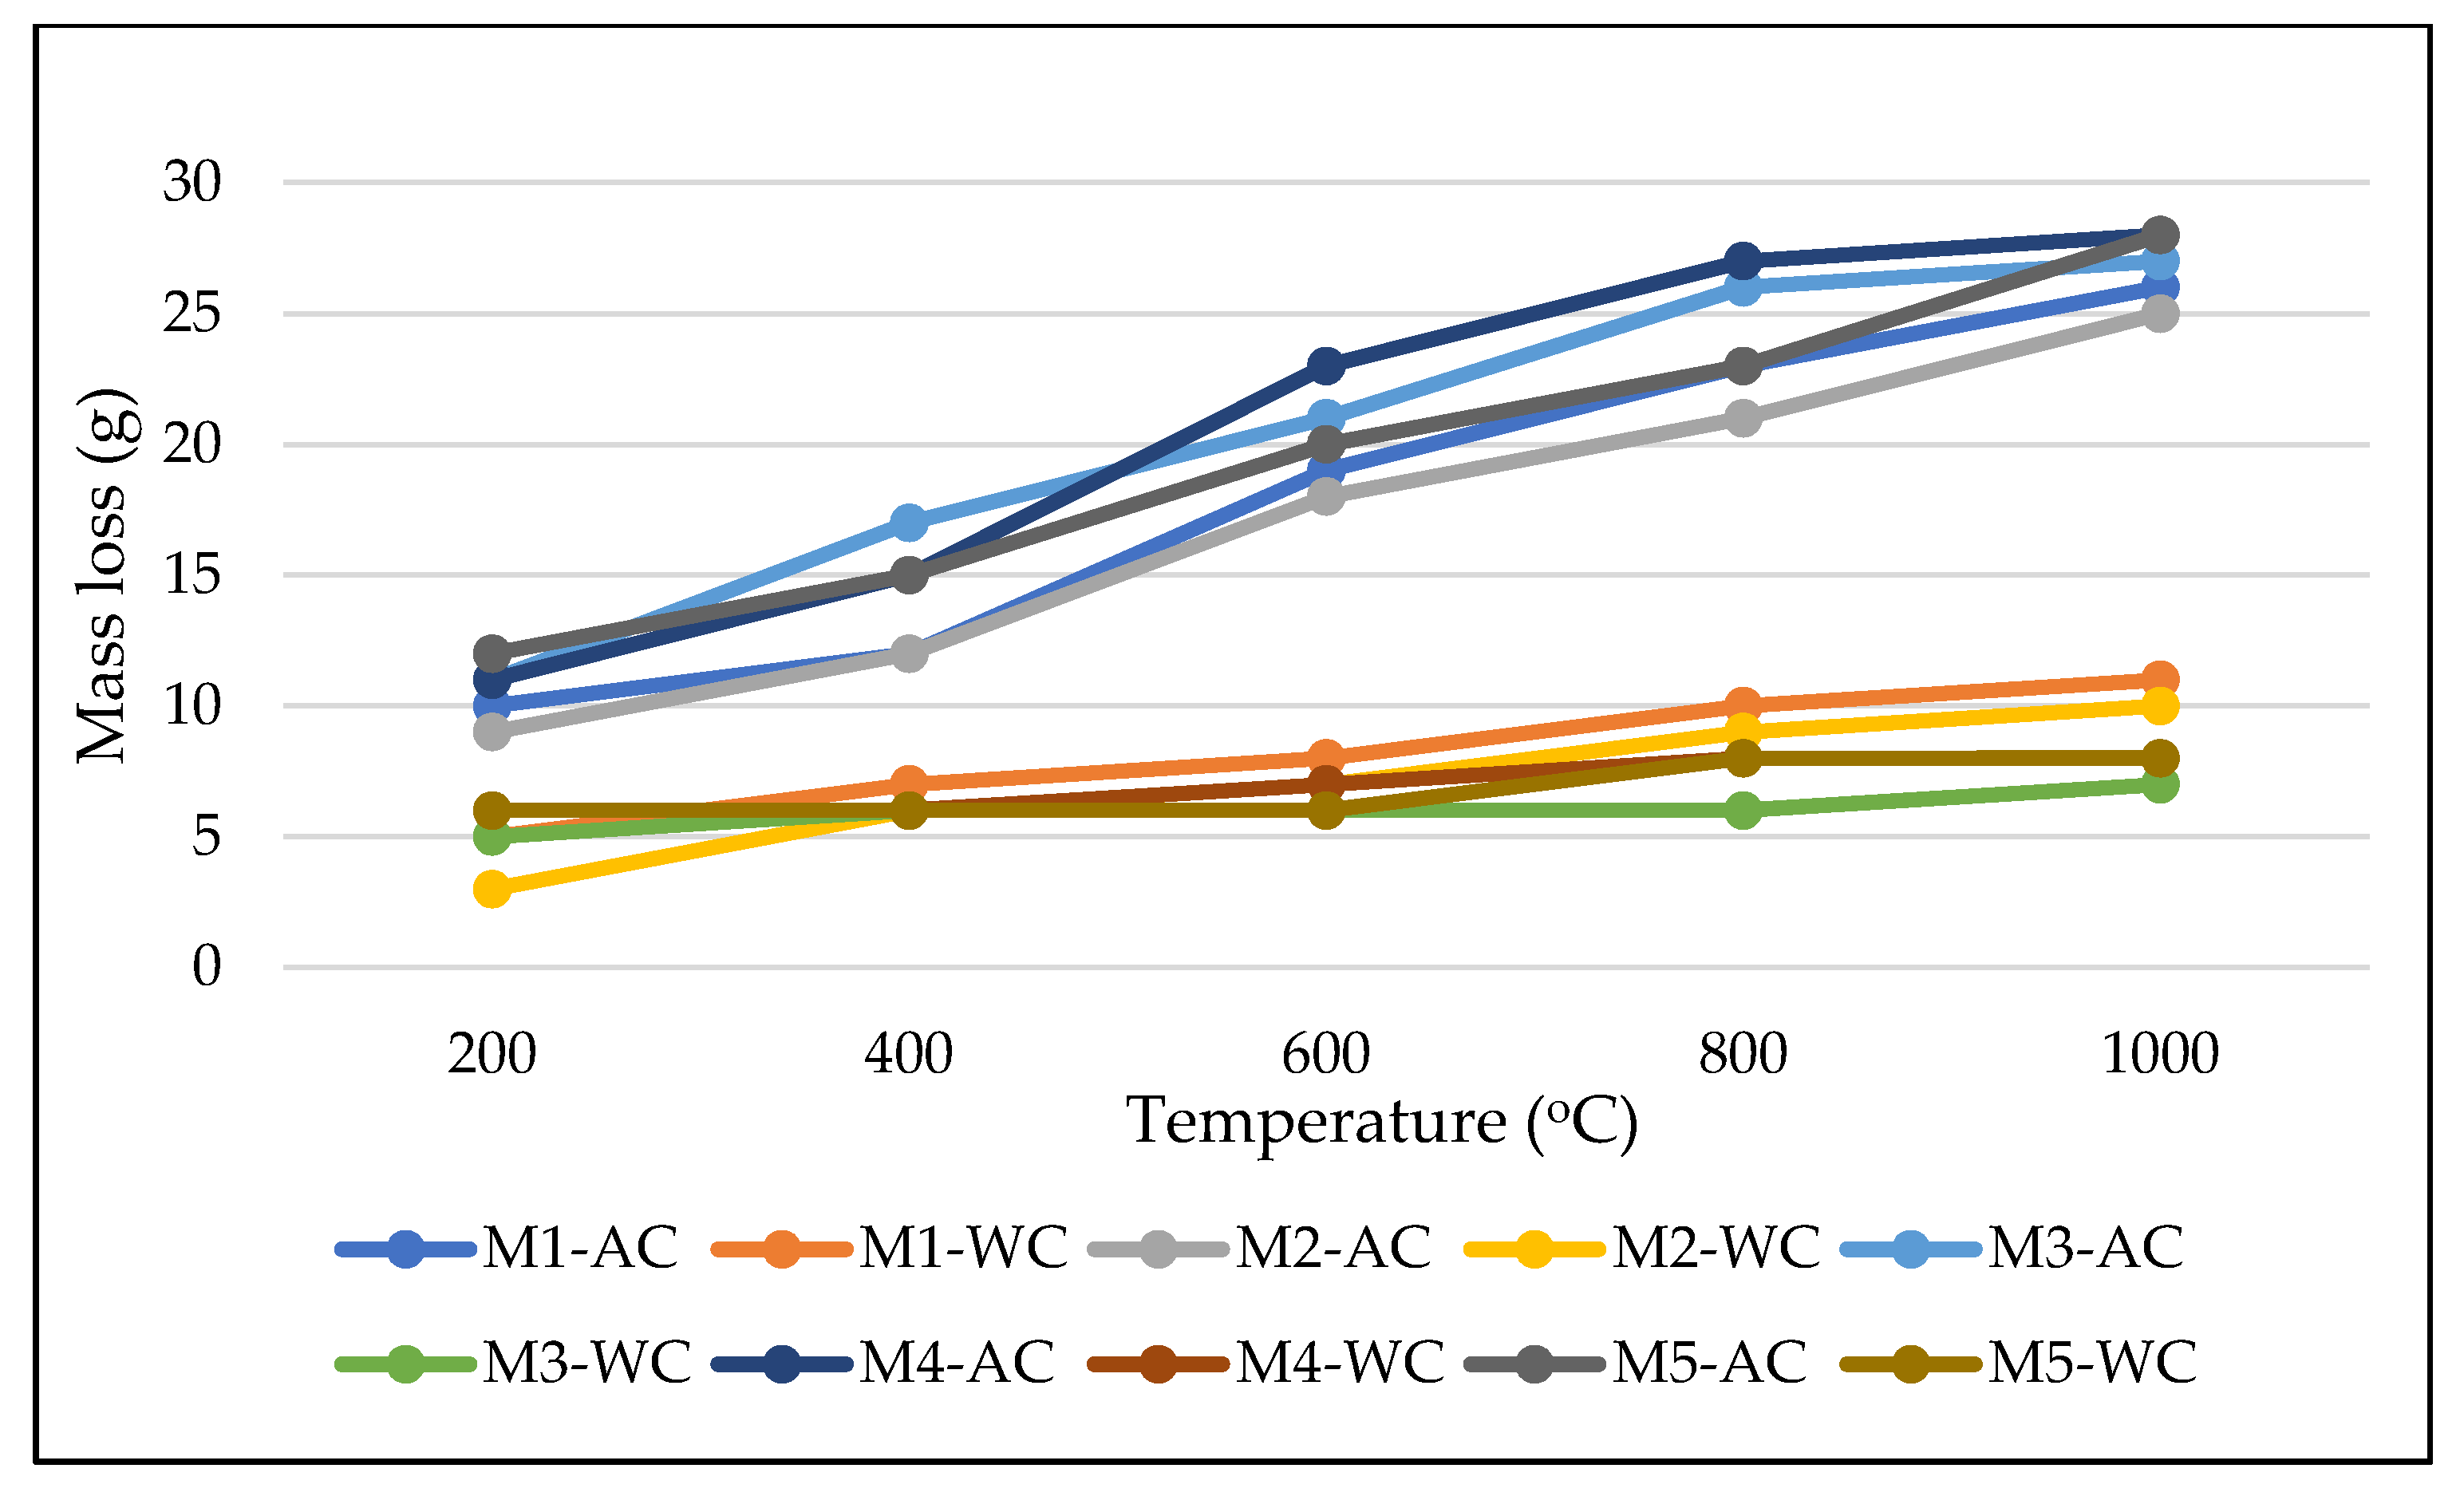
When heated at elevated temperatures, all of the mortar samples experienced mass loss. Figure 5, Figure 6 and Figure 7 show the relative mass loss of the samples under different curing conditions when exposed to various elevated temperatures. This loss was associated with the cracking formation in the samples caused by the expulsion of water at elevated temperatures. The water disturbances inside the samples degraded the strength, and further discussions on this mechanism will be provided in the next section. From the ambient temperature to the temperature of up to 400 °C, a slight reduction in the mass of the samples was observed in all the curing conditions. When the temperature rose to 600 °C, the samples lost considerable moisture resulting from the evaporation of free and binding water and the subsequent decomposition of the C–S–H bond structure of the samples [34]. The air-cooled (AC) samples recorded the highest reduction in mass loss compared to the water-cooled (WC) samples from the ambient temperature to the temperature of 1000 °C.

3.4. Compressive Strength

At ambient temperature, the compressive strength of the samples tested in all three curing conditions was measured. From Figure 8, the control and M3 samples in full water curing had the highest compressive strength. However, in partial water and air curing conditions, the M4 sample exhibited the highest compressive strength, as shown in Figure 9 and Figure 10. By contrast, the control sample tested in air curing conditions exhibited the lowest compressive strength of 43 MPa.
Figure 8, Figure 9 and Figure 10 show the compressive strength variation of samples with different percentages of OPBC cured in three different curing conditions exposed to elevated temperatures followed by cooling under air and water. A significant increase in the compressive strength of the OPBC samples cured in full water and air was observed as the temperature increased to up to 200 °C. This increase indicated that the OPBC mortars could resist a temperature of up to 200 °C without any deterioration in strength. This statement is strongly supported by the findings of Karim et al. [37], who determined that the compressive strength of OPBC mortars increased with rising temperatures up to 300 °C. The small reduction in the compressive strength of the samples in all of the curing conditions could be attributed to the removal of free water during the heating process. As mentioned by other researchers, the thermal effect at this temperature causes water migration [37,51,52]. As observed in partial-water-cured samples, the percentage reductions in compressive strength for the M1, M2, M3, M4, and M5 samples were approximately 18%, 26%, 18%, 21%, 19% and 18%, 18%, 13%, 16%, 12% for the AC and WC conditions, respectively.
As the temperature rose to 400 °C, a reduction in the compressive strength of the samples in all of the curing conditions was observed. The reduction in compressive strength at this temperature was probably due to the acceleration of the hydration reaction when the samples reached the temperature of 300 °C [37]. The OPBC samples under air and water cooling in all of the curing conditions showed no or the least reduction in compressive strength compared to the control sample. This phenomenon was probably an effect of internal autoclaving and a reaction of the OPBC aggregate inside of the mortar [14,37]. The physical properties and rough surfaces of the OPBC aggregate play significant roles in the stronger bonds formed between the aggregate and cement paste [10,14]. The OPBC samples also showed better strength than the control sample, irrespective of the cooling methods.
By contrast, all of the mortar samples lost significant compressive strength when the temperature of 600 °C was reached. Cracks were also observed in the samples at this temperature, which resulted in the weakening of cement matrix and aggregate adherence. The compressive strength reduction was attributed to the decomposition of C–S–H. The reduction in strength for samples cooled by air was greater than that for samples cooled by water. As observed, the M1 (control) and M5 samples in all of the curing conditions showed a high compressive strength reduction compared to the other OPBC samples. The highest reduction in compressive strength occurred in partial water curing, with more than a 50% reduction from the original strength. The results in the partial curing condition demonstrated that the high percentages of OPBC aggregate contributed to the high compressive strength reduction in air cooling conditions. On the contrary, the samples cooled by water showed a low reduction in compressive strength. The OPBC samples were found to have lesser compressive strength reduction compared to the control sample. The presence of water after high temperature exposure aids in stopping the heat and in rehydrating the calcium hydroxide found in cement [53]. These actions increased the strength compared to the AC samples.
Further compressive strength degradation in samples continued when the heat exposure reached the temperature of 800 °C. The formation of cracks in the samples increased at this temperature, due to the similar rapid expansion and shrinkage rates inside mortar mass. As discussed and pointed out by other researchers, the drastic compressive strength reduction of the samples at this temperature was due to the propagation of these cracks [52,54,55]. As observed, the control sample cooled by air showed the highest compressive strength reduction compared to the OPBC samples in all three curing conditions. The compressive strength reduction of the control sample was the highest with 75%, 73%, and 86% in full water, partial water, and air curing conditions, respectively, compared to the sample with 100% OPBC aggregate. However, for the WC samples, the M5 samples in all three curing conditions showed the highest compressive strength reduction compared to the control sample. The compressive strength reductions of the M5 samples were 67%, 73%, and 68% in full water, partial water, and air curing conditions, respectively.
From the figures, the control sample had the highest compressive strength reduction at 1000 °C compared to the OPBC samples in both cooling techniques. The control sample was almost completely destroyed, whereas the OPBC samples still possessed some strength at this temperature. The OPBC samples cooled by air and water recorded compressive strengths within 10–13 MPa and 11–15 MPa, respectively. The lowest compressive strength was recorded for the control sample cooled by air and water with 3 and 10 MPa, respectively. The results obtained for the control sample at this temperature were almost the same as the results achieved by other researchers [56,57]. Basically, the strengths shown in the OPBC samples were higher than those in the control samples, probably due to the pores of the OPBC aggregates. When the OPBC samples were subjected to a high temperature, these pores released the built-up internal pressure, thus reducing internal structure damages [58].

3.5. FESEM–EDX

FESEM characterisation was used to analyse the micrographs of cement, OPBC, and sand aggregates at ambient temperature (27 °C) and after exposure to high temperatures (e.g., 600 °C and 1000 °C). The samples at ambient temperature were used as references for comparison. The FESEM images demonstrate that significant microproperty differences occurred between the unheated and heated materials. The findings from this test and EDX analysis, especially on the elemental composition determination, indicated the predominant elements present in the samples.

3.5.1. Cement

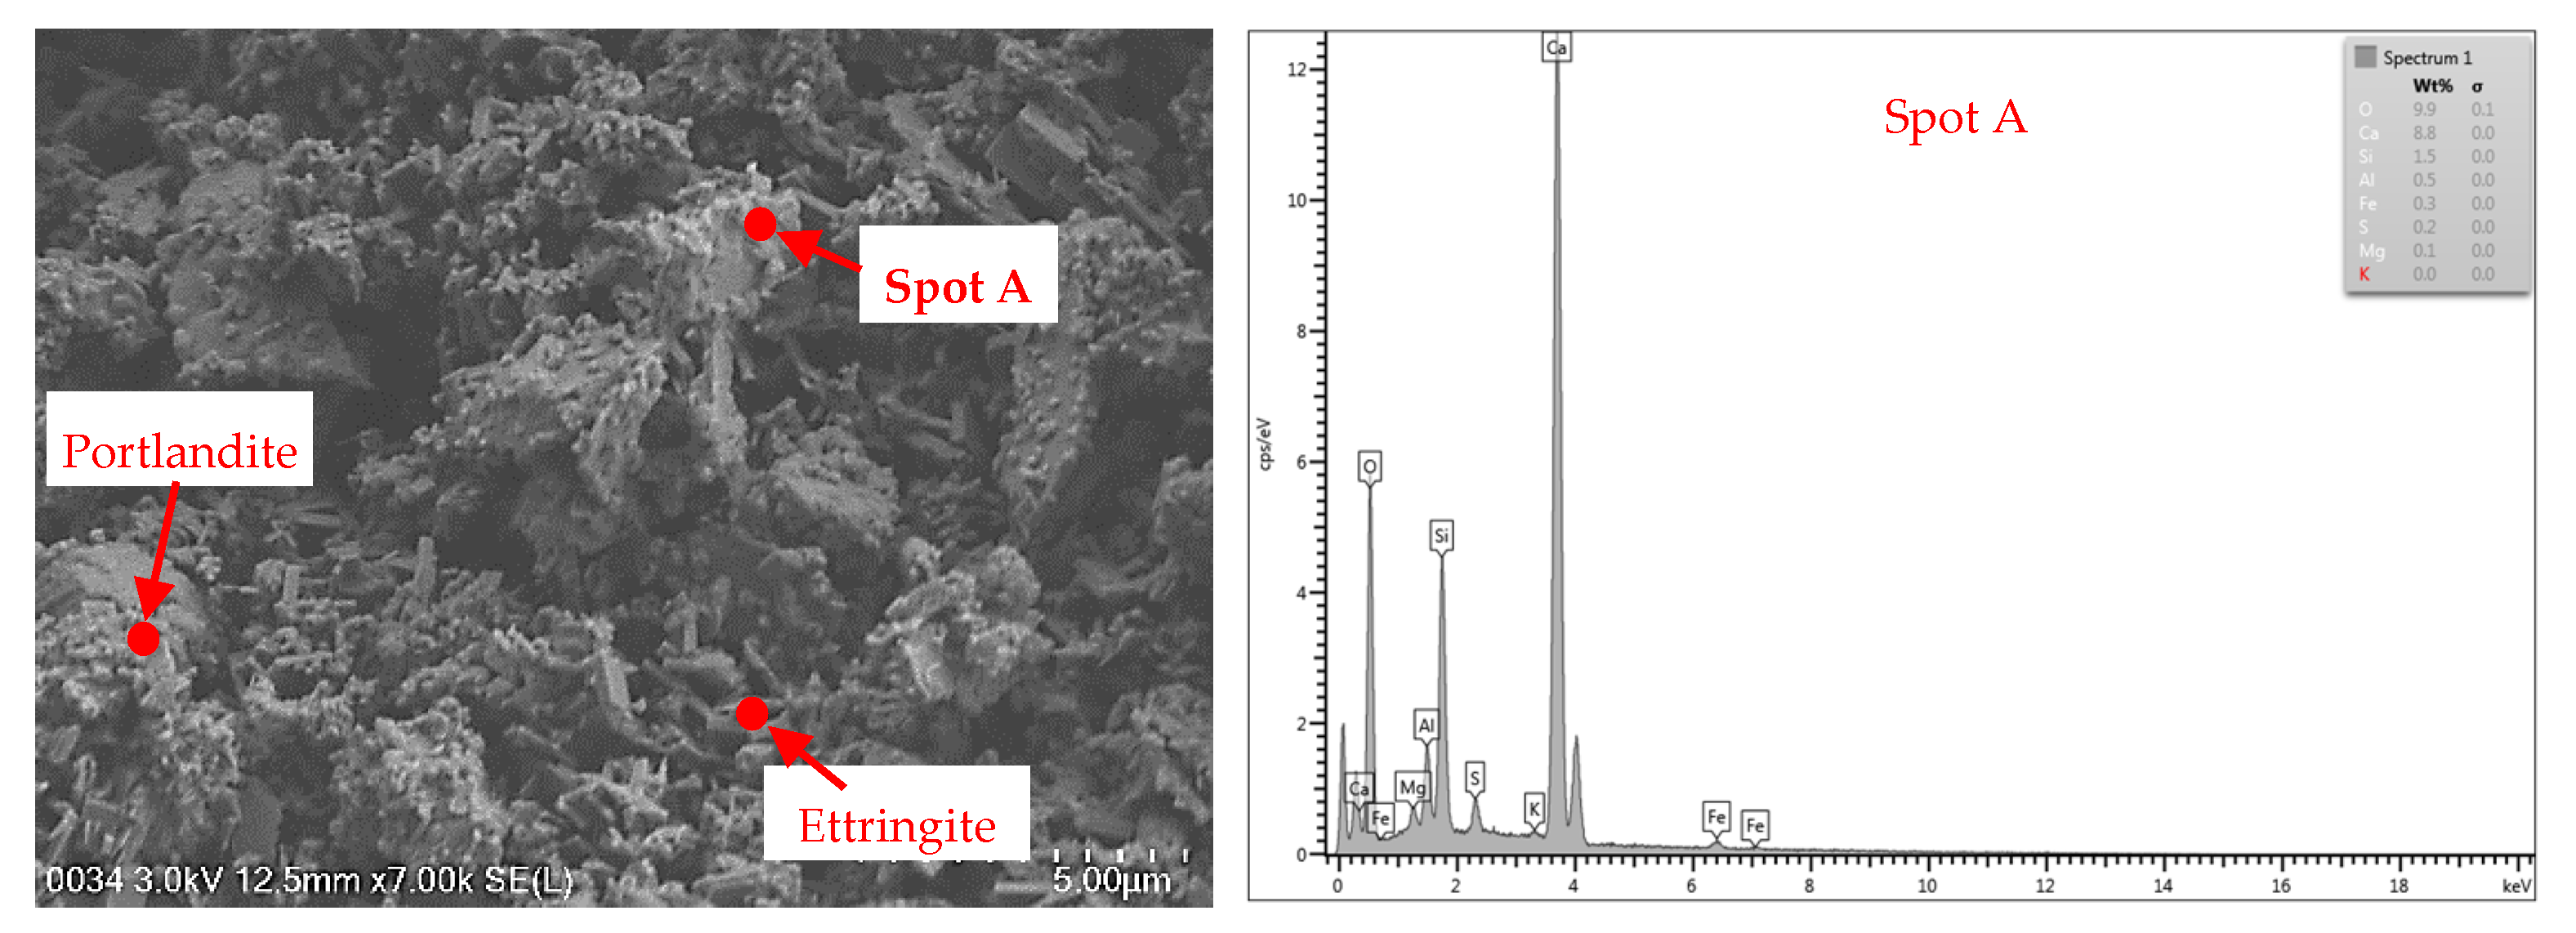
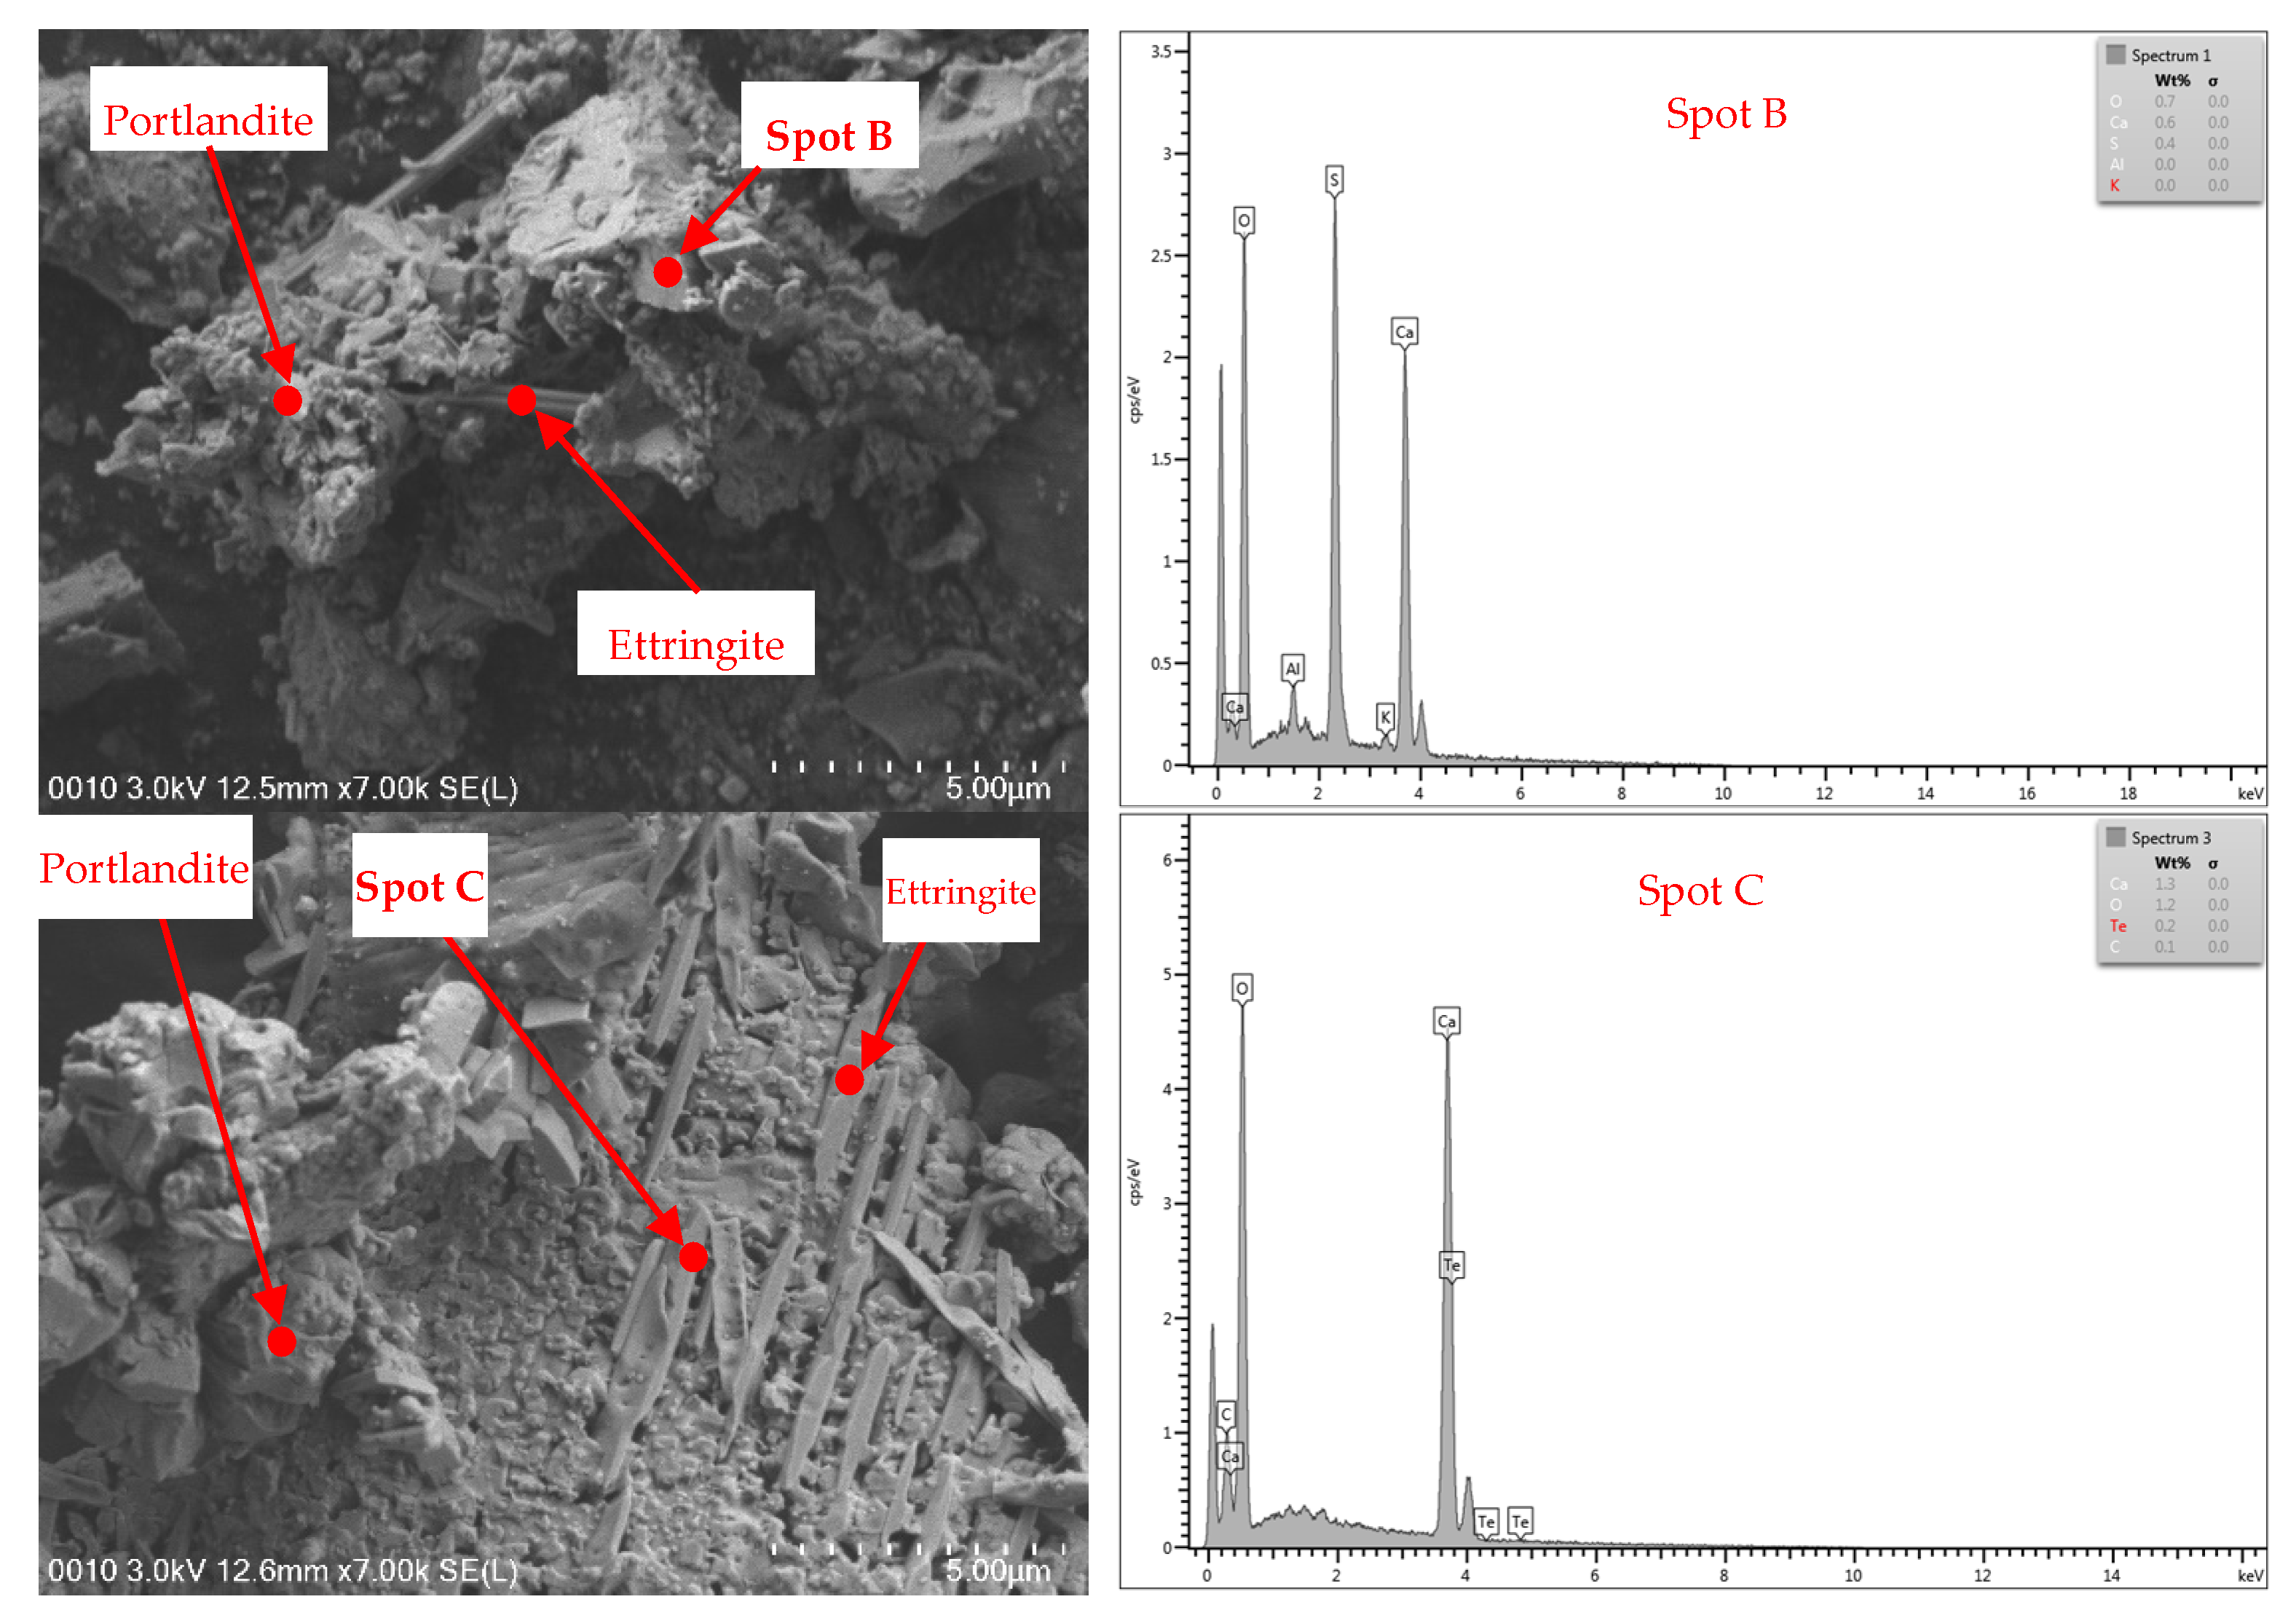
Figure 11 (top row) shows the surface of the cement sample at ambient temperature. Layered portlandite and rod-shaped ettringite were observed in the images obtained through combined FESEM and EDX analyses. The interface of granulates was determined to exhibit good adhesion when observed with an enlargement of 5.00 µm. Several types of minerals were also found inside the cement particles. The composition of minerals from the highest to lowest amounts was calcium, silicon, aluminium, iron, sulphur, and magnesium. The calcium content found inside the cement materials exhibited a high peak at approximately 12.4 keV compared to the other elements.
Figure 11 (middle row) presents the surface of the cement sample subjected to the temperature of 600 °C. The FESEM image analyses showed that some structural alterations and thermal degradation on the granulated particles were due to the large number of pores or voids in the images. Some changes were observed in portlandite and rod-shaped ettringite. The dehydration of portlandite caused attachment and agglomeration with ettringite. The EDX analysis also identified that some of the granulated particles inside of the cement disappeared due to the exposure to heat at a high temperature. Only several elements, such as calcium, sulphur, and aluminium, were left when the cement was heated at this temperature. This argument supported the results of the compressive strength test, which demonstrated that the development of cracks was caused by the loss of bonding in the cement. The changes in the samples heated at the temperature of 600 °C showed significant differences in terms of strength, colour, and mass loss. Failure and significant crack patterns in the samples were observed at this temperature.
Figure 11 (bottom row) shows the surface of the cement sample subjected to the extreme temperature of 1000 °C. This extreme temperature led to the deterioration of portlandite and rod-shaped ettringite. The microstructure deterioration caused the cement to be less resistant because of the weaker bonds between the portlandite and ettringite. From the microstructure figure, the portlandite and ettringite melted at this temperature. The previous data on mass loss indicated that the considerable mass loss at this temperature was due to the deterioration of portlandite [59]. EDX analysis was employed to show the characteristic diffraction of mineral compositions inside the cement at the temperature of 1000 °C. Calcium and a minimal amount of carbon were left in the cement after exposure to this temperature. The amount of calcium composition dropped to 4.6 keV.

3.5.2. Aggregates

Figure 12 shows the unheated and heated OPBC aggregates at high temperatures. The microstructure of the unheated OPBC aggregate is shown in Figure 12 (top row). As observed through FESEM imaging, the high porosity of the OPBC aggregate was mainly due to the presence of small pores and voids. Most of these OPBC particles were found to be irregularly shaped with hollow cenospheres. These porosity observations correlated well with the flow table test results and can be explained similarly due to the high water absorption property. An increment in the OPBC content in the samples corresponded to increased porosity and water absorption level. The micrographs from the EDX analysis of the OPBC aggregate that was not subjected to heat treatment illustrate that the silicon content can be detected in a moderately high concentration. Other minor peaks depicting calcium, aluminium, magnesium, potassium, and iron were also detected. Silicon presented the highest peak at 66 keV.
Figure 12 (middle row) demonstrates the changes in microstructure of the OPBC aggregate exposed to 600 °C. The image shows the incidence of microcrack formation. The microcracks were formed due to the effects of heat, and these effects were found to be significant on the basis of the compressive test result and mass loss. The low reduction in the compressive strength of the OPBC mortars compared to the control mortars might be due to the porous characteristics of OPBC, given that small pores could minimise the vapour pressure when heated at a high temperature. The EDX analysis showed that the chemicals, such as aluminium, potassium, and iron, found in the OPBC samples seemed to increase. By contrast, the amounts of silicon and calcium seemed to reduce. These results showed that the process of heating the OPBC samples affected the OPBC composition.
The effects on OPBC subjected to the extreme temperature of 1000 °C are presented in Figure 12 (bottom row). The OPBC aggregate experienced cracks, which might be due to shrinkage [37]. The OPBC surface seemed to be clear, without any irregular or rough shapes. The presence of cracks and pores showed that the OPBC lost its strength, whereas the porosity increased when the OPBC was subjected to this high temperature. These observations in the forms of cracks and porosity correlated well with the findings of compressive strength test. However, the irregular and angular shaped composition that was created after exposure to the extreme temperature of 1000 °C might produce significant impacts and might contribute to strong binding effects between the aggregate and cement matrix. These findings also indicate that the OPBC mortars possessed higher compressive strength than the control mortar, even at 1000 °C, as observed on the basis of the compressive strength test results. The EDX analysis showed that the silicon and calcium compositions presented dominant peaks, whereas the magnesium, aluminium, and iron compositions demonstrated minor peaks.
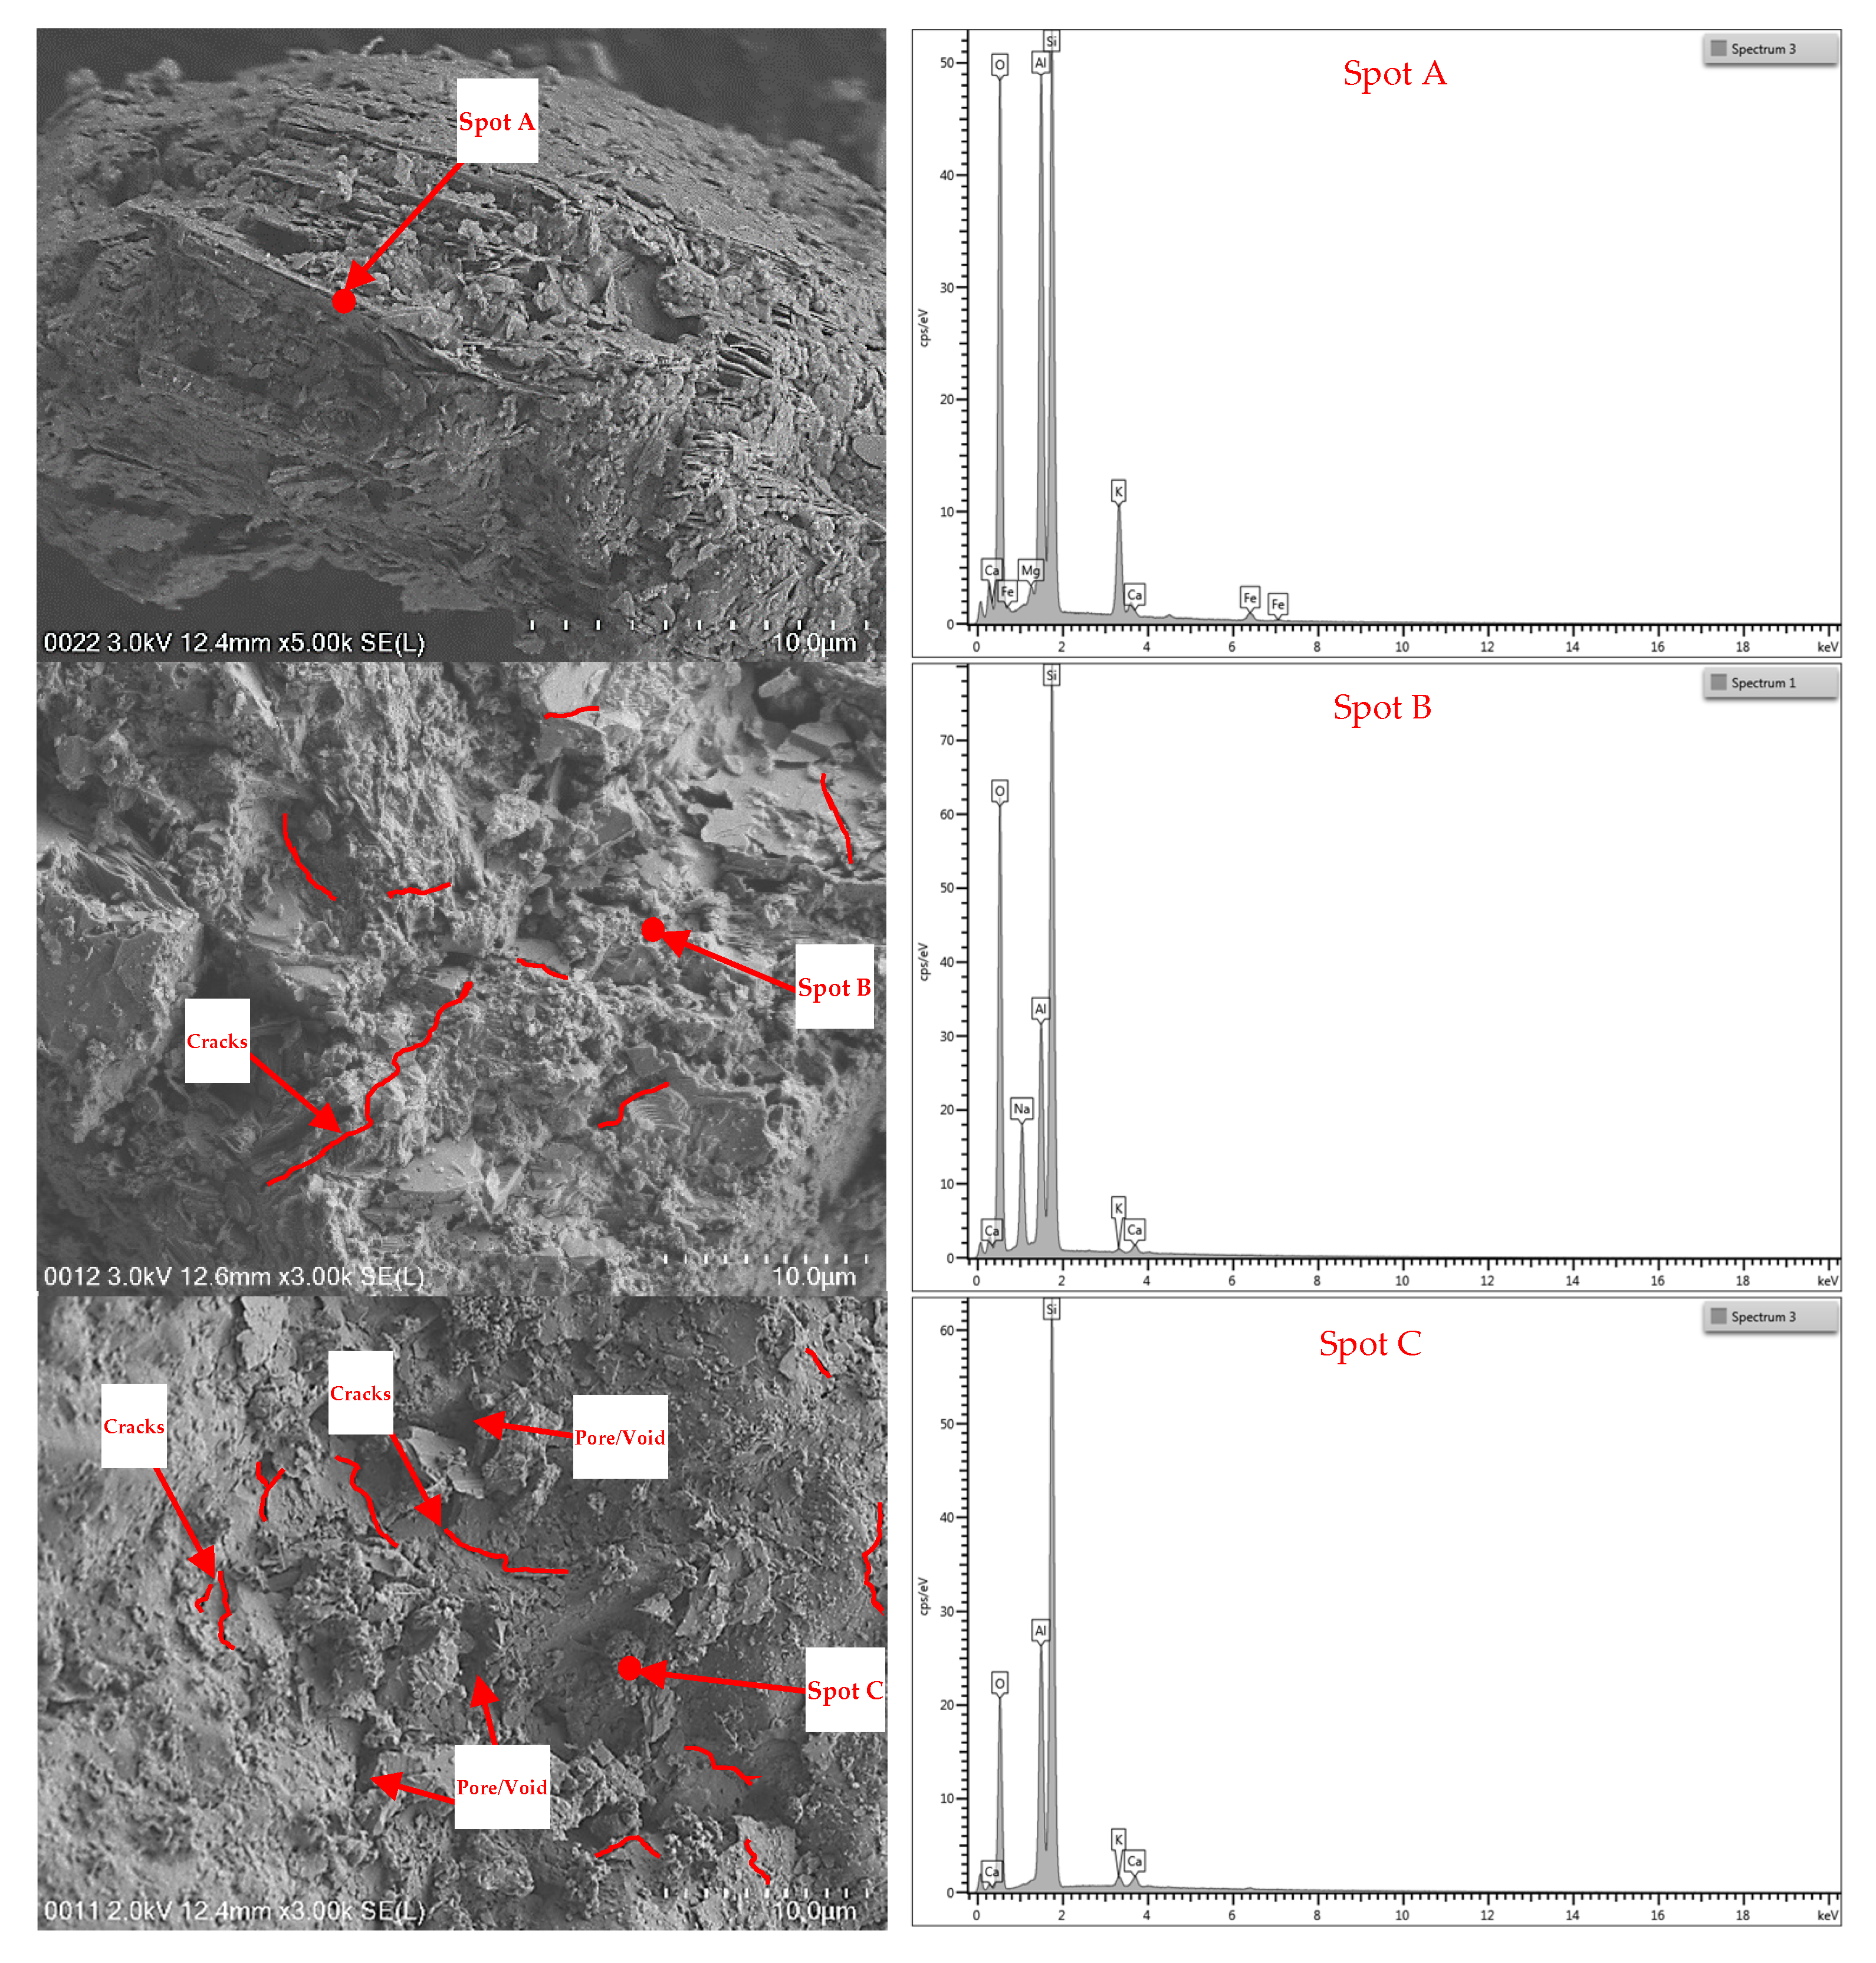
Figure 13 (top row) shows the FESEM image and EDX analysis of unheated sand particles. The sand particles had rough surfaces or irregular needle-like shapes and short and rod-shaped crystals. The interlayer of the needle- and rod-shaped crystals enhanced the bonds due to the improved interlocking interactions amongst the particles. The strength characteristic was also improved due to this interlayer. Therefore, the sand particles were solid and nonporous, contributing to the low absorption properties. Given that sand is a natural material, similar to other industrial construction materials (such as clays and stone), highly purified silicon can also be found in sand [60]. The EDX analysis detected dominant peaks for silicon and aluminium and minor peaks for magnesium, calcium, potassium, and iron.
The FESEM image, combined with EDX analysis, of the sand particles that were heated at the temperature of 600 °C is shown in Figure 13 (middle row). The microstructure of sand at this temperature exhibited microcracks. The crack formation presumably resulted from the drying shrinkage and the low cohesion with disconnected pores. The EDX analysis showed the spots that contributed to the dominant peaks of silicon. Other minor peaks, such as those of aluminium, calcium, and potassium, were also detected. The disappearance of magnesium and the appearance of sodium as a new material were observed at this temperature. Most of the elements decreased in terms of weight and atomic contents.
Figure 13 (bottom row) shows the FESEM images and EDX analysis of the chemical compositions of sand exposed to the extreme temperature of 1000 °C. After exposure to the temperature of 600 °C, the microstructure of the sand was observed to be a clear surface without any irregular or angular shapes. This phenomenon represented a weak structural formation due to the high porosity that resulted from the high degree of heat exposure. These observations of microcracks, porosity, and microstructure correlated well with the compressive strength test results. The EDX analysis traced the spot marked as Spot C in Figure 13 (bottom row) and detected silicon and aluminium as main elements and small amounts of calcium and potassium.
In summary, materials such as cement, OPBC aggregate, and sand aggregate have their own chemical properties and reactions when heated at certain temperatures. Therefore, the elevated temperatures caused changes in not only the physical and chemical properties of these materials but also in their strength. The chemical composition results of the samples were in agreement with the results obtained from EDX analysis.

3.6. Thermal Conductivity

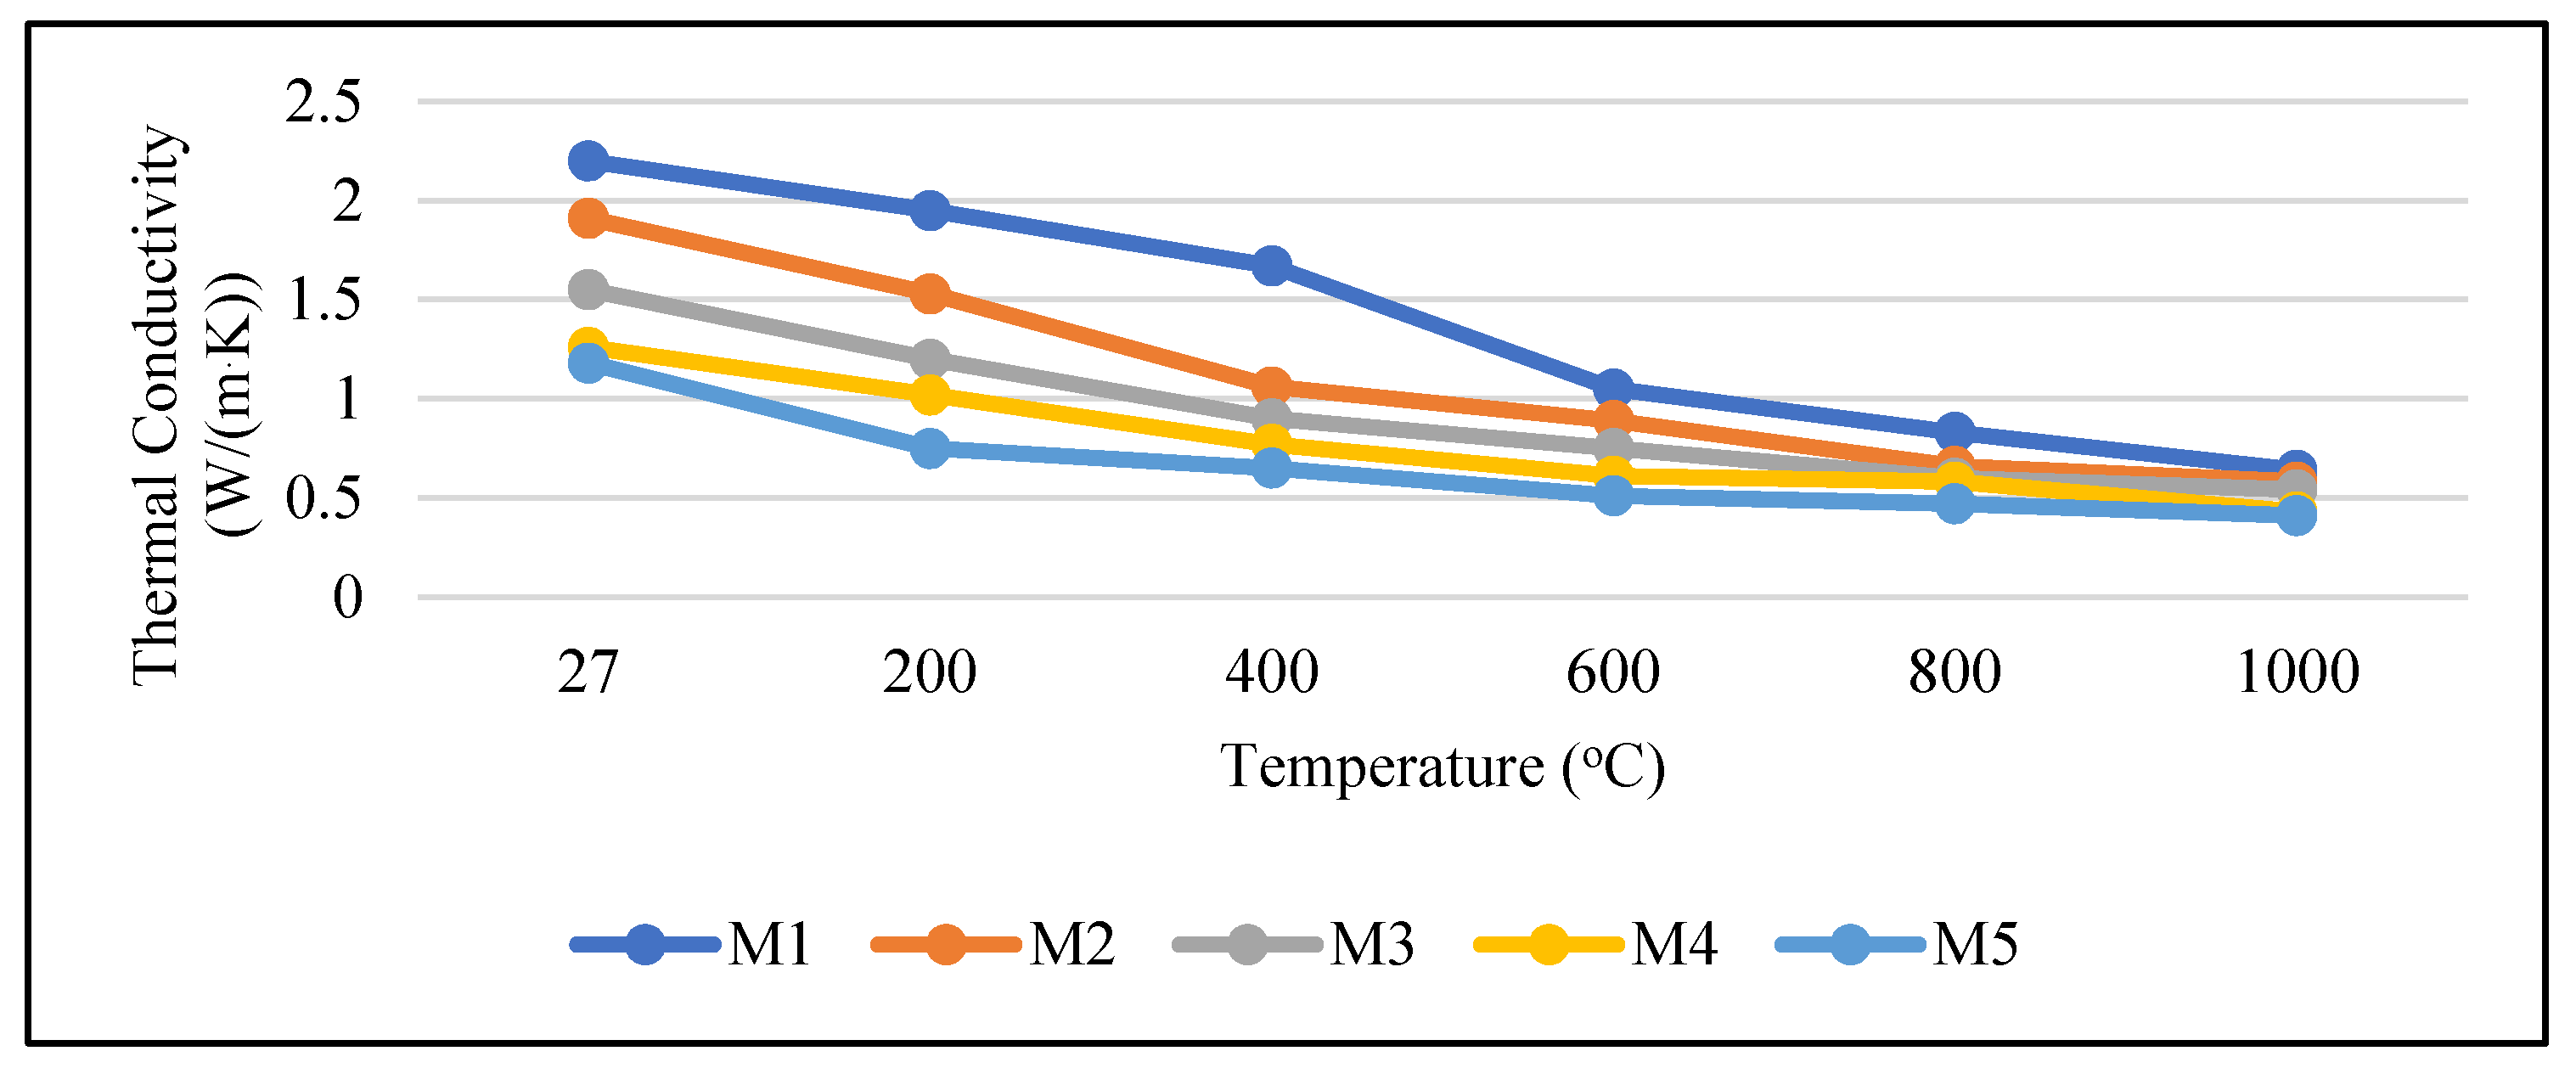
The changes in the thermal conductivity (k-value) of different mixes under elevated temperatures are illustrated in Figure 14. The curves show that at ambient temperature, the k-value decreased as the OPBC content increased, and this pattern was almost the same when the specimens were heated up to 1000 °C. The test results showed that under ambient temperature, the k-value of the mortars was reduced by 13%, 30%, 43%, and 46% for the M2, M3, M4, and M5 mixes, respectively. These reduction rates implied that the mortars incorporated with more than 50% OPBC aggregates had a significant reduction in the k-value. Hence, these OPBC mortar mixtures are suitable for use as heat-resistant materials. In a previous study performed by Shafigh et al. [61], mortar with low thermal conductivity resulted in good thermal performance. Accordingly, the low k-value of the mortars exhibited enhanced insulation in steady and transient thermal conditions. Materials with a low k-value are great for application as the envelope of a building to save energy [62].
Given that the energy required for heating strongly depends on thermal and cooling properties, the thermal conductivity of the mortars at elevated temperatures was also studied. Zhang et al. [63] reported that temperature affects k-value. They reported that the k-value decreased at a high temperature. In Figure 14, the curves indicate that the k-value of the mortars decreased as the temperature increased. The control sample (M1) exposed to increasing temperatures of 27 °C–1000 °C recorded decreasing thermal conductivity of 2.20–0.64 W/(m.K) (a 70.9% reduction). For the samples with 100% OPBC exposed to increasing temperatures of 27 °C–1000 °C, the thermal conductivity decreased significantly from 1.18 W/(m.K) to 0.41 W/(m.K) (a 65.3% reduction). Similarly, the other mixes (M2, M3, M4) exposed to increasing temperatures of 27 °C–1000 °C recorded a reduction in thermal conductivity between 65% and 69%.

4. Conclusions

This paper presents the changes that occurred in cement mortar mixes when natural sand was replaced with OPBC waste under elevated temperatures of up to 1000 °C and under two different cooling conditions. A total of five mortar mixes containing OPBC aggregates as a replacement for natural sand with percentages of 0%, 25%, 50%, 75%, and 100% were examined on physical, mechanical, and thermal properties. From the analysis of the test results, the following conclusions could be drawn.
  • Heating led to many changes, especially in the properties of cement mortar samples. These changes affected colour as reported in Section 3.2, mass loss in Section 3.3, compressive strength in Section 3.4, microstructure and mineral compositions in Section 3.5, and thermal conductivity in Section 3.6
  • The colour of OPBC mortar samples was shown to fade and was higher in lightness contrast starting at the temperature of 400 °C. These changes may be an apparent indicator of the variation in the moisture content of the samples.
  • Major mass loss was observed at the temperature of 600 °C, possibly due to the degradation of organic compounds in the presence of OPBC aggregate.
  • The presence of OPBC in the mortar mixes resulted in an insignificant mass loss effect after exposure to heat of up to 600 °C.
  • The existence of OPBC aggregate improved the compressive strength of mortar at elevated temperatures. The compressive strength of sample mixes at high temperatures was higher in both cooling conditions compared to that of the control mix.
  • Amongst various blended samples, the M4 sample performed better at elevated temperatures. That is, the combination of 75% OPBC aggregate and 25% natural sand aggregate showed better performance in terms of mass loss and compressive strength, even at high temperatures.
  • The effect of water-cooling condition on the samples showed less damage and higher compressive strength compared to that of the air-cooling condition.
  • The FESEM images of the raw materials proved that the changes in colour, mass loss, and compressive strength of the samples at elevated temperatures were influenced by the microproperties of the constituent materials at unheated and heated conditions.
  • The mortars containing OPBC aggregates resulted in lower thermal conductivity compared to the control cement mortar. This result demonstrated that OPBC mortar is suitable for use as a heat-resistant material. The higher the percentage of OPBC in the mortar was, the lower the k-value was. After heat exposure, the k-value of the samples decreased as the temperature increased.

Author Contributions

Conceptualisation, P.S. and F.W.A.; data curation, M.F.A., S.Y. and A.M.; formal analysis, M.F.A., P.S. and F.W.A.; funding acquisition, F.W.A.; methodology, P.S., A.M. and F.W.A.; project administration, F.W.A.; resources, A.M.; Supervision, P.S. and F.W.A.; writing—original draft, M.F.A. and A.M.; writing—review and editing, P.S. and F.W.A. All authors have read and agreed to the published version of the manuscript.

Funding

Funding for this research was provided by the Ministry of Higher Education, Malaysia via Fundamental Research Grant Scheme (Grant No. FRGS/1/2019/TK06/UM/02/3) and Universiti Malaya (Grant No. GPF009F-2018), which the authors are thankful for.

Institutional Review Board Statement

Not applicable.

Informed Consent Statement

Not applicable.

Data Availability Statement

All the data are original and available on request from corresponding author.

Acknowledgments

The authors would like to thank The Centre for Building, Construction & Tropical Architecture, Faculty of Built Environment, Universiti Malaya; Civil Engineering Lab, Faculty of Engineering, Universiti Malaya; and Nanotechnology & Catalysis Research Centre (NANOCAT), Universiti Malaya for the facilities.

Conflicts of Interest

The authors declare no conflict of interest.

References

  1. Namdar, A.; Feng, X. Economical considerations in the development of construction materials—A review. Eng. Rev. 2015, 35, 291–297. [Google Scholar]
  2. Hamzah, N.; Tokimatsu, K.; Yoshikawa, K. Solid fuel from oil palm biomass residues and municipal solid waste by hydrothermal treatment for electrical power generation in Malaysia: A review. J. Sustain. 2019, 11, 1060. [Google Scholar] [CrossRef]
  3. Samadi, M.; Hussin, M.W.; Seung Lee, H.; Mohd Sam, A.R.; Ismail, M.A.; Abdul Shukor Lim, N.H.; Ariffin, N.F.; Khalid, N.H.A. Properties of mortar containing ceramic powder waste as cement replacement. J. Teknol. 2015, 77, 12. [Google Scholar] [CrossRef]
  4. Kanadasan, J.; Razak, H.A. Engineering and sustainability performance of self-compacting palm oil mill incinerated waste concrete. J. Clean. Prod. 2015, 89, 78–86. [Google Scholar] [CrossRef]
  5. Zarina, Y.; Al Bakri, A.M.M.; Kamarudin, H.; Nizar, I.K.; Rafiza, A.R. Review on the various ash from palm oil waste as geopolymer material. Rev. Adv. Mater. Sci. 2013, 34, 37–43. [Google Scholar]
  6. Koehnken, L.; Rintoul, M.S.; Goichot, M.; Tickner, D.; Loftus, A.-C.; Acreman, M.C. Impacts of riverine sand mining on freshwater ecosystems: A review of the scientific evidence and guidance for future research. River Res. Appl. 2020, 36, 362–370. [Google Scholar] [CrossRef]
  7. Yusoff, S. Renewable energy from palm oil—Innovation on effective utilization of waste. J. Clean. Prod. 2006, 14, 87–93. [Google Scholar] [CrossRef]
  8. Thomas, B.S.; Kumar, S.; Arel, H.S. Sustainable concrete containing palm oil fuel ash as a supplementary cementitious material—A review. Renew. Sustain. Energy Rev. 2017, 80, 550–561. [Google Scholar] [CrossRef]
  9. Aslam, M.; Shafigh, P.; Nomeli, M.A.; Jumaat, M.Z. Manufacturing of high-strength lightweight aggregate concrete using blended coarse lightweight aggregates. J. Build. Eng. 2017, 13, 53–62. [Google Scholar] [CrossRef]
  10. Aslam, M.; Shafigh, P.; Jumaat, M.Z.; Lachemi, M. Benefits of using blended waste coarse lightweight aggregates in structural lightweight aggregate concrete. J. Clean. Prod. 2016, 119, 108–117. [Google Scholar] [CrossRef]
  11. Shafigh, P.; Mahmud, H.B.; Jumaat, M.Z.B.; Ahmmad, R.; Bahri, S. Structural lightweight aggregate concrete using two types of waste from the palm oil industry as aggregate. J. Clean. Prod. 2014, 80, 187–196. [Google Scholar] [CrossRef]
  12. Aslam, M.; Shafigh, P.; Jumaat, M.Z. High strength lightweight aggregate concrete using blended coarse lightweight aggregate origin from palm oil industry. Sains Malays. 2017, 46, 667–675. [Google Scholar] [CrossRef]
  13. Hartono, H.; Chai, L.J.; Lee, B. Lightweight Concrete Using Oil Palm Boiler Clinker (OPBC)—A Review. MATEC Web Conf. 2016, 47, 1012. [Google Scholar] [CrossRef]
  14. Jumaat, M.Z.; Alengaram, U.J.; Ahmmad, R.; Bahri, S.; Islam, A.B.M.S. Characteristics of palm oil clinker as replacement for oil palm shell in lightweight concrete subjected to elevated temperature. Constr. Build. Mater. 2015, 101, 942–951. [Google Scholar] [CrossRef]
  15. Alengaram, U.J.; Al Muhit, B.A.; Jumaat, M.Z. Utilization of oil palm kernel shell as lightweight aggregate in concrete—A review. Constr. Build. Mater. 2013, 38, 161–172. [Google Scholar] [CrossRef]
  16. Asadi, I.; Shafigh, P.; Hassan, Z.F.B.A.; Mahyuddin, N.B. Thermal conductivity of concrete—A review. J. Build. Eng. 2018, 20, 81–93. [Google Scholar] [CrossRef]
  17. Abid, M.; Hou, X.; Zheng, W.; Hussain, R.R. High temperature and residual properties of reactive powder concrete—A review. Constr. Build. Mater. 2017, 147, 339–351. [Google Scholar] [CrossRef]
  18. Alonso, C.; Fernandez, L. Dehydration and rehydration processes of cement paste exposed to high temperature environments. J. Mater. Sci. 2004, 39, 3015–3024. [Google Scholar] [CrossRef]
  19. Ma, Q.; Guo, R.; Zhao, Z.; Lin, Z.; He, K. Mechanical properties of concrete at high temperature—A review. Constr. Build. Mater. 2015, 93, 371–383. [Google Scholar] [CrossRef]
  20. Chai, L.J.; Shafigh, P.; Bin Mahmud, H. Production of high-strength lightweight concrete using waste lightweight oil-palm-boiler-clinker and limestone powder. Eur. J. Environ. Civ. Eng. 2019, 23, 325–344. [Google Scholar] [CrossRef]
  21. Ahmad, H. Mechanical properties of palm oil clinker concrete. In Proceedings of the EnCon 2007, Kuching, Malaysia, 27–28 December 2007. [Google Scholar]
  22. Ahmad, H.; Hilton, M.; Mohd Noor, N. Physical properties of local palm oil clinker and fly ash. In Proceedings of the EnCon 2007, Kuching, Malaysia, 27–28 December 2007. [Google Scholar]
  23. Teo, D.C.L.; Mannan, M.A.; Kurian, V.J. Structural concrete using oil palm shell (OPS) as lightweight aggregate. Turk. J. Eng. Environ. Sci. 2006, 30, 251–257. [Google Scholar]
  24. Sajedi, F. Effect of curing regime and temperature on the compressive strength of cement-slag mortars. Constr. Build. Mater. 2012, 36, 549–556. [Google Scholar] [CrossRef]
  25. Li, X.; Ma, X.; Zhang, S.; Zheng, E. Mechanical properties and microstructure of class C fly ash-based geopolymer paste and mortar. Materials 2013, 6, 1485–1495. [Google Scholar] [CrossRef] [PubMed]
  26. Phoo-ngernkham, T.; Sata, V.; Hanjitsuwan, S.; Ridtirud, C.; Hatanaka, S.; Chindaprasirt, P. Compressive strength, bending and fracture characteristics of high calcium fly ash geopolymer mortar containing Portland cement cured at ambient temperature. Arab. J. Sci. Eng. 2016, 41, 1263–1271. [Google Scholar] [CrossRef]
  27. Karahan, O.; Durak, U.; İlkentapar, S.; Atabey, İ.İ.; Atiş, C.D. Resistance of polypropylene fibered mortar to elevated temperature under different cooling regimes. J. Constr. 2020, 18, 386–397. [Google Scholar] [CrossRef]
  28. Selim, F.; Amin, M.S.; Ramadan, M.; Hazem, M.M. Effect of elevated temperature and cooling regimes on the compressive strength, microstructure and radiation attenuation of fly ash–cement composites modified with miscellaneous nanoparticles. Constr. Build. Mater. 2020, 258, 119648. [Google Scholar] [CrossRef]
  29. Yang, S.; Ling, T.C.; Poon, C.S. High temperature performance of wet-mix and dry-mix mortars prepared with different contents and size gradings of glass aggregates: Hot test and cold test. Cem. Concr. Compos. 2020, 108, 103548. [Google Scholar] [CrossRef]
  30. Pham, S.; Prince, W. Effects of high temperature on the microstructure of cement mortar. Appl. Mech. Mater. 2014, 556–562, 969–972. [Google Scholar] [CrossRef]
  31. Tantawy, M. Effect of high temperatures on the microstructure of cement paste. J. Mater. Sci. Chem. Eng. 2017, 5, 33. [Google Scholar] [CrossRef]
  32. Fernandes, B.; Gil, A.M.; Bolina, F.L.; Tutikian, B.F. Microstructure of concrete subjected to elevated temperatures: Physico-chemical changes and analysis techniques. Rev. IBRACON Estrut. Mater. 2017, 10, 838–863. [Google Scholar] [CrossRef]
  33. Ahmed, A.; Al-Shaikh, A.; Arafat, T. Residual compressive and bond strengths of limestone aggregate concrete subjected to elevated temperatures. Mag. Concr. Res. 1992, 44, 117–125. [Google Scholar] [CrossRef]
  34. Khoury, G. Compressive strength of concrete at high temperatures: A reassessment. Mag. Concr. Res. 1992, 44, 291–309. [Google Scholar] [CrossRef]
  35. Mohamedbhai, G. Effect of exposure time and rates of heating and cooling on residual strength of heated concrete. Mag. Concr. Res. 1986, 38, 151–158. [Google Scholar] [CrossRef]
  36. Sarshar, R.; Khoury, G. Material and environmental factors influencing the compressive strength of unsealed cement paste and concrete at high temperatures. Mag. Concr. Res. 1993, 45, 51–61. [Google Scholar] [CrossRef]
  37. Karim, M.R.; Chowdhury, F.I.; Zabed, H.; Saidur, M.R. Effect of elevated temperatures on compressive strength and microstructure of cement paste containing palm oil clinker powder. Constr. Build. Mater. 2018, 183, 376–383. [Google Scholar] [CrossRef]
  38. Karim, M.R.; Hashim, H.; Razak, H.A.; Yusoff, S. Characterization of palm oil clinker powder for utilization in cement-based applications. Constr. Build. Mater. 2017, 135, 21–29. [Google Scholar] [CrossRef]
  39. Standard, M. Portland Cement (Ordinary and Rapid-Hardening): Part 1: Specification (Second Revision); MS522: Part 1:2003; Department of Standards Malaysia (DSM): Kuala Lumpur, Malaysia, 2003. [Google Scholar]
  40. Institution, B.S. Specification for Aggregates from Natural Sources for Concrete in Fine Aggregate; British Standards Institution: London, UK, 1992. [Google Scholar]
  41. Shi, X.; Fay, L.; Peterson, M.M.; Berry, M.; Mooney, M. A FESEM/EDX investigation into how continuous deicer exposure affects the chemistry of Portland cement concrete. Constr. Build. Mater. 2011, 25, 957–966. [Google Scholar] [CrossRef]
  42. Kanadasan, J.; Razak, H.A.; Subramaniam, V. Properties of high flowable mortar containing high volume palm oil clinker (POC) fine for eco-friendly construction. J. Clean. Prod. 2018, 170, 1244–1259. [Google Scholar] [CrossRef]
  43. Mo, K.H.; Thomas, B.S.; Yap, S.P.; Abutaha, F.; Tan, C.G. Viability of agricultural wastes as substitute of natural aggregate in concrete: A review on the durability-related properties. J. Clean. Prod. 2020, 275, 123062. [Google Scholar] [CrossRef]
  44. Salomão, M.C.d.F.; Bauer, E.; Kazmierczak, C.d.S. Drying parameters of rendering mortars. Ambiente Construído 2018, 18, 7–19. [Google Scholar] [CrossRef]
  45. Shoaib, M.M.; Ahmed, S.A.; Balaha, M.M. Effect of fire and cooling mode on the properties of slag mortars. Cem. Concr. Res. 2001, 31, 1533–1538. [Google Scholar] [CrossRef]
  46. Smyl, D.; Ghasemzadeh, F.; Pour-Ghaz, M. Modeling water absorption in concrete and mortar with distributed damage. Constr. Build. Mater. 2016, 125, 438–449. [Google Scholar] [CrossRef]
  47. Yüzer, N.; Aköz, F.; Öztürk, L.D. Compressive strength–color change relation in mortars at high temperature. Cem. Concr. Res. 2004, 34, 1803–1807. [Google Scholar] [CrossRef]
  48. Hager, I. Colour Change in Heated Concrete. Fire Technol. 2014, 50, 945–958. [Google Scholar] [CrossRef]
  49. Hager, I. Behaviour of cement concrete at high temperature. Bull. Pol. Acad. Sci. Tech. Sci. 2013, 61, 145–154. [Google Scholar] [CrossRef]
  50. Zihms, S.; Switzer, C.; Karstunen, J.I.M. Effects of high temperature processes on physical properties of silica sand. Eng. Geol. 2013, 164, 139–145. [Google Scholar] [CrossRef]
  51. Heikal, M.; El-Didamony, H.; Sokkary, T.M.; Ahmed, I.A. Behavior of composite cement pastes containing microsilica and fly ash at elevated temperature. Constr. Build. Mater. 2013, 38, 1180–1190. [Google Scholar] [CrossRef]
  52. Morsy, M.; Alsayed, S.; Aqel, M. Effect of elevated temperature on mechanical properties and microstructure of silica flour concrete. Int. J. Civ. Environ. Eng. 2010, 10, 1–6. [Google Scholar]
  53. Shoaib, M.M.; Balaha, M.M.; Abdel-Rahman, A.G. Influence of cement kiln dust substitution on the mechanical properties of concrete. Cem. Concr. Res. 2000, 30, 371–377. [Google Scholar] [CrossRef]
  54. Khurram, N.; Khan, K.; Saleem, M.U.; Amin, M.N.; Akma, U. Effect of Elevated Temperatures on Mortar with Naturally Occuring Volcanic Ash and Its Blend with Electric Arc Furnace Slag. Adv. Mater. Sci. Eng. 2018, 2018, 5324036. [Google Scholar] [CrossRef]
  55. Xiao, J.; König, G. Study on concrete at high temperature in China—An overview. Fire Saf. J. 2004, 39, 89–103. [Google Scholar] [CrossRef]
  56. Kürklü, G. The effect of high temperature on the design of blast furnace slag and coarse fly ash-based geopolymer mortar. Compos. Part B Eng. 2016, 92, 9–18. [Google Scholar] [CrossRef]
  57. Dao, D.; Forth, J. Investigation of the Behaviour of Geopolymer Mortar After Heating to Elevated Temperatures. In Proceedings of the 3rd International Conference on Sustainable Construction Materials and Technologies, Kyoto, Japan, 18–21 August 2013. [Google Scholar]
  58. Zhou, J.; Lu, D.; Yang, Y.; Gong, Y.; Ma, X.; Yu, B.; Yan, B. Physical and mechanical properties of high strength concrete modified with supplementary cementitious materials after exposure to elevated temperature up to 1000 °C. Materials 2020, 13, 532. [Google Scholar] [CrossRef] [PubMed]
  59. Morsy, M.S.; Galal, A.; Abo-El-Enein, S. Effect of temperature on phase composition and microstructure of artificial pozzolana-cement pastes containing burnt kaolinite clay. Cem. Concr. Res. 1998, 28, 1157–1163. [Google Scholar] [CrossRef]
  60. Treguer, P.; Nelson, D.M.; Van Bennekom, A.J.; De Master, D.J.; Leynaert, A.; Quéguiner, B. The silica balance in the world ocean: A reestimate. Science 1995, 268, 375–379. [Google Scholar] [CrossRef]
  61. Shafigh, P.; Asadi, I.; Akhiani, A.R.; Mahyuddin, N.B.; Hashemi, M. Thermal properties of cement mortar with different mix proportions. Mater. Construcción 2020, 70, 224. [Google Scholar] [CrossRef]
  62. Zhang, B.; Poon, C.S. Use of furnace bottom ash for producing lightweight aggregate concrete with thermal insulation properties. J. Clean. Prod. 2015, 99, 94–100. [Google Scholar] [CrossRef]
  63. Zhang, Y.; Sun, Q.; Yang, X. Changes in color and thermal properties of fly ash cement mortar after heat treatment. Constr. Build. Mater. 2018, 165, 72–81. [Google Scholar] [CrossRef]
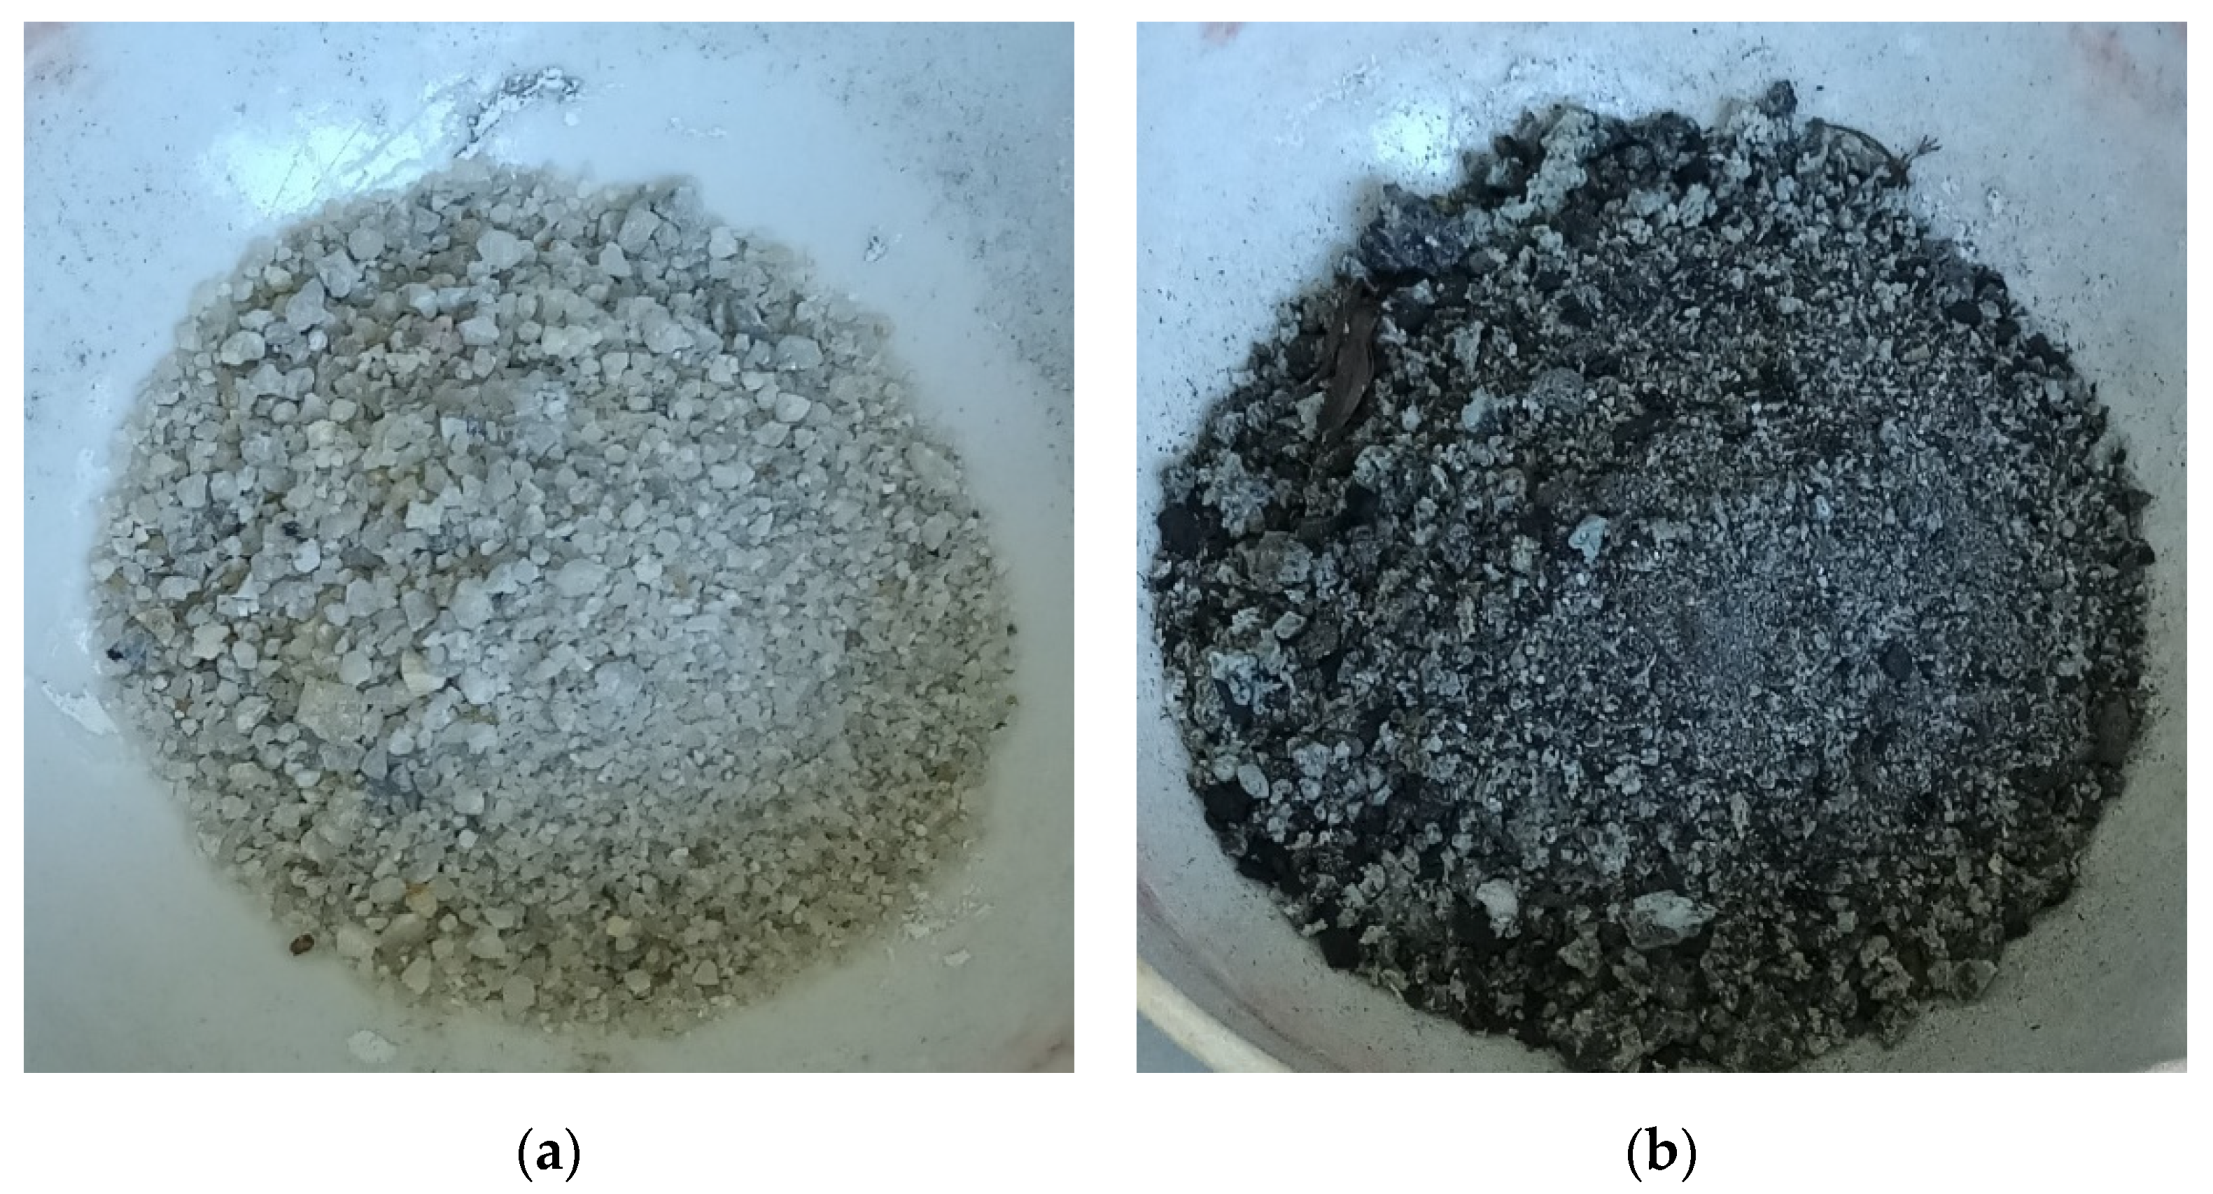
Figure 1. Natural sand and OPBC aggregates. (a) Natural sand aggregates. (b) OPBC aggregates.
Crystals 11 00988 g001
Figure 2. Flow table test results of mortar mixes.
Crystals 11 00988 g002
Figure 3. Colour changes of samples at elevated temperatures immediately after removal from the furnace.
Crystals 11 00988 g003
Figure 4. Colour changes at different temperatures: (a) cement; (b) sand aggregate; (c) OPBC aggregate.
Crystals 11 00988 g004
Figure 5. Mass loss of full-water-cured samples at elevated temperatures (where AC is air cooling, and WC is water cooling).
Crystals 11 00988 g005
Figure 6. Mass loss of partial-water-cured samples at elevated temperatures (where AC is air cooling, and WC is water cooling).
Crystals 11 00988 g006
Figure 7. Mass loss of air-cured samples at elevated temperatures (where AC is air cooling, and WC is water cooling).
Crystals 11 00988 g007
Figure 8. Compressive strength of full-water-cured samples at elevated temperatures (where AC is air cooling, and WC is water cooling).
Crystals 11 00988 g008
Figure 9. Compressive strength of partial-water-cured samples at elevated temperatures (where AC is air cooling, and WC is water cooling).
Crystals 11 00988 g009
Figure 10. Compressive strength of air-cured samples at elevated temperatures (where AC is air cooling, and WC is water cooling).
Crystals 11 00988 g010
Figure 11. FESEM and EDX images of unheated and heated cements: Unheated cement at ambient temperature (top row); Heated cement at 600 °C (middle row); and, Heated cement at 1000 °C (bottom row).
Crystals 11 00988 g011aCrystals 11 00988 g011b
Figure 12. FESEM and EDX images of unheated and heated OPBC aggregates: Heated OPBC at ambient temperature (top row); Heated OPBC at 600 °C (middle row); and, Heated OPBC at 1000 °C (bottom row).
Crystals 11 00988 g012
Figure 13. FESEM and EDX images of unheated and heated sand aggregates: Unheated sand at ambient temperature (top row); Heated sand at 600 °C (middle row); and, Heated sand at 1000 °C (bottom row).
Crystals 11 00988 g013
Figure 14. Thermal conductivity of mortar mixes under different temperatures.
Crystals 11 00988 g014
Table 1. Chemical compositions of OPC.
Composition of OxideContent (%)
SiO221.28
Al2O35.60
Fe2O33.36
CaO64.64
MgO2.06
SO32.14
Total alkalis0.05
Insoluble residue0.22
Loss on ignition0.64
Table 2. Physical properties of OPC.
ItemValue
Specific weight (g/cm3)3.05
Specific surface area (cm2/g)3204
Initial setting time (min)
Final setting time (min)
110
215
Table 3. Sieve analysis of OPBC and natural sand with BS882.
Sieve, mmCumulative Passing (%)BS882
OPBCNatural Sand
4.75998989–100
2.36636060–100
1.18394430–90
0.60233015–54
0.3010195–40
0.15000–15
Table 4. Mix proportions of mortar mixtures in one batch.
Mix IDWater-to-Cement RatioCement (kg)Natural Sand (kg)OPBC (kg)SP
(kg)
M10.503811300.094
M20.503884210.150
M30.503856420.263
M40.503828630.413
M50.50380840.523
Table 5. Curing conditions.
Curing CodeDescription
A-CSpecimens placed in the air under laboratory conditions
PW-CSpecimens placed in water conditions for 7 days after demoulding and cured under laboratory conditions
FW-CSpecimens placed in water conditions
Publisher’s Note: MDPI stays neutral with regard to jurisdictional claims in published maps and institutional affiliations.