Abstract
As promising electrolyte materials in intermediate-temperature solid oxide fuel cells (IT-SOFCs), Sc-stabilized ZrO (ScSZ) and Y-stabilized ZrO (YSZ) electrolytes continue to be plagued by high cost and low intermediate conductivity. To mitigate these problems, Mn has been chosen as a new stabilization element for the synthesis of Mn-stabilized ZrO ceramics (MnSZ) through solid state sintering. Microstructures and electrical properties of micron-crystalline O (x = 0.15, 0.20 and 0.25) ceramics electrolytes for IT-SOFCs have been systematically evaluated. Within the applied doping content, Mn ions can enter the ZrO crystal lattice, leading to the formation of single cubic phase samples. Electrical conductivity measurements in the temperature range between 400 °C and 1000 °C show a sharp increase in conductivity due to Mn doping. The highest conductivity is obtained from the ZrMnO samples, being 0.0144 S/cm at 600 °C and 0.182 S/cm at 1000 °C. The electrical conductivity at 600 °C is twice higher than that of the YSZ and two orders of magnitude higher than that of the ScSZ. These properties can fulfill the conductivity requirement (∼1 S/cm) for the electrolyte. Therefore, based on this study, we propose that Mn stabilized ZrO is a promising candidate as a solid electrolyte for IT-SOFCs.
1. Introduction
Solid oxide fuel cells (SOFC) have been attracting attention due to their efficient conversion of electrochemical fuel to electricity with negligible pollution. From a view of long-term durability and reliability, the current developmental target for SOFCs is to reduce the operating temperature into the intermediate temperature (IT) range (500–700 °C), which requires increased electrolyte ionic conductivity and enhanced gas/electrode reaction kinetics [1]. YSZ electrolyte has been recognized to be the most promising commercial applications candidate for SOFCs. However, the relative lower ionic conductivity of YSZ at intermediate temperature limits its application as an electrolyte candidate for IT-SOFCs [2]. The ScSZ electrolyte exhibits the highest ionic conductivity among all zirconia-based materials, and is considered to be the best choice for IT-SOFCs electrolyte. However, the high costing and cubic-rhombohedral phase transformation around 600 °C make ScSZ inapplicable as an electrolyte [3,4,5]. Thus, an important practical task is the development of new zirconia-based electrolyte materials aimed at reducing the cost and increasing the intermediate temperature ionic conductivity.
In fact, ZrO is a remarkable material, wherein specific cubic zirconia crystal structures can be stabilized by many kinds of dopants, which also enhances the electrical conductivity [6]. Though rare-earth metallic oxides have been used to make cubic phased zirconia-based electrolytes, studies show that transition metal oxide (especially MnO) can be an effective stabilizer on making cubic ZrO [7,8]. In most previous studies, the phase composition, microstructure, catalytic property, and magnetic property of Mn-stabilized ZrO (MnSZ) powders were systematically studied [9,10,11,12,13]. Many researchers have paid attention to the conductivity property of Mn-doped YSZ [14,15], and confirmed that Mn ion can considerably affect the conductivity of YSZ. Kim [16] found that with the addition of MnO in YSZ, the conductivity increase to 0.5 mS/cm at 600 °C. Lei [17] reported that 11ScSZ-2MnO ceramics with the cubic structure possesses the conductivity 4 mS/cm at 600 °C. Recently, researchers have studied the conductivity of 30 mol/% MnO doped ZrO powders with the method of mechanical alloying and found that the intermediate temperature conductivity can be 0.4 mS/cm at C [18].
Mn oxide acts as a stabilizer, and has unique advantages: firstly, the reserves and costing of manganite is cheaper than yttria and scandia, which is beneficial for reducing battery manufacturing costs; secondly, the cubic phase structure of MnSZ is stable at a temperature lower than C at both pure O and low oxygen partial pressure condition, which can solve the problem of phase transformation of ScSZ; thirdly, according to the defect reaction equation, with the same doping content, the oxygen vacancy number generated by charge compensation with divalent manganese ions replacement is more than trivalent yttrium and scandium, which means that MnSZ have higher electrical conductivity. So, we expect Mn-stabilized ZrO to be an applicable IT-SOFC electrolyte.
In our previous study, we demonstrated that Mn doped ZrO ceramics made by a co-precipitation method can be a potential electrode or electrolyte for SOFCs [19]. The highest conductivity is obtained from the ZrMnO samples being 0.002 S/cm at C. Due to the short sintering times and low doping content, the conductivity does not reach the requirement for electrolyte at C. However, the conductivity of 0.002 S/cm at C is three times higher than that of plasma-sprayed 8YSZ. It is noteworthy that the conductivity of ceramics largely depends on their phase composition, microstructure, density, and other parameters, which in turn depend on the synthesis technology. Solid state reaction method is a simple, cost effective, and mature technique to produce highly crystalline dense ceramics. Therefore, this method was used to process the binary composition with the minimum (15 at.%), intermediate (20 at.%), and maximum (25 at.%) doping content of cubic phase Mn-stabilized ZrO [20]. The crystal structure, microstructure and the electro-conductivity were investigated for the as-synthesized bulk samples. The aim of this study is to produce cubic phased Mn-stabilized ZrO ceramics and evaluate the electrical properties for IT-SOFCs applications.
2. Experiment
The samples were prepared by conventional solid state reaction in Ar. The starting materials for the study were zirconia (SCRC, 2–4 m, purity: >99%) and manganese monoxide (Alfa Aesar, 2–4 m, purity: >99.5%) powders. Both powders were weighted in the proper proportions and then homogeneously mixed in agate mortar. Then, the mixtures were uniaxially pressed into rectangular bars about by applying a pressure of 10 MPa with the help of a hydraulic press. Finally, the green body was sintered in a tubular furnace at C for 12 h in Ar with furnace cooling. The composition was designated as O where x is the atomic percent of Mn, and its nominal content were 15, 20 and 25 at.%.
X-ray diffraction (Rigaku D/max-2550) with Cu-Kα radiation was used to analyze both the phases composition and the lattice parameters of the crashed powders. The XRD profiles were refined by the Rietveld method using the fullprof software and diffraction peak profiles were refined by a pseudo-Voigt function. The sintered samples were polished and thermal etched at C below the sintering temperature for 30 min, and the microstructure characterization was performed by SEM (JEOL JEM-6460). High resolution TEM and selected area electron diffraction (SAED) were performed with a CM200FEG microscope operating at 200 kV and equipped with a field-emission gun. X-ray photoelectron spectroscopy (XPS) was carried out on an ESCALAB 250Xi high-performance electron spectrometer (Thermo Fisher Company, Waltham, MA, USA), using monochromatic Al K-alpha radiation. Electrical conductivity was measured between and in air by the 4-probe DC method. Platinum paste was applied to both current and voltage probes and the pasted samples were heated at for 1 h in air to cure the paste. The current source supplied the current in the −5 mA to +5 mA range with 1 mA step and the voltage drop was measured by a nano-voltmeter. The resistance values were calculated from the current-voltage curves. The electrical conductivity was measured while lowering temperature with steps. The specimens were maintained for 1 h at each temperature before taking measurements.
3. Results and Discussion
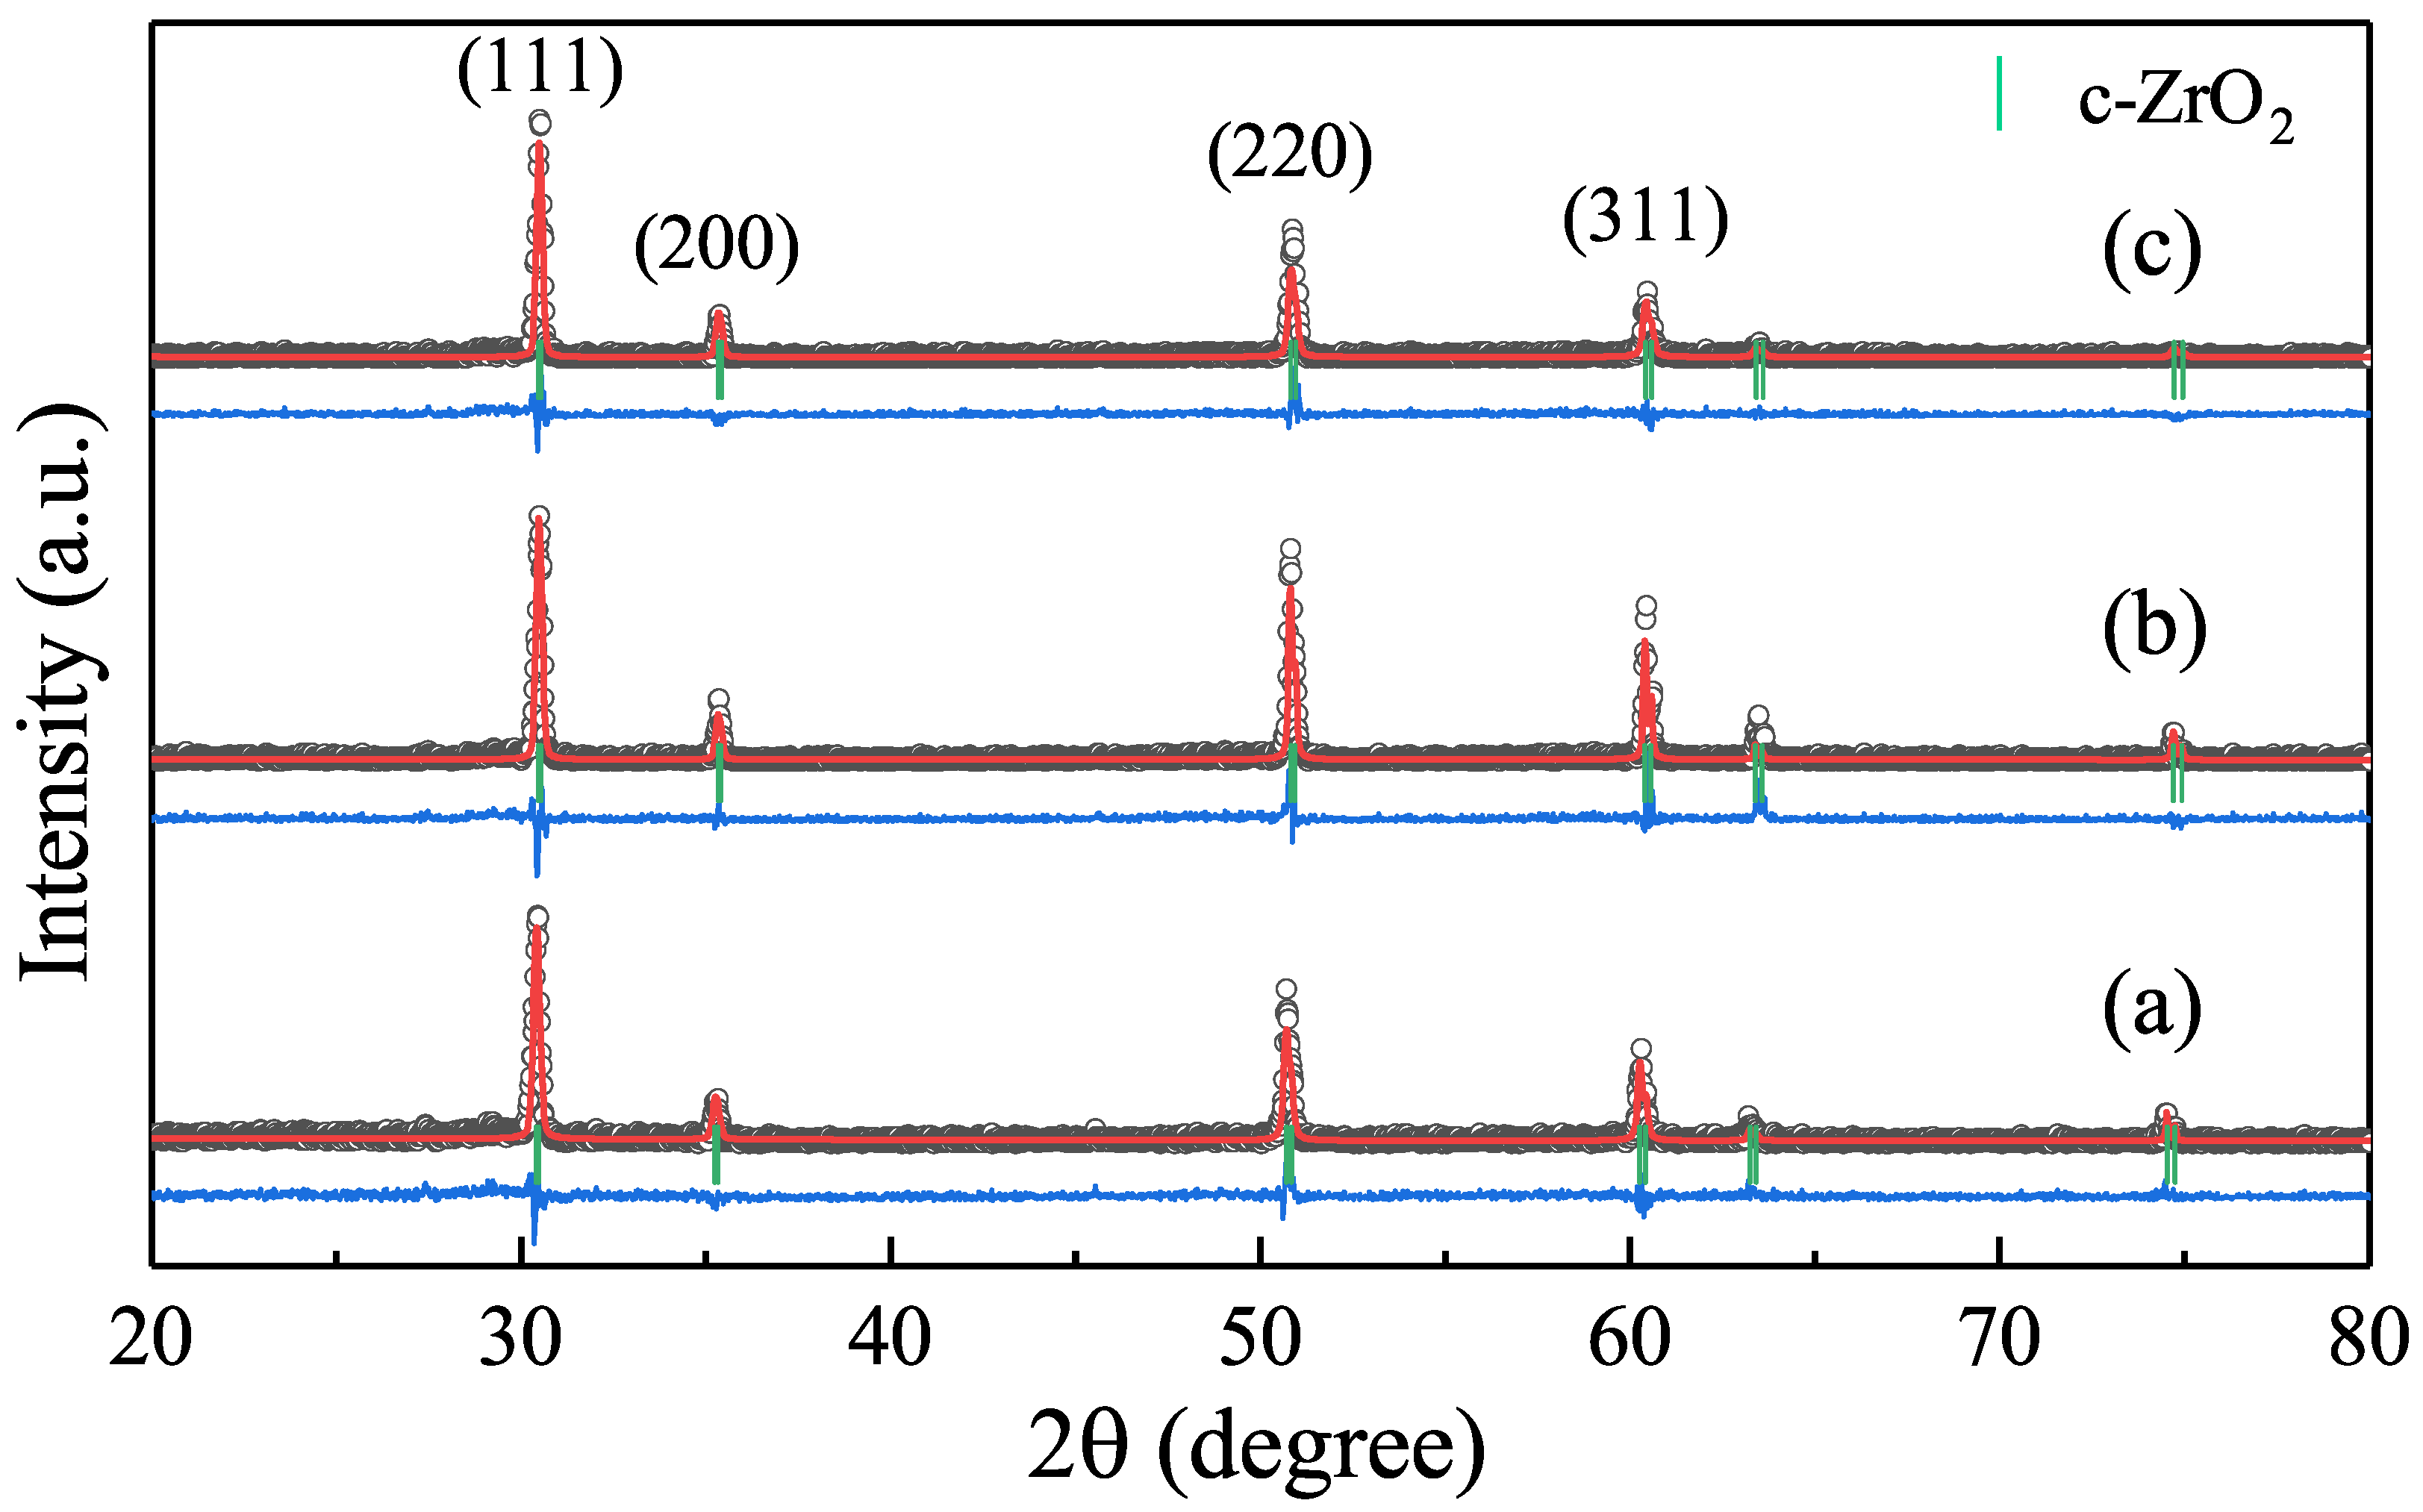
Figure 1 shows the X-ray diffraction patterns along with their Rietveld refinement patterns of the as-sintered samples powders. It can be observed that in all the samples, a single cubic ZrO phase was formed without other impurities and monoclinic phase. Because the solubility limit of Mn ions in ZrO is reported to be 25 at.% [20], the chosen doping contents are all in the limit range. The almost linear residue of fittings of respective XRD patterns indicates a good agreement between experimental and calculated intensities. Following the Rietveld refinement calculation, the calculated lattice parameter of O (x = 0.15, 0.2, 0.25) are 5.0889 Å, 5.0785 Å and 5.0771 Å respectively. A decrease in the lattice parameter was observed by increasing the Mn content, and the same result was also observed by other researchers [8]. According to the Vegard’s law, substitution of Zr (0.84 Å) by larger Mn (0.96 Å) should result in the expansion of cubic lattice. The observed decrease of lattice parameters with Mn doping can be attributed to the creation of oxygen vacancy in c-ZrO due to Mn doping. As the oxygen vacancy results in shrinkage of the cubic lattice, the resultant contraction of lattice parameter is dominated by the oxygen vacancy in the cubic lattice [18].
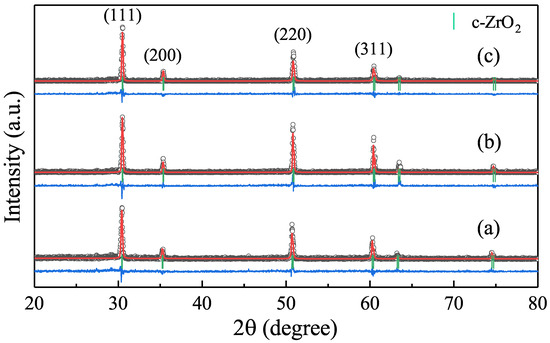
Figure 1.
X-ray diffraction patterns along with their Rietveld refinement patterns of the ZrMnO (a) x = 0.15, (b) x = 0.20, (c) x = 0.25.
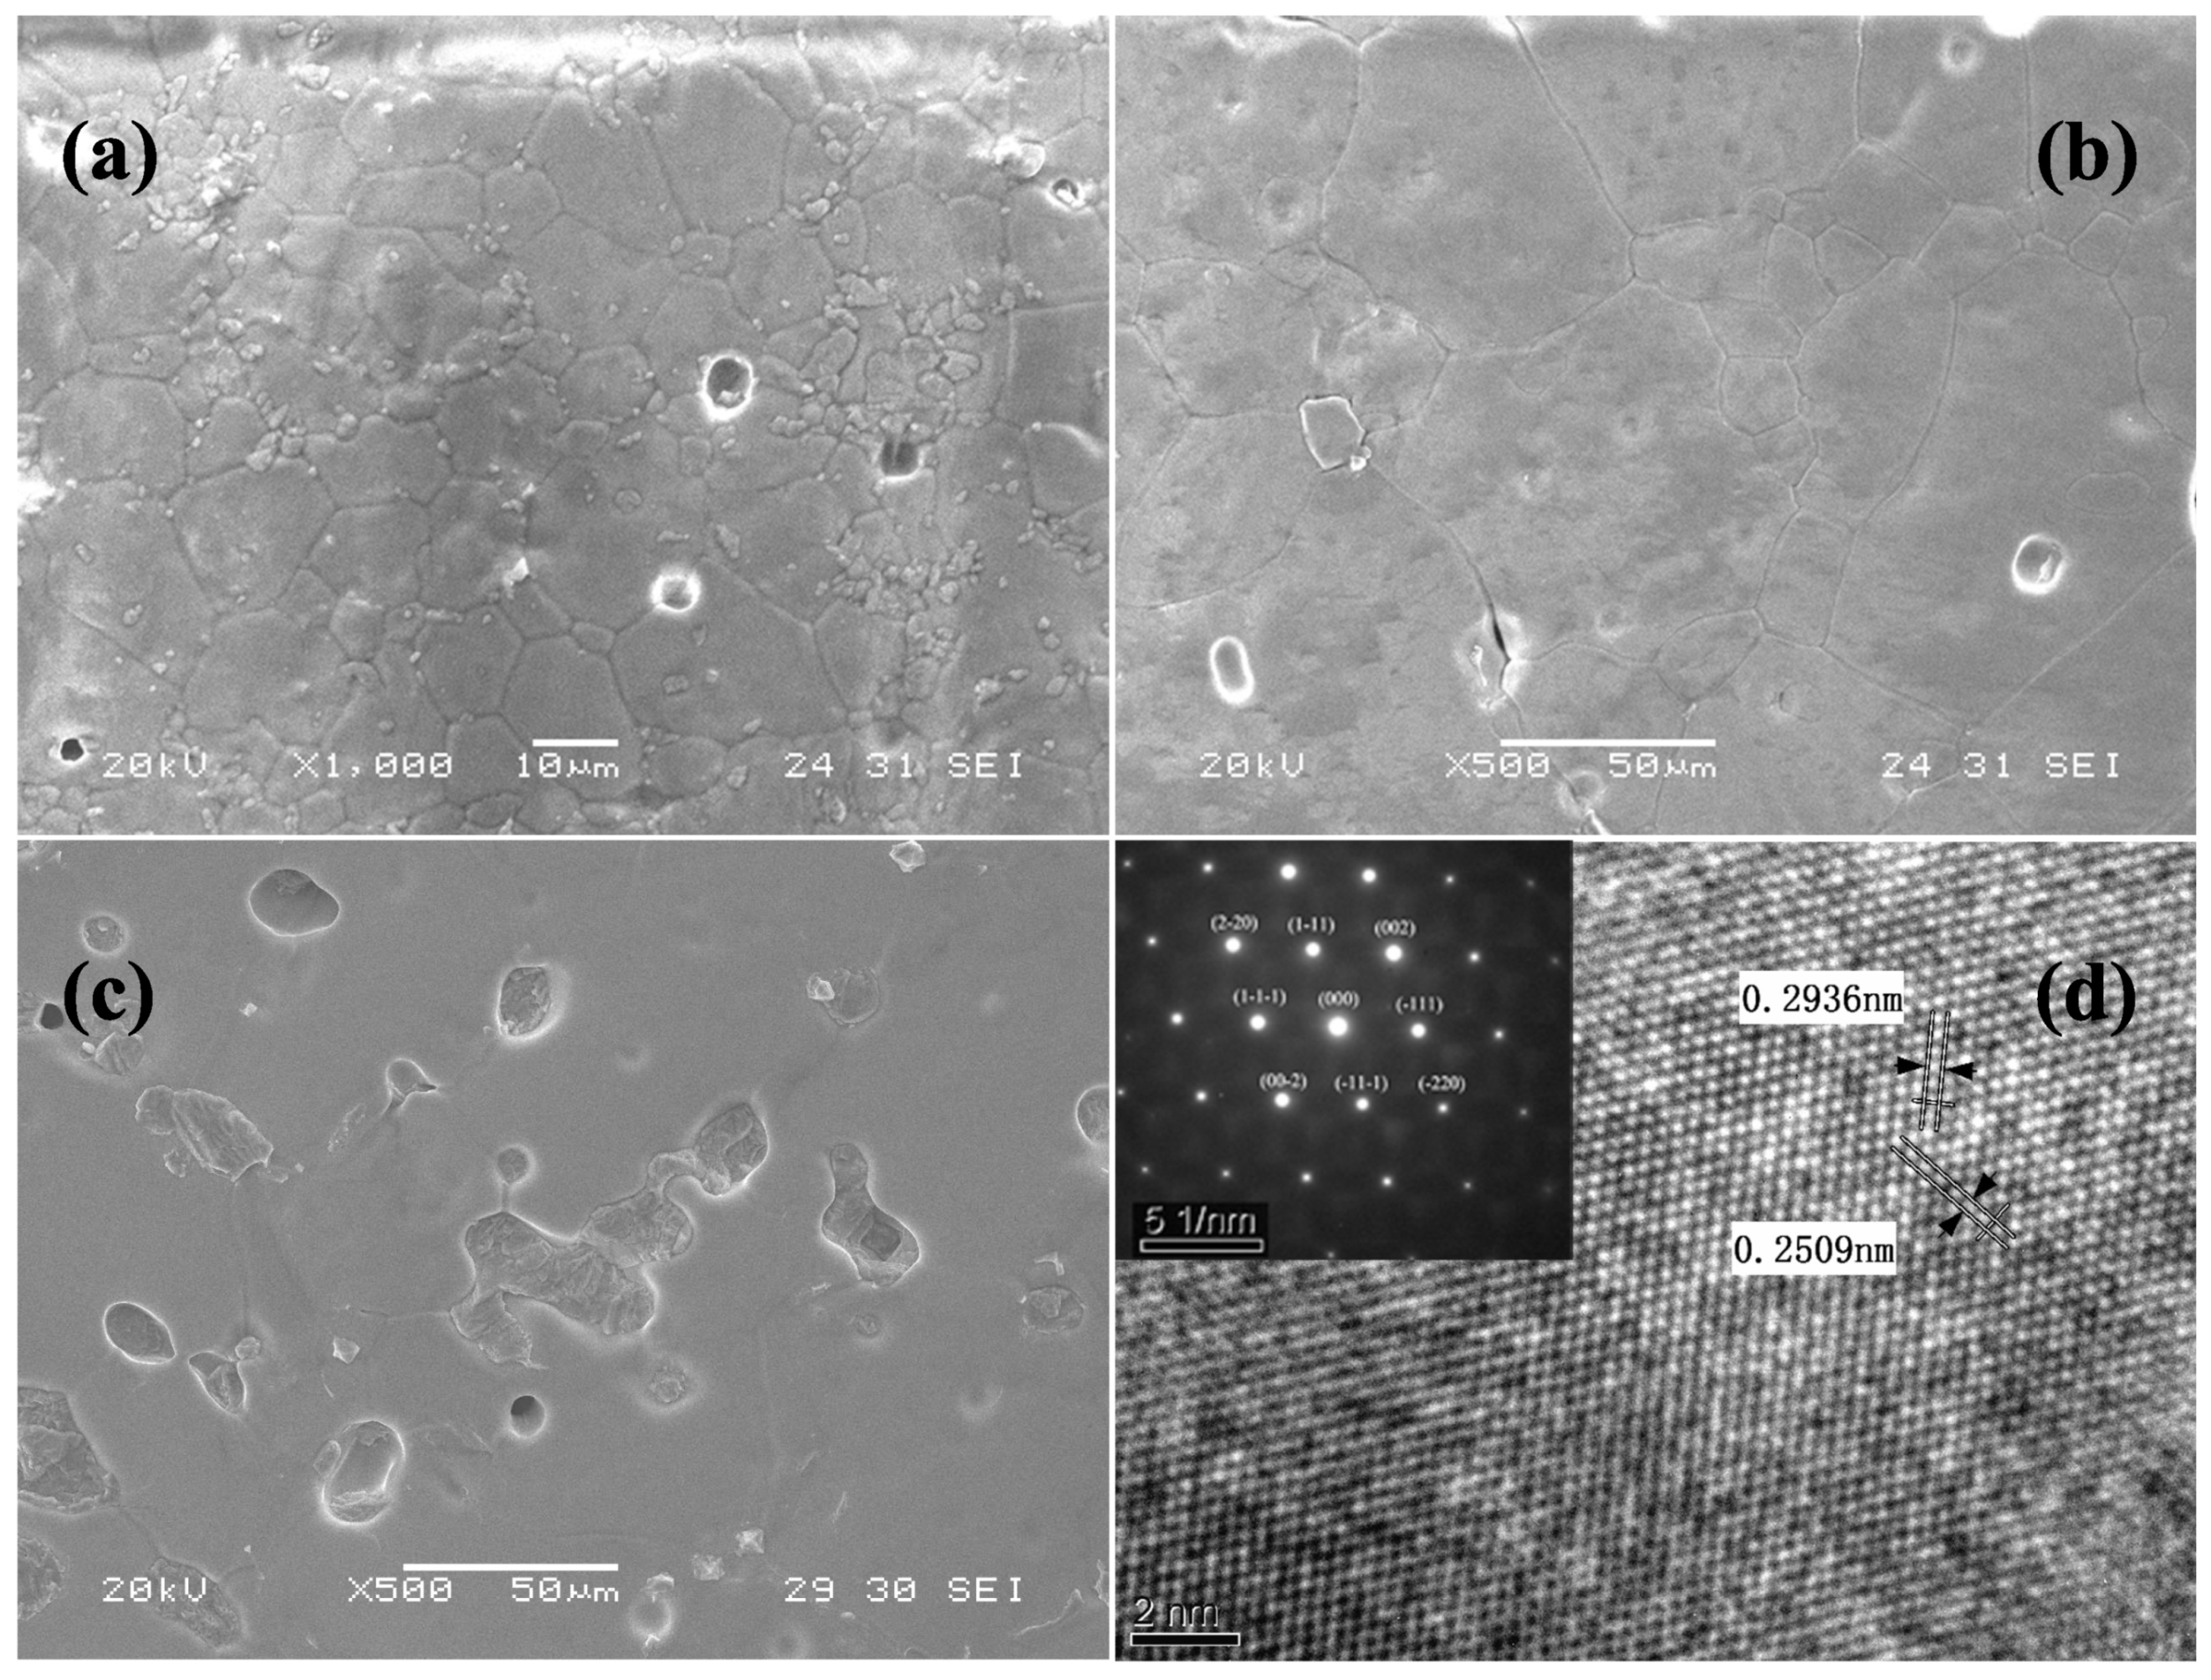
Figure 2a–c presents the SEM micrographs of the surface of O specimens after thermal etching. Well-developed isometric grains are formed in all of the samples. Based on the statistics of a large number of grains, the average grain size of O was determined to be 20, 50, and 60 m, corresponding to the Mn contents of 0.15, 0.20, and 0.25, respectively. Transition-metal-oxides as sintering aids can facilitate the sintering process of zirconia [21]. It means that higher MnO doping content can result in increasing the grain growth of cubic zirconia. Due to the difference of the sintered precursor, the average grain sizes in this study are larger than those reported in our previous study [19]. However, inhomogeneous grain size distribution and residual porosity can also be observed in all the samples. Besides, compared to the clean grain boundary in the x = 0.15 and 0.20 samples, the impurities on the grain boundary of the ZrMnO sample can be obviously observed, which may be due to the grain boundary segregation of the doping element, though the solubility limit of Mn ions in ZrO is reported to be 25 at.% [20]. To examine the intragrain microstructure, Figure 2d shows the typical HRTEM image of the ZrMnO sample. Lattice fringes observed in HRTEM appear regularly. The interplanar spacing value measured for (111) and (200) planes are 0.2936 nm and 0.2509 nm, respectively. Thus, this matrix can be assigned to the corresponding lattice structure of cubic ZrO. Selected area electron diffraction (SAED) pattern is obtained along [110] zone axis of the ZrMnO composition. Observed diffraction spots are identified and indexed with cubic ZrO reflections. The HRTEM images and SAED patterns of the other two compositions are nearly the same with the ZrMnO samples. It signifies that all the samples in our study are entirely composed of c-ZrO phase and there is no contamination.

Figure 2.
(a–d) SEM micrographs of O solid solution (a) x = 0.15, (b) x = 0.20, (c) x = 0.25, HRTEM images and the SAED pattern from a single grain of ZrMnO along the [110] zone axis.
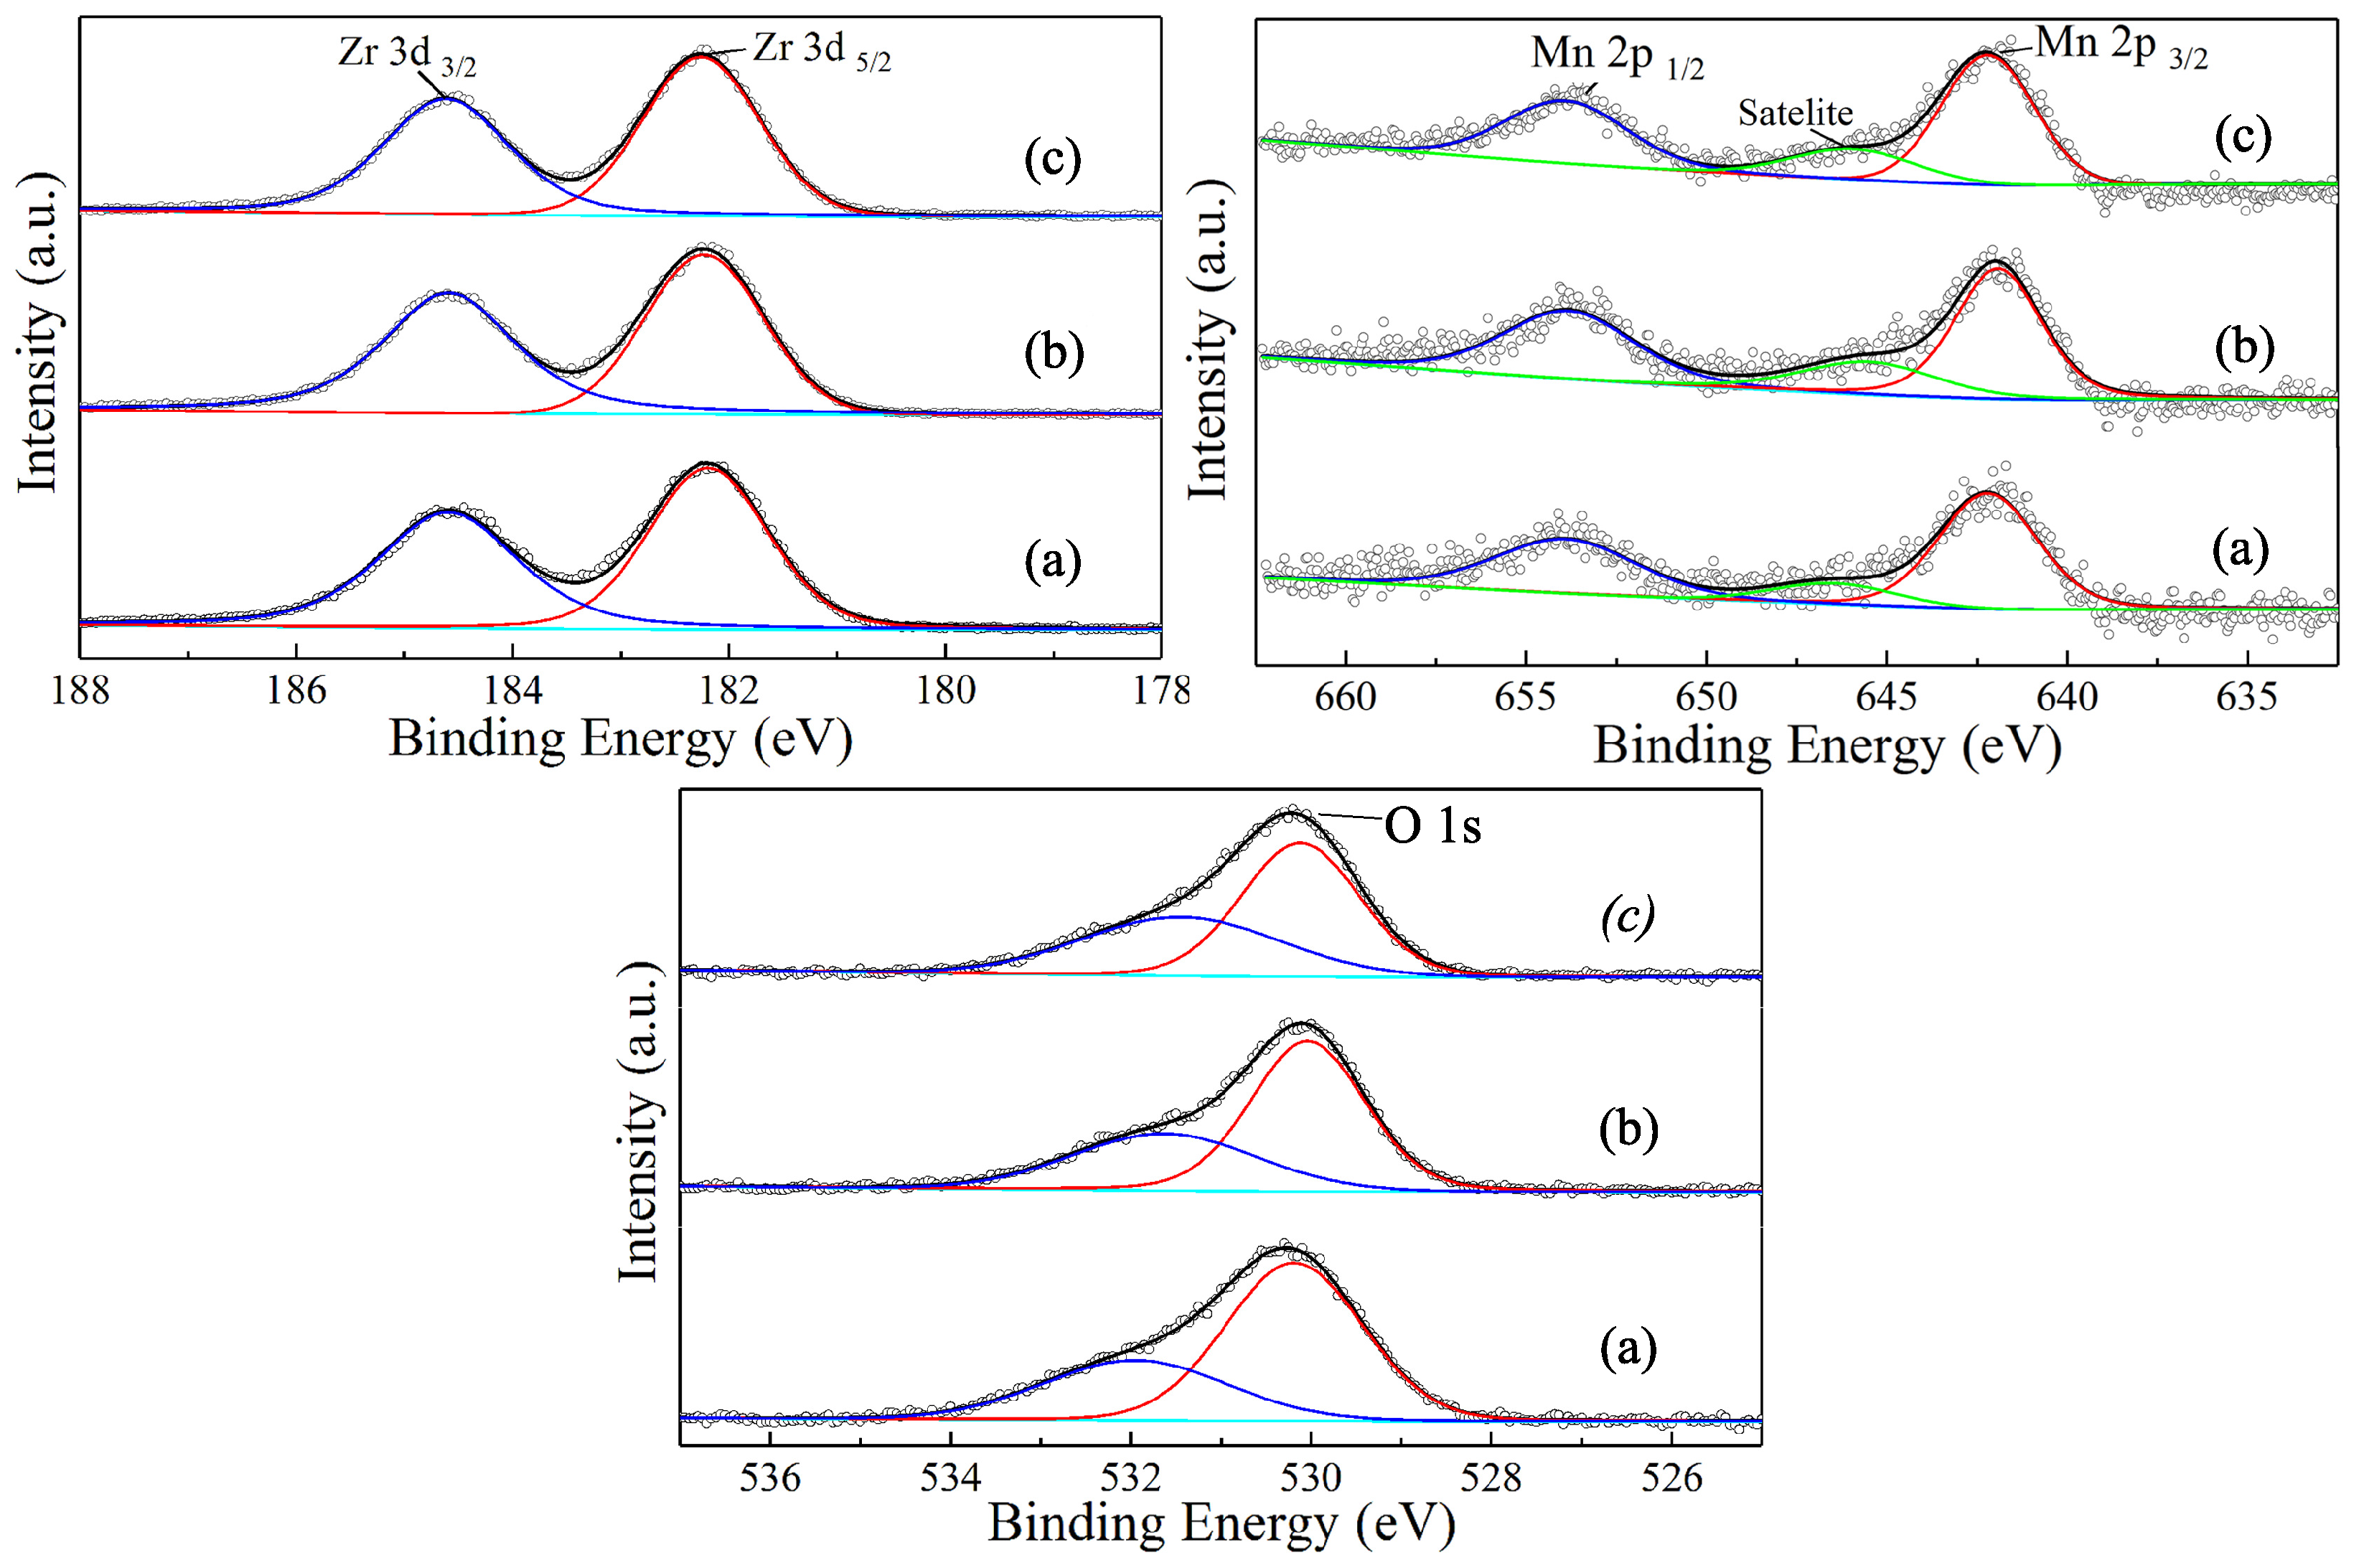
In order to explain why Mn ion doping can result in the formation of cubic ZrO, the chemical composition and elementary oxidation state of the powders crushed from O ceramic were tested by XPS analysis. The high resolution spectra for Zr 3d, Mn 2p and O 1s are shown in Figure 3. The Zr 3d spectra of all the samples consist of Zr 3d at 182.2 eV and Zr 3d at 184.6 eV peaks with a peak separation of 2.4 eV, and correspond to the LS coupling value found for Zr (IV) in the oxide [22]. A closer comparison has found that the characterization peak of Zr 3d shifts to higher binding energy by increasing the Mn content. Two main peaks from Mn 2p and Mn 2p can be observed. The Mn 2p peak is located at 641.6 eV with a satellite peak corresponding to the existence of Mn in O matrix. The XPS spectra of O 1s is used to investigate the presence of oxygen vacancies. Two separate peaks located at 530.3 eV and 531.7 eV can be attributed to the lattice oxygen and non-lattice oxygen (i.e. oxygen vacancy), respectively [23]. The relative amount of the oxygen vacancy are 32.31%, 32.9%, and 35.02% as obtained from the corresponding peak area. It indicates that the concentration of oxygen vacancy has increased with the increasing doping content. Cubic ZrO containing higher MnO will yield higher ionic conduction. The XRD, SEM, and XPS results indicate that O ceramics made with this method are a single cubic phased structure with a high concentration of oxygen vacancy. It means that O ceramics can fulfill the structural requirement and can be a potential candidate for electrolyte.
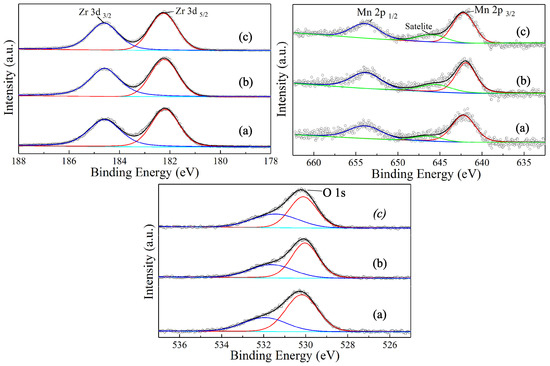
Figure 3.
XPS high resolution spectrum of Zr 3d, Mn 2p and O 1s for O (a) x = 0.15, (b) x = 0.2, (c) x = 0.25.
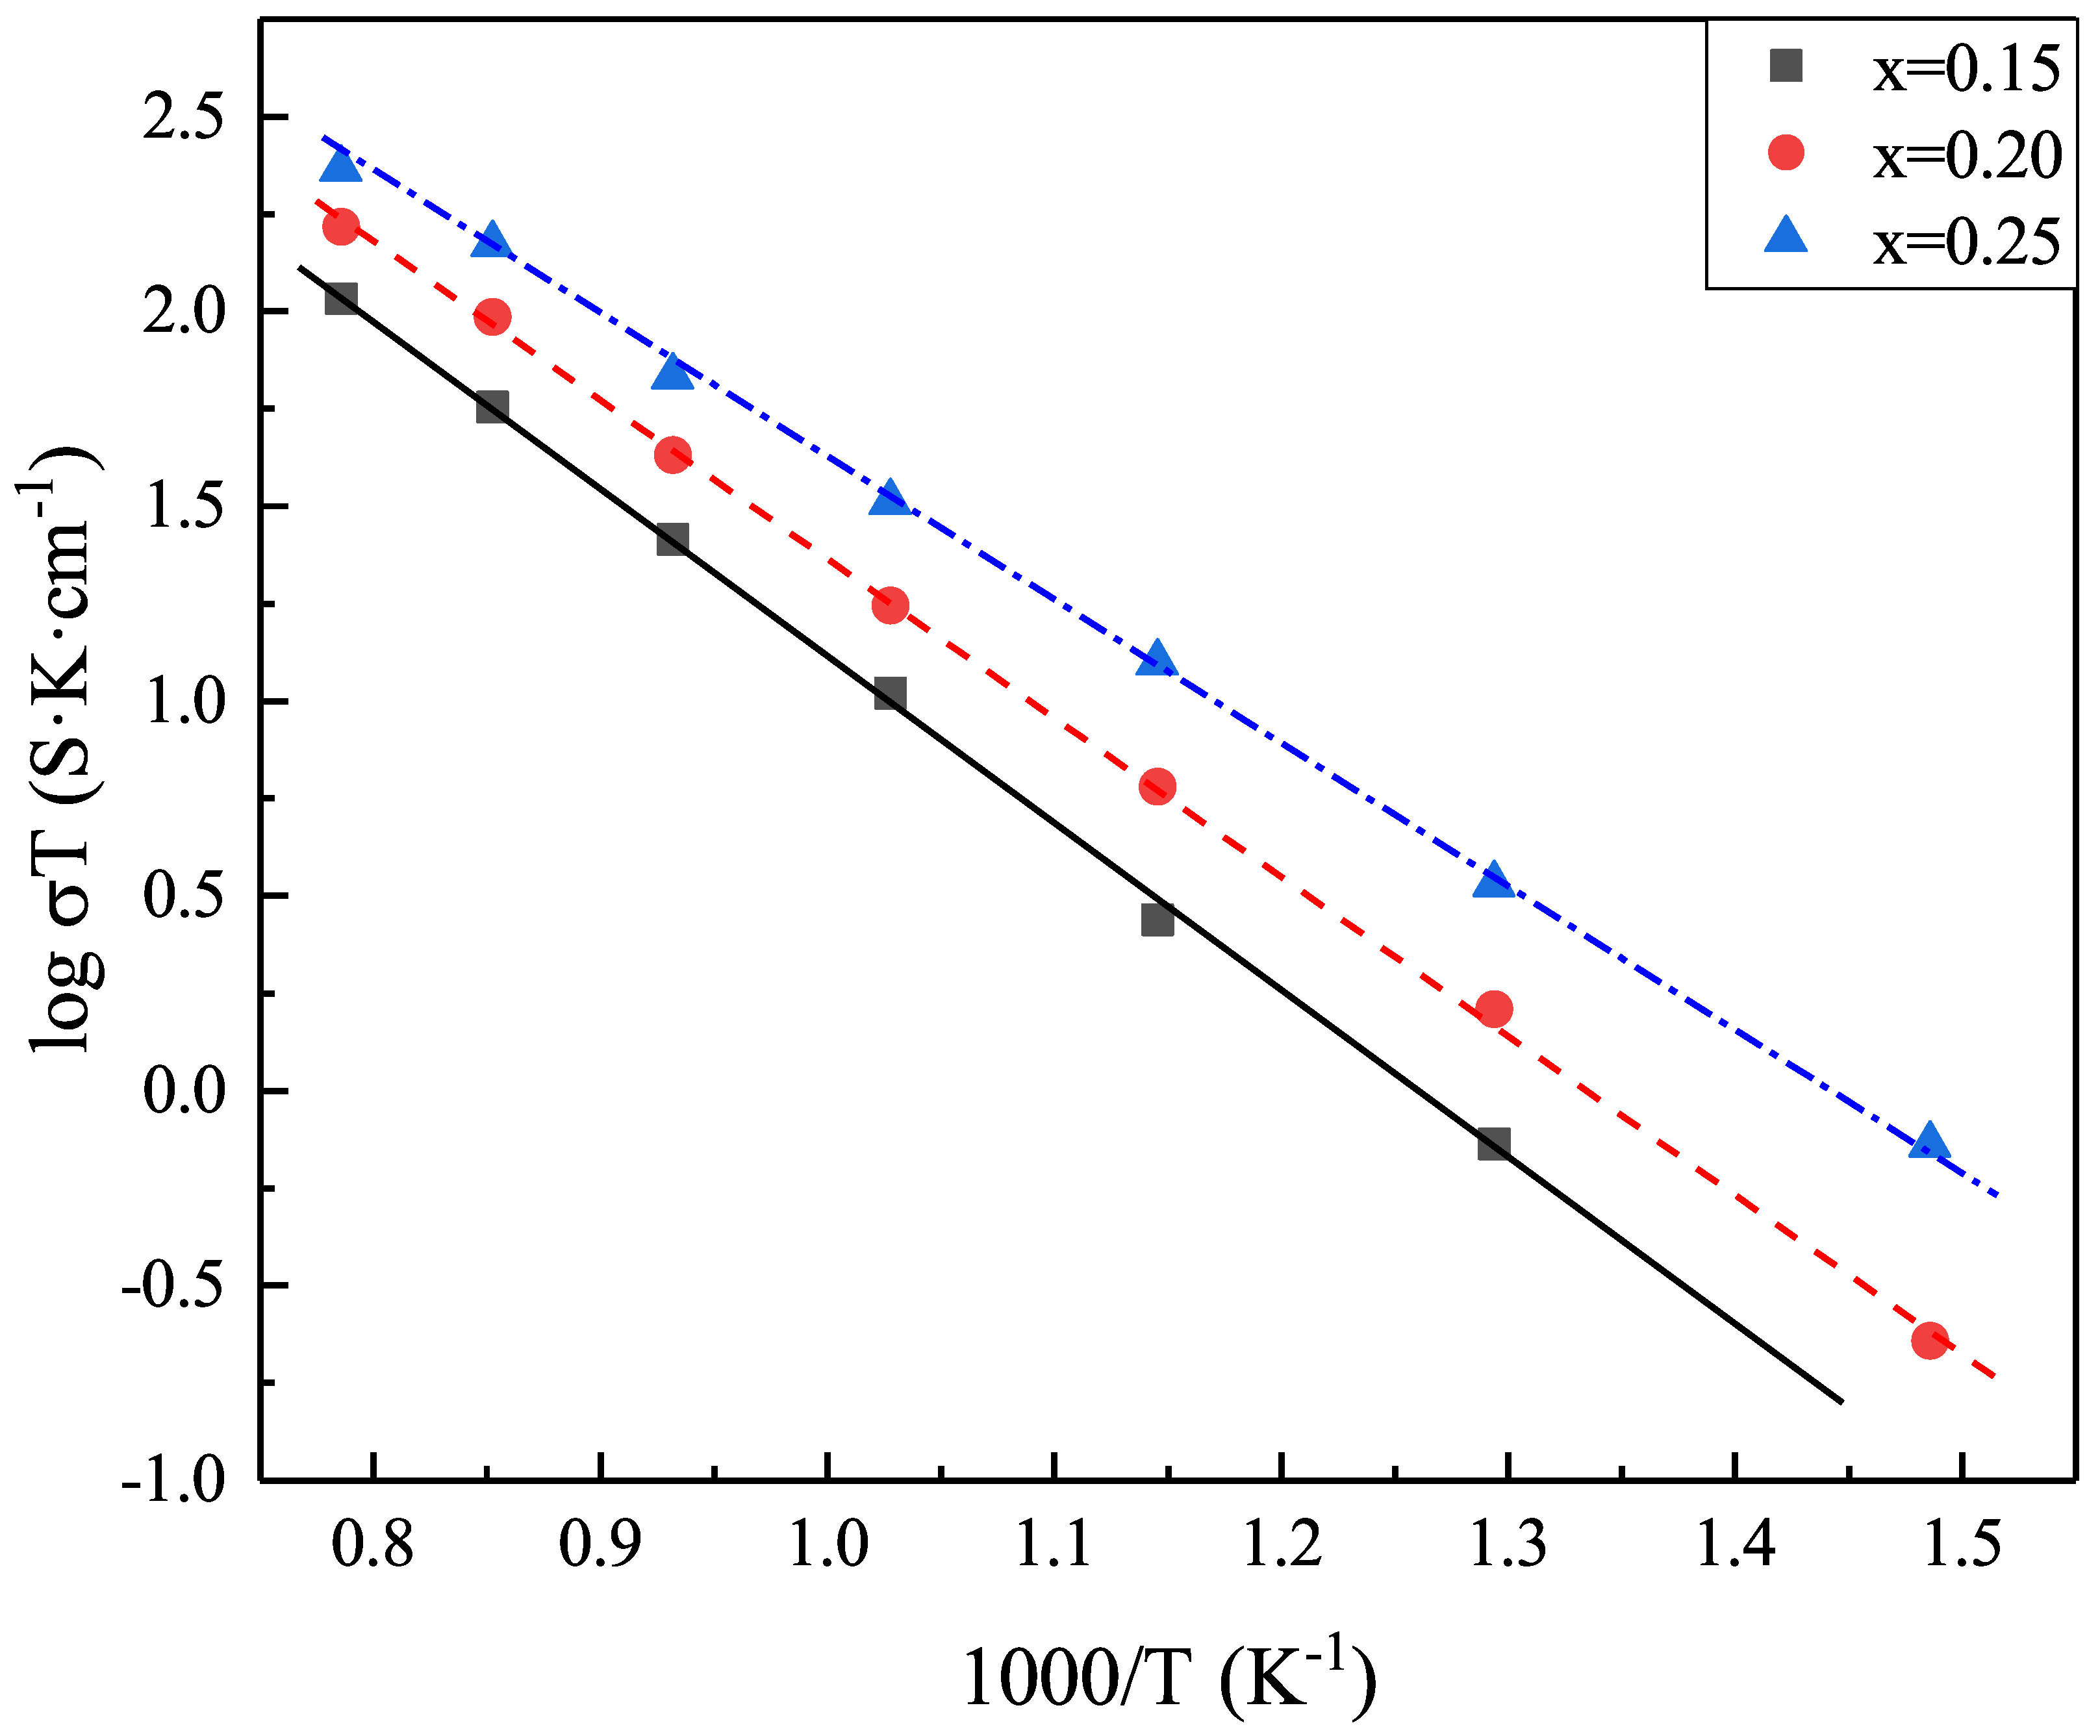
Figure 4 displays the typical Arrhenius plots of the total electrical conductivity of O measured between C and C in air with the method of 4-probe DC method. The total electrical conductivity increases with the increasing Mn content. As listed in Table 1, the single cubic phased O samples exhibit high electro-conductivity at high temperatures. The highest conductivity reaches 0.0144 S/cm and 18.2 S/cm at C and C, respectively. In a previous report, the highest ionic conductivity was obtained in 8 mol% YSZ electrolyte with the values of 0.0039 S/cm and 0.140 S/cm at C and C, respectively [6]. Compared with these values, the conductivity of ZrMnO is nearly the same as 8YSZ at different operating temperatures. The conductivity of 11ScSZ at C is almost the same with that of the 8YSZ and MnSZ eletrolytes at C. However, the conductivity of 11ScSZ sharply decreases to 0.0001 S/cm. Compared with ScSZ, the conductivity of ZrMnO is obviously higher at intermediate-temperatures. It is worth mentioning that the conductivity value of 0.0144 S/cm is twice higher than 8YSZ and two orders of magnitude higher than that of the ScSZ, and can fulfill the conductivity requirement (∼1 S/cm) for the electrolyte at C. This high conductivity of Mn-stabilized ZrO ceramics has, to the best of our knowledge, not been reported previously.
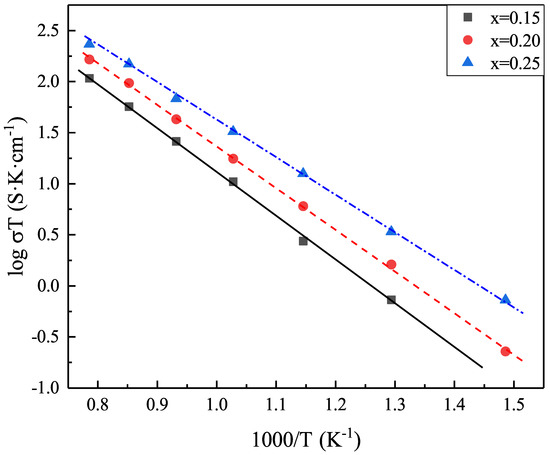
Figure 4.
Arrhenius plots for total conductivities with four-probe DC methods.

Table 1.
Specific conductance at different temperatures and activation energy values for O, 8YSZ and 11ScSZ.
The activation energy (E) values of O specimens were also listed in Table 1, determined by fitting the curves with the equation:
The Arrhenius plot with linear behavior indicates that O compounds are highly ion conducting and their conductivity increases with increasing temperature and MnO doping content. The activation energy value of the O ceramics decreases with the increasing Mn doping content. The higher the concentration of Mn, the higher the migration rate of the oxygen vacancy charge carrier. The lowest activation energy (0.72 eV) is lower than that for YSZ (0.84 eV), but higher than that for ScSZ (0.70 eV). It means that the ionic migration in Mn-stabilized ZrO is much easier than in Y-stabilized ZrO, but harder than in Sc-stabilized ZrO.
4. Conclusions
Cubic phase Mn-stabilized ZrO samples containing 15, 20, and 25 at.% Mn were synthesized using a traditional solid state reaction method at C for 12 h. A detailed microstructural characterization employing the Rietveld refinement method reveals that Mn ions entered the ZrO crystal lattice in the form of Mn and O are composed of single cubic ZrO phase. Both the grain size and oxygen vacancy concentration increased with th increasing Mn doping content. The decrease in the lattice parameter corroborates with the increase in oxygen vacancy with the increase in MnO concentration in the ZrO lattice. Ionic conductivity of all O are found to increase with the increasing Mn content as well as temperature. The highest conductivity was observed from the ZrMnO samples, which reached 0.0144 S/cm and 0.182 S/cm at C and C, respectively. The obtained results proved that this compound is promising for IT-SOFC application. The future scope of this work includes researching the ionic and electron conductivity of the Mn-stabilized ZrO system more systematically, identifying a method for grain refinement and evaluating the stability of the resulting microstructure and performance.
Author Contributions
Validation, S.Z. and L.J.; formal analysis, H.Z.; investigation, R.G.; data curation, C.J. and Y.W.; writing—review and editing, L.G.; supervision, J.W. All authors have read and agreed to the published version of the manuscript.
Funding
This research received no external funding.
Institutional Review Board Statement
Not applicable.
Informed Consent Statement
Not applicable.
Data Availability Statement
Not applicable.
Acknowledgments
This work was financially supported by the National Natural Science Foundation of China (Grant No. 51502235 and Grant No. 51777172), Natural Science Foundation of Shaanxi Province (Grant No. 2021JQ-884) and Science and Technology Research Project of Yingkou Institute of Technology (Grant No. 110505010).
Conflicts of Interest
The authors declare no conflict of interest.
References
- Zakaria, Z.; Kamarudin, S.K. Enhancement on the Quaternized sodium alginate/polyvinyl alcohol membrane performance in the application of passive DEFCs. Mater. Lett. 2022, 309, 131388. [Google Scholar] [CrossRef]
- Bonnet, E.; Grenier, J.C.; Bassat, J.M.; Jacob, A.; Delatouche, B.; Bourdais, S. On the ionic conductivity of some zirconia-derived high-entropy oxides. J. Eur. Ceram. Soc. 2021, 41, 4505–4515. [Google Scholar] [CrossRef]
- Abdalaa, P.M.; Lamas, D.G.; Fantini, M.C.A.; Craievich, A.F. Retention at room temperature of the tetragonal t”-form in Sc2O3-doped ZrO2 nanopowders. J. Alloys Compd. 2010, 495, 561–564. [Google Scholar] [CrossRef]
- Sarat, S.; Sammes, N.; Smirnova, A. Bismuth oxide doped scandia-stabilized zirconia electrolyte for the intermediate temperature solid oxide fuel cells. J. Power Sources 2006, 160, 892–896. [Google Scholar] [CrossRef]
- Shukla, V.; Kumar, A.; Basheer, I.L.; Balani, K.; Subramaniam, A.; Omar, S. Structural Characteristics and Electrical Conductivity of Spark Plasma Sintered Ytterbia Co-doped Scandia Stabilized Zirconia. J. Am. Ceram. Soc. 2017, 100, 204–214. [Google Scholar] [CrossRef] [Green Version]
- Arachi, Y.; Sakai, H.; Yamamoto, O.; Takeda, Y.; Imanishai, N. Electrical conductivity of the ZrO2—Ln2O3 (lanthanides) system. Solid State Ionics 1999, 121, 133–139. [Google Scholar] [CrossRef]
- Dravid, V.P.; Ravikumar, V.; Notis, M.R.; Lyman, C.E.; Dhalenne, G.; Revcolevschi, A. Stabilization of Cubic Zirconia with Manganese Oxide. J. Am. Ceram. Soc. 1994, 77, 2758–2762. [Google Scholar] [CrossRef]
- Valigi, M.; Gazzoli, D.; Dragone, R.; Marucci, A.; Matteib, G. Manganese oxide-zirconium oxide solid solutions. An X-ray diffraction, Raman spectroscopy, thermogravimetry and magnetic study. J. Mater. Chem. 1996, 6, 403–408. [Google Scholar] [CrossRef]
- Choudhary, V.R.; Uphade, B.S.; Pataskar, S.G.; Keshavaraja, A. Low-temperature complete combustion of methane over Mn-, Co-, and Fe-stabilized ZrO2. Angew. Chem. Int. Ed. Engl. 1996, 35, 2393–2395. [Google Scholar] [CrossRef]
- Ostanin, S.; Ernst, A.; Sandratskii, L.M.; Bruno, P.; Däne, M.; Hughes, I.D.; Staunton, J.B.; Hergert, W.; Mertig, I.; Kudrnovský, J. Mn-stabilized zirconia: From imitation diamonds to a new potential high-TC ferromagnetic spintronics material. Phys. Rev. Lett. 2007, 98, 016101. [Google Scholar] [CrossRef] [Green Version]
- Pucci, A.; Clavel, G.; Willinger, M.G.; Zitoun, D.; Pinna, N. Transition Metal-Doped ZrO2 and HfO2 Nanocrystals. J. Phys. Chem. C 2009, 113, 12048–12058. [Google Scholar] [CrossRef]
- Zakaria, Z.; Kamarudin, S.K.; Timmiati, S.N. Influence of Graphene Oxide on the Ethanol Permeability and Ionic Conductivity of QPVA-Based Membrane in Passive Alkaline Direct Ethanol Fuel Cells. Nanoscale Res. Lett. 2019, 14, 28. [Google Scholar] [CrossRef] [PubMed] [Green Version]
- Pal, S.; Mondal, R.; Guha, S.; Chatterjee, U.; Jewrajka, S.K. Homogeneous phase crosslinked poly(acrylonitrile-co-2-acrylamido-2-methyl-1-propanesulfonic acid) conetwork cation exchange membranes showing high electrochemical properties and electrodialysis performance. Polymer 2019, 180, 121680. [Google Scholar] [CrossRef]
- Kawada, T.; Sakai, N.; Yokokawa, H.; Doklya, M. Electrical properties of transition-metal-doped YSZ. Solid State Ionics 1992, 53, 418–425. [Google Scholar] [CrossRef]
- Pomykalska, D.; Bućko, M.M.; Rekas, M. Electrical conductivity of MnOx-Y2O3-ZrO2 solid solutions. Solid State Ionics 2010, 181, 48–52. [Google Scholar] [CrossRef]
- Kim, J.H.; Choi, G.M. Mixed ionic and electronic conductivity of [(ZrO2)0.92(Y2O3)0.08]1−y · (MnO1.5)y. Solid State Ionics 2000, 130, 157–168. [Google Scholar] [CrossRef]
- Lei, Z.; Zhu, Q.S. Phase transformation and low temperature sintering of manganese oxide and scandia co-doped zirconia. Mater. Lett. 2007, 61, 1311–1314. [Google Scholar] [CrossRef]
- Nandy, A.; Dutta, A.; Pradhan, S.K. Effect of Manganese (II) Oxide on microstructure and ionic transport properties of nanostructured cubic zirconia. Electrochem. Acta 2015, 170, 360–368. [Google Scholar] [CrossRef]
- Gao, L.; Xie, M.J.; Jin, L.H.; Wang, Y.; Jin, C.Q.; Zhao, Y.H. Mn-stabilized zirconia ceramics: Phase transformation and mixed ionic-electronic conductivity. Ceram. Int. 2018, 44, 19383–19389. [Google Scholar] [CrossRef]
- Gao, L.; Zhou, L.; Li, C.S.; Feng, J.Q.; Lu, Y.F. Kinetics of stabilized cubic zirconia formation from MnO2-ZrO2 diffusion couple. J. Mater. Sci. 2013, 48, 974–977. [Google Scholar] [CrossRef]
- Herle, J.V.; Vasquez, R. Conductivity of Mn and Ni-doped stabilized zirconia electrolyte. J. Eur. Ceram. Soc. 2004, 24, 1177–1180. [Google Scholar] [CrossRef]
- Rahaman, M.A.; Rout, S.; Thomas, J.P.; McGillivary, D.; Leung, K.T. Defect-rich dopant-free ZrO2 nanostructures with superior dilute ferromagnetic semiconductor properties. J. Am. Chem. Soc. 2016, 138, 11896–11906. [Google Scholar] [CrossRef] [PubMed]
- Renuka, L.; Anantharaju, K.S.; Sharma, S.C.; Nagaswarupa, H.P.; Prashantha, S.C.; Nagabhushana, H.; Vidya, Y.S. Hollow microspheres Mg-doped ZrO2 nanoparticles: Green assisted synthesis and applications in photocatalysis and photoluminescence. J. Alloys Compd. 2016, 672, 609–622. [Google Scholar] [CrossRef]
Publisher’s Note: MDPI stays neutral with regard to jurisdictional claims in published maps and institutional affiliations. |
© 2022 by the authors. Licensee MDPI, Basel, Switzerland. This article is an open access article distributed under the terms and conditions of the Creative Commons Attribution (CC BY) license (https://creativecommons.org/licenses/by/4.0/).