Abstract
The ZnGeP2 crystal is a material of choice for powerful mid-IR optical parametric oscillators and amplifiers. In this paper, we present the experimental analysis of the optical damage threshold of ZnGeP2 nonlinear crystals induced by a repetitively-pulsed Ho3+:YAG laser at 2091 nm. Two types of ZnGeP2 crystals grown under different conditions were examined using the laser and holographic techniques. The laser-induced damage threshold (LIDT) determined by the pulse fluence or peak intensity was studied as a function of the pulse repetition rate (PRR) and laser exposure duration. The main crystal structure factor for a higher LIDT was found to be a reduced dislocation density of crystal lattice. The ZnGeP2 nonlinear crystals characterized by the high structural perfection with low density of dislocations and free from twinning and stacking faults were measured to have a 3.5 J/cm2 pulse fluence damage threshold and 10.5 MW/cm2 peak intensity damage threshold at 12 kHz PRR; at 40 kHz PRR the pulse fluence damage threshold increased to over 6 J/cm2, but the peak intensity damage threshold dropped to 5.5 MW/cm2.
1. Introduction
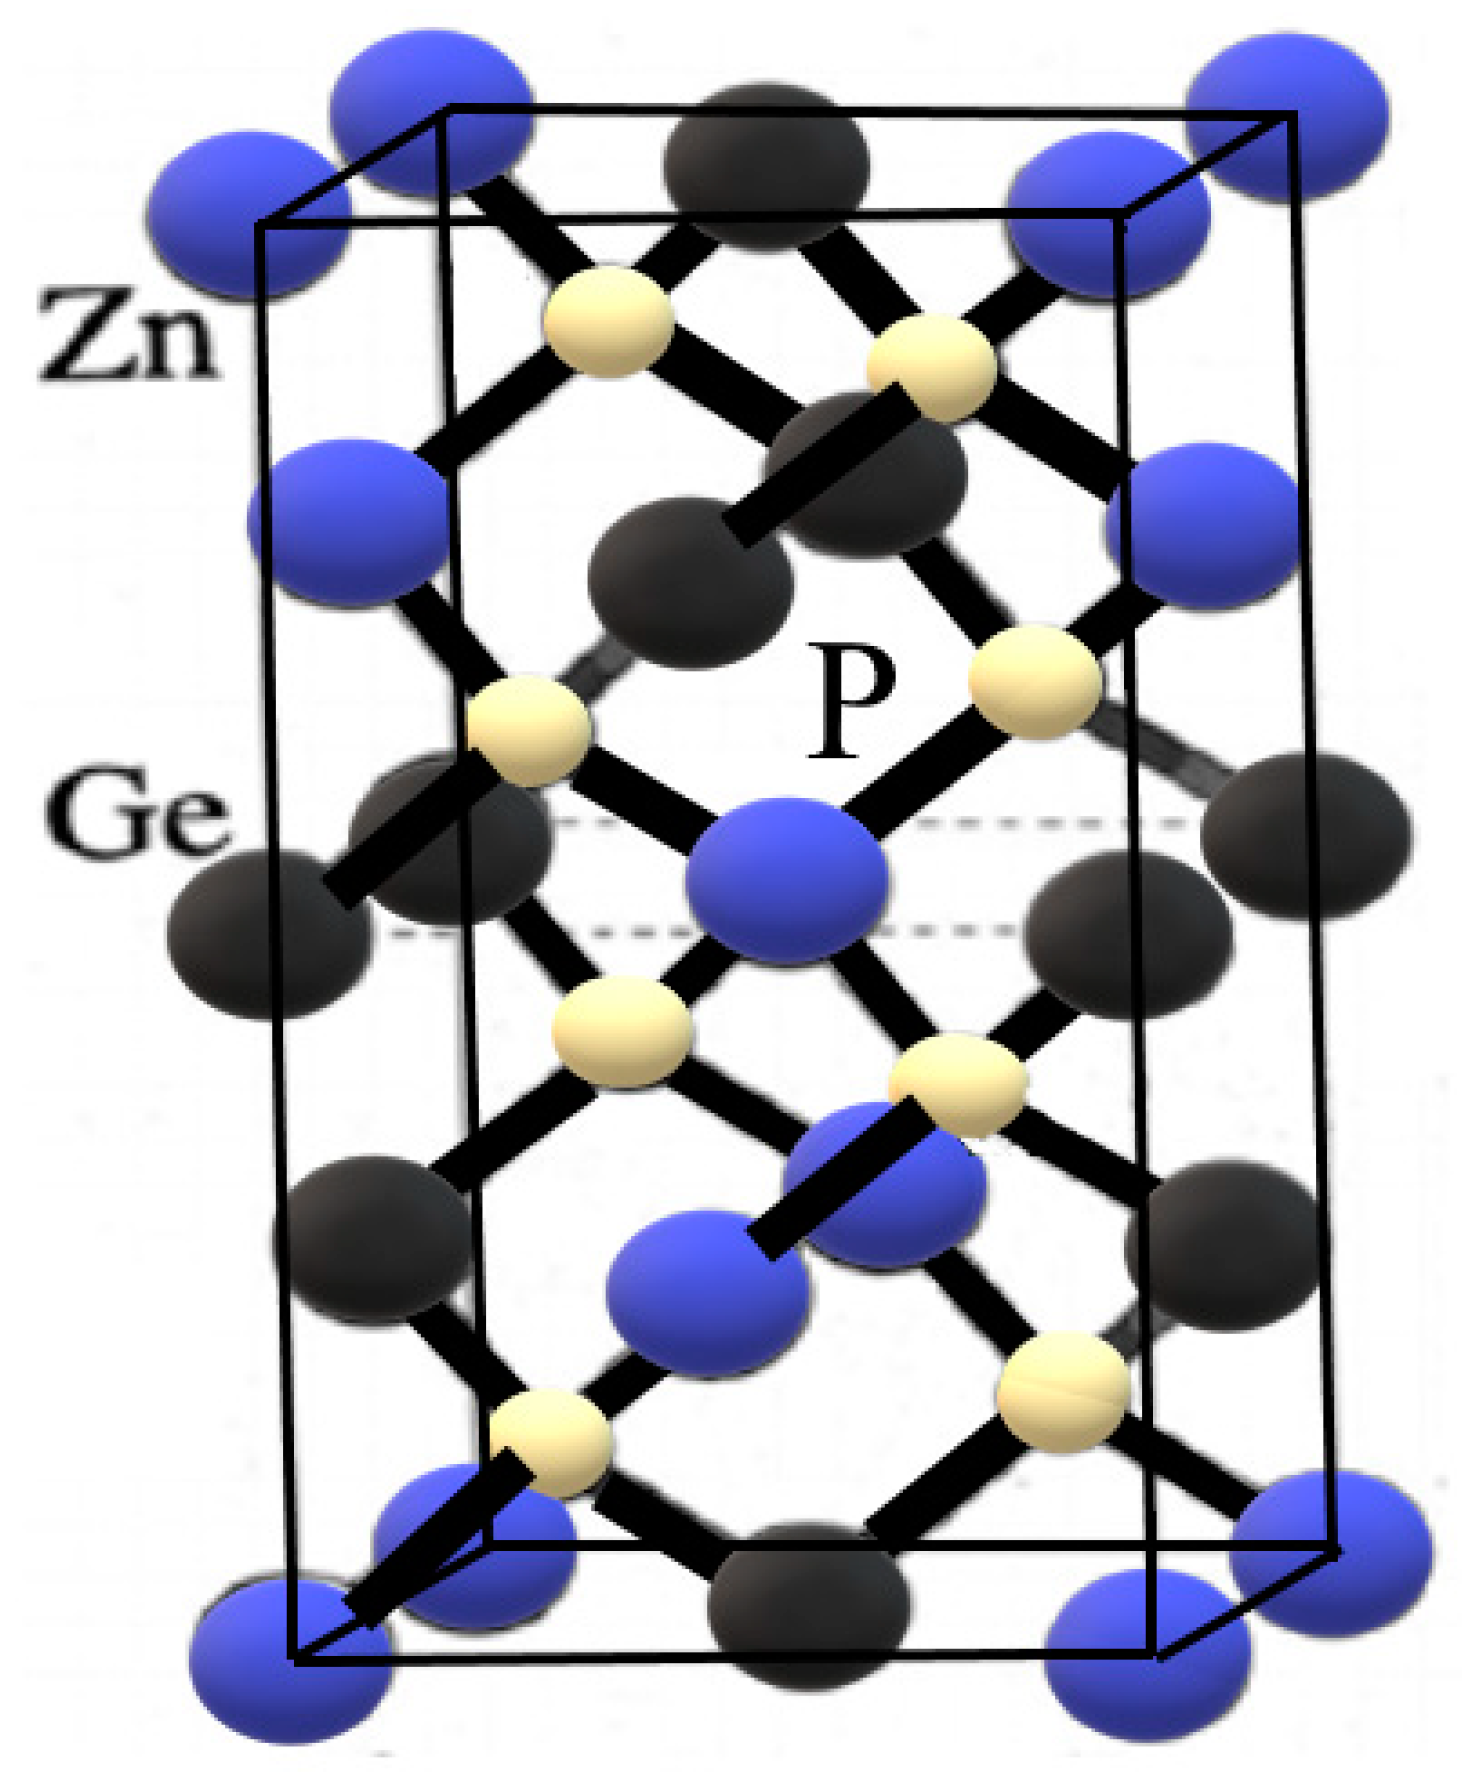
The ZnGeP2 crystal is a non-linear positive (ne > no) uniaxial crystal with a 42 m point group, a chalcopyrite-type crystal lattice (Figure 1), and a mass density of 4.16 g/cm3. The Maos hardness of ZnGeP2 is 5.5.

Figure 1.
The crystal structure of ZnGeP2 is of the chalcopyrite type. Zn, Ge, P are the atoms of the crystal lattice.
Zinc germanium diphosphide (ZGP) is an attractive material for mid-IR nonlinear applications due to its high χ(2) nonlinear coefficient (d2 = 75 pm/V), high thermal conductivity (35 W/m*K), and a broad transmission range (0.65–12 μm) limited by an intrinsic defect absorption at wavelengths shorter than 2.0 μm and a multi-phonon absorption with peaks at 8.9 and 12 μm. These properties, together with high birefringence that provides phase matching for a 2–3 μm pump, render ZGP to be a material of choice for mid-IR optical parametric oscillators (OPOs) operating between 2 and 8 μm [1].
Today, the most powerful mid-IR OPOs are made based on ZGP crystals pumped by laser radiation at a wavelength of ~2.1 μm [1]. The ZGP-based OPOs can generate radiation in the wavelength range of 3.7–4.8 μm with an average power of up to 160 W or an energy per pulse of up to 200 mJ with a pulse width of 20–40 ns and a pulse repetition rate (PRR) from 1 Hz to ~140 kHz [2,3,4]. In this regard, the potential for the practical use of powerful mid-IR OPOs is associated with the need to determine the physical mechanisms of laser damage.
The problem of laser-induced damage of ZGP has been previously discussed in several papers [5,6,7,8,9,10,11,12,13,14]. In 1995, the laser-induced damage threshold (LIDT) of the ZGP surface at 2.1 µm was reported to be contingent on the pump pulse fluence and was almost independent of the radiation intensity; damage always occurred at the sample surface rather than in the bulk [5]. An increase in the ZGP LIDT at 10 µm with a decrease in the pump pulse duration, reported in [6], was assumed to indicate the thermal nature of optical damage for nanosecond pulses due to anomalous infrared absorption. However, in another paper published in 2001, the ZGP LIDT at 9.55 μm was determined by the beam intensity [7]. In 2006, it was shown that the improvement of the polishing quality of working surfaces and the reduction or complete removal of the near-surface fractured layer lead to an increase in the LIDT determined by fluence [8]. The LIDT fluence of a ZGP crystal with the improved surface polishing and the antireflection coatings at 2.05 µm was reported in 2006 to be ~2 J/cm2 at the pulse repetition rate of ~10 kHz [8]. In 2018, the LIDT of 4 J/cm2 at ~2.1 μm and the pulse repetition rate of 10 kHz was reported in ZGP single crystals of the same manufacturer (“BAE Systems”, Falls Church, VA, USA) [10]. The LIDT of the magnetorheological polished ZGP surfaces with the angstrom-scale surface roughness was found to be determined by the number of point depressions caused by the physical limitations of the structural perfection of the crystal lattice [11]. These results were in good agreement with the assumption that the quality of the ZGP crystal lattice has a profound effect on the surface LIDT [12]. The presence of non-stoichiometric inhomogeneities on an antireflection coated ZGP surface was assumed to decrease the crystal LIDT due to the localized mechanical stress and scattering of incident laser radiation, even in the absence of bulk and linear defects inside the crystal. In turn, the absence of local fluctuations of the composition and mechanical loads in a coated sample was assumed to increase the LIDT compared to an uncoated sample due to the closure of dangling chemical bonds emerging on the polished surface [13]. The dynamic visualization of the optical damage by laser radiation at 2.1 μm inside the ZGP volume showed that an avalanche-like increase in temperature occurs in the forming track inside the nonlinear optical element [14].
The discrepancies between the reported ZGP LIDT values and the interpretations of experimental data indicate several possible scenarios of the damage spot formation even at the same wavelength and pulse width. This fact is an indication of several complex mechanisms (thermal damage or field-induced optical breakdown), physical effects (such as multiphoton absorption, photoionization and generation of free carriers, nonlinear dependence of the thermos-optical parameters, etc.), and dynamic peculiarities (such as multiple-pulse material degradation) associated with the optical damage of the high-transmitting dielectric crystals irradiated with nanosecond laser pulses with a high repetition rate [15,16]. Nevertheless, the previous results show that the physical origin and key factors of the laser-induced damage of the ZGP single crystals are still not fully understood.
This paper is focused on evaluating the optical damage of ZGP crystals with different structural quality induced by the repetitively-pulsed Ho3+:YAG laser at 2091 nm. Two types of ZnGeP2 crystals grown in different conditions with the dissimilar crystal-lattice quality were examined. The effect of various crystal quality factors such as the impurity composition, lattice dislocations, and surface polishing are discussed. The ZGP LIDTs determined by both the pulse fluence and intensity were studied at various PRRs, pulse widths, and exposure durations.
2. Experimental Samples and Their Characteristics
The tested samples of the ZGP crystals were manufactured by the Harbin Institute of Technology (Harbin, China). Three samples cut from two different ZGP single crystals (a sample N1 from one crystal and samples N2 and N3 from another) were used to study the optical damage. Both ZGP single crystals were grown using the Bridgman method in the vertical direction on an oriented seed in a manner similar to that described in [17]. The ZGP crystals were grown under different technological parameters: the growth rate was 0.8 mm/h and 0.3 mm/h, and the temperature gradient was 8.0 K/cm and 5.0 K/cm for the N1 sample and samples of N2 and N3, respectively. The different growth parameters resulted in a difference in lattice quality of the ZGP crystals.
The first tested element (the N1 sample) had dimensions of 6 × 6 × 20 mm3. The second tested element (the N2 sample) had dimensions of 6 × 6 × 3 mm3, and the dimension of the third element (the N3 sample) was 6 × 6 × 20 mm3. The axis of all elements was oriented at angles of Ө = 54.7° and φ = 0° with respect to the crystal optical axis. This axis orientation as most suitable for ZGP OPO at 3–6 µm with 2.09 µm pumping was chosen, since the conditions of three-wave phase synchronism in this wavelength range for this angle are satisfied. The elements did not have antireflection coatings.
Holograms of the internal volume of all the samples under study were obtained using a digital holographic camera, and the obtained holographic images were reconstructed to determine internal inhomogeneities and volumetric defects (which are the result of the presence of residual synthesis components in the material [18]). The limiting resolution of the method was 3 μm (detailed description of the digital holography method, as applied to the visualization of volumetric defects in ZGP, is given in [19,20]). No volume defects were detected in the entire volume of the material in samples N1 and N2, N3 within the resolution of the used method and equipment.
ZGP single crystals, from which the samples were made, were examined for the presence of impurities. The concentration of impurity chemical elements was determined using the mass spectrometry method with inductively coupled plasma (NexION300D, PerkinElmer, Waltham, MA, USA). To perform the analysis, a solid sample was dissolved under microwave autoclave conditions (SpeedWAVE FOUR, Berghoff, Germany, Berlin) in PTFE autoclaves in a mixture of high purity mineral acids. The content of impurity elements (the concentration of which in the sample of more than 10−8 wt.% was practically the same in both ZGP single crystals under study (Figure 2).
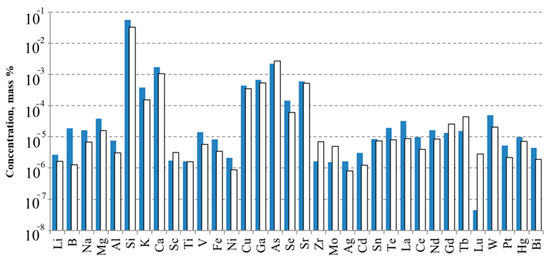
Figure 2.
Impurity composition of ZGP crystals: for the N1 sample (blue bars) and the N2 sample (white bars).
The Bormann X-ray topography (BXT) method, described in more detail in [21,22], was used to study the plates cut longitudinally to the growth axis of ZGP single-crystal ingots from which the samples were made. The plates had a thickness of ~500 μm and were mechanically and then chemically polished. The BXT method was implemented according to the scheme with a preliminary monochromatization of the X-ray beam, which allowed reducing the intensity of radiation transmitted through the crystal without diffraction, to exclude multi-wavelength scattering and to increase the resolution. A topographic camera from a three-crystal X-ray diffractometer, modified for the BXT method, was used. The topograms were recorded on nuclear photographic plates in characteristic CuKα1 radiation from a BSV-10 X-ray tube. A MIN-8 microscope and an Olympus Camedia 5060 digital camera with an optical adapter module were used to digitize topograms directly from negatives.
As shown by BXT studies, samples N2 and N3 had a higher structural perfection and lower density of inclusions. Samples N2 and N3 were free from twinning and stacking defects. On the contrary, the N1 sample had macroscopic bends, block tilt, twinning defects, and high dislocation density. The average concentration of dislocations on the plane, measured using the BXT method, was Ndis ≈ 6 × 104 cm−2 in the N1 sample and Ndis ≈ 6 × 103 cm−2 in samples N2 and N3. In our previous reports, the main types of defects detected by X-ray topography in ZGP were dislocations, growth striate, macroscopic stress fields, and microdefects [22,23]. The different growth parameters resulted in the difference in quality of the ZGP crystals.
The working surfaces of all the samples under study were processed in an identical manner on a 4-PD-200 polishing and finishing machine. The initial polishing of the working surfaces was carried out on a cambric polishing pad using a synthetic diamond powder ACM 0.5/0 (average grain size 270 nm). The material removal was ~100 μm, which allowed removing the fractured layer formed in the process of cutting the crystal into oriented plates and their preliminary grinding. Then, the samples were polished on a cambric polishing pad using a synthetic diamond powder ACM 0.25/0. The samples were then polished on a pitch polishing pad made of polishing resin using a synthetic diamond powder ACM 0.25/0.
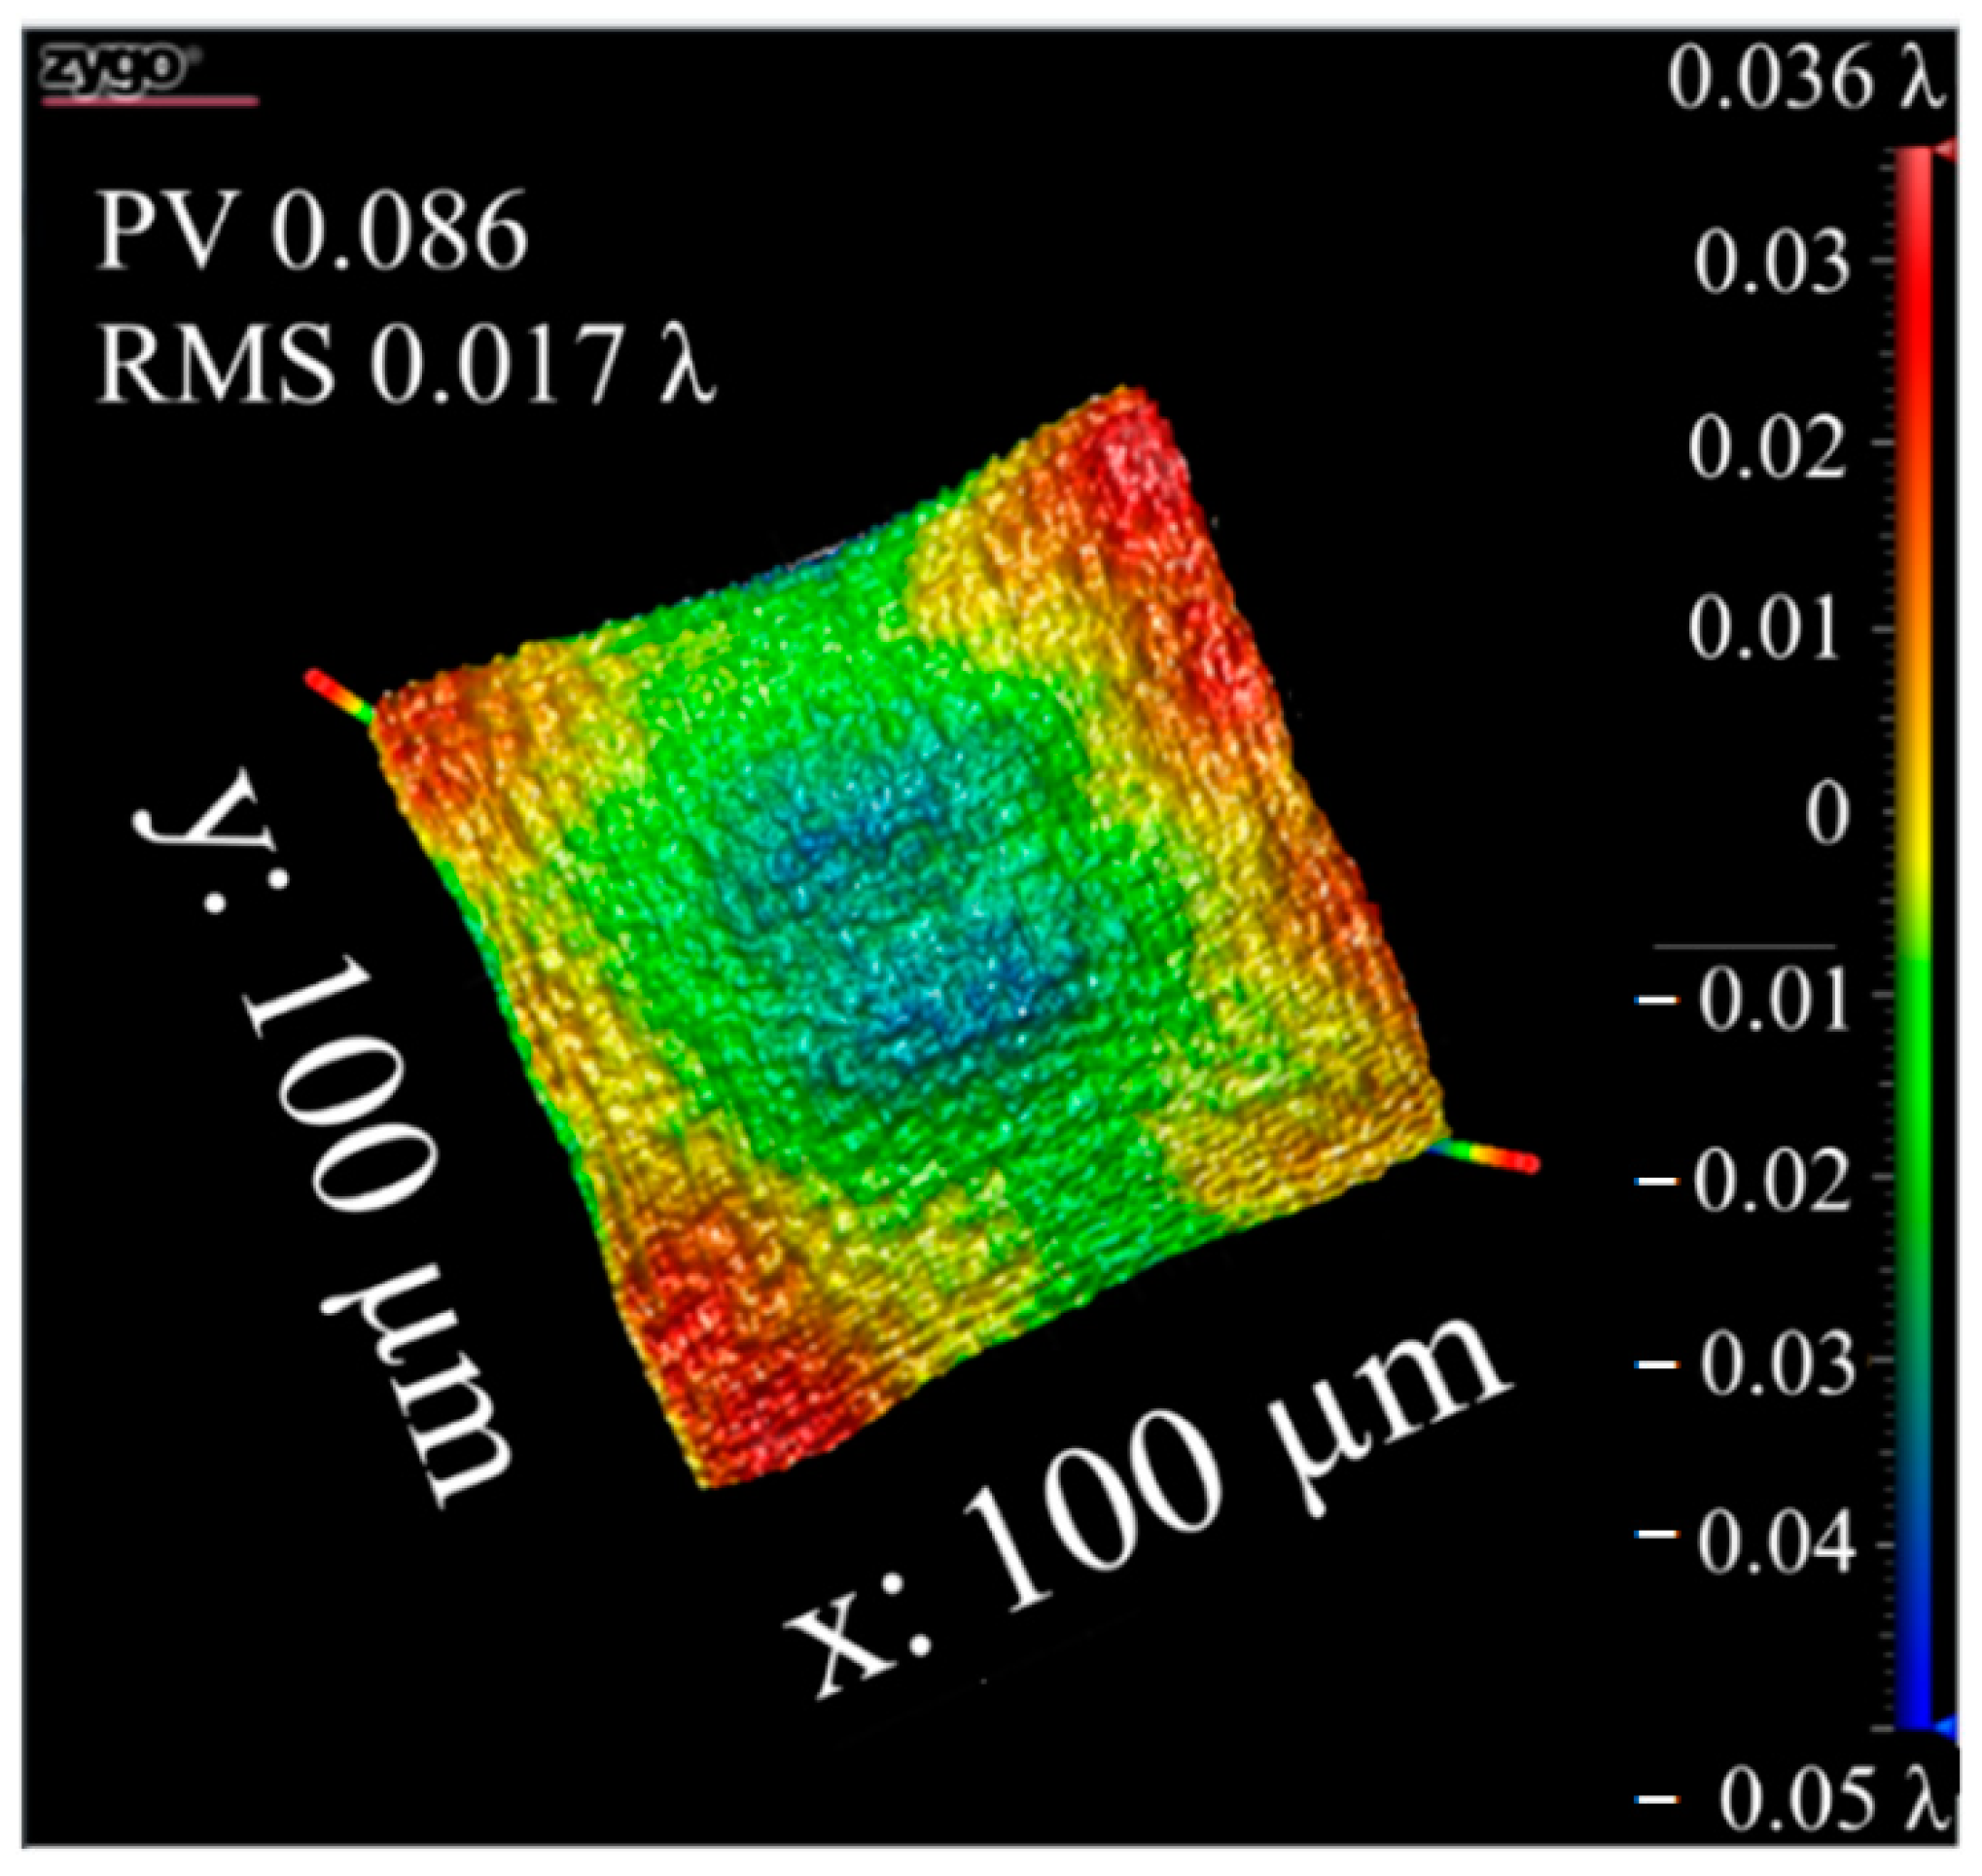
As shown in Figure 3, all ZGP elements were polished to fit laser optic quality requirements (PV ≈ 55 nm, RMS ≈ 10 nm). For artificial polished samples, the roughness and the flatness were less than 0.233 nm and 0.683λ (at wavelength λ = 632.8 nm), respectively. Thus, all used ZGP samples had the same surface quality.

Figure 3.
Patterns of roughness and flatness of the ZGP elements, registered by ZYGO interferometer.
3. Experimental Setup
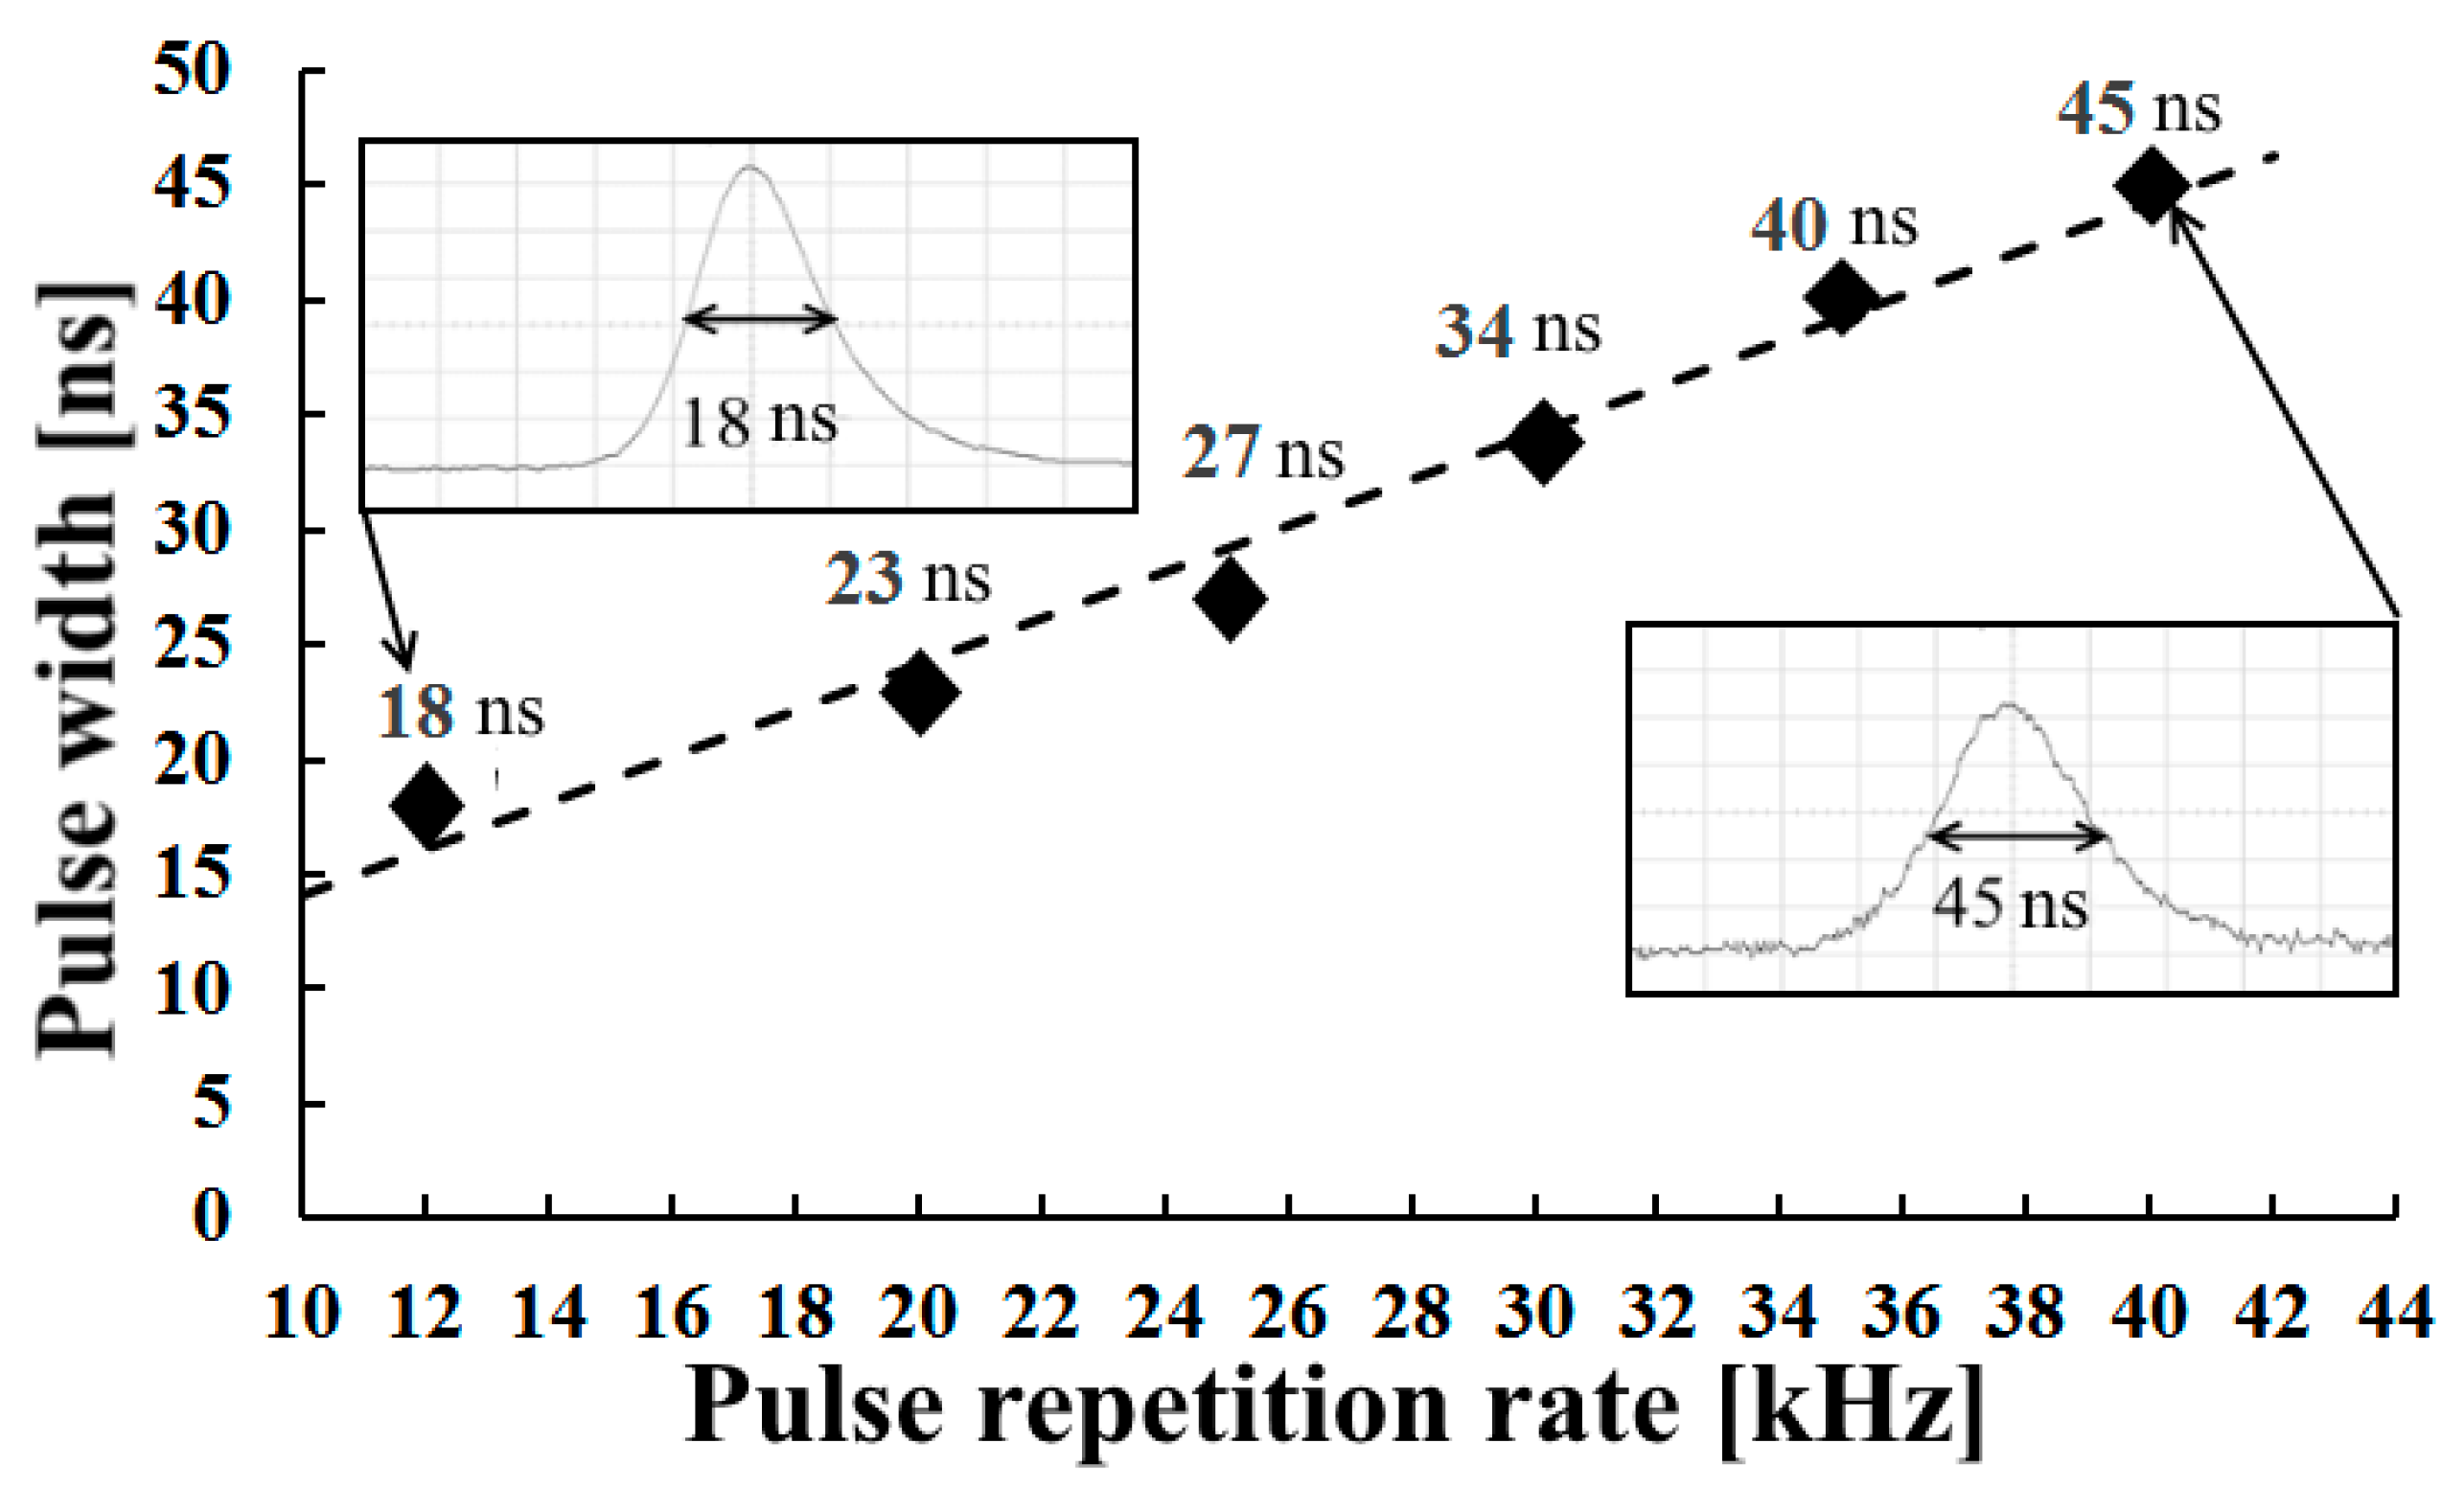
A home-made Ho3+:YAG laser at 2091 nm was used as the radiation source for study of the ZGP optical damage [24]. The Ho3+:YAG laser (pumped by a Tm-doped fiber laser at 1908 nm) was actively Q-switched by an acousto-optical modulator. The Q-switched laser operated with pulse repetition rate (PRR) varied from 12 to 40 kHz (Figure 4). The FWHM pulse width (τ), 18–45 ns, depended on PRR.
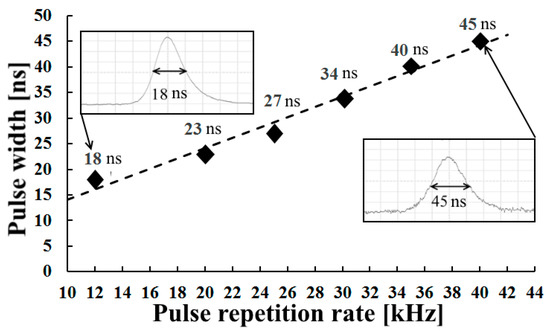
Figure 4.
Dependences of the laser pulse width on their repetition rate for a Ho3+:YAG laser.
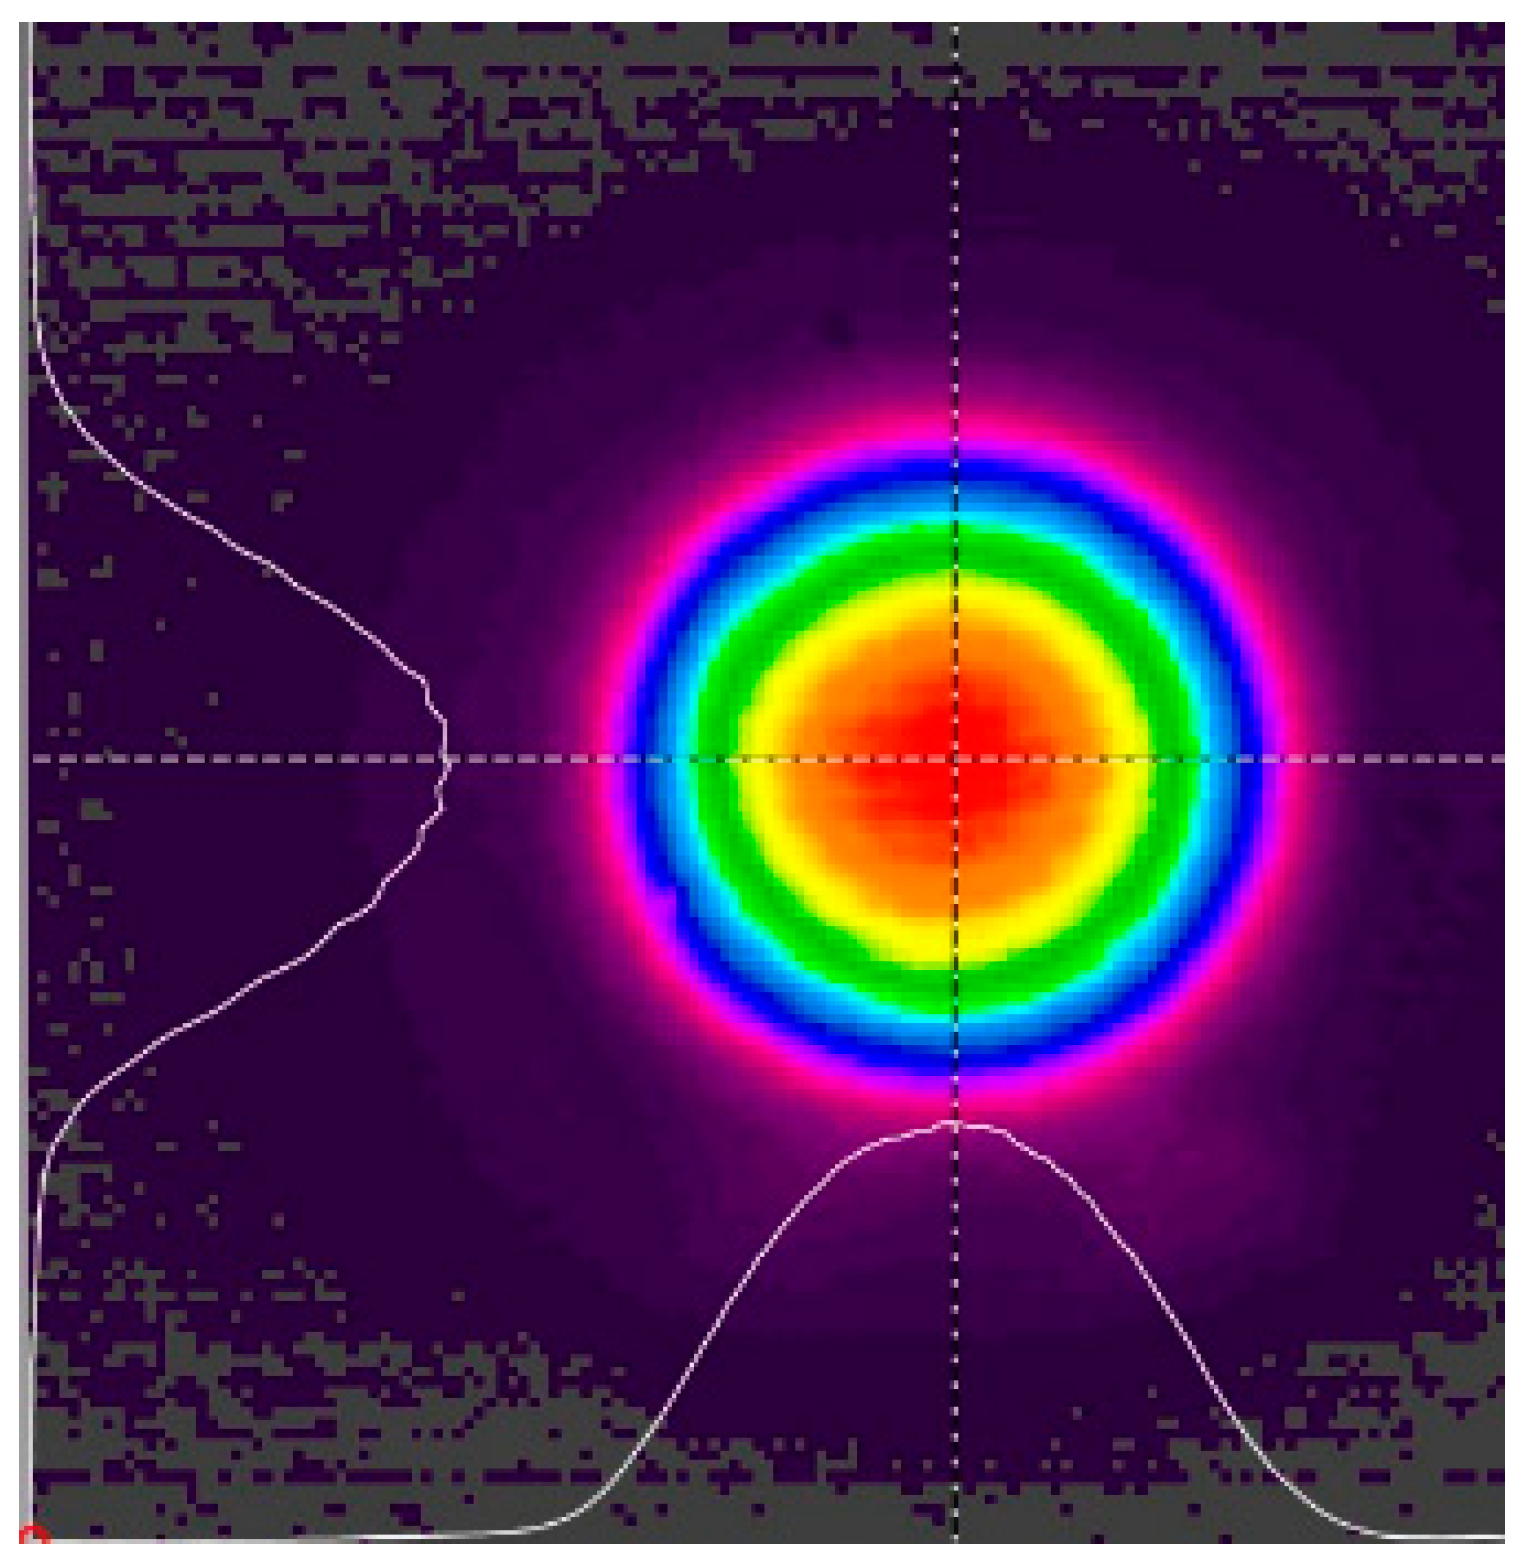
To avoid a variation in the pulse width and other laser parameters on the pump power, the Ho3+:YAG laser was pumped by the fixed 50 W power of the fiber laser. The average power of the Ho3+:YAG laser measured by a power meter (Coherent PM 10 with FieldMax detector) was 30 W in a linear polarized high-quality Gaussian beam (the M2 parameter was less than 1.2). The laser beam was monitored using a pyrocamera Pyrocam IV (manufactured by Ophir-Spiricon, Jerusalem, Israel ) at a sampling rate of 100 frames per second (Figure 5). The beam image remained stable during the exposure time (variable from 1 s to 30 s). The diameter of the laser beam at the e−2 intensity, d, was measured in the test plane by the “knife-edge” method [25]. The measured beam diameter was varied from 180 µm to 1 mm by change in the telescope base.
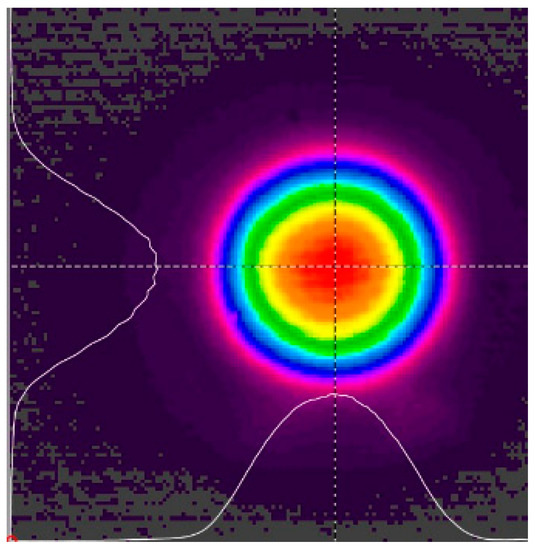
Figure 5.
The intensity distribution of the Ho3+:YAG laser beam in the test plane.
The effective average power of the Ho3+:YAG laser beam, Pav, was measured directly in the test plane (corresponded to the input surface of the tested sample) before the optical damage tests. The pulse fluence, W, and the pulse peak power, Ppeak, were estimated by the following expressions:
where f is the PRR.
W = 8Pav/(fπd2)
Ppeak = Pav/(fτ)
The experimental schematic for the optical damage tests included the following elements: the Ho3+:YAG laser with radiation wavelength of 2091 nm; a Faraday isolator (FI); a half-wave plate (λ/2); a polarizing mirror with high transmission in p-polarization and high reflection in s-polarization (M1); a Galilean two-lens telescope (T); the tested sample (Sample); a power meter (Coherent PM 10 with FieldMaxII detector, Munich, Germany) (Figure 6). A laser diode (ML150-638/1060-040-TTL-FC-M, “Laser Technics and Technology”, Minsk, Belarus), beam expander (B.E.), and CCD camera (VCXU-31M, “Baumer”) formed a digital holographic cannel (DHC) to register the optical damage kinetics. The Ho3+:YAG laser power used for the LIDT study was varied by an attenuator consisting of the half-wave plate (λ/2) and the polarizing mirror (M1) at a 55 degree angle with respect to the incident beam. The linearly p-polarized beam at 2091 nm passing through the mirror M1 was focused on the surface of the tested nonlinear crystal using the Galilean two-lens telescope. The tested plates were placed slightly behind the focus of the telescope on a three-coordinate XYZ translation stage. To avoid an influence of a backward reflection on the Ho3+:YAG laser, the Faraday isolator was used, and additionally the input surface of the tested sample was rotated on the 3 degree angle with respect to the incident beam direction.
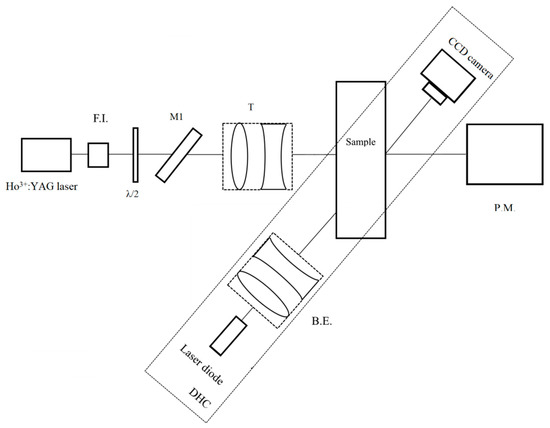
Figure 6.
Experimental setup for ZGP optical damage study.
The DHC was used for the optical damage registration and a visualization of the damage kinetics. Figure 6 shows the in-line scheme of digital Gabor hologram recording used in the present work. Light from laser diode passes through collimator B.E. forming a desired cross section of the beam transmitted through the investigated sample. In our case, the collimating objective has a focal length of 70 mm.
As a result, an interference pattern is formed by the reference wave (part of radiation passed through the homogeneous sample volume without scattering on inclusions) and the object wave (part of radiation scattered by the inclusions, volume defects, irreversible destruction of the regular crystal structure of ZGP caused by laser radiation). The CCD camera recorded this interference pattern (the hologram) and stored it in the computer memory.
The digital hologram represents digitized values of the interference field of the reference and object waves [26]. This two-dimensional data file U(x1, y1) characterizes the field distribution in the hologram plane under illumination by a plane wave. Then, numerical calculation [17] of diffraction integral (3) is used to calculate U(x2, y2)—the field distribution in the (x2, y2) plane located at distance z from the hologram plane (x1, y1).
where λ is the wavelength, and z is the distance between the hologram plane and the image restoration plane.
Changing z, the image of the investigated sample volume can be formed. In this case, inclusions are visualized in each restored image of the single crystal cross section. Hence, their sizes, shapes, orientations, and localizations in the single crystal are determined.
Since the Gabor scheme imposes reduced requirements on the spatial and temporal coherence of radiation [27], a laser diode with wavelength of 1064 nm and output power of 100 mW was used as a radiation source. A CCD camera with 1600 × 1200 pixel matrix, pixel sizes no more than 3.45 µm × 3.45 µm was used. Registration of dynamic processes observed during the interaction of laser radiation with the ZGP volume was carried out by recording digital holograms with the maximum allowable speed for the used CCD camera of ~8.3 ms. Reconstruction of the obtained sequence of holograms using the diffraction integral after the experiment allowed obtaining information on the development of ongoing dynamic processes in relation to time and location in the crystal.
The long-wavelength boundary of the spectral sensitivity of the used CCD camera was at ~1.1 µm. The working spectral range of the ZnGeP2 transmittance in which the absorption coefficient did not exceed ~1 cm−1 was in the range of 0.9–8.3 µm. Thus, sources generating radiation in the spectral region near 1064 nm and CCD matrices operating in the visible range can be used to investigate the ZGP single crystals by the digital transmission holography method. The sensitivity of the silicon matrix used allowed obtaining a contrasting picture of bulk defects in the samples under study and recorded dynamic processes. The use of a laser diode with an average power of 100 mW as a radiation source did not lead to significant thermal effects due to absorption of this radiation in the ZGP. These problems were considered in detail in [11,12,13,14].
4. LIDT Test Procedures
The optical damage of the ZGP samples was studied by two different procedures: S-on-1 or R-on-1. The S-on-1 procedure (defined by ISO standard 11254-2 [28]) suggests an irradiation of some quantity of independent sites on the tested surface at a given fluence. Several damaged sites (nd) at the fluence give the damage probability (PRS): PRS = nd/NS, where NS is the number of the irradiated sites at the fixed fluence. The larger number of irradiated sites (NS) gives a more accurate result for statistical averaging. In our S-on-1 tests the N-number was 15. The spacing between the different test sites must be as small as possible to use the finite sample surface but large enough to avoid an influence of the previously tested areas on the new test site. In our S-on-1 tests the spacing was about 0.6…1 mm at the laser beam diameter of 180–360 μm. The same procedure was applied for different fluences for new sites, giving the damage probability curve vs. the irradiation fluence. In the S-on-1 procedure, each site is irradiated at constant fluence by S shots. In our experiments, the S-number of shots was varied from 104 to 106 depending on PRR and the exposure duration.
In the R-on-1 procedure a separate area on the tested surface is irradiated under fixed fluence of the pumping beam; if an optical damage is not registered the fluence of the site irradiation is increased step-by-step until the optical damage registration [29]. Each tested site gives a value for the damage threshold. Then, the sample is moved in the surface plane by a positioner to a new site, and the irradiation of the new site is repeated until damage. The number of the independent irradiated sites, NR, determines the LIDT statistic accuracy. The R-on-1 damage probability dependence can be obtained by plotting the cumulative probability as a function of the incident fluence. The R-on-1 mode requires less space on the sample surface and can be applied for the samples with a limited aperture. However, the crystal material in the site can be modified by irradiation fluence below the damage threshold, and it can give an error for determining the LIDT [9,29].
In our R-on-1 tests the studied samples were irradiated by a pulse train with a fixed fluence during one exposition, and the step of the fluence increasing was ~0.1 J/cm2. The beam diameter on the tested surface was 180–360 μm. The tested samples were moved by a three-coordinated positioner to the spacing of ~0.8–1.5 mm. The number of the irradiated sites, NR, was 5.
The term “cumulative probability” in the R-on-1 technique implies that there are 5 regions in which an optical breakdown was obtained by successively increasing the energy density of the incident radiation. For example, if the optical breakdown of the plate under study was implemented in 5 sections at laser radiation energy densities of 1.0 J/cm2, 1.5 J/cm2, 2.0 J/cm2, and 3.0 J/cm2, then the probability of optical breakdown at an energy density of 1.0 J/cm2 was P1.0 = 1/5, at 1.5 J/cm2 was P1.5 = 3/5, at 2.0 J/cm2 was P2.0 = 4/5, and at 3.0 J/cm2 was P3.0 = 5/5, respectively. On the graphs where the experimental points were obtained using the R-on-1 method, the point with the minimum energy density of the optical breakdown has a probability of 0.2 (1/5), the next point is 0.4 (2/5), etc.
In experiments in which the S-on-1 technique was used, the values of the energy density at which the breakdown occurred at least in 1 point out of 5 corresponded to a breakdown probability of 0.2. Further, we increased the energy density of the testing laser radiation by 0.2 J/cm2. If one of five points broke through again, we further increased the breakdown density by 0.2 J/cm2 until two of five points broke through, which corresponded to a probability of 0.4, and so on. Thus, the graph shows the points corresponding to the breakdown probability 0.2, 0.4, 0.6, 0.8, and 1 at the minimum energy density at which the breakdown probability is implemented (0.2; 0.4; 0.6; 0.8; 1).
The average LIDT fluence, <WT>, and the average quadratic error, <>, were estimated from the S-on-1 or R-on-1 test data by the following expressions:
where nj is the site number with the damage threshold Wj, and ND is the total number of the damaged sites (). The damage character and on which side it occurred, were ignored.
The Student’s t-distribution for the confidence probability (PT) of the damage threshold WT to be in a mean confidence interval <WT> ± K × was used to estimate the variable K parameter [9,30,31]:
where Г is the gamma function.
In a preliminary experiment, a comparison of ZGP LIDTs measured by both test procedures (S-on-1 and R-on-1) was performed. The preliminary tests of the LIDT measurement by two procedures were conducted for the additional ZGP samples produced by LOC Ent. (Tomsk, Russia) in form of plates with dimensions of 6 × 6 × 3 mm3, with surface polishing (PV ≈ 40.5 nm, RMS ≈ 0.36 nm, Ra ≈ 0.22 nm) but without AR coatings.
A single crystal produced by LOC was grown under the following technological parameters: the growth rate was 0.3 mm/h, the temperature gradient was 4.0 K/cm. The performed studies did not reveal the presence of binary phosphides and bulk defects in the crystal. There have been no studies devoted to determination of the concentration of dislocations in the single crystals of Russian production used in this work. The studies devoted to the influence of growth conditions and postgrowth treatments on LIDT elements from ZGP single crystals produced by LOC are presented in more detail in a recently published work [12]. These results also indirectly indicate a significant effect of the dislocation concentration and structural perfection of ZGP crystals on the LIDT.
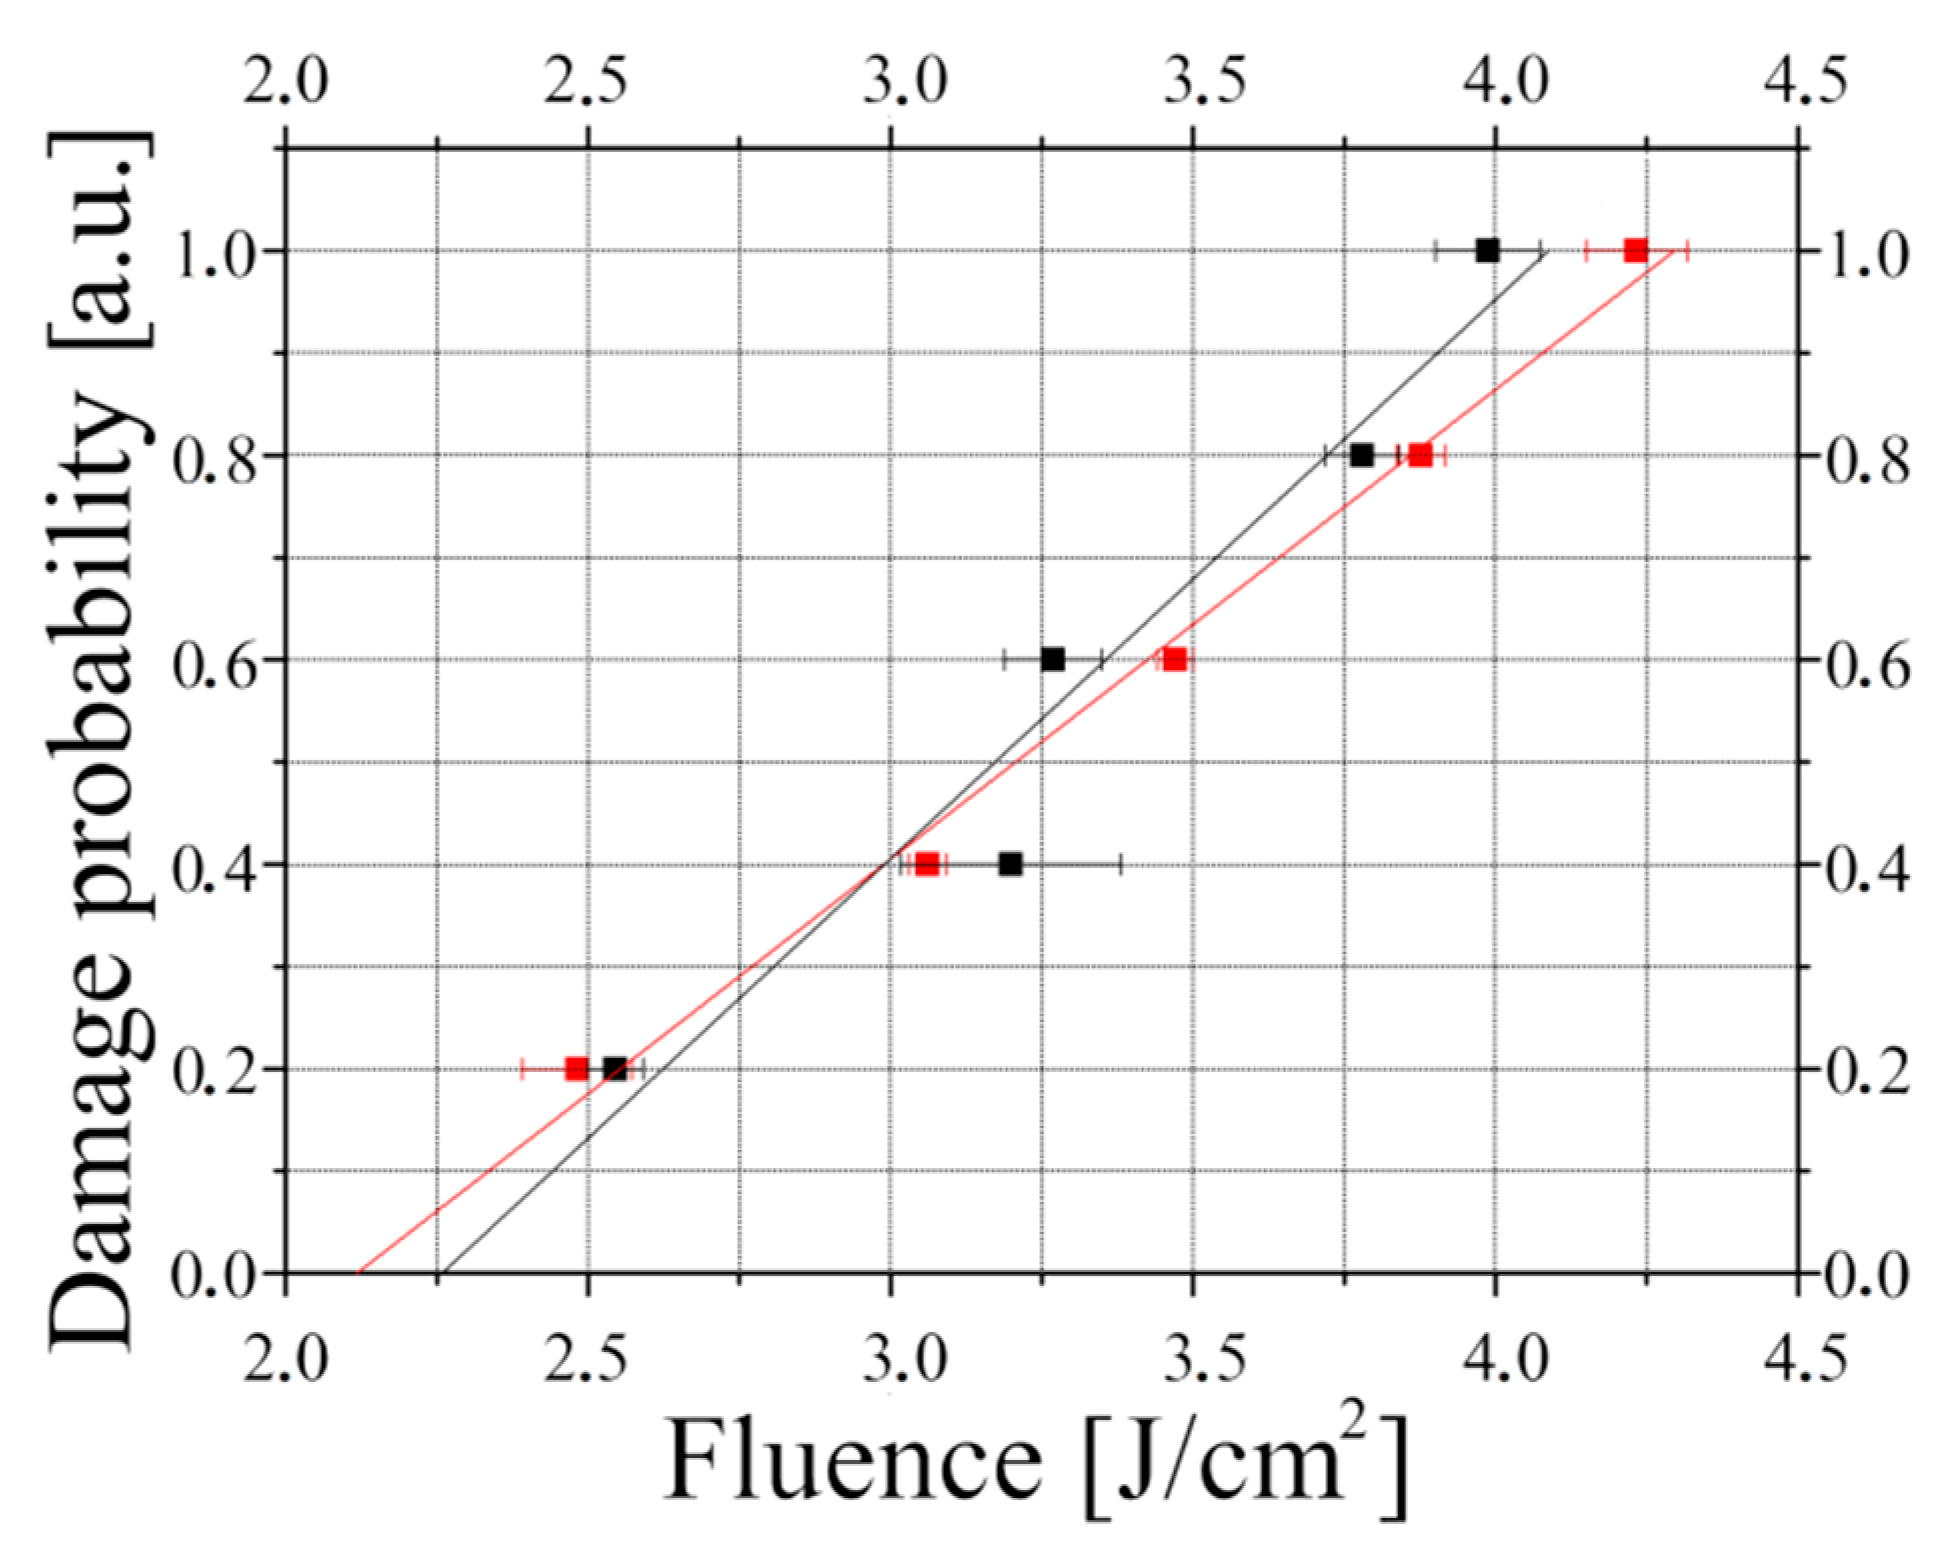
The result of comparison of the experimentally determined damage probability by the S-on-1 and R-on-1 procedures is given in Figure 7. The intersections of an approximation line of the optical damage probability with the fluence axis give the LIDT fluence at 0-probability, W0.
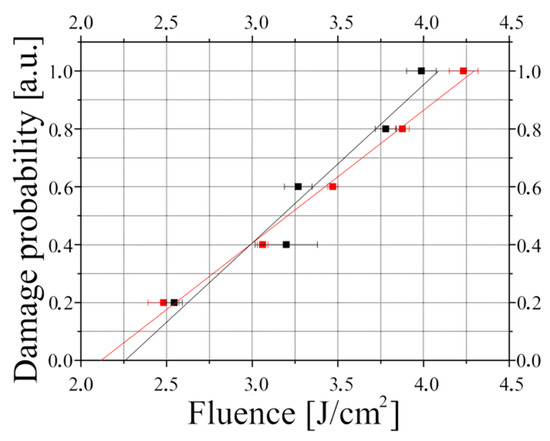
Figure 7.
A comparison of optical damage probability measured in the preliminary tests by S-on-1 (red squares) and R-on-1 (black squares) procedures with the exposure duration of 1 s, PRR of 12 kHz, and the pulse width of 18 ns. The fluence errors were caused by a cumulative inaccuracy of the determining.
The statistical parameters of the S-on-1 and R-on-1 test procedures were determined from the experimental data and calculation by Exps. (4)–(6) with the fixed confidence probability PT = 0.95 (Table 1).

Table 1.
The average error , the K coefficient of the error dispersion at the confidence probability of PT = 0.95, the average LIDT fluence <WT>, the 0-probability LIDT fluence W0 for the S-on-1 and R-on-1 tests with damaged site number ND.
5. Results of Sample Testing
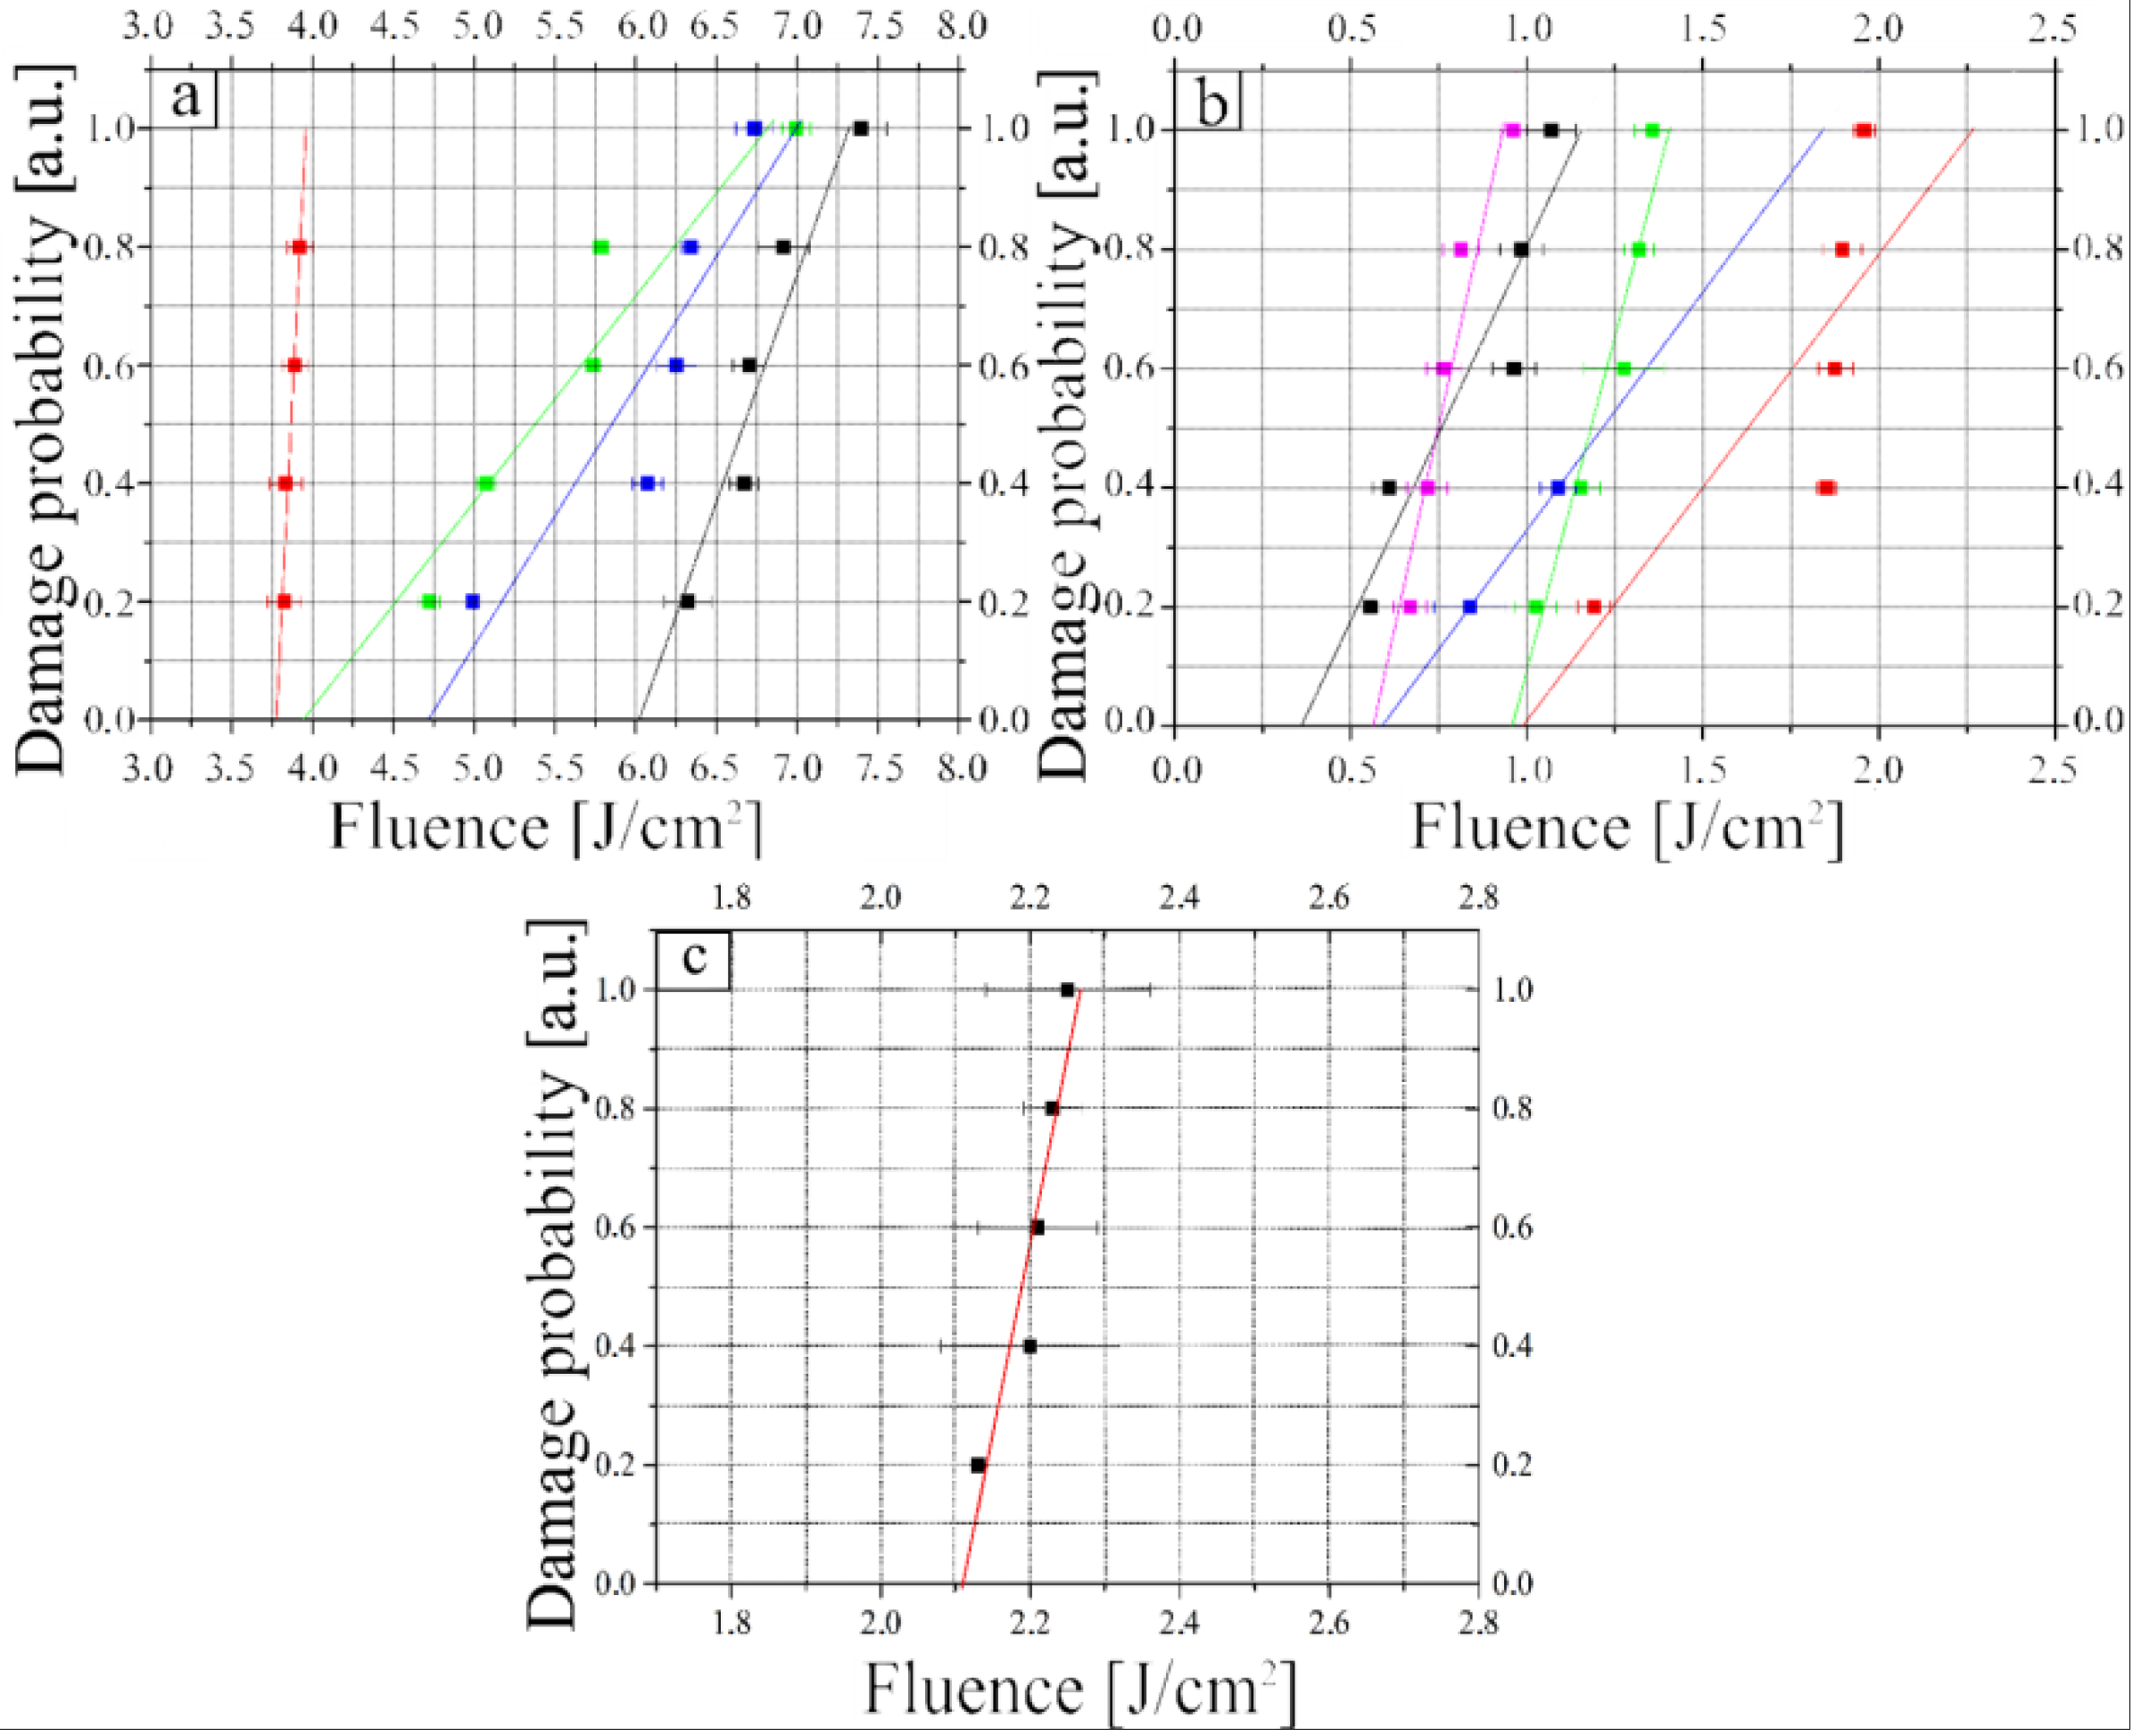
The probability of the optical damage for all samples was measured for the varied PRR (Figure 8), and the statistical parameters for the varied PRR were also estimated (Table 2).
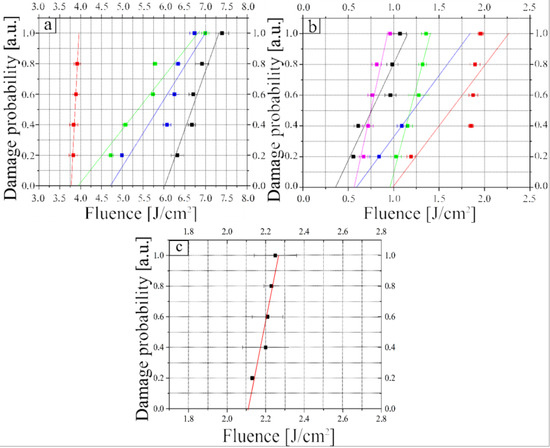
Figure 8.
Probability of the optical damage on the energy fluence for the N2 sample (a), the N1 sample (b), and the N3 sample (c) for deferent PRR varied from 12 kHz (red squares), 20 kHz (green squares), 25 kHz (blue squares), 30 kHz (purple squares), and 40 kHz (black squares) at the corresponding pulse width (varied from 18 ns to 45 ns, respectively), the exposure duration of 1 s, and the beam diameter of 180 μm.
Table 2.
The average error , the K coefficient of the error dispersion at the confidence probability of PT = 0.95, the average LIDT fluence <>, the 0-probability LIDT fluence for the sample N2 elements, and OChC elements with damaged site number ND at varied PRR.
The comparison of the experimental results and the calculated statistical parameters demonstrated a three to five times higher LIDT (both the average fluence and the 0-probability LIDT fluence) for the N2 sample in comparison with the N1 sample (Figure 8 and Table 2). The measured LIDT of the N2 sample turned out to be 1.76 times higher than that of the N3 sample, and the LIDT of the N3 sample was 3.1 times higher than that of the N1 sample at a PRR of 12 kHz (compare the red lines on the Figure 8a–c).
The dependences of the LIDTs on the PRR were found to be different for the N1 sample and the N2 sample. Indeed, the LIDT (<WT> and W0) of the N1 sample decreased with PRR increase, and on the contrary, the LIDT of the N2 sample increased with PRR increase. The last effect for the N2 sample can be explained by an increase in the pulse width and, hence, a decrease in the pulse peak power and intensity with the PRR increasing.
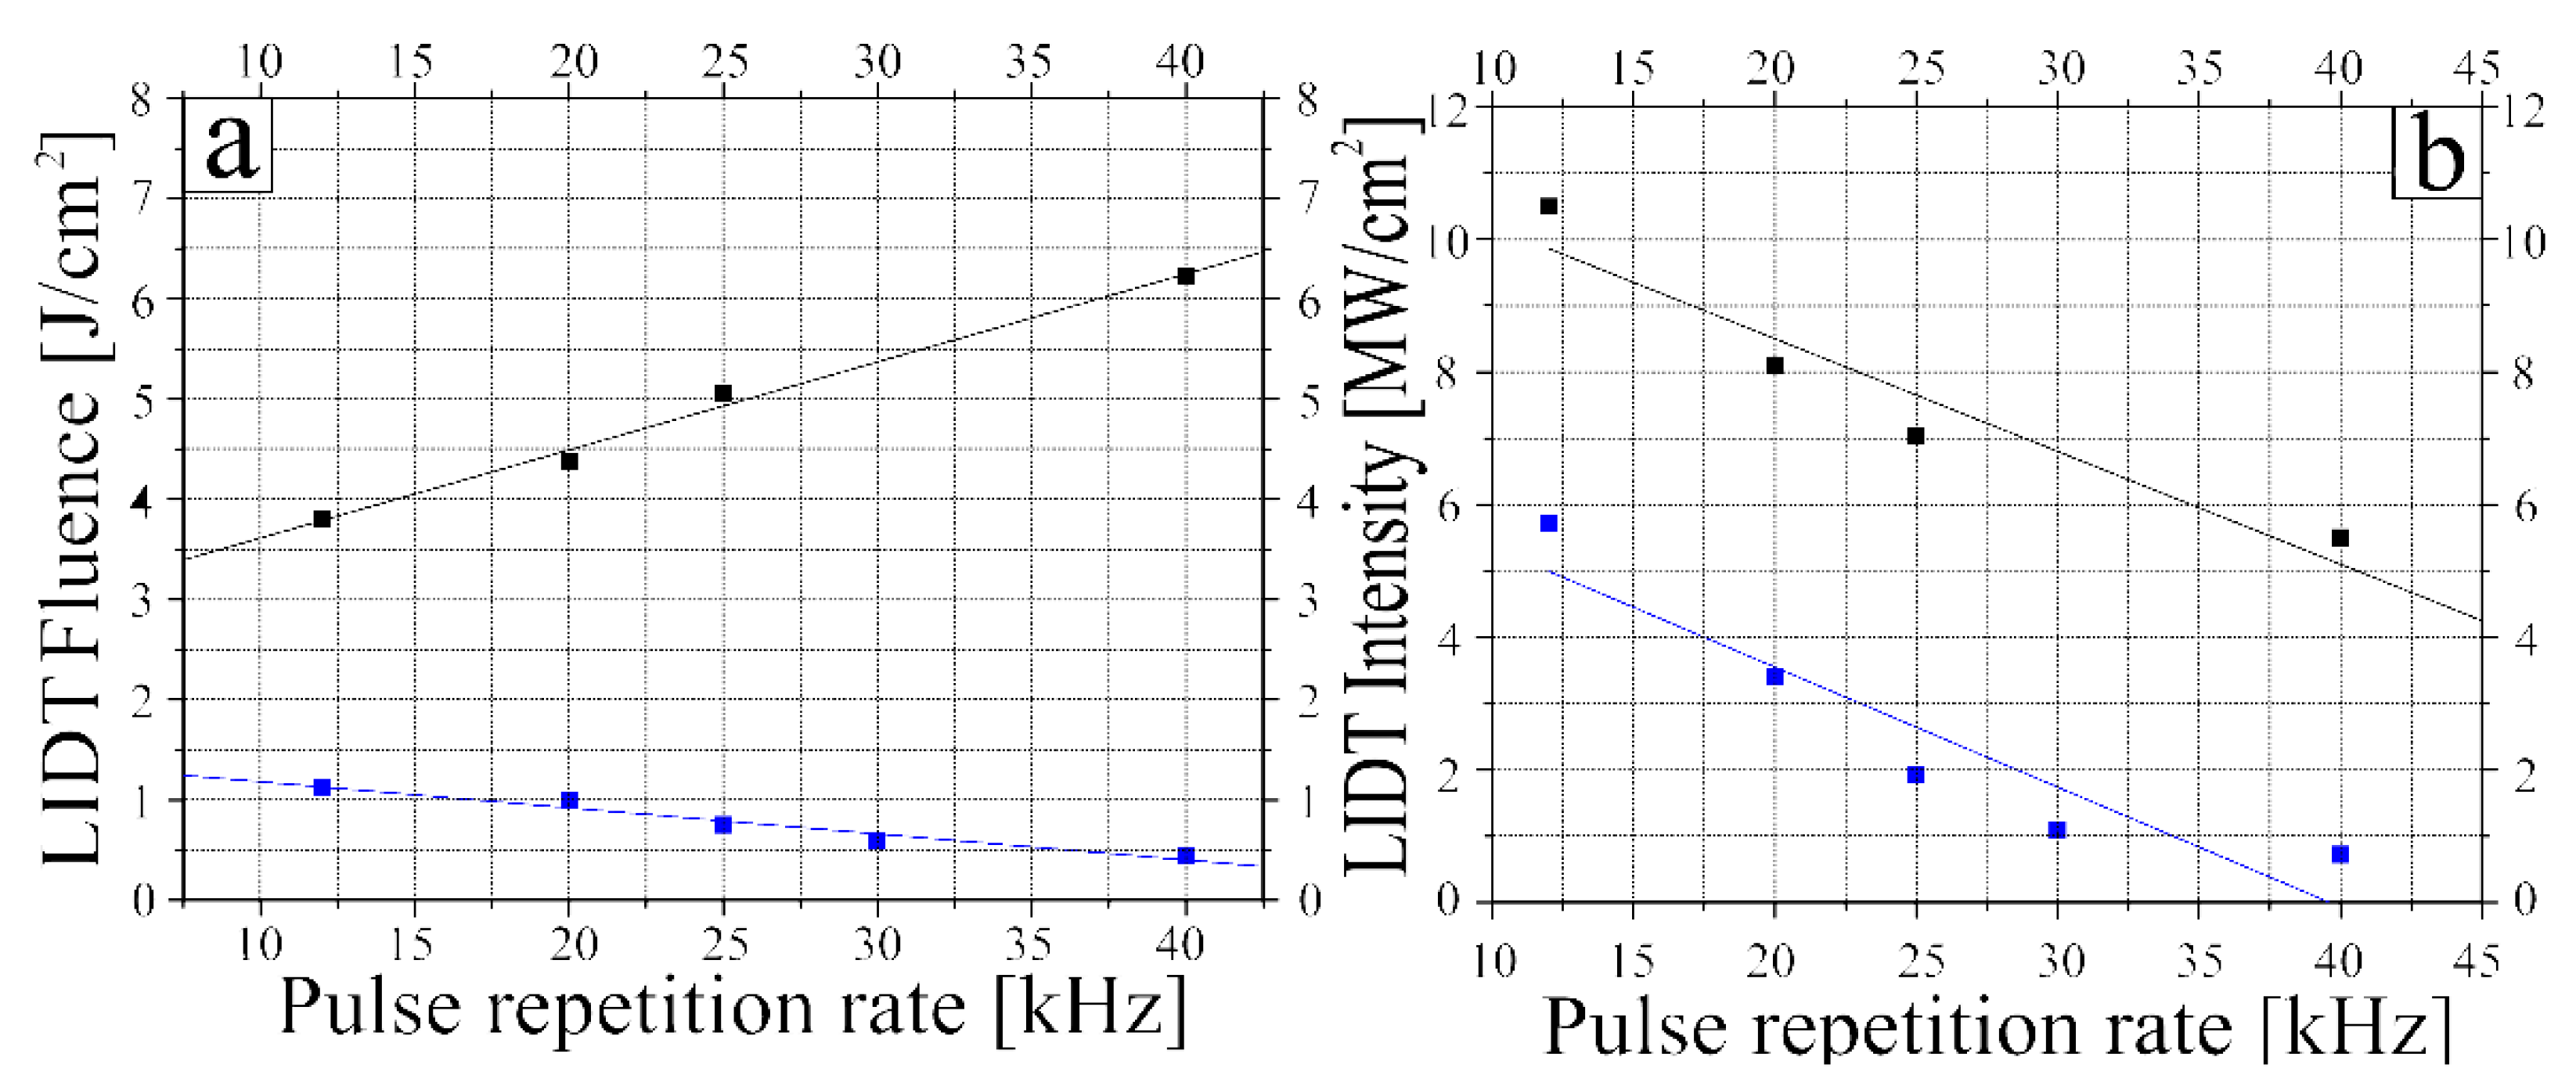
The LIDT 0-probability W0 gives important information for the ZGP-based OPO and OPA systems. For this reason, the beam fluence, the average power, and the pulse peak power at the LIDT 0-probability were studied in the N2 sample and the N1 sample as functions of PRR (Figure 9). Note that the LIDT 0-probability fluence decreased with the PRR increasing in the N1 sample, and vice versa it increased with the PRR increasing in the N2 sample (Figure 9a). The LIDT 0-probability peak intensity, 8 Ppeak/d2, decreased with the PRR increasing both for samples N2 and N1 (Figure 9b). The obtained results demonstrated the strong dependence of the ZGP LIDT not only on the pulse fluence, but also on the pulse peak intensity.
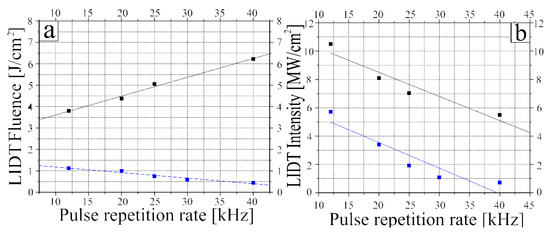
Figure 9.
LIDT fluence (a) and LIDT peak intensity (b) vs. PRR for the N1 sample (blue) and the N2 sample (black). All LIDT parameters were determined at the 0-probability of LIDT. The exposure duration and the beam diameter were 1 s and 180 μm, respectively.
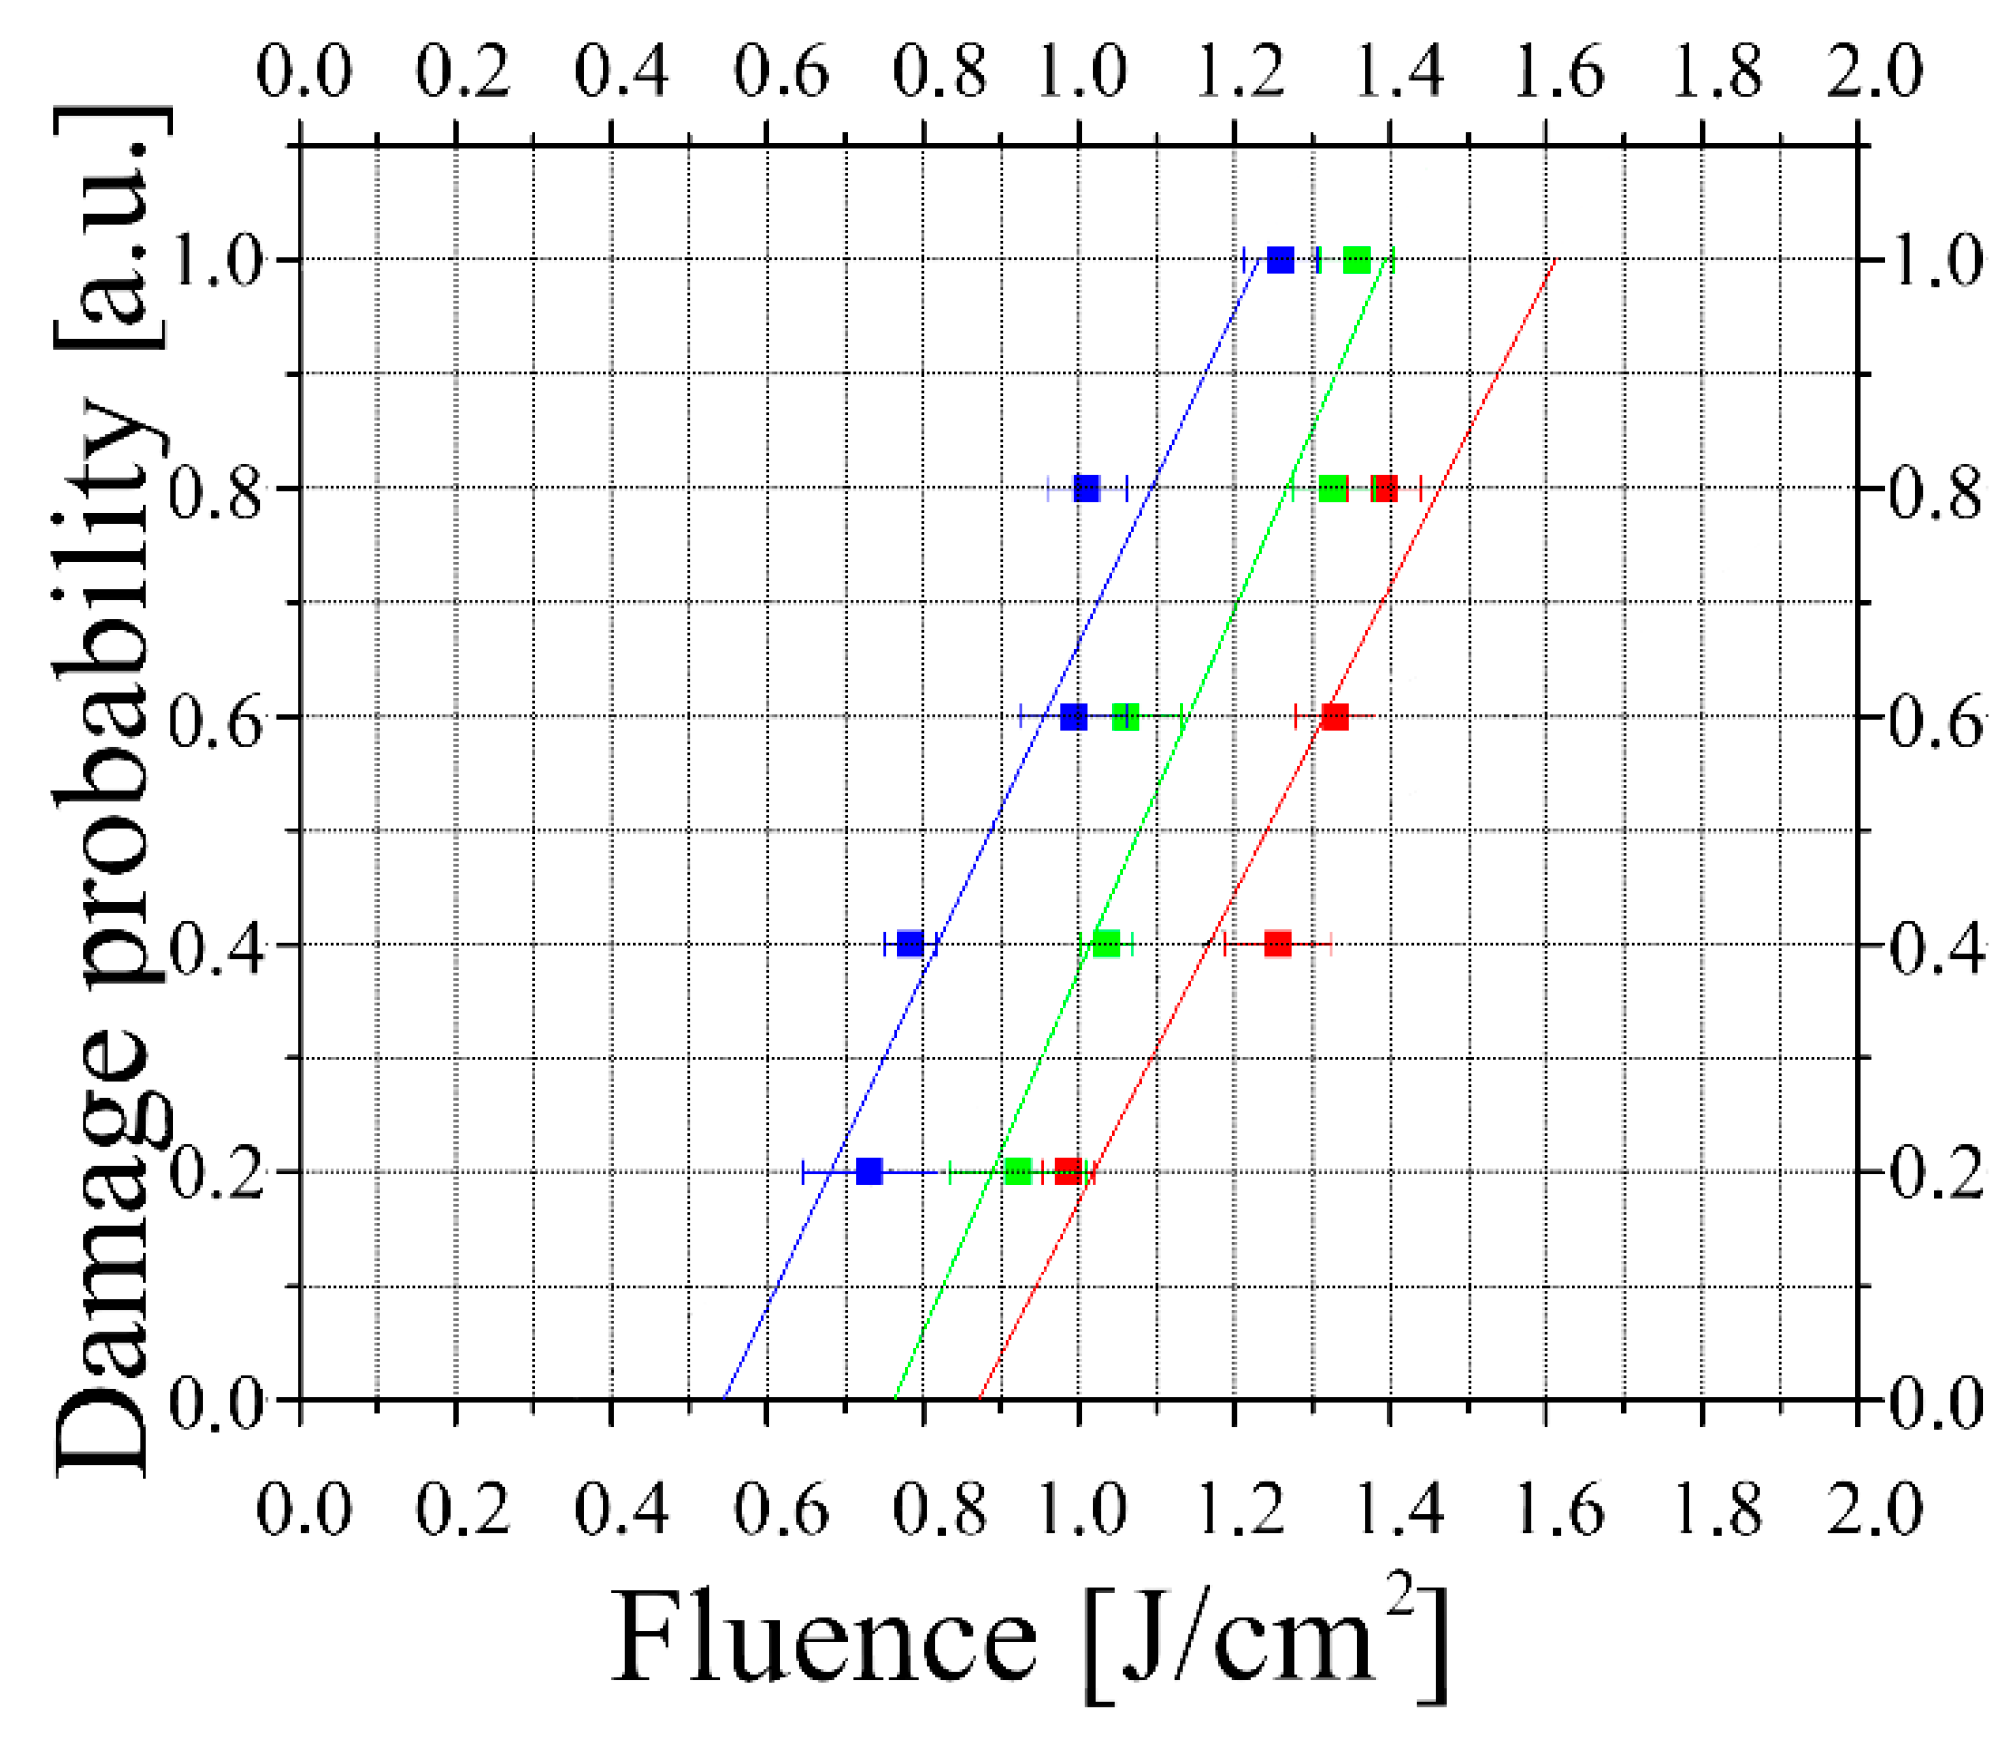
The optical damage probability was measured by the R-on-1 method for the N1 sample at different exposure durations (Figure 10). The LIDT fluence of the N1 sample decreased with the increase in the exposure duration. This result appears to be in stark contrast to the incubation phenomenon when the LIDT fluence decreases with the increase in the number of pulses in the train. This phenomenon is well known for different optical materials [32]. The incubation effect in our experiments can be explained by the temperature rise in the beam center over the exposure duration, which resulted in the higher absorption coefficient and critical specific damage energy.
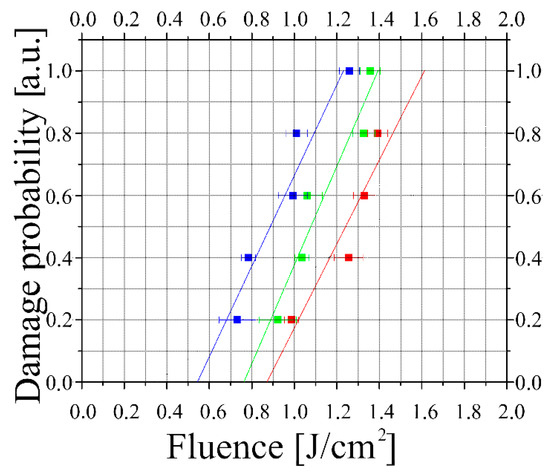
Figure 10.
Probability of the optical damage of the N1 sample on the pump fluence at different exposure durations of 1 s (red squares), 10 s (green squares), and 20 s (blue squares). The pulse width, PRR, and the beam diameter were 18 ns, 12 kHz, and 360 μm, respectively.
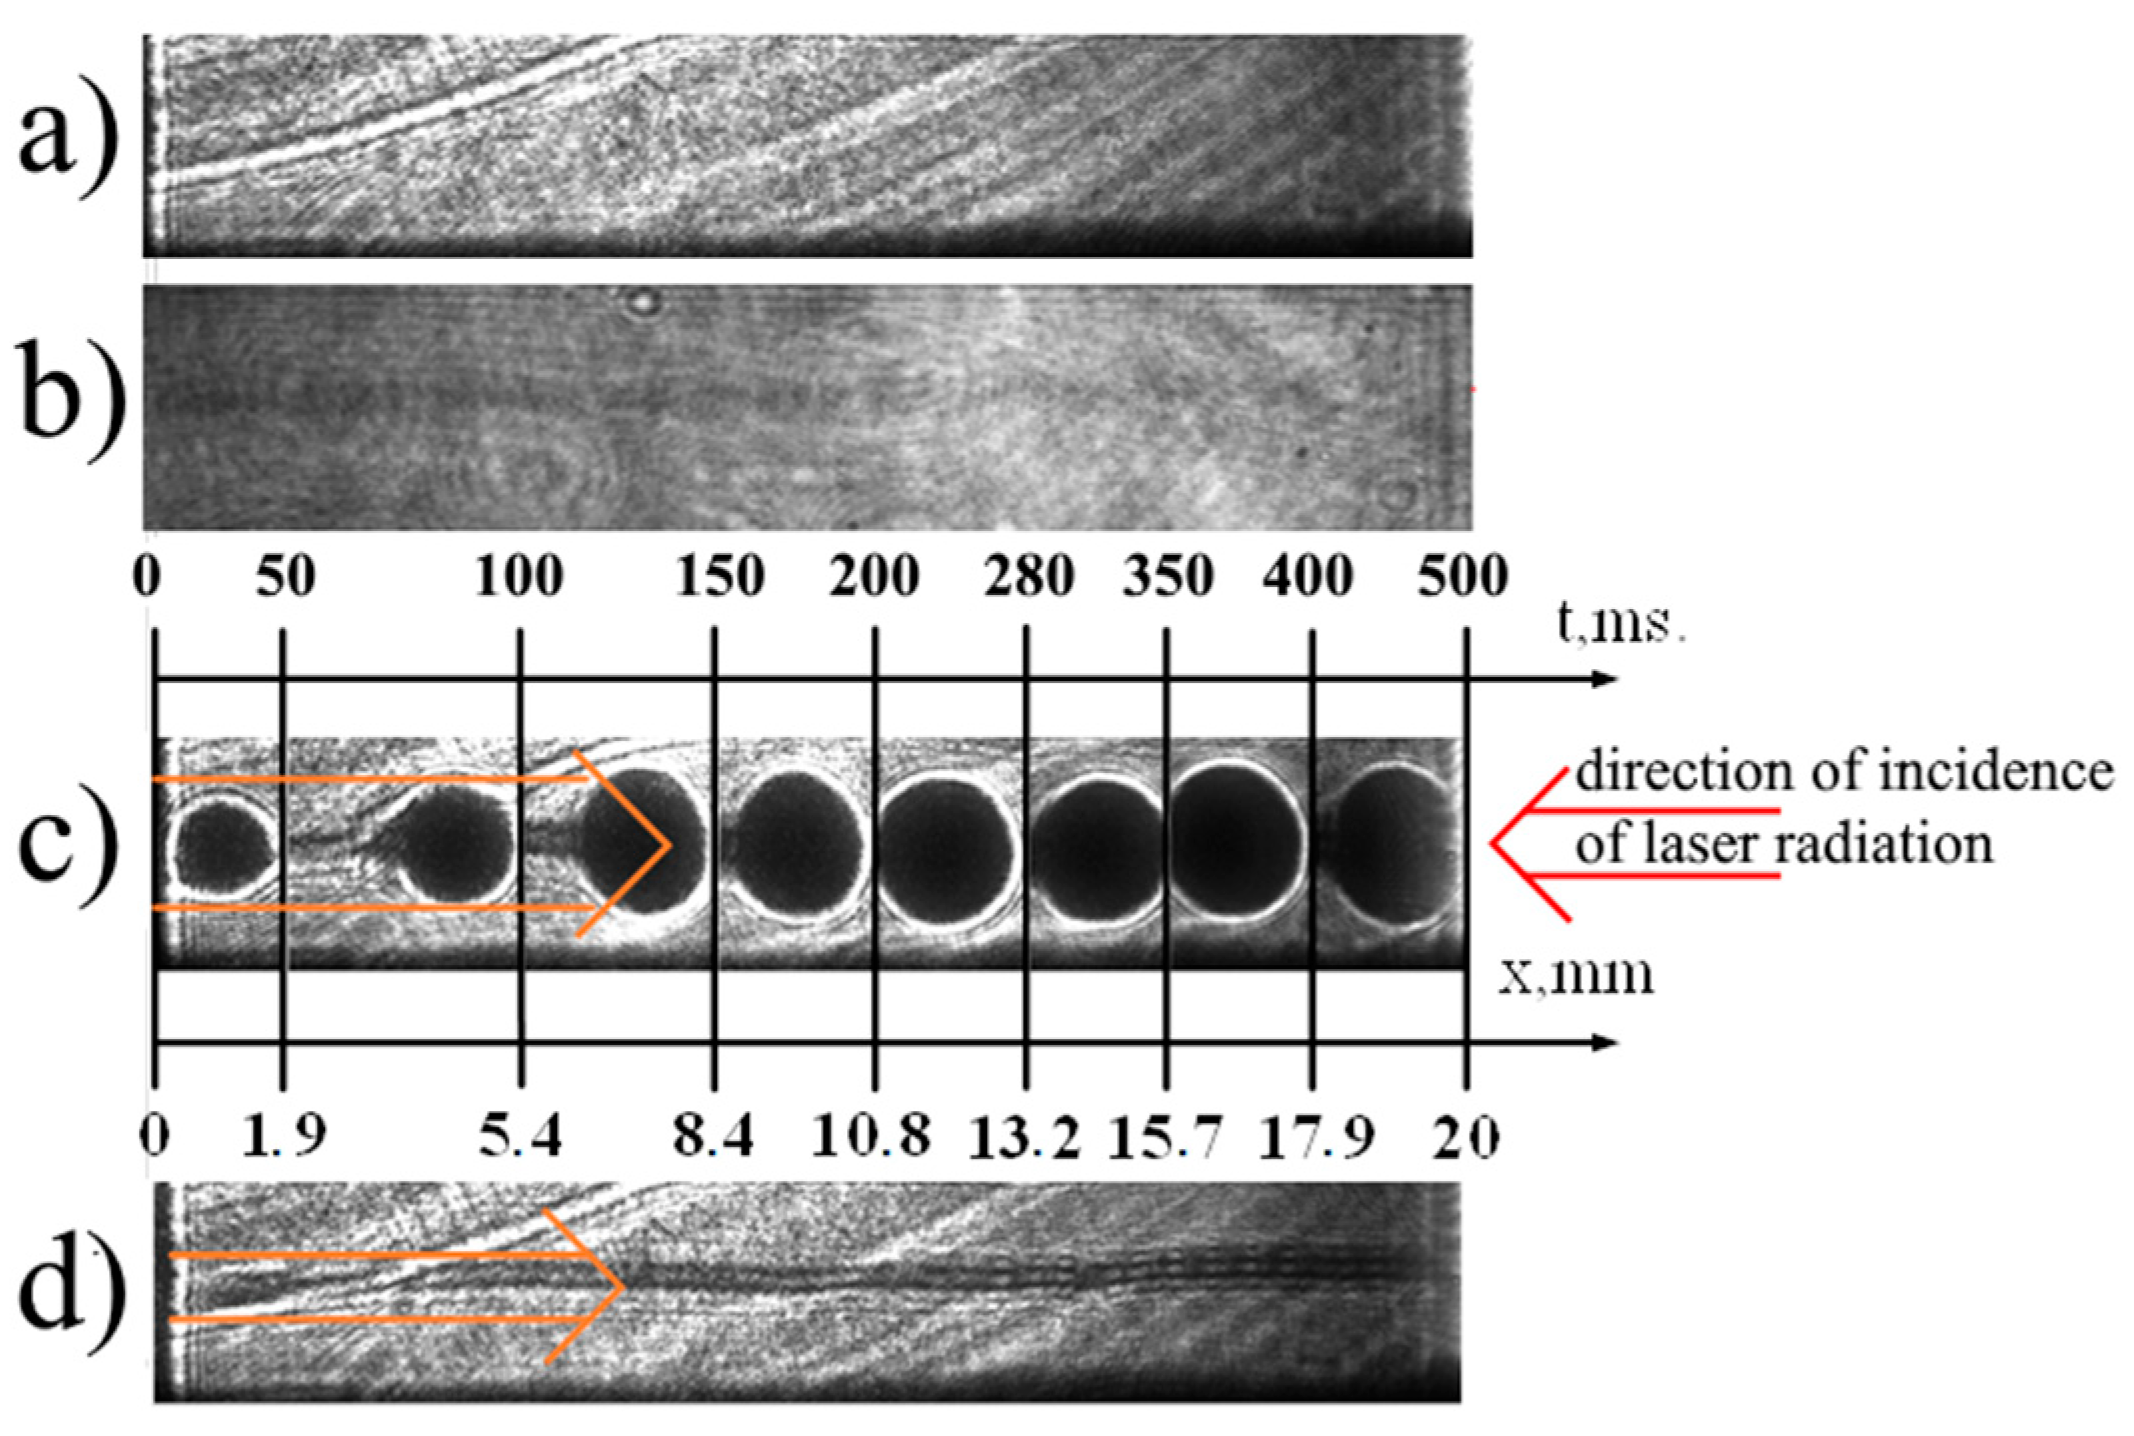
The investigation of the optical damage kinetics by the DHC showed that the damage was initiated mainly on the output surface of all tested ZGP samples: in more than 80% of cases, the damage began on the output surface of the ZGP sample, then a gloving ball of the damaged area propagated to the input surface inside a channel formed by the testing beam (Figure 11). After optical damage occurred, a linear track of the refractive index changes inside the crystal was observed. The fact of reversible “photodarkening” of the propagation channel of high-power laser radiation at a wavelength of 2091 nm in ZGP in the pre-breakdown region of parameters was established.

Figure 11.
The results of processing digital holograms during the breakdown of a ZGP single crystal by laser radiation: (a) is the sample before optical breakdown, (b) is the darkening region of the laser radiation propagation channel in the pre-breakdown region of parameters, (c) is the timelapse of the movement process of the “luminescent cloud”, (d) is the sample with a track from optical breakdown. The red pointer indicates the propagation direction of the incident beam at 2.09 µm. The yellow pointers indicate the propagation direction of the glowing ball of the damaged area.
6. Discussion
The experimental results clearly indicate that the ZGP LIDT depends both on the pulse fluence and the peak intensity. This conclusion contradicts previous assumptions that the ZGP LIDT at 2.1 µm depends only on the pulse fluence (at least, for pulse widths of 10–30 ns) [5,8,9]. Our results can be explained by a combined mechanism of the optical damage formation at the pulse width of ~10−8 s, which includes both the thermal damage and the dielectric breakdown [15].
In our experiments, the laser pulse width (18–45 ns) was much shorter than the thermal diffusivity time given the beam radius and ZGP dimensions (τT = d2/4D, where D is the ZGP thermal diffusivity). The temperature rise inside a homogeneous ZGP in the beam center during the pulse was estimated to be 2 × 10⁻² K at the pulse fluence of 4 J/cm2 (the ZGP crystal properties used to estimate the temperature rise are shown in Table 3). At the same time, the total exposure duration was much longer than τT. This means that the steady-state temperature rise during exposure duration in the beam center ΔTC is mainly determined by the average power. The steady-state temperature increase in the center of the beam with the beam diameter of 300 µm was estimated to be ~1 K at Pav ≈ 30 W in a thermostabilized ZGP sample with a radius of 3 mm.
Table 3.
The characteristics of ZGP crystals and the sample parameters used for estimation of the temperature rise in the center of the testing beam.
The estimated temperature changes both during each pulse and in the steady-state regime were much lower than the melting point or the critical stress temperature. However, the localized temperature rise near small crystal defects and inclusions may be strong enough to provide the defect-induced damage [15]. Indeed, the point defects of the crystal lattice can enhance, for example, the additional electronic sub-levels, which simplify the multiphoton absorption at 2.09 µm and the strong temperature rise. The dislocation areas placed inside the ZGP or especially the near sample surface accumulate a number of the point defects and inclusions, which provide the temperature increase up to the critical value. On the other hand, the local electric field in the dislocation point is stronger than in the homogeneous lattice, which can decrease the threshold of the electric-field-enhanced breakdown of the material.
The critical values of the pulse fluence, peak, and average power were measured to be much higher for samples N2 and N3 compared to the N1 sample. Moreover, the N1 sample and the N2 sample demonstrated the opposite trends of the LIDT fluence when PRR was increased. This result cannot be explained by the difference in surface polishing; the surface quality of all three samples was the same.
The difference in the crystal quality is the main reason for the LIDT difference. Indeed, two initial ZGP crystals had different growth conditions. Changes to the growth conditions of the N2 and N3 samples resulted in the overall higher lattice quality. This improved crystal quality can be associated with the low occurrence of impurities, reduced number of volume microdefects, decreased number of dislocations, and higher uniformity of their distribution. However, the impurity composition of the samples was almost identical: at least, the content of the dominating impurities with concentration of 10−2–10−5% was measured to be the same (Figure 2). Moreover, no volume defects and traces of local stoichiometry were found in the samples. Thus, an order of magnitude difference in the in-plane density of lattice dislocations in the initial crystals appears to be the main reason for the higher LIDT of the N2 and N3 samples.
The difference in LIDT of samples N2 and N3 that were cut from the same single crystal but had different lengths can be explained by the different nonlinear lenses induced in the elements. It is well known that the self-focusing effect on nonlinear crystals has a noticeable effect on the LIDT value [15,16]. On the other hand, a comparison of the LIDTs of samples N1 and N3, which had the same length and polishing quality of the working surfaces, shows that the concentration of dislocations significantly affects the ZGP LIDT.
Notably, the similar effect of influence of dislocation concentration on the surface LIDT is known for other optical crystals [15,32]. The current explanation of the experimental data for phosphate nonlinear crystals (KDP or DKDP), for example, is that irregularities in the crystal structure enhance clustering of atomic defects (intrinsic or impurity related) that would not induce the optical damage if they were isolated [15,33]. Structural irregularities such as dislocations may also cause a local charge compensation, thus stabilizing atomic defects that are usually only observed at low temperature. Large impurities are important for the laser damage threshold if they cause strong absorption, but once the growth procedure or the post-treatment of the crystals is optimized, the impurities usually are no longer the limiting factor for the laser damage resistance of our nonlinear crystals.
The difference in the LIDT pulse fluence and peak intensity between three samples N1, N2, and N3 indicates different dominating mechanisms of optical breakdown in these samples, which could be either the thermally induced damage or the dielectric breakdown of the material [15]. A decrease in the LIDT at higher PRR and larger laser pulse width in N1 indicates that the thermally induced damage associated with nonlinear multiphoton absorption caused by the presence of dislocations in a crystal is a dominating mechanism in that sample. In this case, the local heating of the material within the beam center up to the melting point or the catastrophic strain is possible. On the other hand, the increase in the LIDT fluence and the decrease in the LIDT intensity in the N2 sample can be explained by the fact that the temperature rise in the better quality ZGP sample was smaller and the thermal damage threshold was higher than the dielectric breakdown threshold of the working surfaces. Therefore, the dominating mechanism in the N2 sample appears to be the surface dielectric breakdown, which is determined by the pulse peak intensity, which, in turn, decreased with an increase of the pulse width at higher PRRs.
7. Conclusions
The LIDT of the ZnGeP2 crystals, manufactured using two different methods, was analyzed at 2.1 µm as a function of fluence, pulse peak intensity, and average power. The N2–N3 samples with higher structural perfection, smaller density of dislocations, and absence of twinning and stacking faults demonstrated a significantly higher LIDT compared to the N1 sample. The N2 sample was measured to have a critical fluence as high as 3.5 J/cm2 at 12 kHz pulse repartition rate, and more than 6 J/cm2 at 40 kHz.
The LIDT fluence for the N2 sample was found to be proportional to PRR. On the other hand, the N1 sample demonstrated the opposite—the LIDT fluence was inversely proportional to PRR. Finally, both the N1 sample and N2 sample showed a decrease in the LIDT peak intensity when the PRR was increased. It has been shown that an order of magnitude decrease in the dislocation concentration inside the ZGP crystal leads to the increase in the LIDT fluence by more than three times.
Our experiments have shown that the growth conditions of a ZGP single crystal that was used to make samples N2 and N3 are more optimal for achieving high LIDTs when pumped at ~2.1 μm by 18–45 nanosecond pulses at the repetition rate of 10–40 kHz. It seems that the crystal growth conditions that utilize the Bridgman method in the vertical direction can be applied by other manufacturers to reduce structural defects of ZGP single crystals. The applicability of such conditions for the growth of ZGP using the horizontal Bridgman method requires further evaluation. The obtained results cannot be automatically generalized for characterizing the LIDT of ZGP with other parameters of laser radiation (wavelength, pulse duration, pulse repetition rate) since the physical mechanisms leading to the optical damage of a single crystal can also vary. Current research has been carried out to determine the conditions of the LIDT, which is the main limiting factor for further increasing the frequency and energy characteristics of OPOs based on a ZGP single crystal that operates in the wavelength range of 3.5–5 microns. The obtained results indicate that a preferable growth mode has been revealed in terms of reducing the concentration of dislocations of the ZGP crystal lattice, which critically affect the LIDT.
The research results presented in this paper, which confirm our recent results [11,12,13], indicate that it is the concentration of dislocations that has a significant effect on the LIDT of ZGP crystals grown with a small number of impurities. The results obtained serve as information for improvement of ZGP crystal growth methods to further increase the LIDT. Further studies are needed to clarify the breakdown mechanism of ZGP crystals.
We believe that our findings can be applied to some extent to other nonlinear crystals. Specifically, it appears necessary to evaluate not only the quality of crystal polishing and deposited antireflection coatings, but also the defect structure of the crystal itself, which will possibly allow to increase its LIDT.
Author Contributions
Conceptualization, N.Y., O.A., G.V., Z.L., A.G.; methodology, O.A., N.Y., I.E., C.Y.; software, M.Z., E.S., V.V.; validation, N.Y., E.S., S.P.; formal analysis, O.A., A.Z.; investigation, N.Y., M.Z., S.P., I.E.; resources, O.A., C.Y.; data curation, E.S., M.Z.; writing—original draft preparation, E.S.; writing—review and editing, N.Y., S.P.; visualization, V.V.; supervision, N.Y., O.A.; project administration, O.A., Z.L.; funding acquisition, N.Y. All authors have read and agreed to the published version of the manuscript.
Funding
This research was supported by the Ministry of Science and Higher Education of the Russian Federation, as part of the implementation of the state tasks assignment for the Institute of Applied Physics RAS (project No. 0030-2021-0012). This research was supported by Ministry of Science and Higher Education of the Russian Federation, project No. FSWM-2020-0038. The additional estimations of the ZGP temperature rise and the damage mechanisms were made during manuscript revision by the support of the Russian Science Foundation (project No. 22-12-20035, https://rscf.ru/en/project/22-12-20035 (accessed on 26 April 2022)).
Institutional Review Board Statement
Not applicable.
Informed Consent Statement
Not applicable.
Data Availability Statement
Not applicable.
Conflicts of Interest
The authors declare no conflict of interest. The funders had no role in the design of the study; in the collection, analyses, or interpretation of data; in the writing of the manuscript, or in the decision to publish the results.
References
- Schunemann, P.G.; Zawilski, K.T.; Pomeranz, L.A.; Creeden, D.J.; Budni, P.A. Advances in nonlinear optical crystals for mid-infrared coherent sources. J. Opt. Soc. Am. B 2016, 33, D36–D43. [Google Scholar] [CrossRef]
- Hemming, A.; Richards, J.; Davidson, A.A.; Carmody, N.; Bennetts, S.; Simakov, N.; Haub, J. 99 W mid-IR operation of a ZGP OPO at 25% duty cycle. Opt. Express 2013, 21, 10062–10069. [Google Scholar] [CrossRef] [PubMed]
- Haakestad, M.W.; Fonnum, H.; Lippert, E. Mid-infrared source with 0.2 J pulse energy based on nonlinear conversion of Q-switched pulses in ZnGeP2. Opt. Express 2014, 22, 8556–8564. [Google Scholar] [CrossRef] [PubMed]
- Liu, G.; Mi, S.; Yang, K.; Wei, D.; Li, J.; Yao, B.; Yang, C.; Dai, T.; Duan, X.; Tian, L.; et al. 161 W middle infrared ZnGeP2 MOPA system pumped by 300 W-class Ho:YAG MOPA system. Opt. Lett. 2021, 46, 82–85. [Google Scholar] [CrossRef]
- Peterson, R.D.; Schepler, K.L.; Brown, J.L. Damage properties of ZnGeP2 at 2 μm. J. Opt. Soc. Am. B 1995, 12, 2142–2146. [Google Scholar] [CrossRef]
- Chumside, J.H.; Wilson, J.J.; Gribenyukov, A.I.; Shubin, S.F.; Dolgii, S.I.; Andreev, Y.M.; Zuev, V.V.; Boulder, V. Frequency conversion of a CO2 laser with ZnGeP2. In NOAA Technical Memorandum ERL WPL-224 WPL-224WPL; Air Resources Laboratory: Silver Spring, MD, USA, 1992; p. 18. [Google Scholar]
- Andreev, Y.M.; Badikov, V.V.; Voevodin, V.G.; Geiko, L.G.; Geiko, P.P.; Ivaschenko, M.V.; Karapuzikov, A.I.; Sherstov, I.V. Radiation resistance of nonlinear crystals at a wavelength of 9.55 µm. Quantum Electron. 2001, 31, 1075–1083. [Google Scholar] [CrossRef]
- Zawilski, K.T.; Setzler, S.D.; Schunemann, P.G.; Pollak, T.M. Increasing the laser-induced damage threshold of single crystal ZnGeP2. J. Opt. Soc. Am. B 2006, 23, 2310–2316. [Google Scholar] [CrossRef]
- Hildenbrand, A.; Kieleck, C.; Tyazhev, A.; Marchev, G.; Stöppler, G.; Eichhorn, M.; Schunemann, P.; Panyutin, V.L.; Petrov, V. Laser damage of the nonlinear crystals CdSiP2 and ZnGeP2 studied with nanosecond pulses at 1064 and 2090 nm. Opt. Eng. 2014, 53, 122511–122516. [Google Scholar] [CrossRef]
- Schunemann, P. Infrared Optics: New Materials Extend Laser Spectral Coverage Deep into the Infrared; Laser Focus World: Nashua, NH, USA, 2018. [Google Scholar]
- Yudin, N.; Khudoley, A.; Zinoviev, M.; Podzvalov, S.; Slyunko, E.; Zhuravleva, E.; Kulesh, M.; Gorodkin, G.; Kumeysha, P.; Antipov, O. The Influence of Angstrom-Scale Roughness on the Laser-Induced Damage Threshold of Single-Crystal ZnGeP2. Crystals 2022, 12, 83. [Google Scholar] [CrossRef]
- Yudin, N.N.; Antipov, O.L.; Gribenyukov, A.I.; Aronov, I.D.; Podzivalov, S.N.; Zinoviev, M.M.; Voronin, L.A.; Zhuravleva, E.V.; Zykova, M.P. Effect of postgrowth processing technology and laser radiation parameters at wavelengths of 2091 and 1064 nm on the laser-induced damage threshold in ZnGeP2 single crystal. Quantum Electron. 2021, 51, 306–316. [Google Scholar] [CrossRef]
- Yudin, N.N.; Zinoviev, M.; Gladkiy, V.; Moskvichev, E.; Kinyaevsky, I.; Podzyvalov, S.; Slyunko, E.; Zhuravleva, E.; Pfaf, A.; Yudin, N.A.; et al. Influence of the Characteristics of Multilayer Interference Antireflection Coatings Based on Nb, Si, and Al Oxides on the Laser-Induced Damage Threshold of ZnGeP2 Single Crystal. Crystals 2021, 11, 1549. [Google Scholar] [CrossRef]
- Gribenyukov, A.I.; Dyomin, V.V.; Olshukov, A.S.; Podzyvalov, S.N.; Polovtsev, I.G.; Yudin, N.N. Investigation of the process of optical damage of ZnGeP2 crystals using digital holography. Rus. Phys. J. 2019, 61, 2042–2052. [Google Scholar] [CrossRef]
- Ristau, D. (Ed.) Laser-Induced Damage in Optical Materials; CRC Press Taylor & Francis Group: Boca Raton, FL, USA, 2015. [Google Scholar]
- Manenkov, A.A.; Prokhorov, A.M. Laser-induced damage in solids. Sov. Phys. Uspekhi 1986, 29, 104–122. [Google Scholar] [CrossRef]
- Verozubova, G.A.; Gribenyukov, A.I.; Mironov, Y.P. Two-temperature synthesis of ZnGeP2. Inorg. Mater. 2007, 43, 1040–1045. [Google Scholar] [CrossRef]
- Dyomin, V.V.; Gribenyukov, A.I.; Podzyvalov, S.N.; Yudin, N.N.; Zinoviev, M.M.; Polovtsev, I.G.; Davydova, A.; Olshukov, A.S. Application of Infrared Digital Holography for Characterization of Inhomogeneities and Voluminous Defects of Single Crystals on the Example of ZnGeP2. Appl. Sci. 2020, 10, 442. [Google Scholar] [CrossRef] [Green Version]
- Dyomin, V.V.; Gribenyukov, A.I.; Davydova, A.; Zinoviev, M.M.; Olshukov, A.S.; Podzyvalov, S.N.; Polovtsev, I.G.; Yudin, N.N. Holography of particles for diagnostics tasks [Invited]. Appl. Opt. 2019, 58, G300–G310. [Google Scholar] [CrossRef]
- Gribenyukov, A.I.; Yudin, N.N.; Podzyvalov, S.N.; Zinoviev, M.M.; Olshukov, A.S.; Shumeiko, A.S.; Soldatov, A.N.; Yudin, N.A. Visualization of Volumetric Defects in a ZnGeP2 Single-Crystal by Digital Holography Method Using Strontium Vapor Laser Radiation. Opt. Mem. Neural Netw. 2020, 29, 147–156. [Google Scholar] [CrossRef]
- Verozubova, G.A.; Okunev, A.O. Growth of ZnGeP2 Nonlinear Optical Crystals and Their Study by X-ray Topography. Adv. Sci. Lett. 2013, 19, 967–971. [Google Scholar] [CrossRef]
- Lei, Z.; Okunev, A.O.; Zhu, C.; Verozubova, G.A.; Yang, C. Imaging of microdefects in ZnGeP2 single crystals by X-ray topography. J. Cryst. Growth 2020, 534, 125487–125492. [Google Scholar] [CrossRef]
- Lei, Z.; Okunev, A.O.; Zhu, C.; Verozubova, G.A.; Ma, T.; Yang, C. Photoelasticity method for study of structural imperfection of ZnGeP2 crystals. J. Cryst. Growth 2016, 450, 34–38. [Google Scholar] [CrossRef]
- Antipov, O.L.; Kositsyn, R.I.; Eranov, I.D. 36W Q-switched Ho3+: YAG laser at 2097 nm pumped by a Tm fiber laser: Evaluation of different Ho3+ doping concentrations. Laser Phys. Lett. 2017, 14, 015002. [Google Scholar] [CrossRef]
- ISO 11146-1:2021; Lasers and Laser-Related Equipment—Test Methods for Laser Beam Widths, Divergence Angles and Beam Propagation Ratios—Part 1: Stigmatic and Simple Astigmatic Beams. ISO: Geneva, Switzerland, 2021.
- Schnars, U.; Juptner, W. Digital Hologram Recording, Numerical Reconstruction, and Related Techniques; Springer: Berlin, Germany, 2005. [Google Scholar]
- Dyomin, V.V.; Kamenev, D.V. Influence of characteristics of the camera used to record digital in-line holograms of particles, on the quality of the reconstructed images. Rus. Phys. J. 2013, 55, 1307–1313. [Google Scholar] [CrossRef]
- ISO 11254-2:2001; Lasers and Laser-Related Equipment—Determination of Laser-Induced Damage Threshold of Optical Surfaces—Part 1: 1-on-1 Test and Part 2: S-on-1 Test. ISO: Geneva, Switzerland, 2001.
- The R-on-1 Test, Lidaris LIDT Service. 2019. Available online: http://lidaris.com/laserdamage-testing/ (accessed on 26 April 2022).
- ISO 2602:1980; Statistical Interpretation of Test Results—Estimation of the Mean—Confidence Interval. ISO: Geneva, Switzerland, 1980.
- Fisher, R.A.; Rothamsted, M. Applications of “Student’s” Distribution. Metron 1925, 5, 90–104. [Google Scholar]
- Sun, Z.; Lenzner, M.; Rudolph, W. Generic incubation law for laser damage and ablation thresholds. J. Appl. Phys. 2015, 117, 073102. [Google Scholar] [CrossRef]
- Demos, S.G.; DeMange, P.; Negres, R.A.; Feit, M.D. Investigation of the electronic and physical properties of defect structures responsible for laser-induced damage in DKDP crystals. Opt. Express 2010, 18, 13788–13804. [Google Scholar] [CrossRef] [Green Version]


Publisher’s Note: MDPI stays neutral with regard to jurisdictional claims in published maps and institutional affiliations. |
© 2022 by the authors. Licensee MDPI, Basel, Switzerland. This article is an open access article distributed under the terms and conditions of the Creative Commons Attribution (CC BY) license (https://creativecommons.org/licenses/by/4.0/).