Article

Optimal Doping Concentrations of Nd3+ Ions in CYGA Laser Crystals

1
Guangdong Provincial Engineering Research Center of Crystal and Laser Technology, Guangzhou 510632, China
2
Department of Optoelectronic Engineering, Jinan University, Guangzhou 510632, China
*
Author to whom correspondence should be addressed.
Crystals 2024, 14(2), 168; https://doi.org/10.3390/cryst14020168
Submission received: 26 December 2023 / Revised: 13 January 2024 / Accepted: 15 January 2024 / Published: 7 February 2024
(This article belongs to the Special Issue Photoelectric Functional Crystals)

Abstract

:
The kinetic process of the excited state population of Nd3+ ion in Nd: CaY0.9Gd0.1AlO4 (Nd: CYGA) crystal were studied in detail to estimate the optimal doping concentration, which maximize ~1 μm fluorescence emission from the 4F3/2 state to the 4I9/2 state of Nd3+. The analysis was accomplished by revealing the dependence of the excited state population on the doping concentration in a relatively convenient way in theory. After comparing the theoretical prediction results with the experimental findings and approximating the results obtained using the aforementioned method, the optimal relative doping concentration of Nd: CYGA was determined to be 2.1 at.%, which closely matched the 2.0 at.% obtained through experimental comparison. This verifies the effectiveness and accuracy of the proposed method. In particular, it is worth mentioning that in this method only one doping concentration of the crystal is required to obtain the optimal concentration, which may be used to guide the concentration optimization process for improving efficiency and saving resources.

1. Introduction

Rare earth (RE) ions are natural candidates for active ions in solid-state laser materials because they exhibit an abundance of sharp fluorescent transitions that represent nearly every region of the visible and near-infrared portions of the electromagnetic spectrum. One characteristic of these lines is that they can be very sharp, even in the case of locally strong fields in the crystal, due to the shielding effect of the outer electrons [1]. Due to the outstanding characteristics of rare earth ions, such as the many excitation levels suitable for optical pumping, sharp absorption, and emission bands in the ultraviolet (UV) to infrared (IR) spectrum, and longer service life, they are well-suited for optical devices, including solid-state lasers, fiber amplifiers, infrared to visible up-converters, phosphors, field emission displays, biosensors, and so on. Solar cells, etc., are suitable for a variety of applications [2,3,4,5].
Neodymium (Nd3+) is the most successful type of active ion used in solid-state lasers and has been used in more types of crystal and glass hosts than any other ion to date. It can be used as a pulsed or continuous-wave laser with a sharp emission line. The most common emission wavelength is around 1 μm, but there are several possible laser transitions in the near-infrared region of the spectrum, in addition to near-ultraviolet laser lines [6]. Crystals doped with rare earth ions and exhibiting a combination of active (laser) and nonlinear properties (“active-nonlinear” crystals) have been investigated intensively during the last decade [7,8,9,10]. Earlier studies show Nd3+ concentrations greater than 1 at.% result in self-quenching in the fluorescence lifetime, a reduction in fluorescence intensity, and steep increment in threshold [11,12,13,14,15,16]. When increasing the active impurity concentration of laser crystals to search for high efficiency fluorescence emission, several processes such as concentration quenching of the luminescence and cross-relaxation of the active impurity may arise. These processes are the subject of important research as they can improve or restrict the luminescent properties of laser crystals [17]. The spontaneous emission and non-radiative relaxation rates of the excited state, as well as the cross section of excited emission, are required for the design of laser devices. They are used to determine energy storage time, laser efficiency, gain coefficient, and thermal energy deposition rate. It is well known that in order to obtain good laser output characteristics, the active impurity concentration of laser crystals must be optimized. There is an optimal active impurity concentration for the laser crystals, for which the luminescence emission intensity is highest [18]. Thus, usually experiments are performed over a series of laser crystals with different doping concentrations to obtain the optimal active impurity concentration. However, the growth of many crystals to research the concentration dependence of such process to evaluate optical concentration for the use of laser systems is a time consuming and costly procedure. Therefore, it is necessary to look for new approaches, in which experiment and theory are carried out only over a small number of crystal samples, with the aid of models which describe the concentration dependent performances. In theory, the analysis of the optimum concentration can be carried out by calculating the kinetic process of transition between energy levels, but it is rather complicated with many indispensable parameters, such as radiative transition rate, non-radiative transition rate, excited state absorption, up-conversion process, cross-relaxation, and so on [19,20,21,22,23,24,25].
In this work, the optimal doping concentration of Nd3+ in Nd: CaY0.9Gd0.1AlO4 (Nd: CYGA) was obtained in a relatively convenient way, which was in the view of maximizing the excited state population in theory. Moreover, the effectiveness and correctness of the proposed method were verified by comparing the theoretical calculation results with the experimental results. In particular, it is worth mentioning that in this method only one doping concentration of the crystal is required to obtain the optimal concentration, which may be used to guide the concentration optimization process effectively in theory, to improve efficiency and save resources. By fully utilizing the kinetic process in the crystal and combining it with the corresponding theoretical equation, we can analyze the optimal doping concentration of the doped crystal using a small number of crystal samples. It is not necessary to prepare multiple samples for data measurement, as the optimal doping concentration of the crystal can be obtained through comparative experiments. This method offers great convenience for preparing crystals with excellent performance and demonstrates full innovation and reliability.

2. Theoretical Analysis

Under the influence of a pump light, the rate at which the population number NC of the laser crystal transitions from the excited state to another state within a given time interval can be described as follows [26]:
N c η N a b s
where Nabs represents the number of photons absorbed by the crystal per unit time, η denotes the fluorescence quantum efficiency. The equation for Nabs is as follows [27]:
N a b s = n σ l
where σ represents the absorption cross section, l denotes the length of sample, and n signifies the dopant ion concentration. And n can be written as n = x n 0 , where x represents the relative doping concentration, and n 0 denotes the number of lattice positions in the crystal where dopant ions can be replaced. For CYGA crystals, our measurement is n 0   = 0.912 × 1022 cm−3, which characterizes the number of Nd3+ in a unit cubic centimeter volume. Upon substituting Equation (2) into Equation (1), the resulting expression is obtained:
N c x n 0 σ l η
for the laser crystal specimen whose length and concentration are determined, n 0 , σ and l are all fixtures; therefore:
N c x η
For sensitized laser crystals, the transition between active ions and sensitized ions is mainly an electric dipole transition. The population number of doped ions, N t , which characterize the dipole interaction and migration between doped ions, can be expressed by the microscopic parameters, r and w ¯ , as follow [28]:
N t = N 0 exp t τ 0 r t w ¯ t
where N 0 represents the population number of the excited state when the fluorescence begins to decay. τ 0 is referred to as the fluorescence lifetime, which signifies the time needed for N(t) to decrease to N 0 / e when the concentration of doped ions is very low ( r = w ¯ = 0). The microparameters r and w ¯ can be expressed as follows [29]:
r = 4 3 π 3 2 n A C D A 1 2
w ¯ = π 2 π 3 5 2 n A n D C D A 1 2 C D D 1 2
The variables n A and n D represent the concentrations of the energy recipient (active ion) and the energy donor (sensitized ion), respectively. Since Nd: CYGA is solely doped with Nd3+, the values of the two in this paper are equivalent, specifically, n A = n D . CDD and CDA are microparameters associated with energy transfer [30,31,32], specifically pertaining to donor–donor and donor–recipient energy transfer within laser crystals.
For a single doped crystal, n A = n D = x n 0 . Substituting this relation into Equations (6) and (7), it can be obtained,
r = 4 3 π 3 2 C D A 1 2 n 0 x = r 0 x
w ¯ = π 2 π 3 5 2 C D A 1 2 C D D 1 2 n 0 2 x 2 = w ¯ 0 x 2
The definition of η is as follows:
η = 1 τ 0 0 N ( t ) N ( 0 ) d t
Substituting Equation (5) into its definition yields:
η = 1 τ 0 0 exp t τ 0 r t w ¯ t d t     = 1 τ 0 1 w ¯ + 1 τ 0 r π exp r 2 / 4 w ¯ + 1 τ 0 2 w ¯ + 1 τ 0 3 / 2 1 ϕ r 2 w ¯ + 1 τ 0 1 / 2
where ϕ denotes the error function [33]; then, Equation (11) is substituted into Equation (4), and finally combine Equations (8) and (9), the functional relationship between the population of the excited state and the relative doping concentration can be obtained:
N c x τ 0 1 w ¯ 0 x 2 + 1 τ 0 π r 0 x e x p r 0 2 x 2 4 w ¯ 0 x 2 + 1 / τ 0 2 w ¯ 0 x 2 + 1 τ 0 3 / 2 1 ϕ r 0 x 2 w ¯ 0 x 2 + 1 τ 0
In Equation (12), x signifies the relative doping concentration, r 0 and w ¯ 0 are the fixed coefficients in the microscopic parameters used to characterize the cross-relaxation process between doping ions. When the relative doping concentration x is determined, their values will also be fixed. The equations of r 0 and w ¯ 0 are shown as follows:
r 0 = 4 3 π 3 / 2 C D A 1 / 2 n 0
w ¯ 0 = π 2 π 3 5 / 2 C D A 1 / 2 C D D 1 / 2 n 0 2
Based on the Equations (12)–(14), it is evident that the optimal doping concentration can be determined by obtaining the values of τ 0 , CDD, and CDA.
CDD and CDA represent microscopic energy transfer parameters, that describe the processes of donor–donor energy migration and donor–acceptor energy migration within crystalline structures. Typically, at extremely low concentrations of donors, the interactions between donors themselves are nearly insignificant. In a particular instance, the decay of donor luminescence displays a nonexponential behavior, which can be elucidated through a nonradiative interaction model of the donor–acceptor energy transfer mechanism. The energy transfer rate in this context is constrained by its linear relationship with the concentration of acceptor ions, while remaining unaffected by the concentration of donor ions. However, when the concentration of the donor is increased, the energy transfer between donors becomes more significant compared to the energy transfer between the donor and acceptor. This phenomenon leads to a rapid and intense excitatory response from the donor before the actual transfer of energy between the donor and acceptor takes place. This transfer occurs within a very short distance, known as the hypermigration zone. In this zone, the decay curve is constrained by its exponential nature, and the rate of energy transfer is directly proportional to the concentration of acceptor ions [31]. In addition to extreme cases, intermediate cases do exist. In this case, the energy transfer is assisted by donor migration, but the energy transfer rate is linearly dependent on the acceptor and donor ion concentrations of the crystal. In this work, the CYGA crystals were doped with Nd3+, so that both the donor and recipient were Nd3+, resulting in self-quenching.
Although Equation (12) is derived under the condition of pulsed pumping, a simple mathematical transformation shows that it also applies to continuous pumping. In Equation (12), τ 0 , r 0 , and w ¯ 0 are constants that do not vary with the concentration of doped ions. The acquisition of these three values allows for a clear understanding of the kinetic process of the excited state population and the optimal relative doping concentration.
The fixed microparameters r 0 and w ¯ 0 , which are used to characterize the cross-relaxation process between doped ions, are calculated by means of the spectral overlap model and the fluorescence decay kinetics of crystals.
For the spectral overlap model, according to the Forster–Dexter theory, the energy transfer between the donor and the acceptor depends on the overlap of the donor’s emission spectrum and the acceptor’s absorption spectrum. Therefore, the relationship used is as follows [34,35,36,37,38,39]:
C D X = 3 c 8 π 4 n 2 σ D e m ( λ ) σ X a b s ( λ ) d λ
where X is either donor D or acceptor A. As the concentration of Nd3+ increases in the materials we use, the non-radiative relaxation rate increases due to ion–ion interactions. During the cross-relaxation (CR) process, the excited energy is initially located on one ion and is then partially transferred to neighboring ions. This results in both ions being left at lower energy levels, which rapidly decay to their respective ground states. The migration of the excited state through jump processes (Excited Migration, EM) does not extinguish the luminescence itself. Instead, it facilitates the movement of the excited state to a position where faster quenching occurs; thereby enhancing the process of multiphonon emission. Both CR and EM processes are examples of dipole–dipole non-radiative energy transfer mechanisms. According to the Forster–Dexter theory, the dipole–dipole transfer decreases inversely as the sixth power of the distance between the interaction centers. Therefore, simply put, CDD is related to the material’s EM process, while CDA is associated with the material’s CR process. These two processes will enable us to identify spectral overlap in the fluorescence emission cross section and absorption cross section of the material. Figure 1 shows the energy level diagram of Nd3+. It can be seen that the level gap between level 4I15/2 and level 4I11/2 is about 4000 cm−1, which is very close to the gap between level 4I13/2 and level 4I9/2. Therefore, the energy emitted by Nd3+ from level 4I15/2 to level 4I11/2 can be absorbed by level 4I9/2 to level 4I13/2. Based on this cross-relaxation process (4I15/2 + 4I9/24I11/2 + 4I13/2), we can calculate the microparameter CDA by the spectral overlap in ~2.4 μm. In addition, Nd3+ reached an excited state by ground-state absorption (GSA), and then transitioned to return to the ground state, which also produces spectral overlap. Based on this process, we can calculate another microparameter CDD.

3. Results and Discussion

3.1. Spectral Overlap Model

The synthesis of polycrystalline materials required for crystal growth is achieved through solid-phase sintering. The initial raw materials are proportioned and weighed according to the following chemical reaction of Equation (16):
C a C O 3 + 0.005 N d 2 O 3 + 0.05 G d 2 O 3 + 0.445 Y 2 O 3 + 0.05 A l 2 O 3 C a 2 G d 0.1 N d 0.01 Y 0.89 A l O 4 + C O 2
The raw materials are weighed and thoroughly mixed in the mixer for over 24 h. Subsequently, the evenly mixed raw materials are loaded into a customized mold, compressed into dense cylindrical blocks using a cold isostatic press, and finally placed into a corundum crucible and sintered using a muffle furnace. First, it takes 10 h to rise from room temperature to 1350 °C, then it maintains a constant temperature for 20 h, and finally takes 10 h to reduce to room temperature. This process yields the Nd: CYGA polycrystalline material required for the experiment.
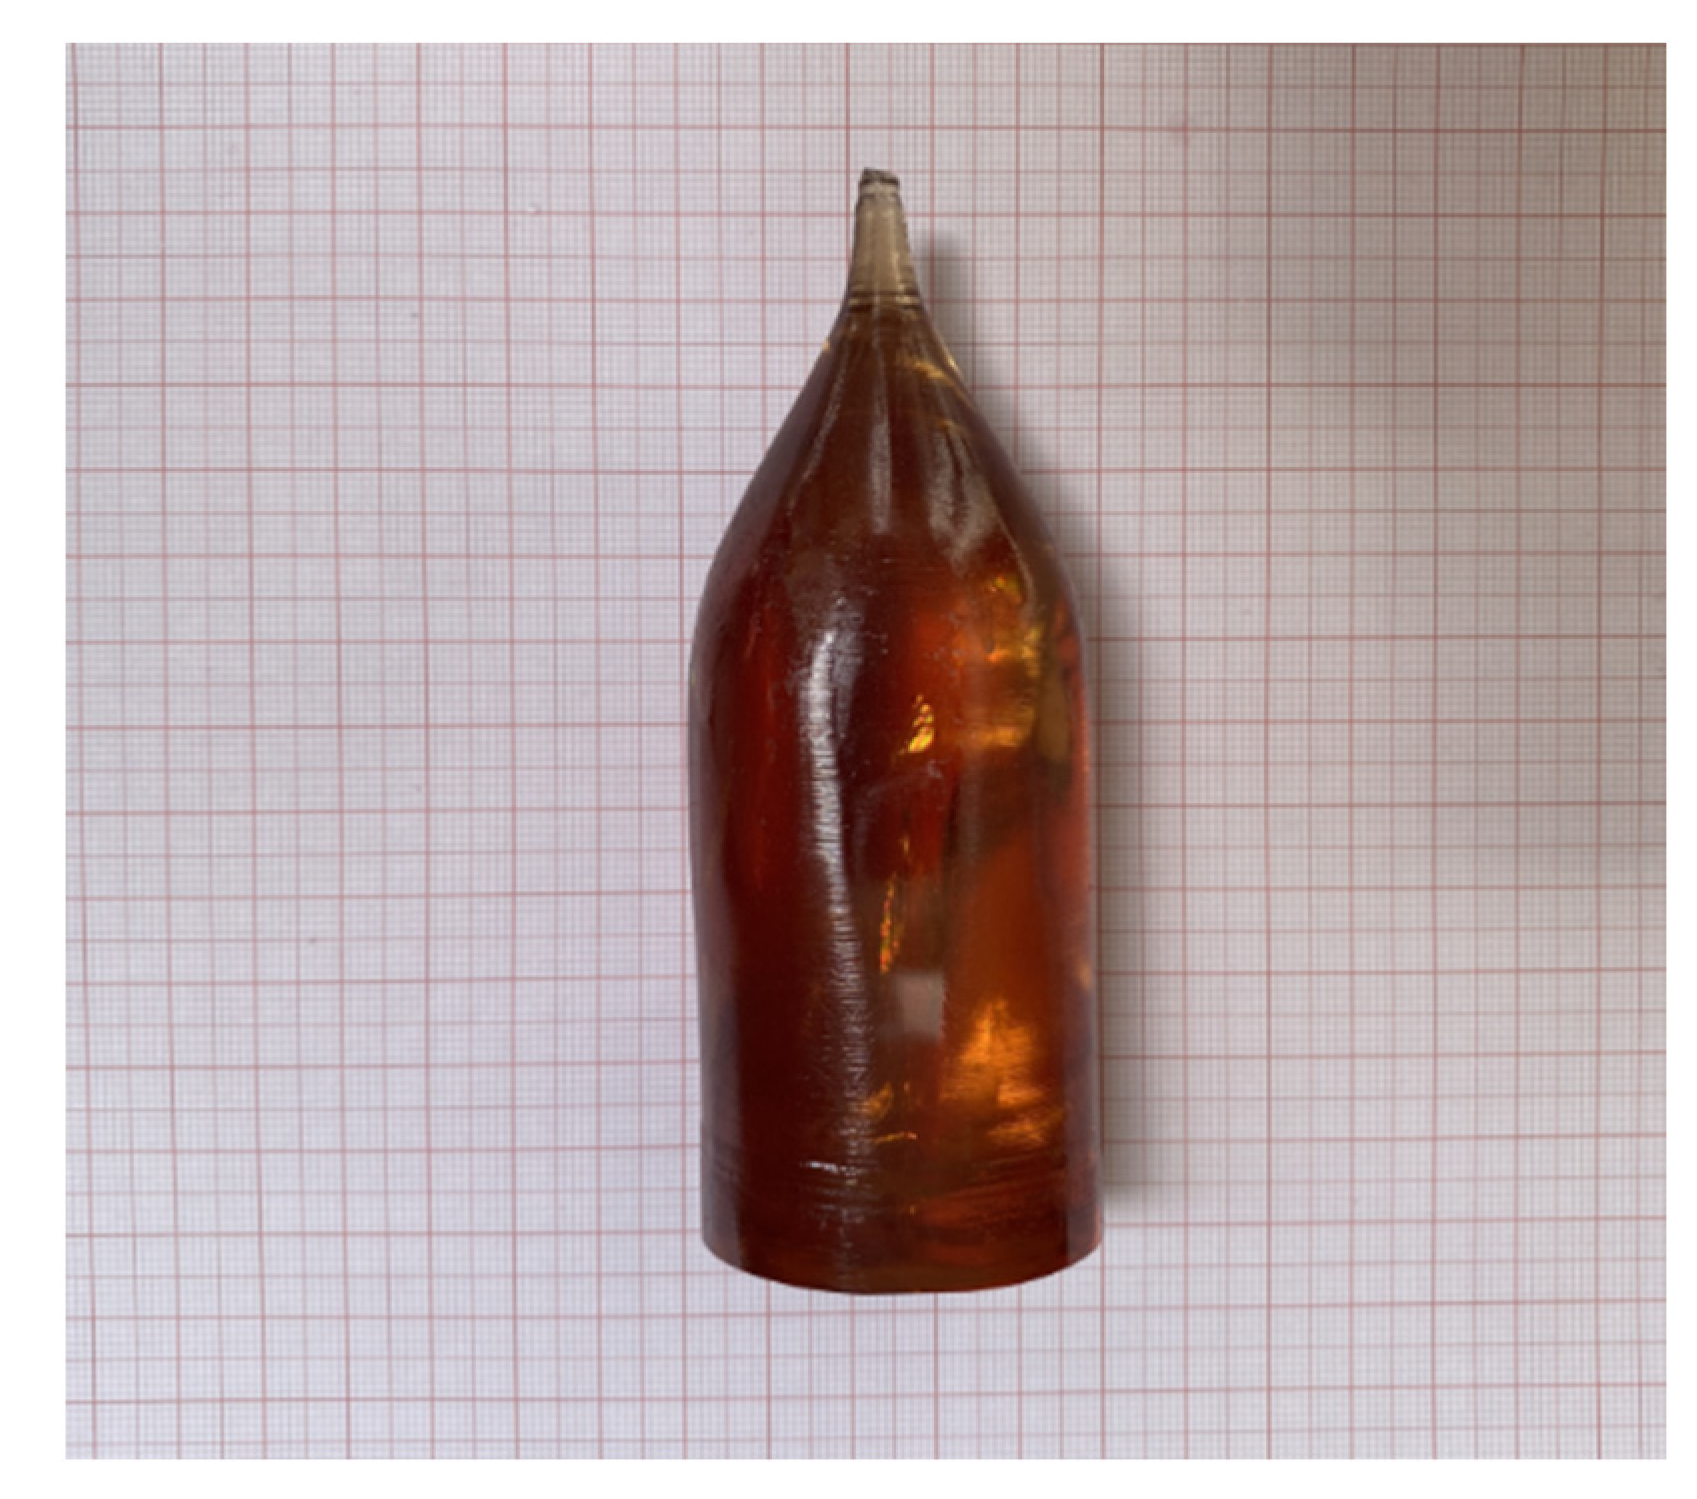
After preparing the polycrystalline material, we can utilize the lifting furnace for crystal growth. According to the melting point of CYGA crystal, which is 1810 °C, an iridium gold crucible was selected for crystal growth. A high-quality CYA crystal in the <110> direction (0.5 × 0.5 × 50 mm3) was chosen as the seed crystal. Nd: CYGA crystals with a diameter of 45mm and a length of 70 mm were finally obtained after cleaning, furnace loading, chemical charging, crystal drawing, shoulder setting, equal diameter growth, pulling, and cooling, as shown in Figure 2.
The crystal appears brownish-yellow, likely due to the presence of a mixture of oxygen and nitrogen during its growth. This phenomenon is also observed in CYA crystals grown using the lifting method, and these color defects are believed to be associated with oxygen-related point defects.
The fluorescence lifetime can be obtained by fitting the fluorescence decay curve according to a single exponential decay, I = A × exp(t/τ). Here, we employed a 1.0 at.% Nd: CYGA single crystal sample for theoretical calculations and measured the fluorescence decay of its emission at 1.06 μm upon excitation at 808 nm. The result is shown in Figure 3 and its fluorescence lifetime is 140 μs.
At room temperature, we measured the absorption spectrum and the emission spectrum at 808 nm excitation of the 1.0 at.% Nd: CYGA single crystal sample, calculating the absorption cross section and emission cross section. The results are shown in Figure 4. There is a clear spectral overlap at around 900 nm, as depicted in Figure 4b, which is attributed to the excited migration process resulting from the interaction of Nd3+ with 4F3/2 and 4I9/2 energy levels. According to the spectral overlap model, CDD = 75.75 × 10−40 cm6s−1 was calculated with Equation (15).
Currently, there exist two primary approaches for computing the transmitting cross section, namely the reciprocity method and the Fuchtbauer–Ladenburg equation [40]. The equation for the reciprocity method is only applicable to the region where absorption is significant. The F–L equation is suitable for the long wavelength side of the absorption spectrum, and it is valid only in the spectral region without self-absorption, otherwise it cannot be applied to fundamental transitions. At ~2.4 μm, it is difficult to calculate the emission cross section of the 1.0 at.% Nd: CYGA single crystal sample from using the conventional F–L method due to its weak luminescence intensity; therefore, the reciprocity method is employed to determine the emission cross section, specifically the McCumber function, which can be mathematically represented as follows [41,42,43]:
σ em   ( λ ) = Z l Z u σ a b s ( λ ) e x p h c k B T 1 λ Z L 1 λ
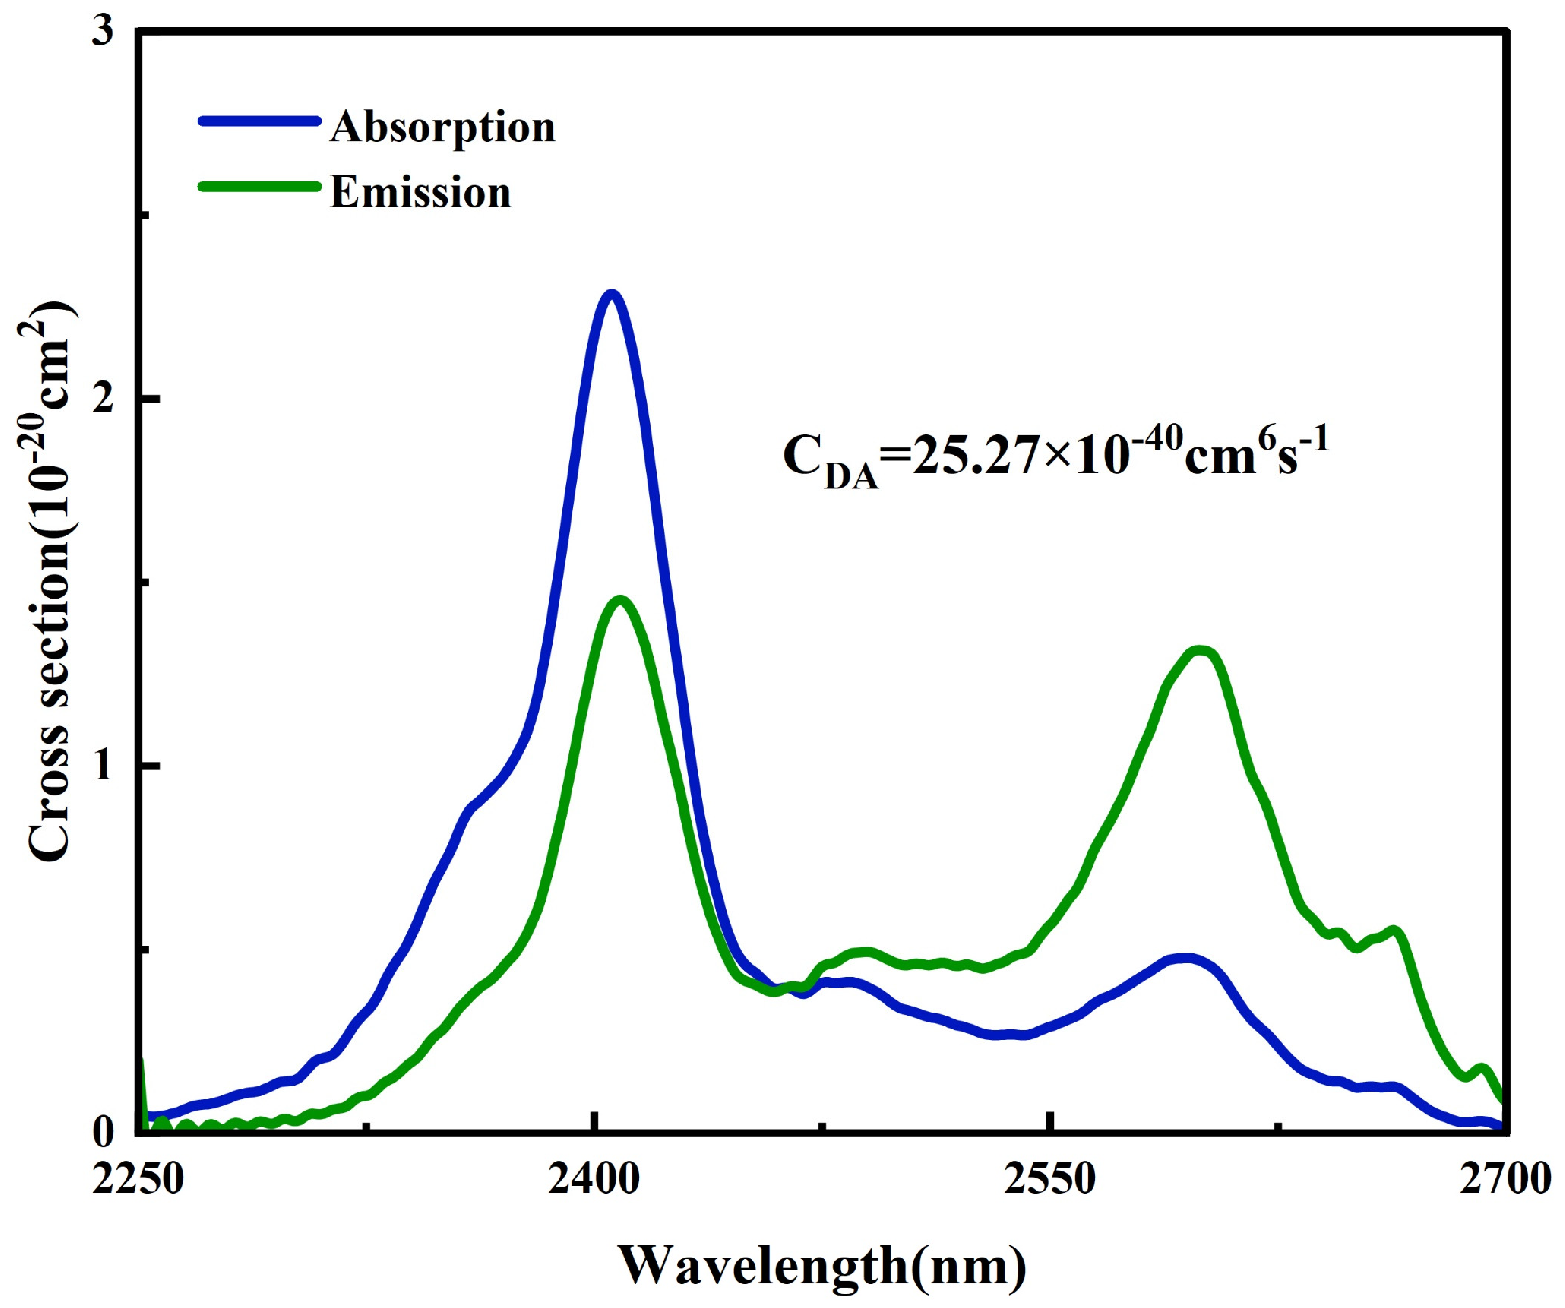
where h represents Planck’s constant, kB denotes Boltzmann’s constant, T (Kelvin temperature) signifies the experimental temperature, λZL represents the wavelength of the null line, and Zl and Zu are the degeneracy of lower and upper transition levels, respectively. According to Equation (17), the emission cross section in the vicinity of the ~2.4 μm band can be determined. Figure 4 shows the absorption and emission cross sections of the sample within the wavelength range of 2250 nm to 2700 nm. As depicted in Figure 5, there is an overlap between the absorption cross section and the emission cross section. This overlap is a result of the cross-relaxation process that occurs due to the interaction of the 4I15/24I11/2 emission spectrum and the 4I9/24I13/2 absorption spectrum of Nd3+. Hence, the spectral overlap model is utilized for this band, resulting in the determination of CDA = 25.27 × 10−40 cm6 s−1.
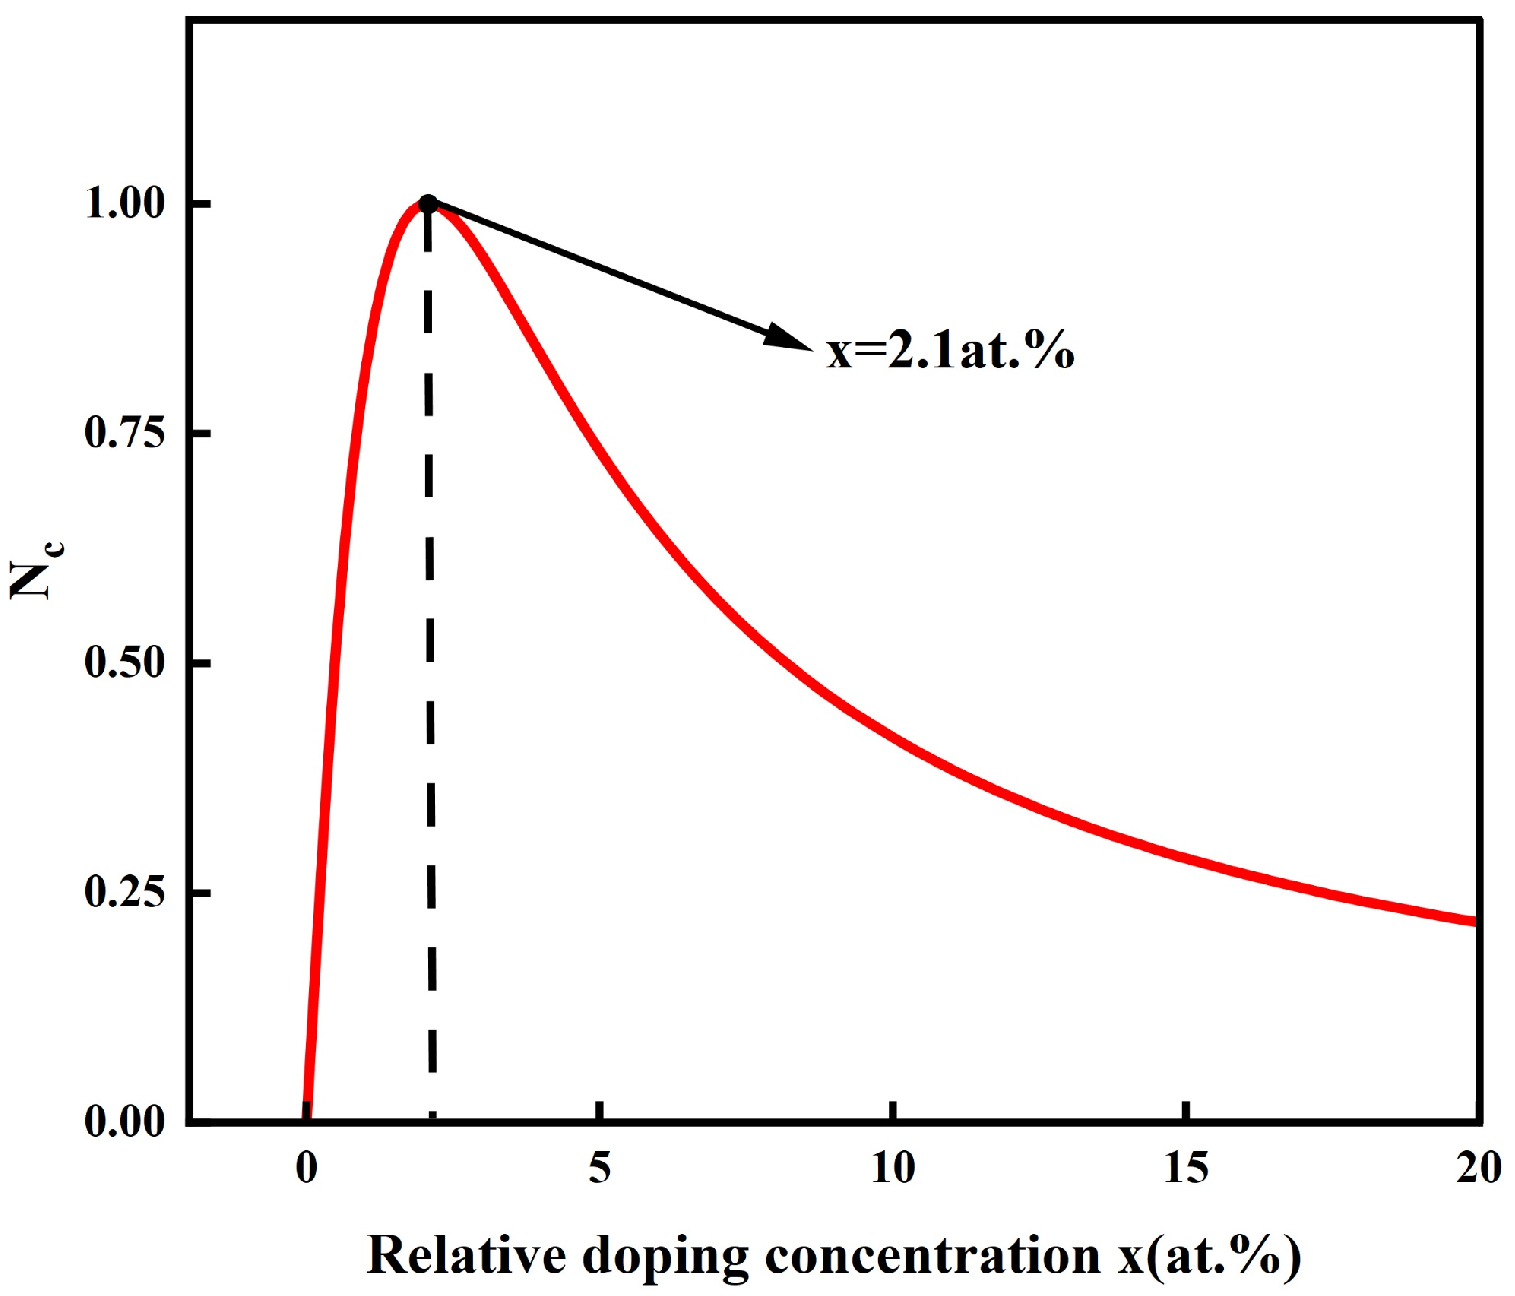
To summarize, the values of CDD and CDA of the sample are obtained, and these values are then substituted into Equation (12) to determine the optimal relative doping concentration. Figure 6 shows the correlation between the population NC transitioning from the excited state and the relative doping concentration, x of Nd3+ in Nd: CYGA, as per the spectral overlap model. It shows that higher Nc can be obtained at a relative doping concentration of 2.1 at.% Nd3+.
In previous studies, the microparameters CDD and CDA were commonly employed to quantify non-radiative relaxation effects. These parameters are associated with the critical energy transfer range and spontaneous emissivity. Therefore, we calculated the CDD and CDA values of Nd: CYGA using mathematical equations. It is commonly believed that the critical range of energy transfer holds a greater physical significance and can be conceptually valuable for scientists investigating the structural characteristics of materials and their quantum electronic properties. However, when considering the critical range of energy transfer, it is worth noting that these two parameters can be calculated with relative ease and provide sufficient information for analyzing the optimal relative doping concentration of the crystal.

3.2. Experiment Validation

Based on the preceding discourse, the initial step involves deriving the values of fluorescence lifetime, τ 0 , and the microparameter CDD for energy transfer. Based on the spectral overlap model, the microparameter CDA is calculated, yielding an optimal relative doping concentrations of 2.1 at.%. We conducted measurements of the fluorescence intensity curves of Nd: CYGA at various relative doping concentrations.
Figure 7a shows the fluorescence intensity curves of Nd: CYGA at 0.3 at.%, 0.6 at.%, 1.0 at.%, 1.5 at.%, 2.0 at.%, 3.0 at.%, 4.0 at.%, and 5.0 at.%. It can be observed from Figure 7, that the peak shape of the fluorescence intensity curve of Nd: CYGA remains consistent. Figure 7b shows the fluorescence emission intensity of Nd: CYGA at different relative doping concentrations. It illustrates that the fluorescence emission intensity is maximized when the relative doping concentration of Nd3+ is 2 at.%. This observation indicates that, at this given relative doping concentration, the crystal may be more inclined to generate higher-power continuous and pulsed lasers. The experimental optimal concentration (2.0 at.%) is approximated as the calculated optimal concentration (2.1 at.%), demonstrating a strong concurrence with the theoretical predictions.
The deviation in determining the optimal relative doping concentration primarily arises from the approximations in the theoretical calculation. For instance, when employing the spectral overlap model to compute the values of CDA and CDD, the chosen band’s length varies, resulting in a slight difference in the integral length during the calculation of the function integral. This discrepancy subsequently impacts the parameter value that is calculated. Moreover, the theoretical calculation relies on the measured data as its source, and the accuracy of the data itself plays a crucial role in determining the accuracy of the theoretical calculation. However, the methodology employed in this study is relatively straightforward and can be effectively integrated in practical scenarios, thereby enhancing the practicality of the theoretical calculations.

4. Conclusions

In conclusion, the kinetic process of the excited state population of Nd3+ ion in Nd: CYGA crystals was studied in detail to estimate the optimal doping concentration, which maximize ~1 μm fluorescence emission from the 4F3/2 state to the 4I9/2 state of Nd3+. The analysis was accomplished by revealing the dependence of the excited state population on the doping concentration in a relatively convenient way in theory, which was only based on the absorption and emission properties of one doping concentration.
After conducting an approximate analysis of the results obtained from the above method, it was determined that the optimal relative doping concentration of Nd: CYGA is 2.1 at.%, which closely aligns with the measured value of 2.0 at.%. The cause of the deviation was also discussed.
The methodology presented in this work is characterized by its simplicity and ease of estimation, providing valuable insights for the identification and preparation of high-quality laser crystals. Our research may be expanded to encompass a broader range of laser crystal materials, thereby offering valuable insights into their preparation and further investigation.

Author Contributions

Methodology, P.Z.; Validation, J.T.; Formal analysis, S.L.; Investigation, S.L.; Resources, P.Z. and Z.C.; Data curation, S.L.; Writing—original draft, S.L.; Writing—review & editing, J.T. and P.Z.; Supervision, P.Z.; Project administration, P.Z.; Funding acquisition, Z.L., P.Z. and Z.C. All authors have read and agreed to the published version of the manuscript.

Funding

This work was supported by Science and Technology Program of Guangzhou (2024A03J0240); Key-Area Research and Development Program of Guangdong Province (2020B090922006); National Natural Science Foundation of China (NSFC) (51972149, 62175091, 51872307, 61935010, 51702124).

Data Availability Statement

The data presented in this study are available on request from the corresponding author (accurately indicate status).

Conflicts of Interest

The authors declare no conflict of interest.

References

  1. Semwal, K.; Bhatt, S.C. Study of Nd3+ ion as a dopant in YAG and glass laser. Int. J. Phys. 2013, 1, 15–21. [Google Scholar]
  2. Reddy, C.M.; Vijaya, N.; Raju, B.D.P. NIR fluorescence studies of neodymium ions doped sodium fluoroborate glasses for 1.06 μm laser applications. Spectrochim. Acta Part A Mol. Biomol. Spectrosc. 2013, 115, 297–304. [Google Scholar] [CrossRef] [PubMed]
  3. Lourenco, S.A.; Dantas, N.O.; Serqueira, E.O.; Ayta, W.E.F.; Andrade, A.A.; Filadelpho, M.C.; Sampaio, J.A.; Bell, M.J.V.; Pereira-da-Silva, M.A. Eu3+ photoluminescence enhancement due to thermal energy transfer in Eu2O3-doped SiO2–B2O3–PbO2 glasses system. J. Lumin. 2011, 131, 850–855. [Google Scholar] [CrossRef]
  4. Tian, Y.; Chen, B.J.; Tian, B.J.; Hua, R.N.; Sun, J.S.; Cheng, L.H.; Zhong, H.Y.; Li, X.P.; Zhang, J.S.; Zheng, Y.F.; et al. Concentration-dependent luminescence and energy transfer of flower-like Y2 (MoO4)3: Dy3+ phosphor. J. Alloys Compd. 2011, 509, 6096–6101. [Google Scholar]
  5. Trupke, T.; Shalav, A.; Richards, B.S.; Würfel, P.; Green, M.A. Efficiency enhancement of solar cells by luminescent up-conversion of sunlight. Sol. Energy Mater. Sol. Cells 2006, 90, 3327–3338. [Google Scholar] [CrossRef]
  6. Chen, H.; Zhou, M.; Zhang, P.X.; Yin, H.; Zhu, S.Q.; LI, Z.; Chen, Z.Q. Passively Q-switched Nd: GYAP laser at 1.3 μm with bismuthene nanosheets as a saturable absorber. Infrared Phys. Technol. 2022, 121, 104023. [Google Scholar] [CrossRef]
  7. Palatnikov, M.N.; Biryukova, I.V.; Sidorov, N.V.; Denisov, A.V.; Kalinnikov, V.T.; Smith, P.G.R.; Shur, V.Y. Growth and concentration dependencies of rare earth doped lithium niobate single crystals. J. Cryst. Growth 2006, 291, 390–397. [Google Scholar] [CrossRef]
  8. Cerrato, E.; Gionco, C.; Berruti, I.; Sordello, F.; Calza, P.; Paganini, M.C. Rare earth ions doped ZnO: Synthesis, characterization and preliminary photoactivity assessment. J. Solid State Chem. 2018, 264, 42–47. [Google Scholar] [CrossRef]
  9. Ma, F.K.; Zhang, P.X.; Su, L.B.; Yin, H.; Li, Z.; Lv, Q.T.; Chen, Z.Q. The host driven local structures modulation towards broadband photoluminescence in neodymium-doped fluorite crystal. Opt. Mater. 2021, 119, 111322. [Google Scholar]
  10. Duan, Y.M.; Zhu, H.Y.; Xu, C.W.; Yang, H.; Luo, D.W.; Lin, H.; Zhang, J.; Tang, D.Y. Comparison of the 1319 and 1338 nm dual-wavelength emission of neodymium-doped yttrium aluminum garnet ceramic and crystal lasers. Appl. Phys. Express 2012, 6, 012701. [Google Scholar] [CrossRef]
  11. Zhang, P.X.; Wang, R.; Huang, X.B.; Li, Z.; Yin, H.; Zhu, S.Q.; Chen, Z.Q.; Hang, Y. Sensitization and deactivation effects to Er3+ at ~2.7 μm mid-infrared emission by Nd3+ ions in Gd0.1Y0.9AlO3 crystal. J. Alloys Compd. 2018, 750, 147–152. [Google Scholar] [CrossRef]
  12. Zhou, H.Q.; Zhu, S.Q.; Li, Z.; Yin, H.; Zhang, P.X.; Chen, Z.Q.; Fu, S.H.; Zhang, Q.M.; Lv, Q.T. Investigation on 1.0 and 1.3 µm laser performance of Nd3+: GYAP crystal. Opt. Laser Technol. 2019, 119, 105601. [Google Scholar] [CrossRef]
  13. Wang, Y.H.; Chen, Q.D.; Zhang, P.X.; Liao, J.Y.; Hong, H.; Chen, H.L.; Yin, H.; Hang, Y.; Li, Z.; Chen, Z.Q. Fabrication of Sb2O3 by an improved chemical reaction assisted vertical micro sublimation method and its saturable absorber performance. Opt. Mater. Express 2022, 12, 1337–1346. [Google Scholar] [CrossRef]
  14. Li, B.Z.; Chen, Q.D.; Zhang, P.X.; Tian, R.F.; Zhang, L.; Sai, Q.L.; Wang, B.; Pan, M.Y.; Liu, Y.C.; Xia, C.T.; et al. β-Ga2O3 Used as a Saturable Sbsorber to Realize Passively Q-Switched Laser Output. Crystals 2021, 11, 1501. [Google Scholar]
  15. Chen, Y.; Chen, Q.D.; Niu, X.C.; Zheng, W.B.; Zhang, P.X.; Li, Z.; Chen, Z.Q. Growth, spectroscopy properties and laser operation of a novel single crystal fiber: Nd3+-doped CaY0.9Gd0.1AlO4. Infrared Phys. Technol. 2023, 134, 104917. [Google Scholar] [CrossRef]
  16. Ikesue, A.; Kamata, K.; Yoshida, K. Effects of neodymium concentration on optical characteristics of polycrystalline Nd: YAG laser materials. J. Am. Ceram. Soc. 1996, 79, 1921–1926. [Google Scholar] [CrossRef]
  17. Denker, B.I.; Osiko, V.V.; Pashinin, P.P.; Prokhorov, A.M. Concentrated neodymium laser glasses. Sov. J. Quantum Electron. 1981, 11, 289. [Google Scholar] [CrossRef]
  18. Caird, J.A.; Ramponi, A.J.; Staver, P.R. Quantum efficiency and excited-state relaxation dynamics in neodymium-doped phosphate laser glasses. JOSA B 1991, 8, 1391–1403. [Google Scholar] [CrossRef]
  19. Fernandez, J.; Oleaga, A.; Azkargorta, J.; Iparraguirre, I.; Balda, R.; Voda, M.; Kaminskii, A.A. Nd3+ laser spectral dynamics in CaF2–YF3–NdF3 crystals. Opt. Mater. 1999, 13, 9–16. [Google Scholar] [CrossRef]
  20. Yu, H.H.; Zhang, H.J.; Wang, Z.P.; Wang, J.Y.; Yu, Y.G.; Shi, Z.B.; Zhang, X.Y.; Jiang, M.H. Continuous-wave and passively Q-switched laser performance with a disordered Nd: CLNGG crystal. Opt. Express 2009, 17, 19015–19020. [Google Scholar]
  21. Wang, Y.G.; Qu, Z.S.; Liu, J.; Tsang, Y.H. Graphene oxide absorbers for watt-level high-power passive mode-locked Nd: GdVO4 laser operating at 1 μm. J. Light. Technol. 2012, 30, 3259–3262. [Google Scholar] [CrossRef]
  22. Noom, D.W.E.; Witte, S.; Morgenweg, J.; Altmann, R.K.; Eikema, K.S.E. High-energy, high-repetition-rate picosecond pulses from a quasi-CW diode-pumped Nd: YAG system. Opt. Lett. 2013, 38, 3021–3023. [Google Scholar] [CrossRef] [PubMed]
  23. Zheng, L.; Kausas, A.; Taira, T. >MW peak power at 266 nm, low jitter kHz repetition rate from intense pumped microlaser. Opt. Express 2016, 24, 28748–28760. [Google Scholar]
  24. Chen, H.L.; Zhang, P.X.; Song, J.W.; Yin, H.; Hang, Y.; Yang, Q.G.; Li, Z.; Chen, Z.Q. Spectral broadening of a mixed Nd: CYGA crystal with tunable laser operation beyond 1100 nm. Opt. Express 2022, 30, 21943–21951. [Google Scholar] [CrossRef] [PubMed]
  25. Li, D.; Liu, Q.; Zhang, P.X.; Zhou, H.G.; Zhu, S.Q.; Zhang, Y.Q.; Li, Z.; Yin, H.; Chen, Z.Q.; Hang, Y. Crystal growth, optical properties and laser performance of new mixed Nd3+ doped Gd0.1Y0.9AlO3 crystal. J. Alloys Compd. 2019, 789, 664–669. [Google Scholar]
  26. Avanesov, A.G.; Denker, B.I.; Osiko, V.V.; Pirumov, S.S.; Sakun, V.P.; Smirnov, V.A.; Shcherbakov, I.A. Kinetics of nonradiative relaxation from the upper active level of neodymium in a Y3Al5O12 crystal. Sov. J. Quantum Electron. 1982, 12, 744. [Google Scholar] [CrossRef]
  27. Kaiser, W.; Garrett, C.G.B. Two-photon excitation in CaF2: Eu2+. Phys. Rev. Lett. 1961, 7, 229. [Google Scholar]
  28. Inokuti, M.; Hirayama, F. Influence of energy transfer by the exchange mechanism on donor luminescence. J. Chem. Phys. 1965, 43, 1978–1989. [Google Scholar] [CrossRef]
  29. Artamonova, M.V.; Briskina, C.M.; Burshtein, A.I.; Zusman, L.D.; Skleznev, A.G. Time variation of Nd3+ ion luminescence and an estimation of electron excitation migration along the ions in glass. Sov. Phys. JETP 1972, 35, 457–461. [Google Scholar]
  30. Tian, C.; Chen, X.; Yu, S.B. Concentration dependence of spectroscopic properties and energy transfer analysis in Nd3+ doped bismuth silicate glasses. Solid State Sci. 2015, 48, 171–176. [Google Scholar] [CrossRef]
  31. Sontakke, A.D.; Biswas, K.; Mandal, A.K.; Annapurna, K. Concentration quenched luminescence and energy transfer analysis of Nd3+ ion doped Ba-Al-metaphosphate laser glasses. Appl. Phys. B 2010, 101, 235–244. [Google Scholar] [CrossRef]
  32. Privis, Y.S.; Smirnov, V.A.; Shcherbakov, I.A. Determination of the optimal concentrations of active particles in laser media. Sov. J. Quantum Electron. 1983, 13, 868. [Google Scholar] [CrossRef]
  33. Matta, F.; Reichel, A. Uniform computation of the error function and other related functions. Math. Comput. 1971, 25, 339–344. [Google Scholar] [CrossRef]
  34. Zhang, L.; Zhang, C.Y.; Li, D.H.; Wei, Z.Y.; Zhang, Z.G.; Eichle, H.J.; Strohmaier, S. Characteristics of Nd: YGG laser operating at 4F3/24I9/2. Chin. Phys. Lett. 2008, 25, 3988. [Google Scholar]
  35. Braud, A.; Girard, S.; Doualan, J.L.; Moncorge, R. Spectroscopy and fluorescence dynamics of (Tm3+, Tb3+) and (Tm3+, Eu3+) doped LiYF4 single crystals for 1.5-μm laser operation. IEEE J. Quantum Electron. 1998, 34, 2246–2255. [Google Scholar] [CrossRef]
  36. Lupei, V.; Lupei, A.; Georgescu, S.; Ionescu, C. Energy transfer between Nd3+ ions in YAG. Opt. Commun. 1986, 60, 59–63. [Google Scholar] [CrossRef]
  37. Lupei, A.; Lupei, V.; Georgescu, S.; Yen, W.M. Mechanisms of energy transfer between Nd3+ Ions in YAG. J. Lumin. 1987, 39, 35–43. [Google Scholar] [CrossRef]
  38. Voron’Ko, Y.K.; Mamedov, T.G.; Osiko, V.V.; Prokhorov, A.M.; Sakun, V.P.; Shcherbakov, I.A. Nature of nonradiative excitation-energy relaxation in condensed media with high activator concentrations. Sov. J. Exp. Theor. Phys. 1976, 44, 251. [Google Scholar]
  39. Glushkov, N.A. Kinetics of nonstationary migration-accelerated energy transfer in a solid body doped with rare earth and transition-metal ions. Opt. Spectrosc. 2014, 116, 700–705. [Google Scholar] [CrossRef]
  40. Miniscalco, W.J.; Quimby, R.S. General procedure for the analysis of Er3+ cross sections. Opt. Lett. 1991, 16, 258–260. [Google Scholar] [CrossRef]
  41. Zhang, L.Y.; Zhang, J.J.; Yu, C.L.; Hu, L.L. A method for emission cross section determination of Tm3+ at 2.0 μm emission. J. Appl. Phys. 2010, 108, 103117. [Google Scholar] [CrossRef]
  42. Tian, F.; Chen, C.; Liu, Y.; Liu, Q.; Ivanov, M.; Wang, Q.Q.; Jiang, N.; Chen, H.H.; Yang, Z.X.; Xie, T.F.; et al. Fabrication of Nd: YAG transparent ceramics from co-precipitated powders by vacuum pre-sintering and HIP post-treatment. Opt. Mater. 2020, 101, 109728. [Google Scholar] [CrossRef]
  43. Kassab, L.R.P.; Fukumoto, M.E.; Gomes, L. Energy transfer in PbO-Bi2O3-Ga2O3 glasses codoped with Yb3+ and Er3+. JOSA B 2005, 22, 1255–1259. [Google Scholar]
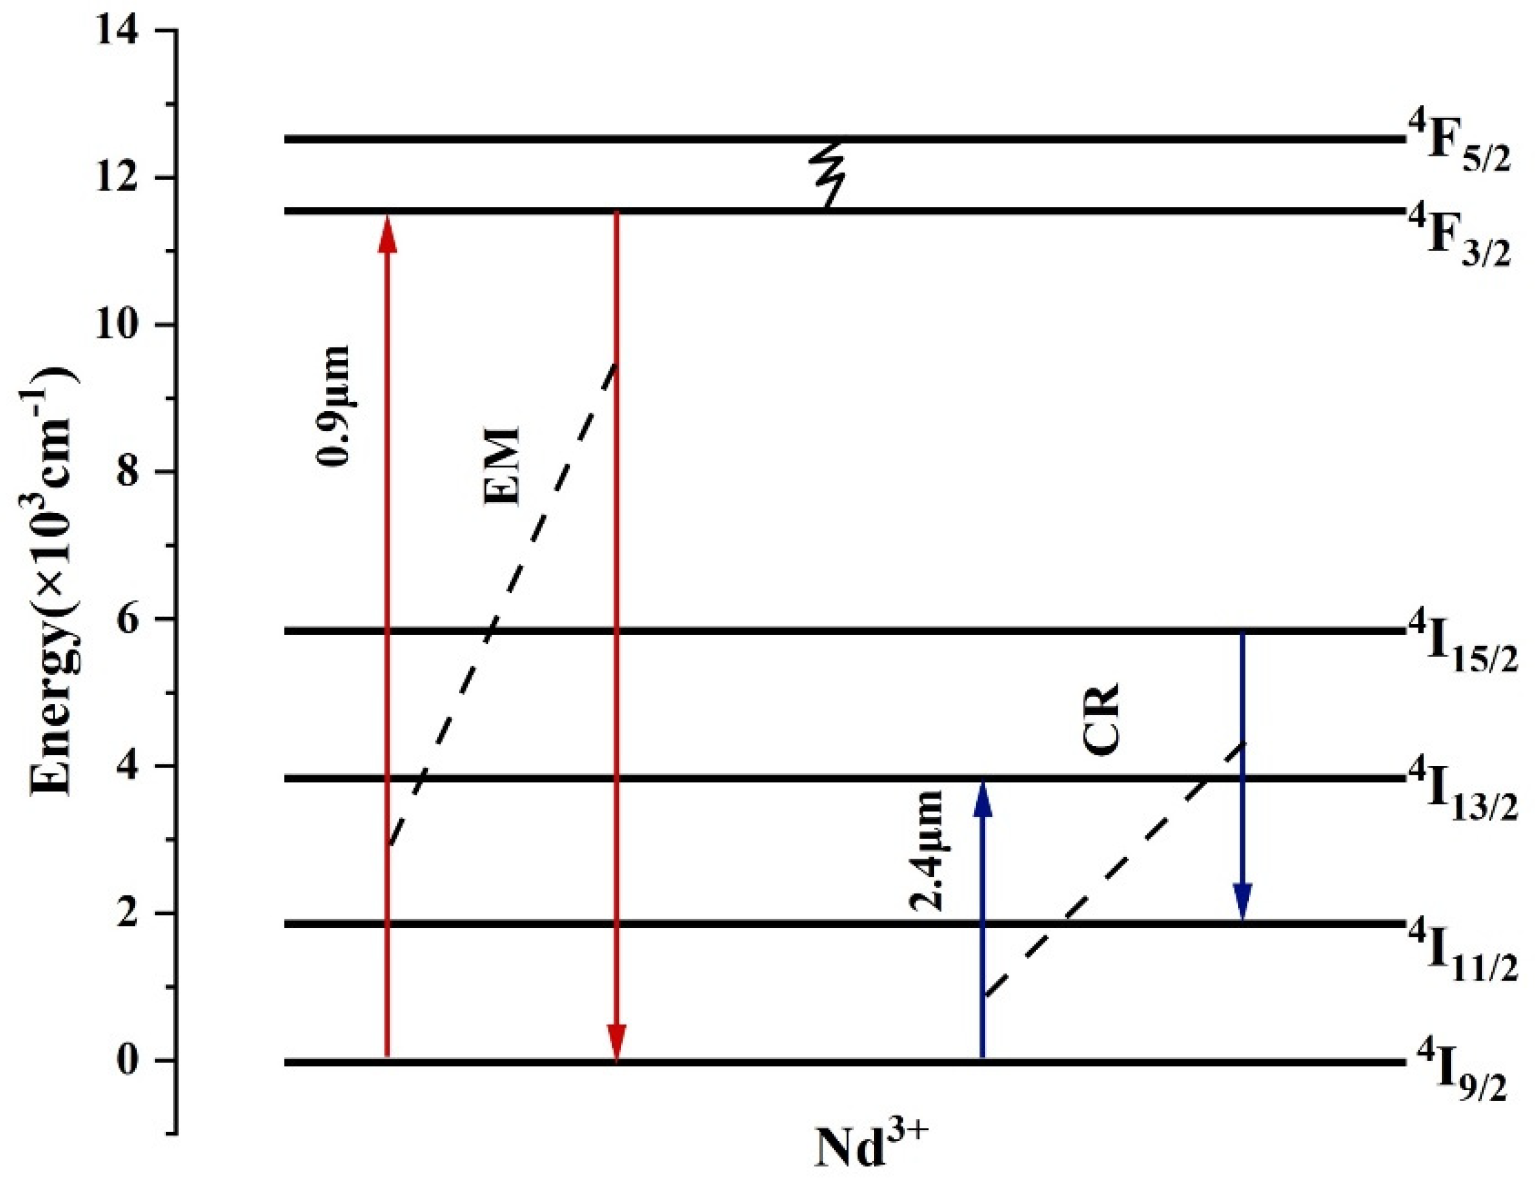
Figure 1. Energy level diagram and energy transfer mechanism of Nd3+ ions (Excited Migration: 4F3/24I9/2; Cross-Relaxation: 4I15/2 + 4I9/24I11/2 + 4I13/2).
Crystals 14 00168 g001
Figure 2. Nd: CYGA crystal before annealing.
Crystals 14 00168 g002
Figure 3. Fluorescence decay curve of 1.0 at.% Nd: CYGA single crystal.
Crystals 14 00168 g003
Figure 4. (a) The absorption cross section of Nd: CYGA crystal and the fluorescence emission cross section at around 850–1500 nm; (b) Spectral overlap at about 900 nm.
Crystals 14 00168 g004
Figure 5. Absorption and emission cross sections of Nd: CYGA crystal at around 2250–2700 nm.
Crystals 14 00168 g005
Figure 6. The relationship between the population of excited states and the relative doping concentration.
Crystals 14 00168 g006
Figure 7. (a) Multi-concentration fluorescence intensity curve of Nd: CYGA; (b) Comparison of peak fluorescence intensity at different relative doping concentrations.
Crystals 14 00168 g007
Disclaimer/Publisher’s Note: The statements, opinions and data contained in all publications are solely those of the individual author(s) and contributor(s) and not of MDPI and/or the editor(s). MDPI and/or the editor(s) disclaim responsibility for any injury to people or property resulting from any ideas, methods, instructions or products referred to in the content.