Article

Wafer-Scale ALD Synthesis of MoO3 Sulfurized to MoS2

by
Sachin Shendokar
1,2,
Moha Feroz Hossen
1,2 and
Shyam Aravamudhan
1,2,*
1
Joint School of Nanoscience and Nanoengineering, 2907 E Gate City Blvd, Greensboro, NC 27401, USA
2
Joint School of Nanoscience and Nanoengineering, North Carolina Agricultural and Technical State University, Greensboro, NC 27411, USA
*
Author to whom correspondence should be addressed.
Crystals 2024, 14(8), 673; https://doi.org/10.3390/cryst14080673
Submission received: 10 May 2024 / Revised: 5 July 2024 / Accepted: 6 July 2024 / Published: 24 July 2024

Abstract

:
Silicon has dimensional limitations in following Moore’s law; thus, new 2D materials complementing Silicon are being researched. Molybdenum disulfide (MoS2) is a prospective material anticipated to bridge the gap to complement Silicon and enhance the performances of semiconductor devices and embedded systems in the package. For a synthesis process to be of any relevance to the industry. it needs to be at the wafer scale to match existing Silicon wafer-processing standards. Atomic Layer Deposition (ALD) is one of the most promising techniques for synthesizing wafer-scale monolayer MoS2 due to its self-limiting, conformal, and low-temperature characteristics. This paper discusses the wafer-scale ALD synthesis of Molybdenum trioxide (MoO3) using Mo (CO)6 as a precursor with Ozone as a reactant. An ALD-synthesized wafer-scale MoO3 thin film was later sulfurized through Chemical Vapor Deposition (CVD) to transform into stoichiometric MoS2, which was evaluated using X-ray photoelectron spectroscopy (XPS), Raman spectroscopy, Scanning Electron Microscopy (SEM), and Atomic Force Microscopy (AFM). The roles of activation energy and first-order reaction kinetics in determining the ALD recipe parameters of the pulse time, reactor temperature, and purge time are explicitly discussed in detail. Discretized pulsing for developing one-cycle ALD for monolayer growth is suggested. Remedial measures to overcome shortcomings observed during this research are suggested.

1. Introduction

Monolayer MoS2 synthesis is of significant importance for semiconductors as well as other systems on chips [1]. For any process to be of relevance to the semiconductor industry, wafer-scale synthesis is a necessity [2]. One of the routes adopted for the synthesis of MoS2 is to grow wafer-scale MoO3 using ALD and sulfurize it to MoS2 using CVD. ALD synthesis of MoO3 using MoCO6 as a precursor and Ozone as a reactant has seldom resulted in monolayer growth [3,4]. As chemisorption and diffusion mechanisms influence the nucleation and growth of targeted thin films in ALD synthesis, considerations for reaction kinetics and activation energy become critically important [5,6,7]. Thus, this article attempts to directly relate the roles of activation energy and reaction kinetics to determine the temperature and time parameters for ALD recipes. Furthermore, modifications with a discretized one-cycle ALD recipe that may promote the chemisorption of the precursor and diffusion of reactants in monolayer MoO3 synthesis have been suggested.

Why 2D MoS2 Is of Interest?

To answer the question predictably, Figure 1 shows a pictorial representation that summarizes the history of integrated circuits (ICs), the physical limitations of Silicon (transition region marked in blue), and the role 2D materials can play in quantum devices and the atomic dimension region in the foreseeable future [8]. Thus, ever since the integrated circuits on Silicon were introduced in 1960, there has been a shrinkage in the feature size of the metal-oxide field-effect transistor (MOSFET) by half every two years, doubling the density of FETs with savings in energy and improving the performance of IC’s, as predicted by Moore’s law [9]. Since 1999, the channel length on a Silicon MOSFET is being re-engineered to compensate for its variable performance, which has since been studied as the “Short Channel Length Effects” [10]. The Institute of Electrical and Electronics Engineering (IEEE) constituted an International Technology Roadmap for Semiconductors (ITRS), which evolved into the International Roadmap for Devices and Systems (IRDS), which has been guiding the semiconductor industry in identifying futuristic problems and developing foreseeable solutions [11]. As outlined in Figure 1, Silicon, being a 3D solid material, poses quantum mechanical problems when the channel thickness goes below 10 nm. Hence, a MOSFET with a feature size below 10 nm requires a 2D semiconductor material such as MoS2 or alternative technologies like quantum computing [12]. Features of the Silicon MOSFET are already in the transition region; thus, there is a need for two-dimensional monolayer materials such as MoS2 monolayers to further reduce the sizes of features and improve the efficiency of MOSFETs [13]. Graphene was the most promising one-atom-thick carbon monolayer and was mechanically stable and exhibited ballistic carrier transport properties. However, Graphene lacks a bandgap and, thus, has difficulty being used as a channel material in semiconductor ICs [14].
Besides Graphene, the transition metal dichalcogenide (TMDC) is a family of more than 40 compounds with promising semiconducting properties, exhibiting stability as monolayer. From the TMDC family, MoS2 is leading the promise to be the n-type channel material, with WSe2 or black phosphorous as a p-type counterpart to fulfill the futuristic expectations of complementary MOSFET (CMOS) ICs [15]. Monolayer MoS2 has demonstrated a thickness-dependent bandgap [16,17], charge carrier mobility, On–Off ratio [18], spin–orbit coupling [19], and mechanical stability [20,21] suitable not just as an efficient MOSFET channel material but also having capabilities for catalysis [22], energy storage [23], hydrogen evolution reactions [24], gas sensing [25], optoelectronics [26] and flexible electronics applications [27], and bio-sensing [28]. Thus, the MoS2 monolayer and 2D thin films holds great promise to complement Silicon technology to follow Moore’s law [29].

2. Fundamentals of MoO3 ALD Growth Recipe

Several processes used for the bottom-up synthesis of MoS2 include Chemical Vapor Deposition (CVD) [30], Metal-Organic CVD [31], Physical Vapor Deposition (PVD) [32], Molecular Beam Epitaxy (MBE) [33], Pulsed Laser Deposition (PLD) [34], and thermolysis of salts [35]. The top-down techniques demonstrated for MoS2 synthesis are mechanical [36,37] and liquid exfoliation [38,39]. The top-down techniques provided the best quality characteristics of monolayer MoS2 but lacked precision over the thickness and size of exfoliation, besides other aspects that are important for the semiconductor industry. MOCVD is a bottom-up synthesis method and has proven capabilities for the wafer-scale monolayer synthesis of MoS2; however, the deposition time, conformality over intricate surfaces, and control over defect density are still challenging with MOCVD [40]. All other processes listed above except ALD have too high temperature, pressure, or time constraints to suit the diversified applications envisaged for MoS2 and be scalable for industrial needs.
ALD synthesis is derived from CVD, where alternate pulsing of a vaporized precursor (MoCO6) and reactant (Ozone) separated by a purge time (or wait time) causes a self-limiting chemisorption over the entire substrate [41,42]. Due to irreversible self-limiting chemisorption, ALD provides precise control over the thickness and conformal growth of thin films.
Figure 2 shows a hypothetical representation of the molecules and their assembly into a monolayer or thin film in ALD synthesis. As depicted in Figure 2, the starting step is the selection of a substrate with a surface that has or is treated to have active sites (SiO2/Si) with the required activation energy for the chemisorption of the precursor. The precursor Mo(CO)6 is then dispersed over the substrate’s active sites, and molecules are temporarily physisorbed with the active sites, i.e., SiO2. Depending on the temperature of the ALD reactor and initial vapor pressure, the precursor chemisorbs over the active sites of the substrates through ligand exchange, association, or dissociation. During precursor pulsing, the molecules do not react with themselves, and chemisorption over the substrate continues as long as the active sites are available on the substrate surface, i.e., ALD exhibits self-saturating chemisorption. The chemisorption of the precursor is affected by steric hindrance or competing access to the active sites. Before the pulsing of the reactants, i.e., (Ozone), the wait time or purging step ensures that the precursor, which has not been chemisorbed, is removed from the reactor. The reactor’s temperature is enough to provide sufficient Gibbs free energy and cause a self-limiting and saturating irreversible assembly of the reactants (Ozone) with the already-chemisorbed precursor Mo(CO)6 molecules to provide a high thickness control and conformality [43,44,45,46,47,48,49,50].
Often, Density Functional Theory (DFT) and Molecular Dynamics (MD) simulations are carried out to gain insights into alternate pulsing and the reaction kinetics of the ALD processes. The computational models were useful for geometry optimization, the evaluation of reaction energies, and the electronic band structure. The computational outputs are extremely useful in determining the pulsing sequence, reactor temperature, and wait times for reaction saturation. The DFT and MD simulations were useful in understanding the effect of buffer layer formation due to Mo adsorption over O from SiO2 on the optical and electronic properties of MoS2. The underpinning of Sulphur with the O of SiO2 to form free-standing MoS2 layers had optical properties and an electronic band structure close to exfoliated MoS2 samples [51,52]. These computational techniques also provide insights into the effects of substrate surface lattice matching or roughness on the activation energy affecting nucleation and growth and the stoichiometry and crystallography of MoS2, which further affects electronic characteristics.
In Figure 2, the starting step of ALD is numbered zero. Step zero of substrate conditioning is accomplished outside the ALD reactor. Usually, the substrate conditioning step has less emphasis, but as this article focuses on the energy criterion, substrate selection and conditioning is very crucial. Thus, when the targeted monolayer or thin-film chemistry is decided, substrate conditioning should be compatible with step one, i.e., precursor dosing. As ALD promotes the precursor ligand’s chemisorption with the substrate’s active sites, Gibbs free energy plays a key role in chemisorption at step one of dosing. However, if substrate conditioning is incompatible with the precursor, ALD growth will not initiate. The ALD parameters of reactor temperature and the time for which the substrate is kept inside the ALD reactor determine the energy available at the active sites to promote the chemisorption of the precursor.
Thus, substrate conditioning in ALD is more than just cleaning accomplished to remove surface contaminants. During this research, a 4 diameter SiO2/Si wafer with thermally deposited into 300 nm SiO2, with Si (100) used as the substrate. As SiO2/Si wafers were used from open-box collection, piranha cleaning and DI water were employed to remove contaminants. Furthermore, the SiO2/Si Wafer was treated at 100 °C with an O2 plasma furnace before ALD MoO3 growth.
The Mo(CO)6 precursor used for MoO3 growth was procured from Strem chemicals. The Mo(CO)6 had a specified melting point of 150–151 °C, boiling point of 156 °C, and vapor pressure of ~0.8 Torr at 40 °C. The Vecco Savannah Ultratech thermal ALD system equipped with an Ozone generator and mass flow controller for 100 SCCM N2 carrier gas was used. The four precursor canister lines were connected to the reactor via a manifold, as seen in Figure 3. Table 1 shows the user interface for developing a recipe for the Vecco thermal ALD system, with the precursor pulse time, wait time, reactant pulse time, wait time, and number of cycles instructions on lines 11 to 15, which is the ALD growth cycle.
Step 1 of Figure 2 corresponds to the pulsing of Mo(CO)6, which is stated as an instruction on line 11 of the recipe as “Pulse” of channel ‘2’ with a value of 0.02 s, which is the valve opening time for Mo(CO)6 precursor flux to the ALD reactor. The ALD recipe of Table 1 uses the “wait” instruction at line 12 for “Purge”, which is step 2 of Figure 2. Purging is accomplished with a wait of 7 s at 0.5 bar vacuum pressure to ensure chemisorption and draining of excess precursor. Hence, it can be assumed that the precursor molecules could have been chemisorbed or purged as the spike dies down in 7 s. The pulsing instruction of line 13 of the reactant Ozone for a value of 0.02 s corresponds to step 3 of Figure 2. A wait of seven seconds on line 15 is step four, or the second purging.
The ALD recipe has channel 0 for Ozone, and channels 8, 9, and 10 are for the manifold, inner ring, and outer ring heating elements. The channel for heater 13 specified on line 2 is distinct from most of the Mo(CO)6 recipes, as it is used to heat the jacket covering the Mo(CO)6 cylinder in Figure 3. The channel heater 13 was heated to 135 °C for 30 min to achieve suitable Mo(CO)6 vapor pressure. It is observed that the above recipe developed with a pulse time of 0.02 s significantly differs from the ALD process parameters for ALD of MoO3 growth summarized in Table 2.
From this summary of Table 2 [53,54,55,56], the parameters that are distinct for this research are the precursor and reactant pulsing times and reactor temperature. Besides the synthesis of MoO3 sulfurized to MoS2, this article is an effort to understand and relate these parameters with activation energy and reaction kinetics. From Table 2, it is understood that though the precursor and reactant used are the same, Mo(CO)6 and Ozone, the pulsing time is different in each case, which could depend on the process capability of the ALD equipment used, which is different in each case as seen in column two of Table 2. The temperature range, though, in each case is almost similar to the decomposition temperature of Mo(CO)6, which is about 160 °C. For the scope of this article, we are limiting the relation between the activation energy and reaction kinetics for determining the ALD recipe parameters. The temperature and time of heating the precursor affect its vapor pressure. The precursor’s vapor pressure influences the precursor volume dispensed during the pulsing time. As the time and temperature of heating precursor do not directly affect the ALD recipe or chemisorption, the precursor preheating temperature and time are not discussed further.
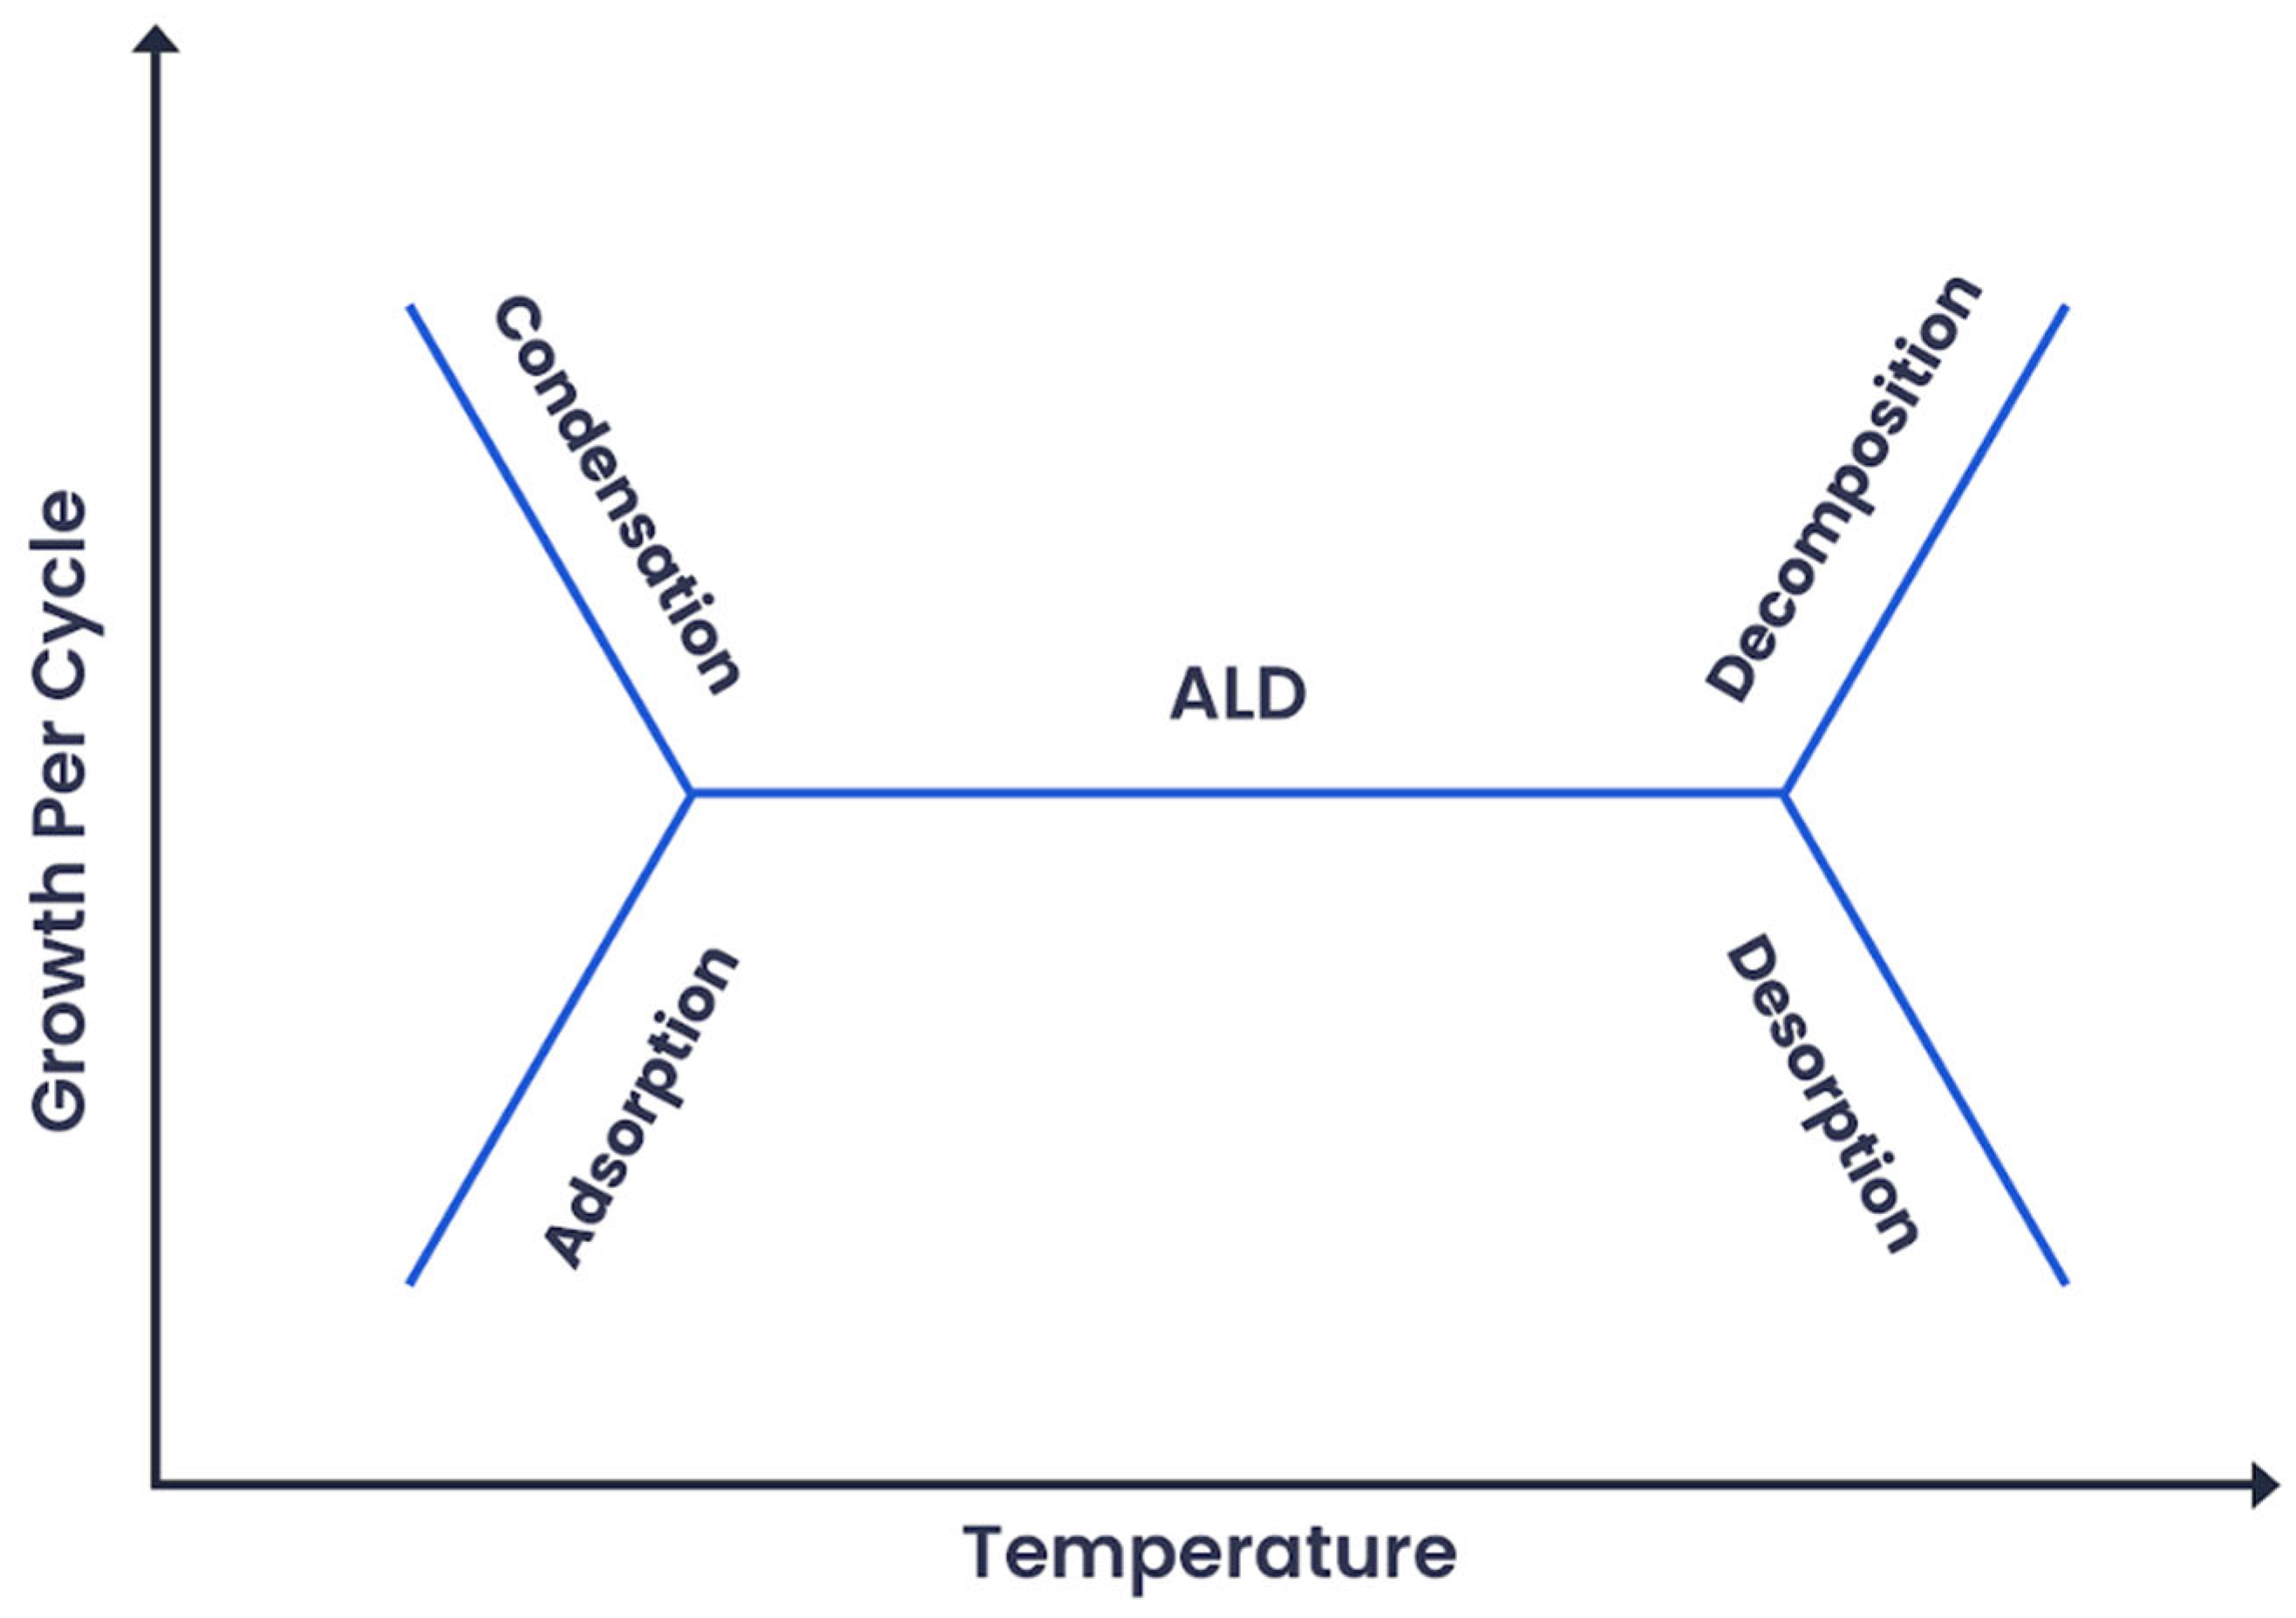
It is worth noting that to date, the pulsing time and purging durations were determined empirically based on the constant growth characteristics demonstrated in Figure 4. The ALD temperature window is decided based on the constant growth rate achieved during each ALD cycle. For a fixed temperature within the ALD window, a pulsing duration that resulted in near-constant growth was determined. Figure 4 illustrates the determination of the ALD temperature, with variations in the GPC and region of constant growth observed [57].

3. Role of Activation Energy

Activation energy is the barrier of energy to be breached for bonds to be broken and for new bonds to form. The transition from reactants to products with the change in energy is illustrated in Figure 5.
As ALD relies on the chemisorption of the precursor to bond with the active sites of the substrate, the activation energy associated with the substrate should be low. The temperature of the ALD reactor is the primary source to overcome the activation energy. The plasma-enhanced ALD reactor has a plasma source that could help overcome activation energy and promote chemisorption so that precursor species saturate irreversibly. The plasma could also work for selective etching, thus needing considerable modulation.

4. Role of Gibbs Free Energy

Gibbs free energy (ΔG) plays a crucial role in determining whether a chemical reaction, such as the chemisorption of Mo(CO)6 onto a SiO2 surface, is thermodynamically favorable. In chemisorption, the interplay of activation energy and Gibbs free energy can help us understand whether the adsorption process is spontaneous or requires an external energy source [58]. The following reaction takes place at step one of ALD:
Si-O2 + Mo(CO)6 → Si-O-Mo(CO)5 + CO2
The change in the Gibbs free energy for this reaction, ΔG, is given by:
ΔG = ΔH − TΔS
If ΔG is negative (ΔG < 0), the reaction is thermodynamically favorable, indicating that the chemisorption of Mo(CO)6 onto Si-O2 is spontaneous at the given temperature. In other words, the products of the reaction are more stable than the reactants, and the reaction will tend to proceed in the forward direction. Conversely, if ΔG is positive (ΔG > 0), the reaction is thermodynamically unfavorable and would not occur spontaneously. In this case, an external energy source, i.e., temperature increase, is required to drive the chemisorption process. The reactor temperature of 167 °C of heaters 8 and 9 in Table 1 primarily serves the extra energy required for spontaneous precursor chemisorption over the active substrate sites and, subsequently, for ligand exchange with the reactants.

5. Determination of ALD Reactor Temperature and Time Based on the Reaction Kinetics

In an ALD reactor, temperature is one of the driving factors for the chemisorption of precursor molecules to the active sites on the substrate. The chemisorption of precursor molecules with the substrate is determined by the reaction rate ‘k’, which depends on the activation energy and temperature, as expressed by the Arrhenius equation:
k = A e E a R T
where the following holds true:
  • k = reaction rate constant;
  • A = pre-exponential factor;
  • Ea = activation energy Kcal/moles (same unit as R × T);
  • R = universal gas constant;
  • T = absolute temperature (in Kelvin).
The reaction rate constant, determined using the Arrhenius equation based on the activation energy Ea and temperature T, is used in the following first-order reaction kinetics equation to estimate the time t:
A B A B i =   e k t
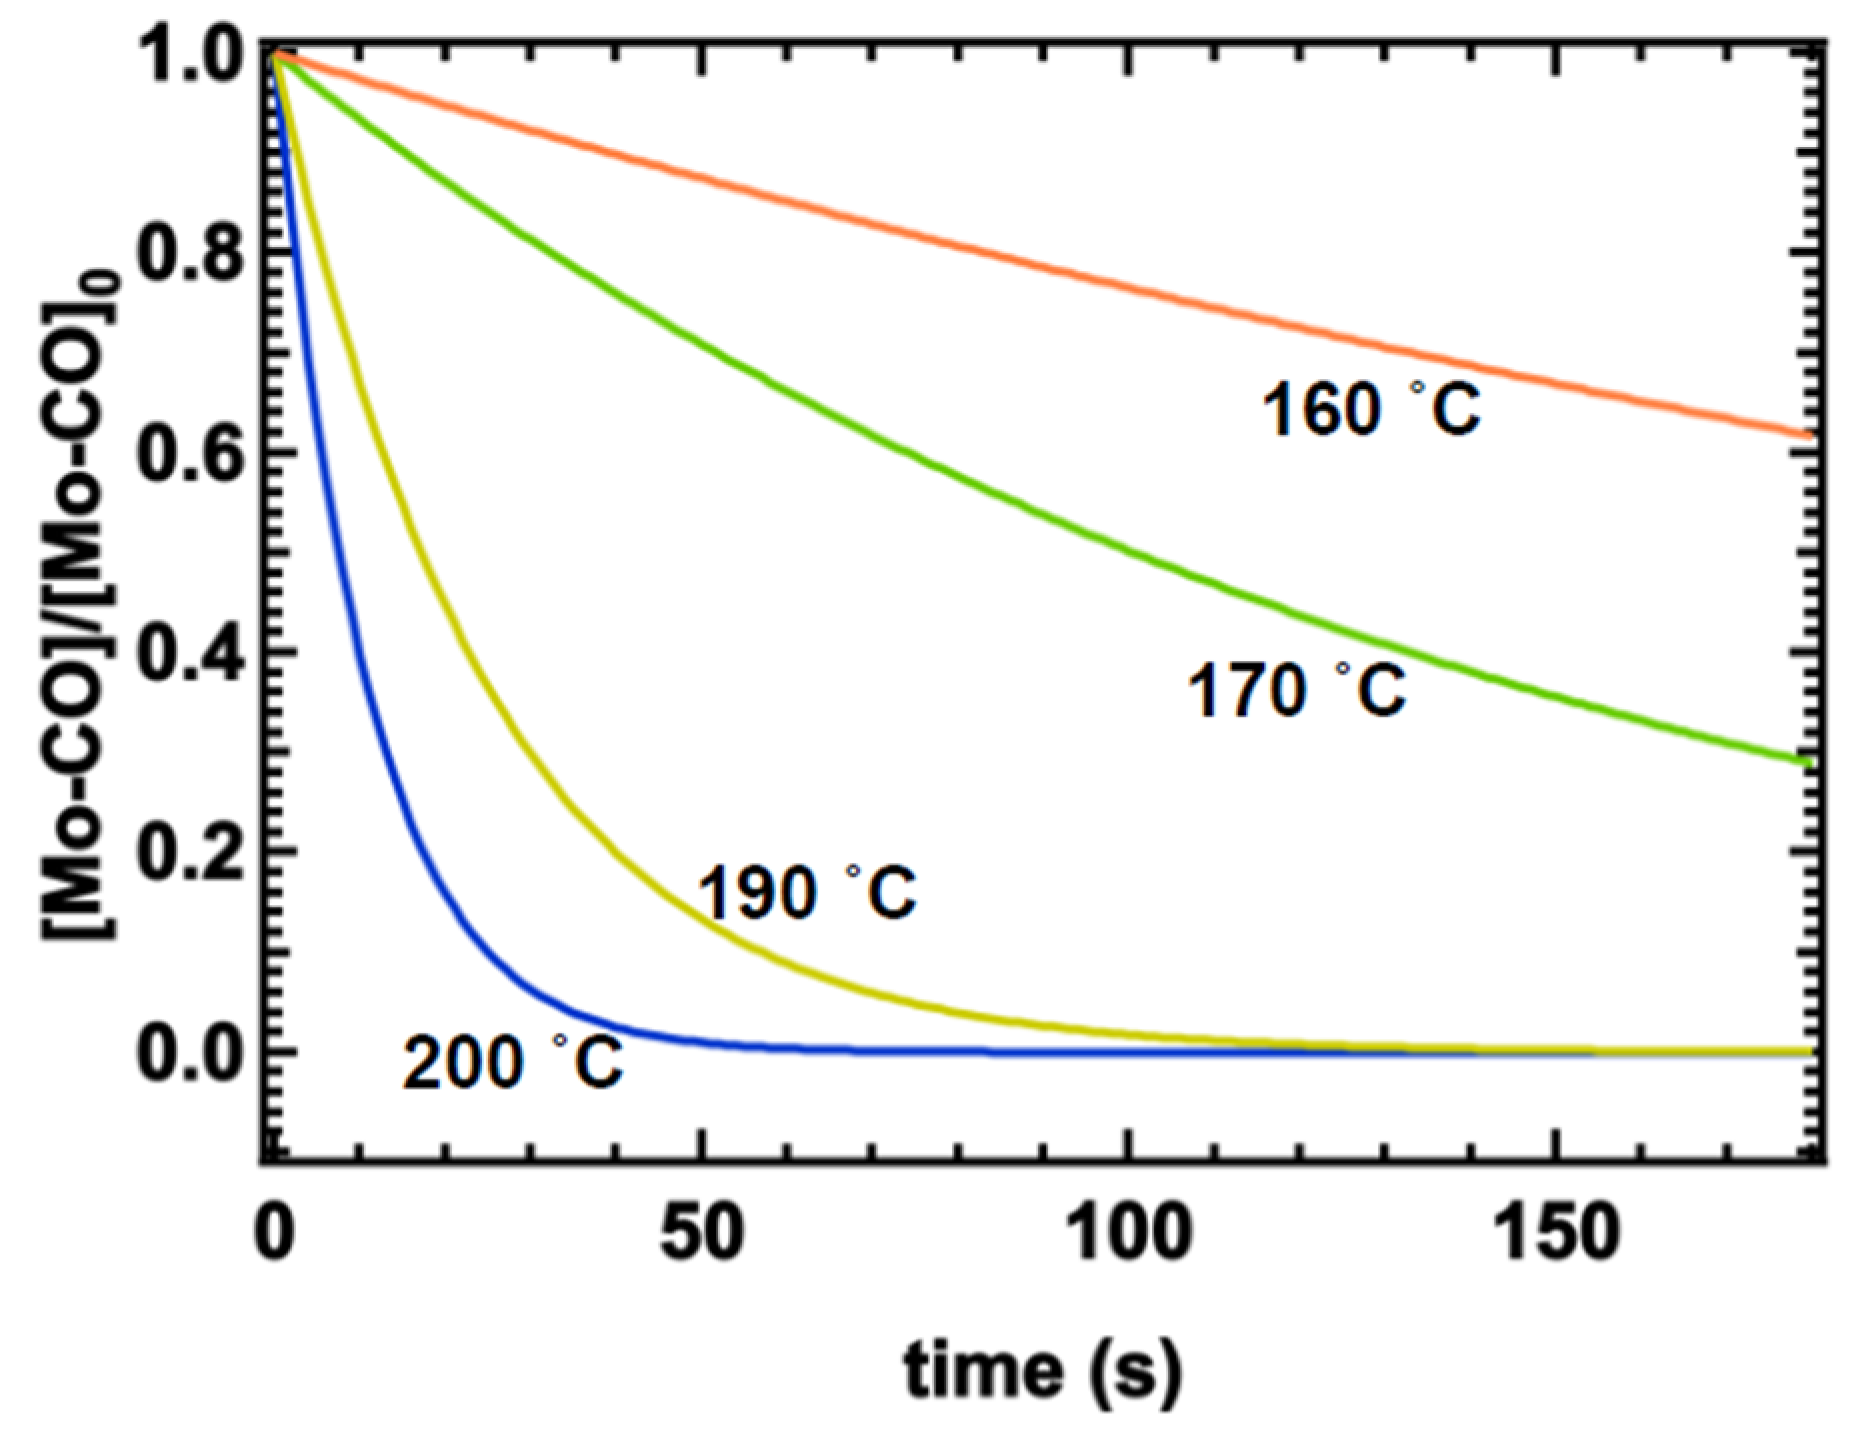
For an Mo-CO bond, A = 1015.6 s−1, Ea = ~150,624 J/mole [aa], R = 8.3145 J/mol/K, and T = 423 K (160 °C) to 473 K (200 °C). For these parameters, the time vs. reaction rate plot is given in Figure 6.
From Figure 6, the temperature selected for the Mo(CO)6 and Ozone recipe should be 190 °C to 200 °C, well above the decomposition temperature of 170 °C, to restrict the wait time between 50 s to 100 s for 100% decomposition of Mo-CO bonds to chemisorb on the SiO2/Si substrate [59]. The higher temperature is to compensate for the difference between theoretical ideologies and practical implementation, as the precursor flux assumed in theory is per mole. In contrast, the actual pulsing of the precursor pulse should be sufficient to fill the reactor volume or to cover the substrate surface area. With the increase in the volume of precursor flux, there will be increased competition to occupy the active sites and, thus, steric hindrance. To find the balance between the high concentration of the precursor flux required and to mitigate the steric hindrance between competing active sites, a modification in the pulsing sequence is suggested. The modified pulsing introduces the discretization of the precursor pulse into several short pulses accompanied by a small intermittent agitation pulse of Ar/N2 to allow for the rearrangement of the precursor along the active sites.
The pulsing sequence modification suggested here is represented in Figure 7. From the perspective of achieving monolayer growth, this research suggests dividing the ‘t’ time calculated based on the first-order reaction kinetics of Equation (2) to obtain the reaction rate ‘k’ used to ensure the complete decomposition of a molar volume of the precursor pulsed. Thus, the estimated time for the molar decomposition of the Mo-CO bond at 190 °C is about 100 s.
This decomposition time should be split into the ‘tw’ wait time between short discrete precursor pulsing. It is suggested that depending on the vapor pressure, the precursor flux is approximated to the total volume of precursor required to cover the substrate surface. The precursor valve opening time or pulsing time ‘tp’ is estimated based on the total volume of precursor required and should be discretized into 10–50 precursor pulses. As an example, the pulsing time for precursor Mo(CO)6 is divided in Figure 7b into five discrete small pulses for the convenience of the representation only. Each small precursor pulse should create agitation and a rearrangement in the orientation of the precursor ligands. The molecules that are loosely bonded by physisorption move around, and those that are chemisorbed consolidate with the active site. The ‘tw’ wait time should be equivalent to the decomposition time computed. The ‘tn’ Ar/N2 pulse embedded in precursor pulsing (blue pulse) acts as an intermittent agitation pulse to reorient precursor molecules. This embedded N2/Ar pulse contributes to pre-exponent factor A.
Referring Figure 7b, the total one-cycle time is ‘Tc’ and it has the time for growth, tg = tp + tc, representing the times for precursor and reactant pulsing, while the time for decomposition is td = tn + tw covering N2 pulsing and wait time.
Thus, the ALD cycle time can be summarized as Tc = tg + td.
In the case of Mo(CO)6, a time of about 100 s estimated is for decomposition of all six Mo-CO ligands for the precursor flux volume. Phenomenologically, with the reactive sites of the substrates, only three Mo-CO ligands’ decompositions and exchanges may be considered, thus reducing the time for the cycle by half to 50 s.
In anticipation of one-cycle monolayer synthesis, the discretization of the pulsing time and decomposition time estimated from reaction kinetics suggested here has a scientific basis in the Arrhenius relation. With the Ea and A values from the literature, Equations (1) and (2) provide the temperature and time for the ALD cycle. The ALD reactor can be set for the temperature selected based on Figure 6, while the time estimated using Equation (2) forms the basis to develop the discretized pulsing time to develop a one-cycle ALD recipe. The discretized pulsing contributes to the pre-exponent factor A by improving the collision of the molecules, imparting the kinetic energy required to re-orient the molecules and improving access to active sites. Such a discretized pulsing sequence can effectively develop a one-cycle recipe that may be effective in achieving monolayer ALD synthesis. Ideally, this one-cycle ALD is expected to achieve consistent monolayer thickness.
The subsequent sections analyze the synthesis and characterization results based on the recipe shared in Table 1.

6. Results and Discussion

The recipe shared in Table 1 is used to grow MoO3 using Mo(CO)6 as a precursor and Ozone as a reactant. At the time of this recipe development, the empirical pulsing of the precursor (Mo(CO)6) and reactant (Ozone) was discretized into very small valve opening timing steps of just 0.02 s, as seen in lines 11 and 13 of Table 1 compared to the pulsing times in Table 2 of 1 s, 2 s, and 4 s; thus, it is evident here that the recipe for this research has significantly discretized the pulsing time as compared to other recipes listed in Table 2.
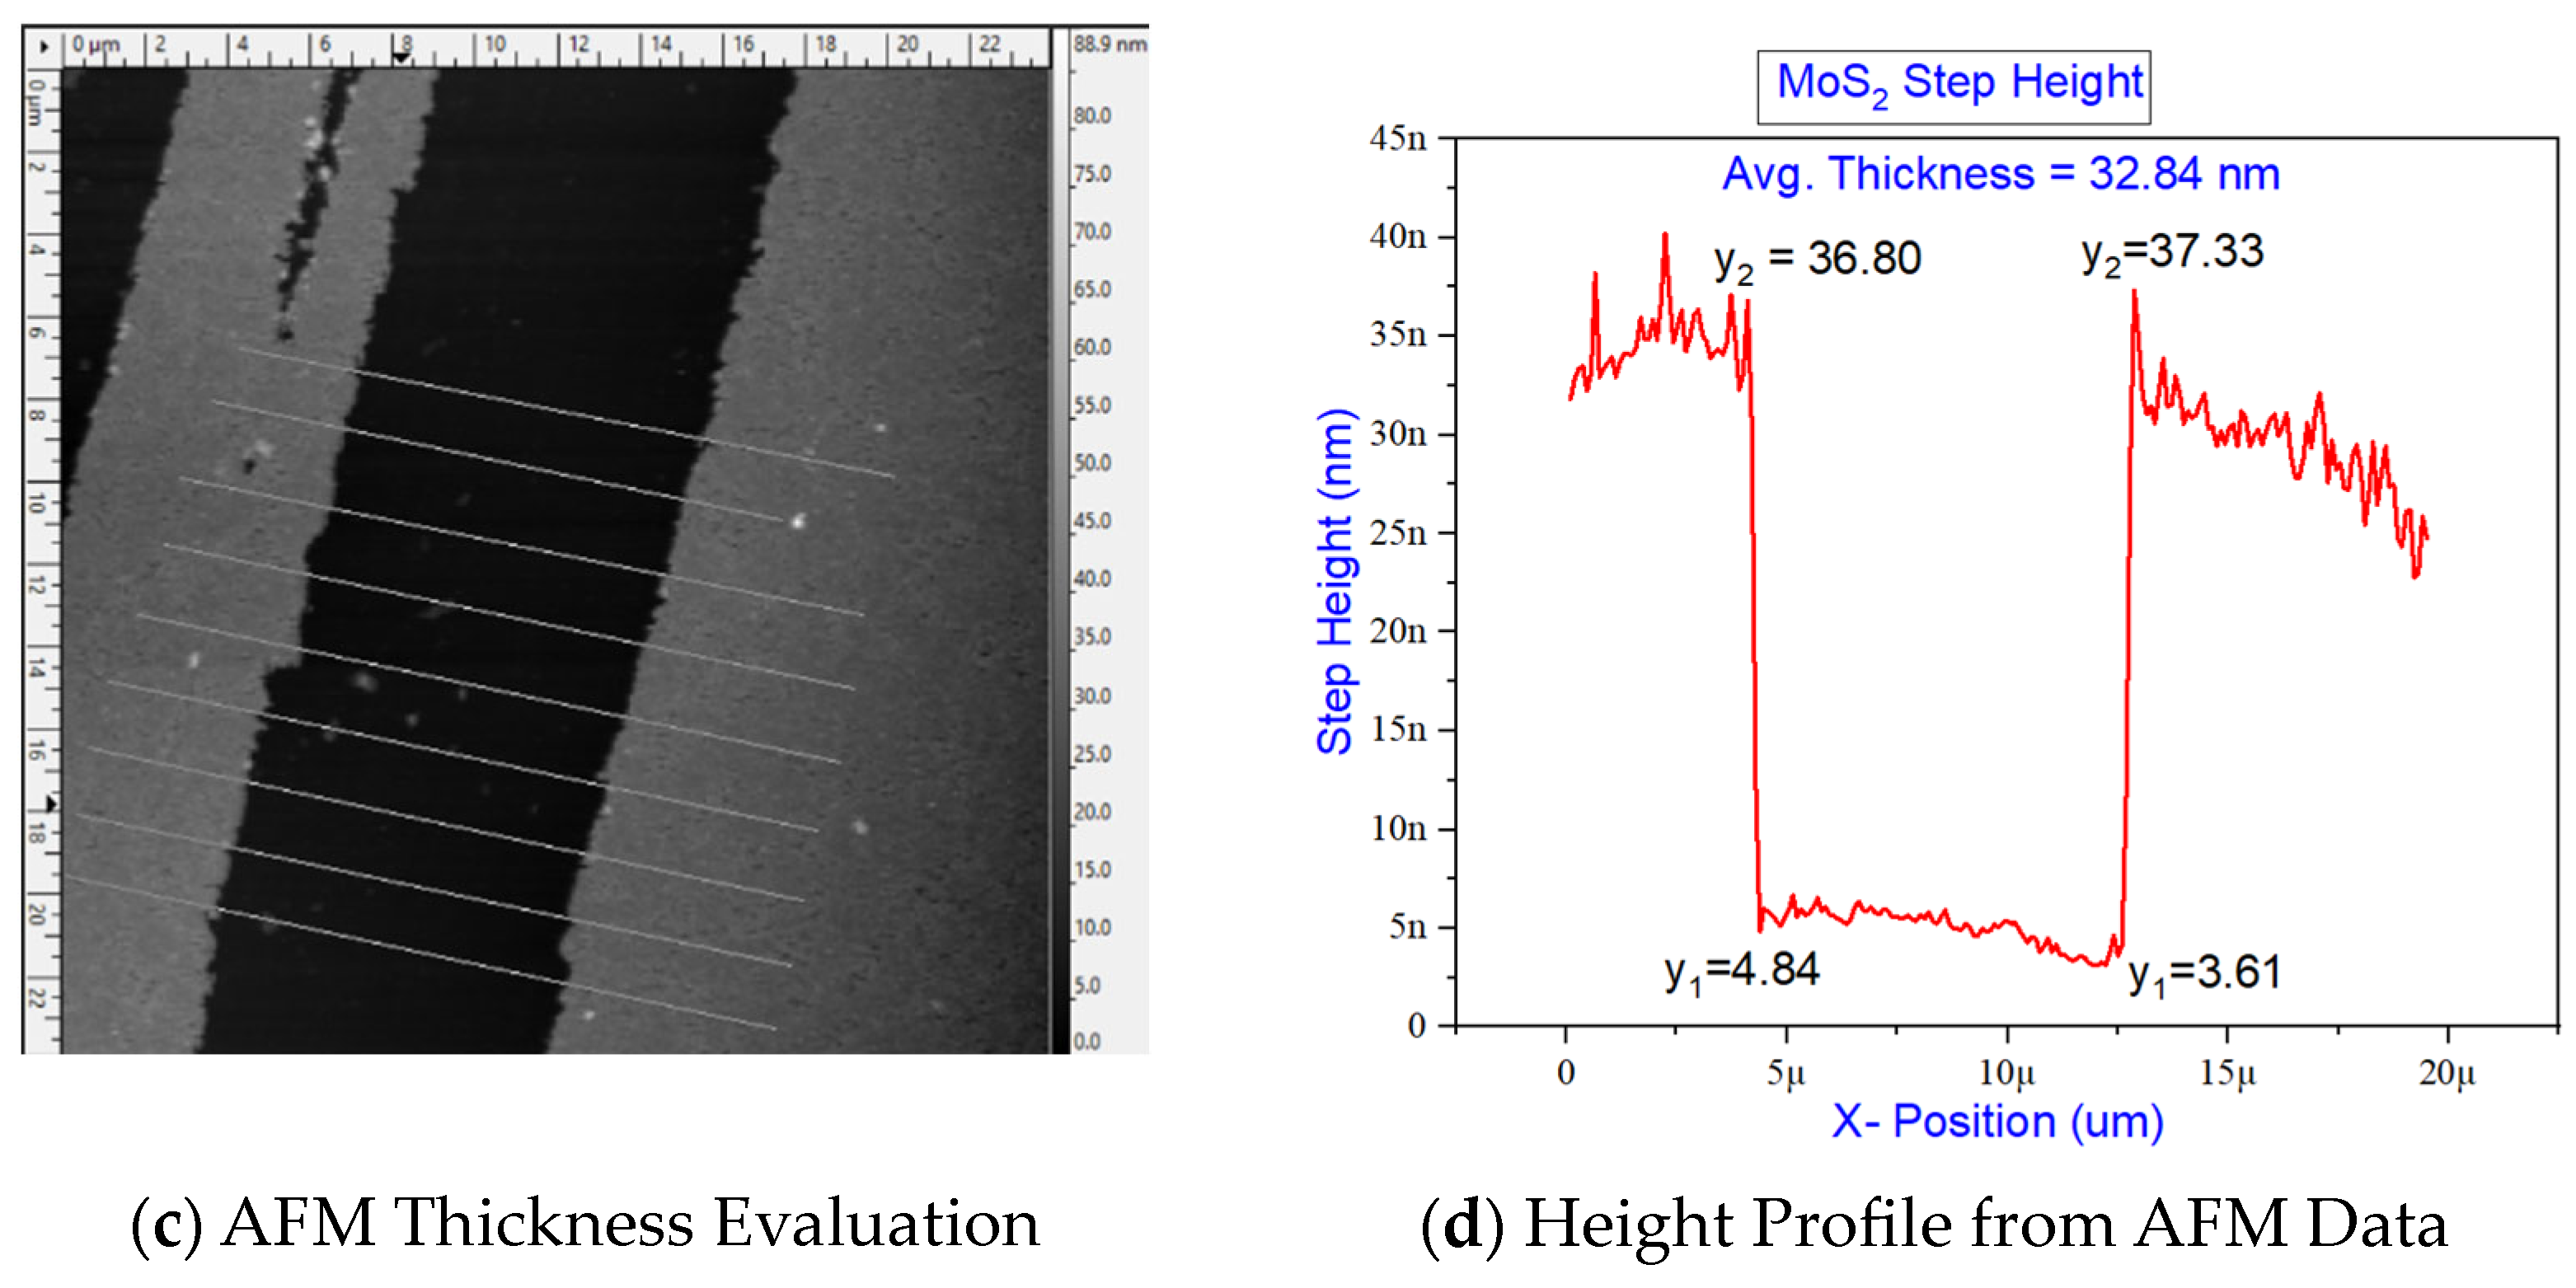
The small pulsing of 0.02 s is followed by 7 s wait time to allow for the decomposition of [Mo-CO] bonds and chemisorption to active sites on the SiO2/Si substrate. The total number of cycles employed was 200. Thus, the total time for precursor and reactant dispensing was 0.02 × 200 = 4 s. Thus, this time is much less than the calculations of 100 s, as per Figure 6, at 190 °C. The morphology of MoO3 grown with the recipe in Table 1 is evaluated using SEM and AFM, as seen in Figure 8. The morphology of the AFM image Figure 8a clearly shows an aggregation of nucleated grains with grain boundaries. The SEM image also shows a grain structure similar to grain boundaries.
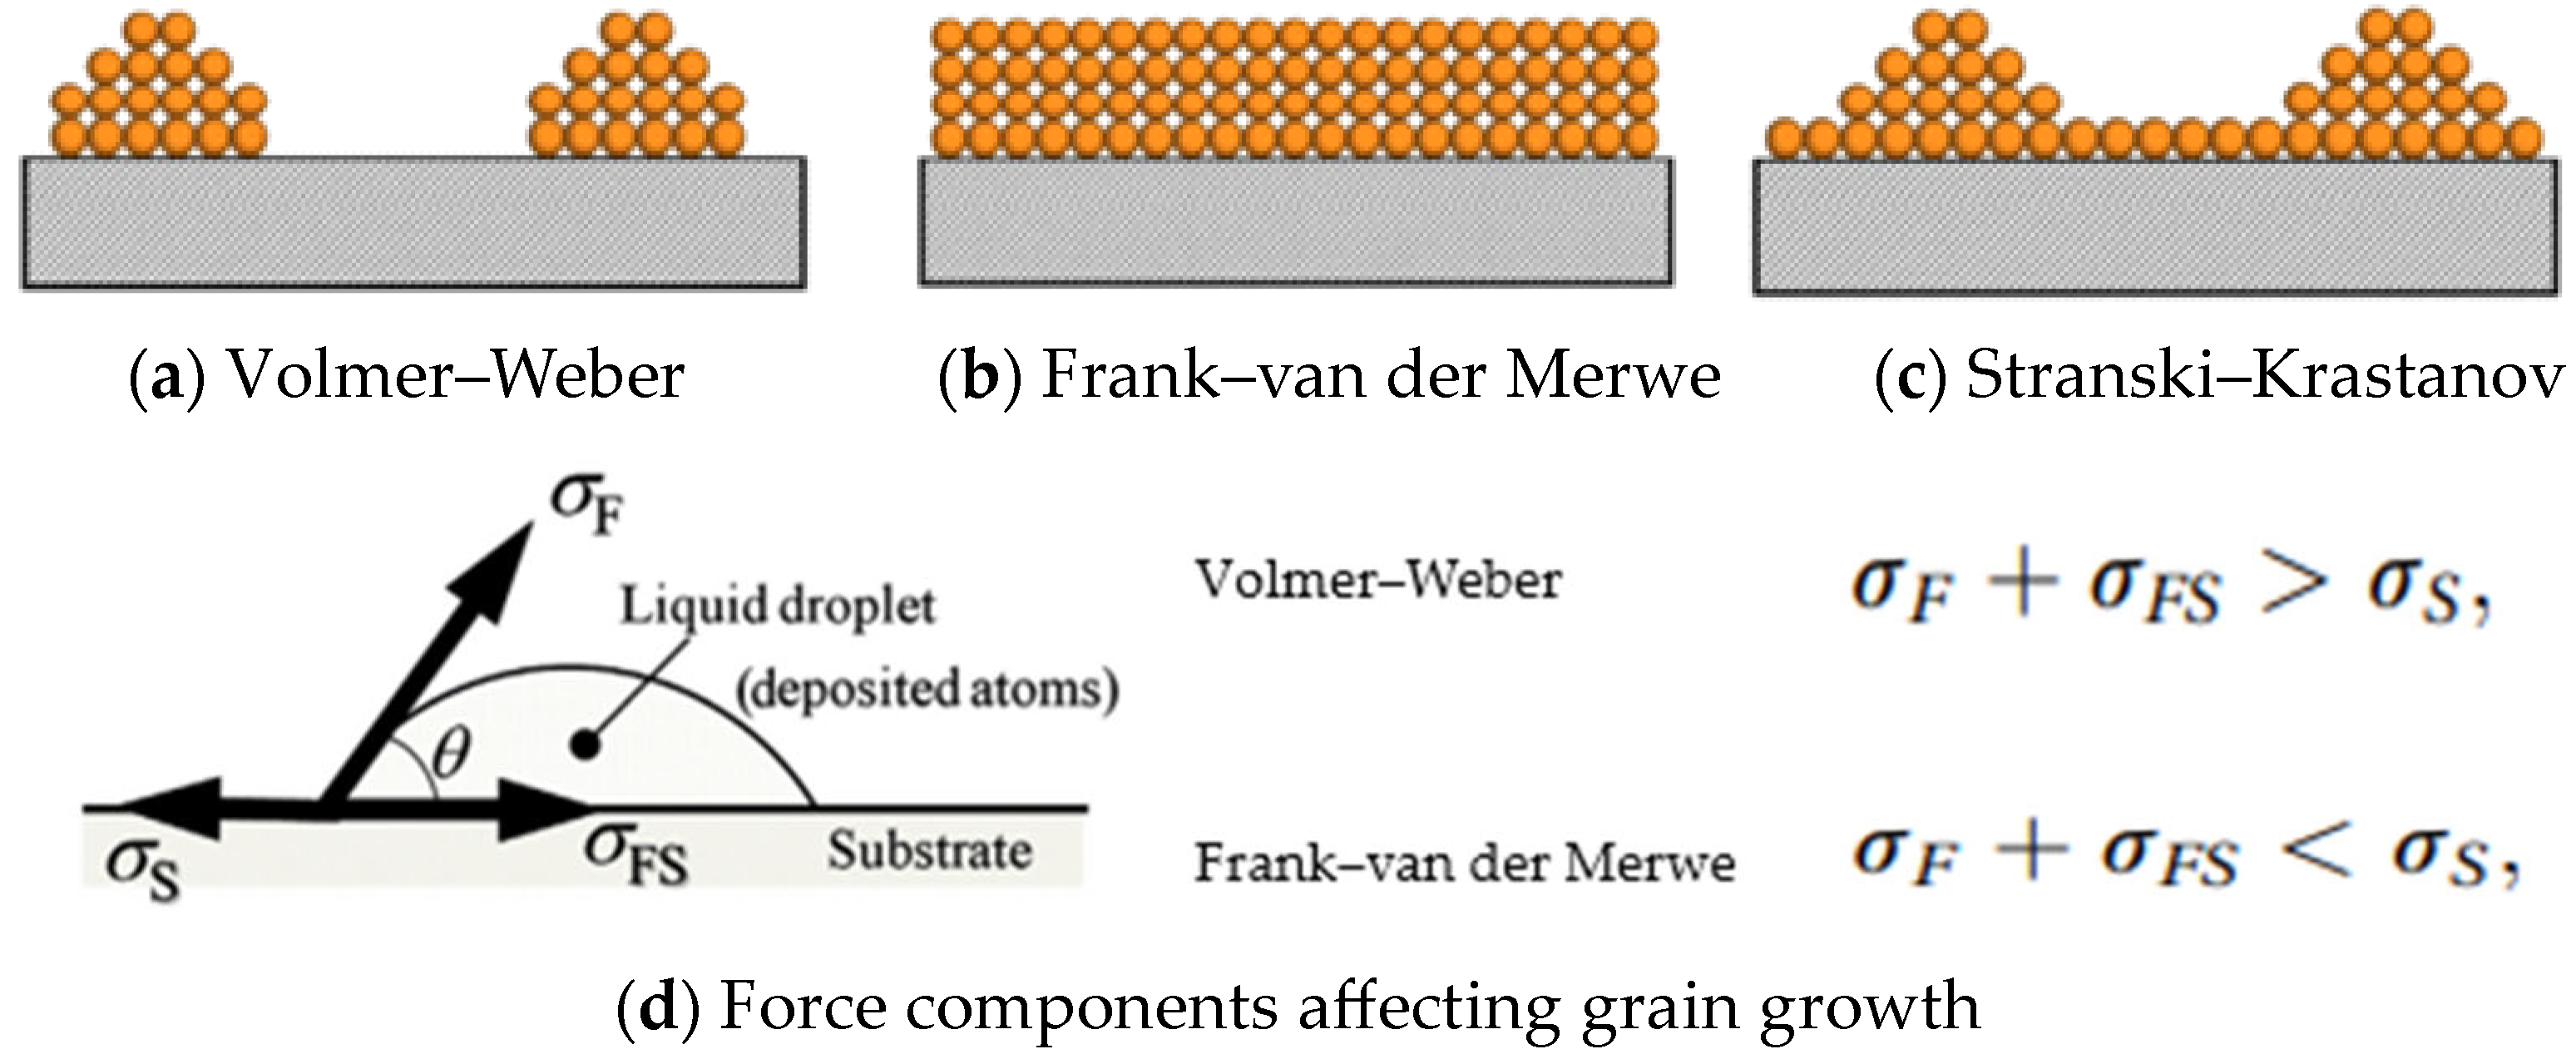
The AFM thickness profile of Figure 8d reveals a thickness of about 32.84 nm for an average of ten measurements, as seen in Figure 8c, with lines traversed across two ALD MoO3 layers. From the AFM and SEM observations, the nucleation and grain growth mechanisms are outlined in Figure 9. Based on the grain boundaries and the shape of the grains, it can be inferred that the ALD cycle resulted in the Volmer–Weber and Stranski–Krastanov regimens of Figure 9a,c [60]. The Frank–van der Merwe (FvM) regimen is necessary for monolayer ALD synthesis, which requires the σs component of force to be dominant. The ALD precursor chemistry is expected to be self-saturating and self-limiting to inherently promote the FvM regimen. However, the alternate, traditional bulk pulsing sequence of the precursor and reactants causes steric hindrance and promotes the other two regimens for island growth. The discretized pulsing suggested in Figure 7b with intermittent agitation by N2 carrier gas may promote Frank–van der Merwe growth to obtain monolayer deposition. Here again, the importance of substrate selection and conditioning beyond just cleaning to increase the diffusion of the nuclei along the surface is evident for the σs component force to be dominant.
Having studied the morphology using AFM and SEM, the Thermo Fisher ESCALAB 250 Xi with an Al-Kα X-ray source with a 0.5 Rowland monochromator was used for estimating the chemical composition of MoO3. The ESCALAB 250 Xi system has a built-in calibration routine with standard Cu, Ag, and Au samples for assessing the linearity and sensitivity of the energy sources. The built-in calibration routine compares the binding energy peaks for the standard samples, and system resources are adjusted for gain and alignment to minimize the B.E. error of the standard sample peaks. The 250 Xi XPS system has controls to ensure the stabilization of the X-ray source, system pressure, detector alignment, and conditioning for reliable recording of the B.E data.
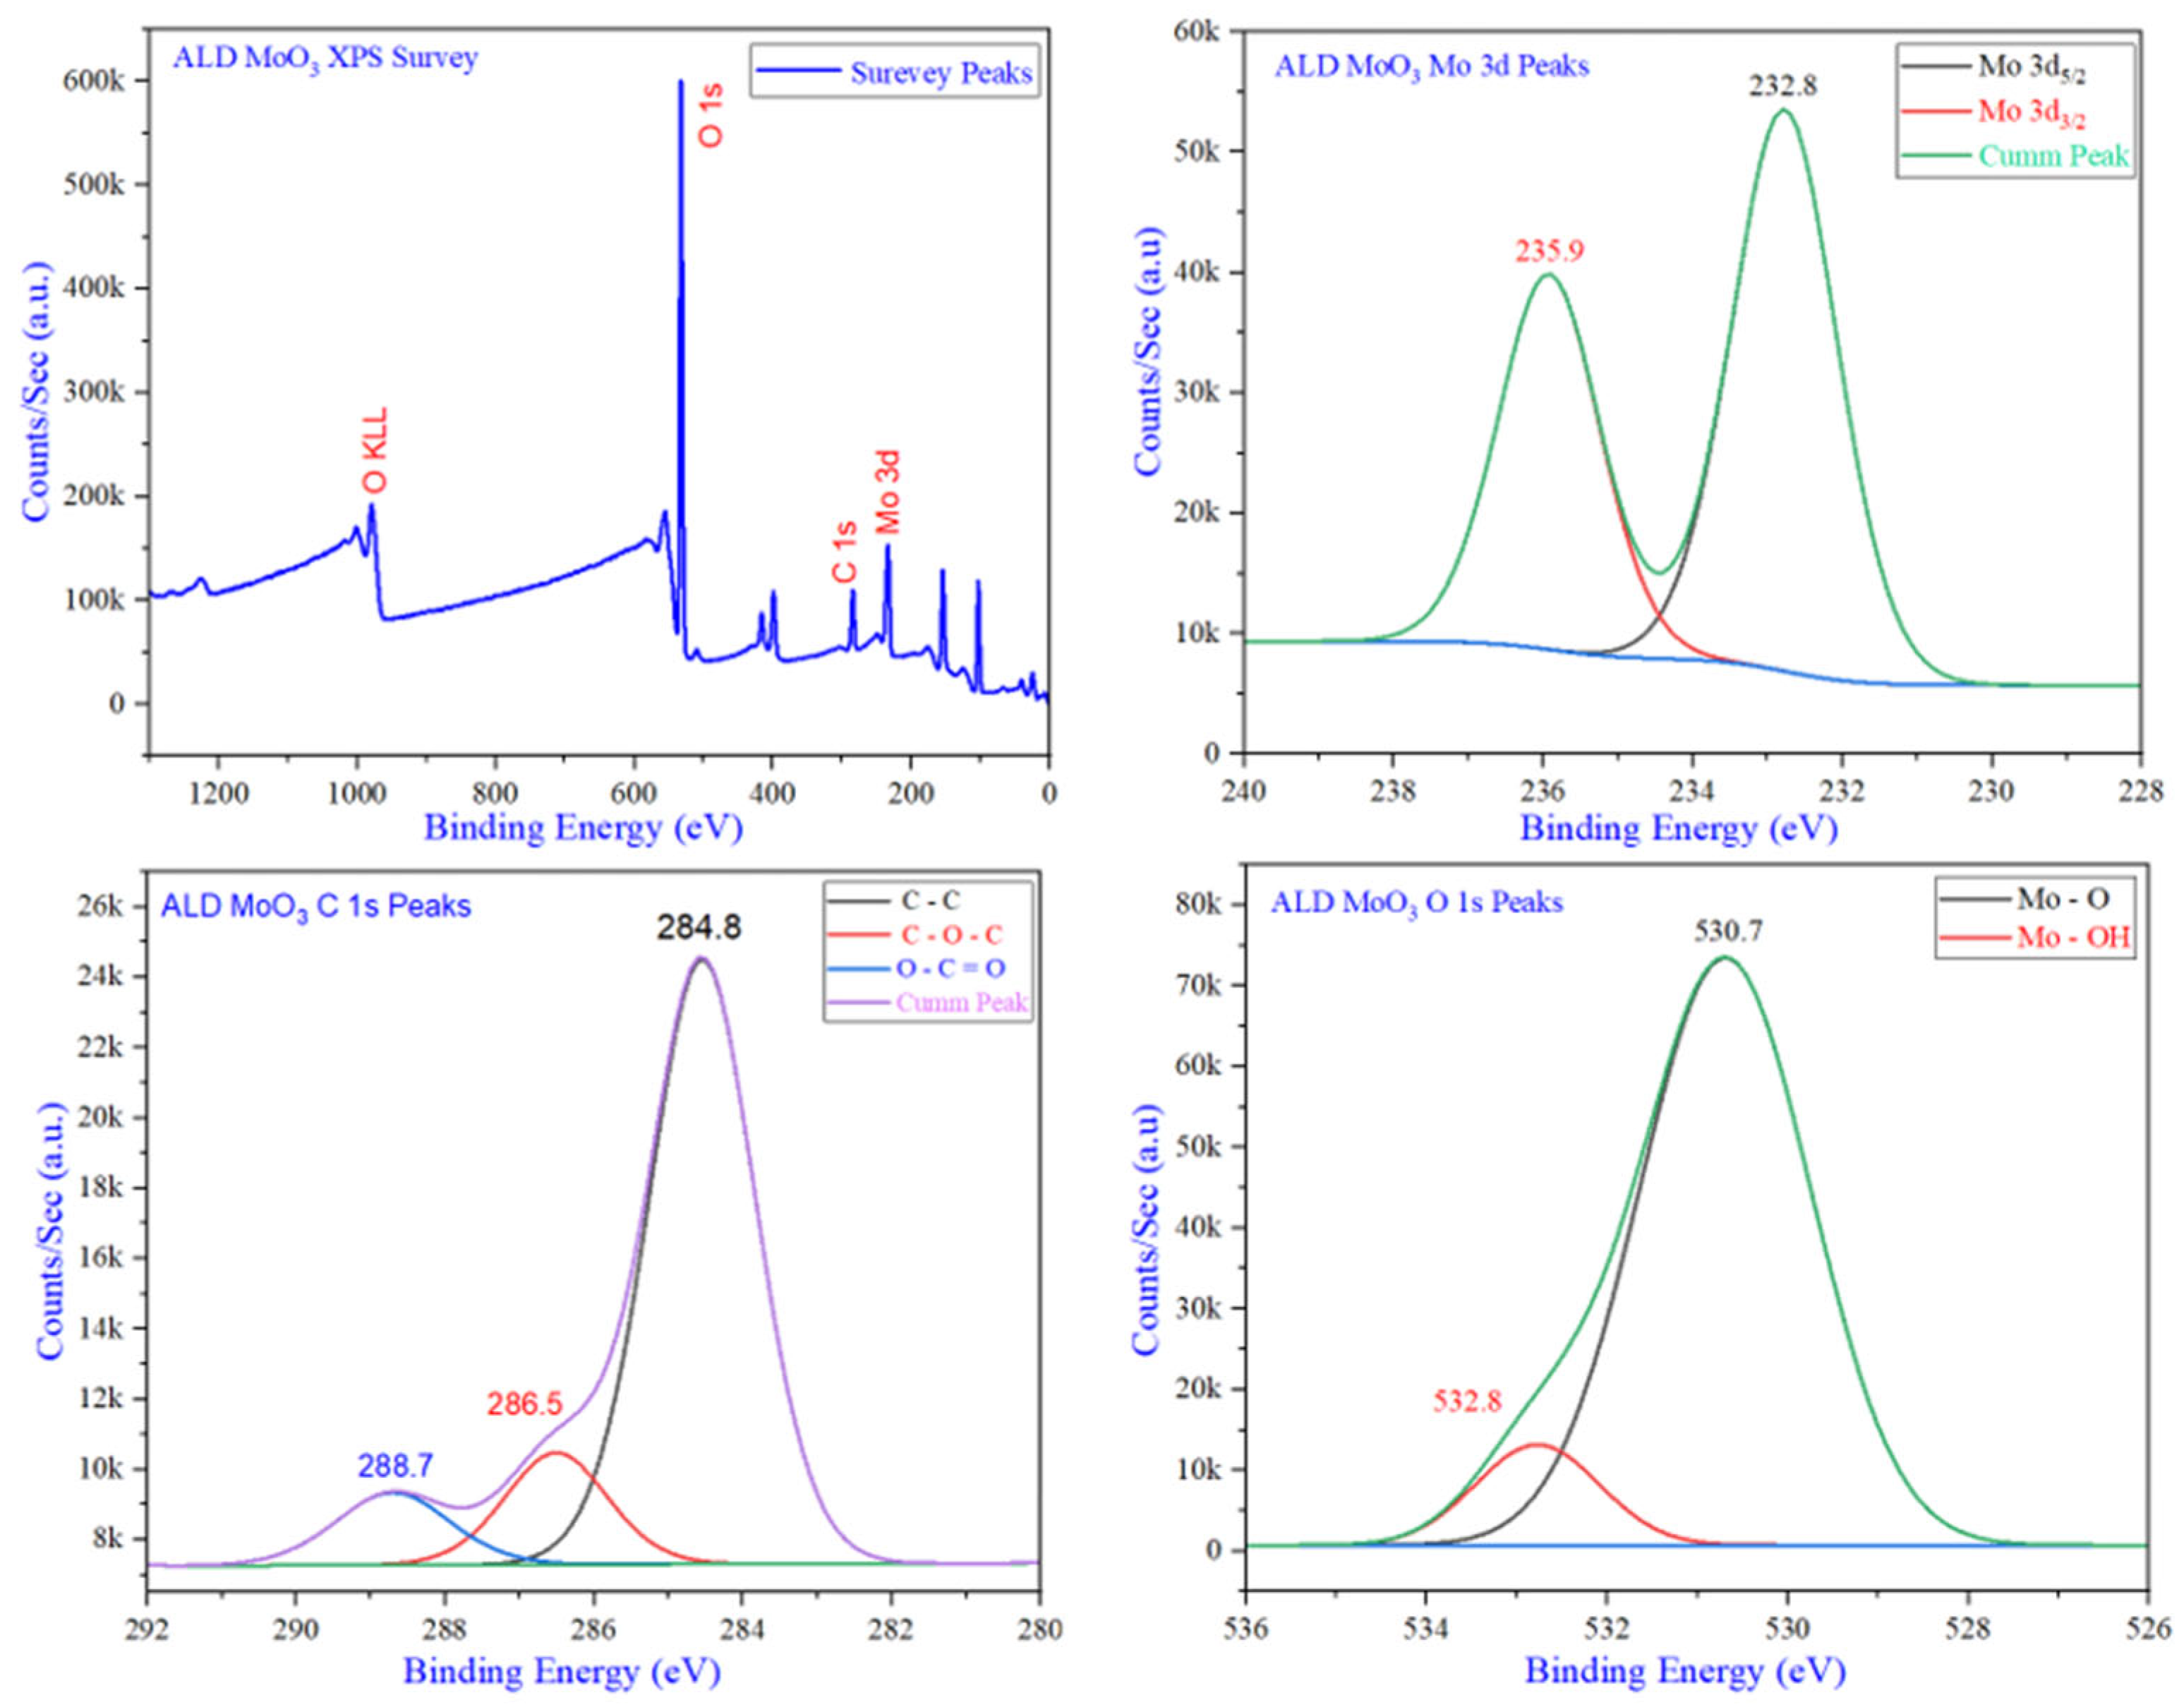
While the experiment was set up, charge compensation was applied. The specimen surface was cleaned by ion etching to remove a thin layer that may have been exposed to contamination. For the MoO3 and MoS2 samples, the survey scans were obtained at a low pass energy of 50 eV, presented in Figure 10. The high-resolution elemental scan was carried out with 5 eV of pass energy over 20 scans separated with a dwell time of 10 ms. For reliable X-ray analysis, the samples were scanned at five positions, adequately covering the overall sample surface for better averaging of binding energy data.
The high-intensity oxygen peak in the survey spectrum for MoO3 in Figure 10 and the intensity of Mo 3d peak confirm stoichiometric MoO3. The small C 1 s peak confirms the removal of the contaminated top layer due to ion etching. The O 1 s peak at 530.7 eV is also very close to the documented reference sample O 1 s peak at 531 eV in MoO3. Considering the issues related to carbon correction, the C 1 s adventitious carbon peak at 284.8 eV was used for peak referencing [61]. The carbon contamination is observed in the as-grown MoO3 ALD sample with the adventitious C-C charge reference at 284.8 eV with low-intensity peaks for C-O-C and O-C=O. The deconvoluted XPS binding energy peaks for MoO3 were resolved with a Shirley background to the characteristic Mo 3d5/2 and Mo3d3/2 doublet in Figure 10 at 232.8 eV and 235.9 eV. These Mo 3d peaks are fairly close to the standard spectrum ID 01285-04 of 232.2 and 235.4 eV, respectively [62].
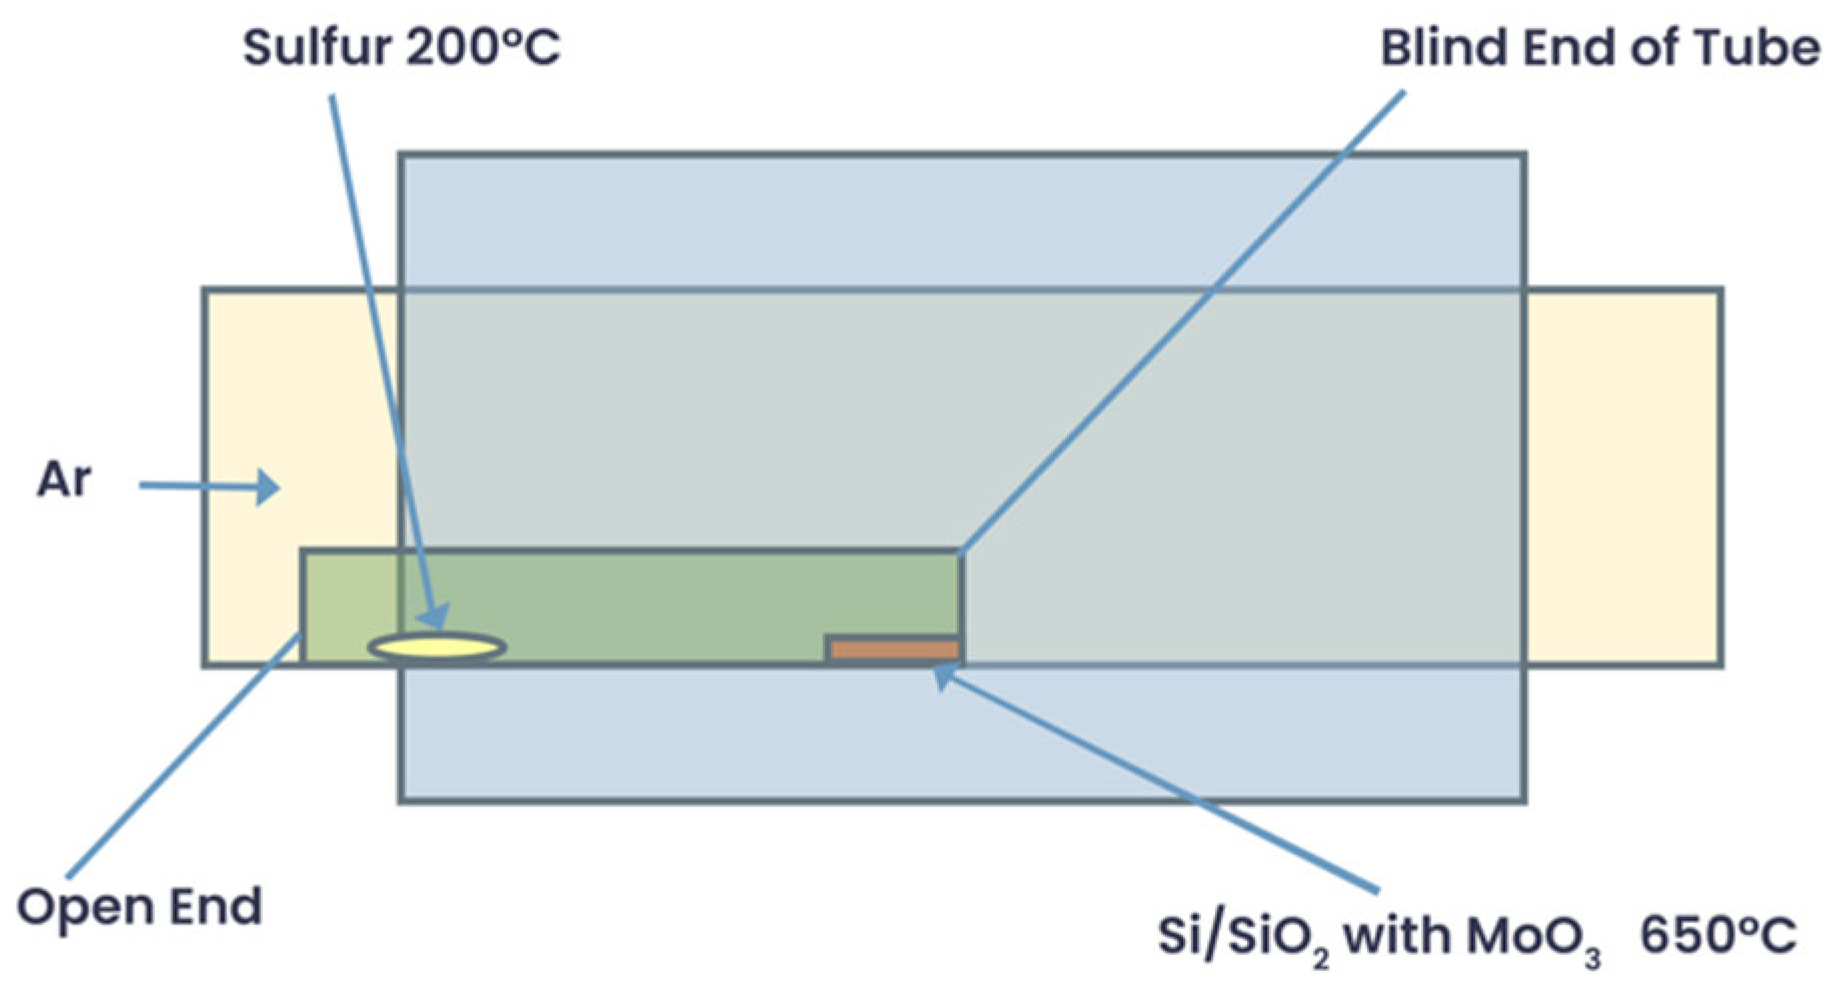
The ALD-grown MoO3 was sulfurized in a single quartz-tube CVD setup for MoS2. The functioning of CVD for the sulfurization of MoO3 powder to deposit MoS2 has been explained in detail in another dedicated article [63]. The sulfurization of the MoO3 deposited on the SiO2/Si substrate required modification in the traditional quartz-tube CVD, as shown in Figure 11.
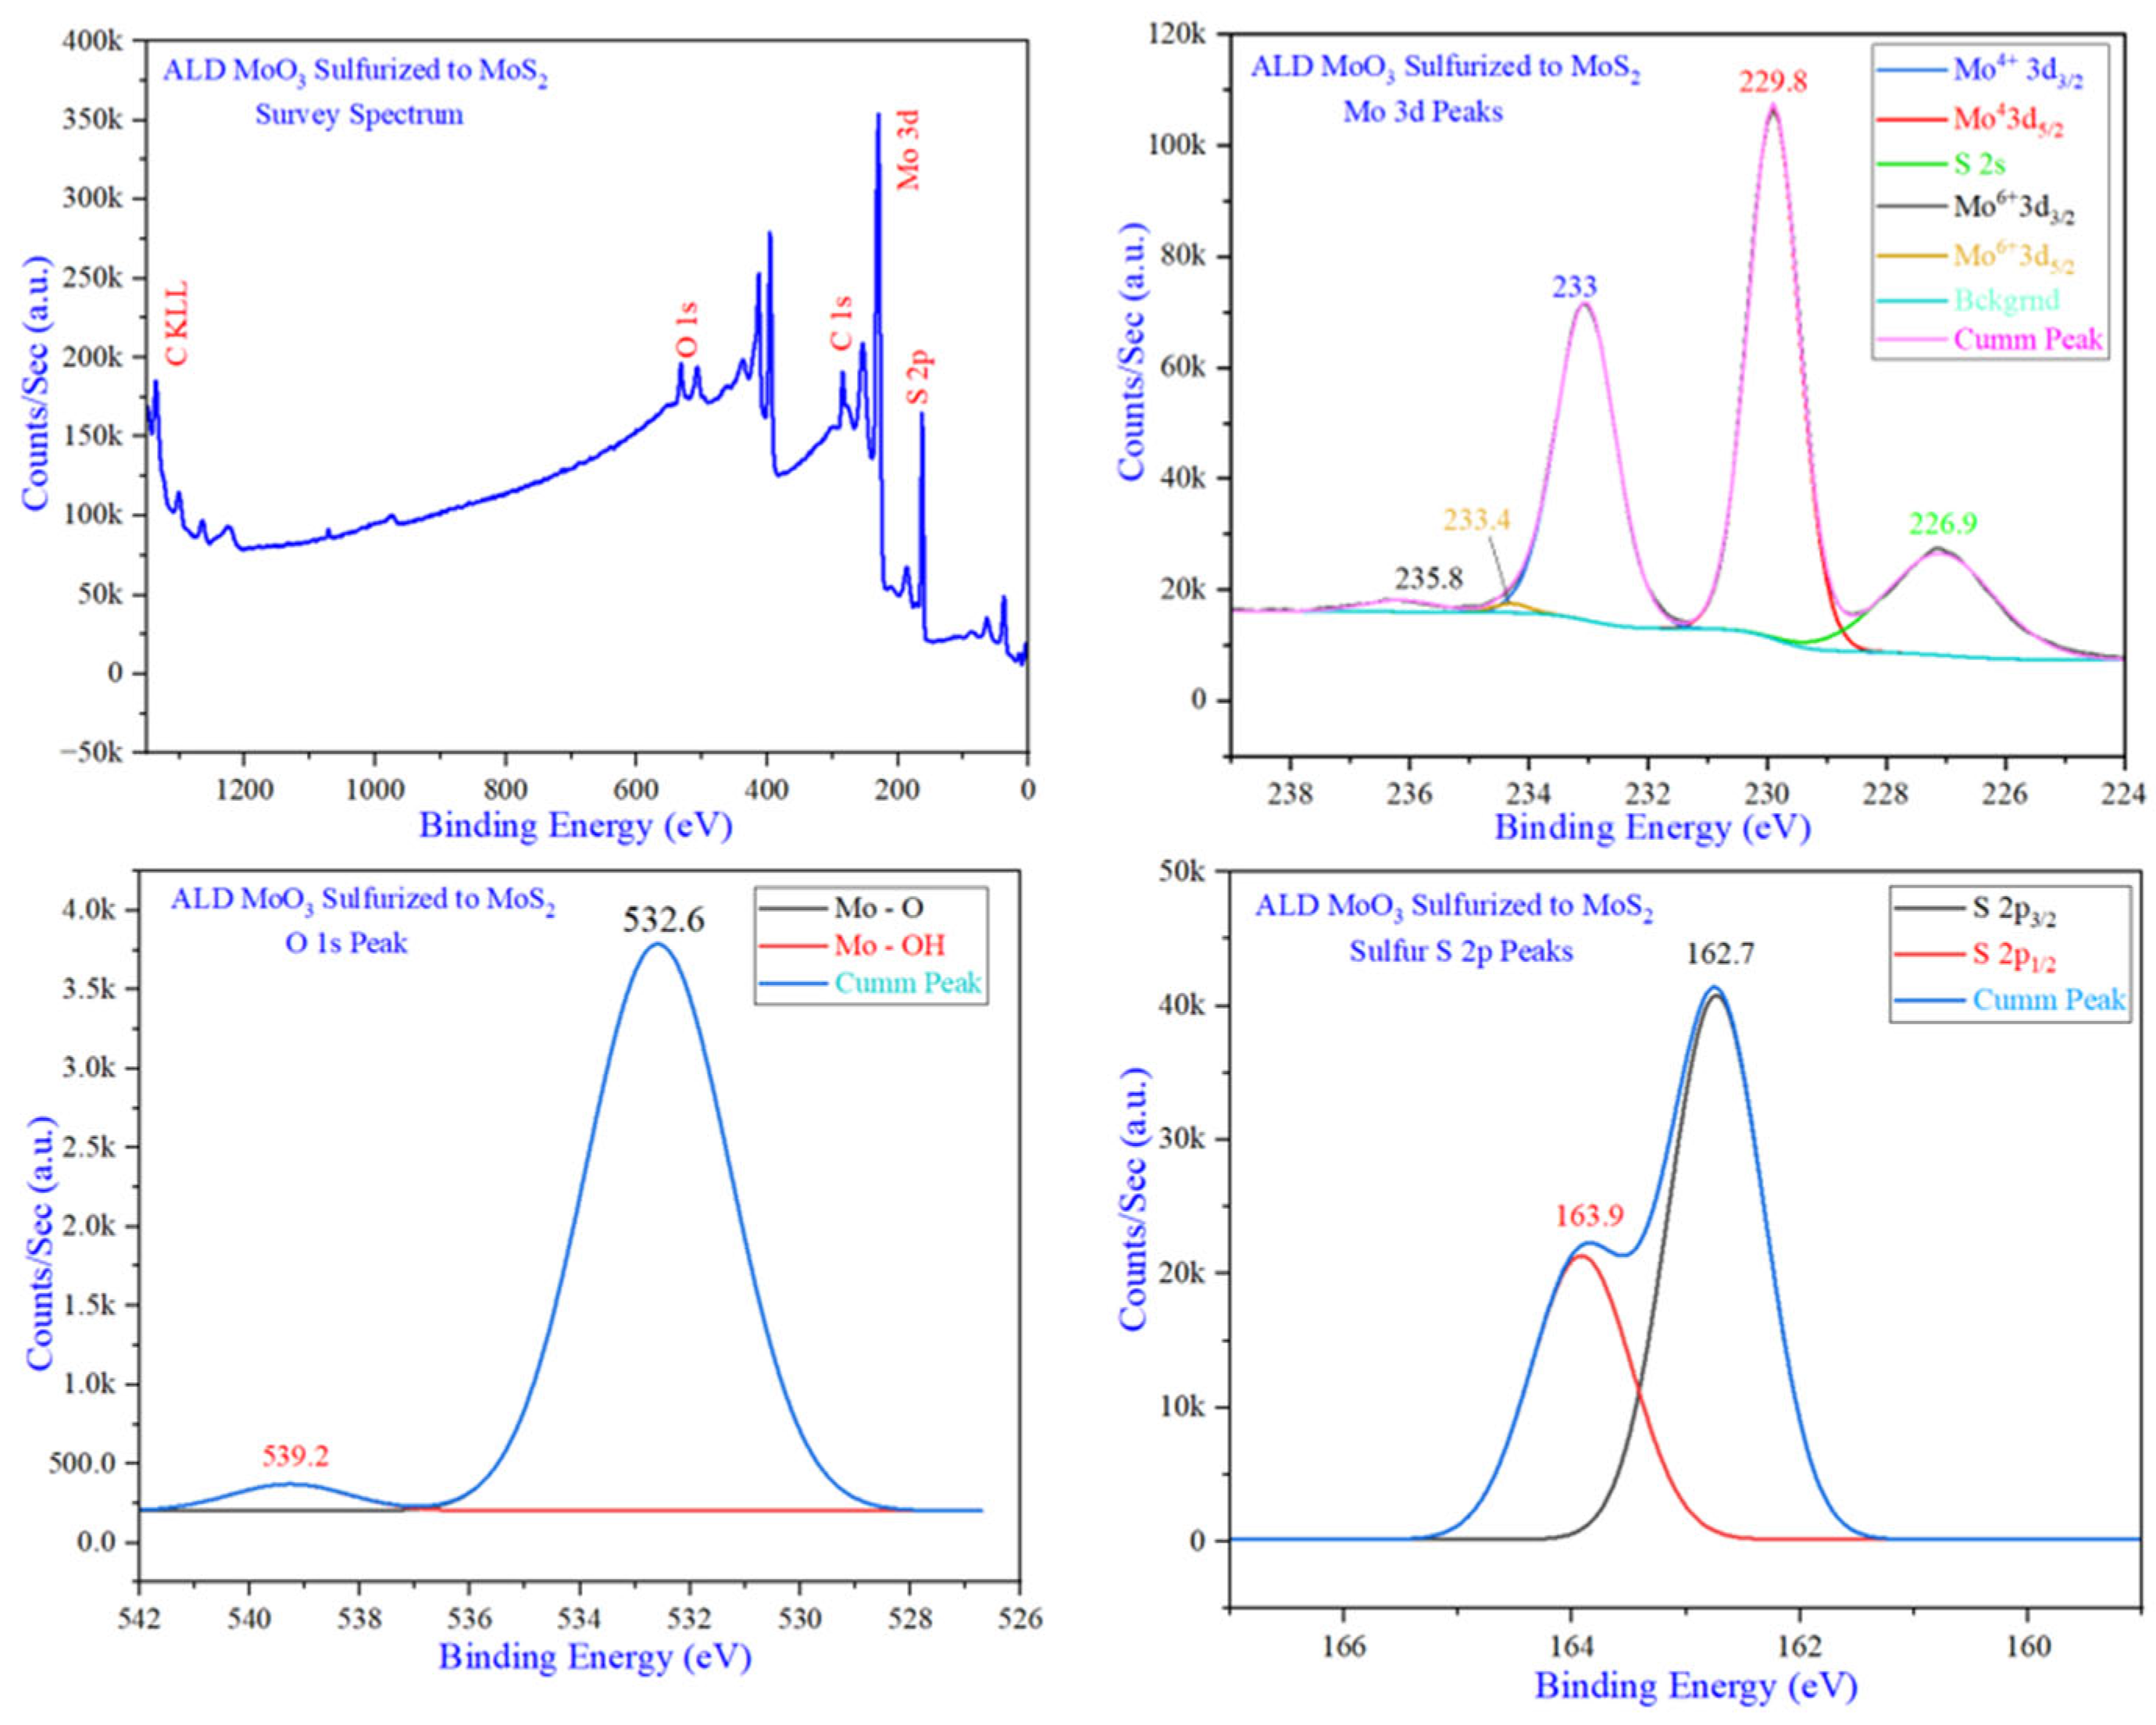
Initially, the sulfurization of MoO3 to MoS2 encountered thermal annealing issues. The temperatures used for sulfurization were 550 °C, 650 °C, and 750 °C, which initially did not result in the conversion of MoO3 to MoS2. However, the confinement of sulfur to the MoO3 thin films deposited on the surface of SiO2/Si using a one-side-blind tube as demonstrated in Figure 11, resulted in the sulfurization of MoO3 to MoS2 at 650 °C and 750 °C treatments but not for 550 °C. The temperature studies and eutectic effects during the annealing of MoS2 discussed in other articles [64,65] explain the minimum temperature requirement. Once the MoO3 was sulfurized to MoS2, it was evaluated for XPS characteristics, which are shared in Figure 12. The comparison of survey spectra identifies a significant reduction in the peak of O 1 s for MoS2 in Figure 12 as compared to the O 1 s peak for MoO3 in Figure 10. This significant change is due to the substitution of oxygen by sulfur, endorsing the effective sulfurization achieved by the modified setup of Figure 11. The Mo3d5/2 and Mo3d3/2 peaks at binding energies of 229.8 eV and 233 eV were slightly shifted towards higher binding energies as compared to the calibrated MoS2 sample specifications of 229.1 eV and 232.3 eV as per spectrum ID 01285-04. Similarly, the S2p3/2 and S2p1/2 peaks observed at 162.7 eV and 164.9 eV are marginally offset from the calibrated MoS2 peak values of 162 eV and 163.2 eV. The S2s peak in standard MoS2 is at 226.3 eV, and the one for sulfurized MoS2 is at 227 eV as per spectrum ID 01285-05 [62]. A very insignificant low intensity Mo6+3d3/2 peak was observed at 235.8 eV with its doublet Mo6+3d5/2 peak at 233.4 eV which may be due to partially sulfurized MoOxSy species.
The higher peak intensity of the S2p peak is also noticed in the XPS survey spectrum for the top MoS2 layers. There are two learning aspects from these deficient observations. First, using sulfur reactants like H2S, DMDS, etc., during ALD growth is a more effective method for stoichiometric ALD synthesis of MoS2 [66,67]. Second, a high thermal annealing procedure is required to ensure the diffusion of sulfur through the thickness of multilayer MoO3. The ALD recipe modification to achieve monolayer or bilayer MoO3 may also circumvent the sulfur diffusion problems. Here, it is to be noted that the NIST database lists several references that claim the stoichiometric MoS2 for the range of binding energy values for the peaks marked in Figure 12 [68].
An alpha300R Confocal Raman Microscope (WITec GmbH, Ulm, Germany), with the objective Zeiss EC Epiplan-Neofluar 100×/0.9 equipped with a 532 nm laser and two gratings, 1800 g/mm for Raman and 300 g/mm for photoluminescence (PL), was used for determining the bonding vibration characteristics of MoS2 flakes. The signature bonding vibration for Mo-S bonds in thin-film MoS2 was characterized for Raman shifts for in-plane vibrations E2g (381.25 cm−1) and the out-of-plane vibration peak A1g (405.6 cm−1) in Figure 13a.
The difference greater than 19 cm−1 for the E12g and A1g peaks in Figure 14 signifies that the ALD MoS2 was multilayer. The reference study suggests that the separation of 24.35 cm−1 in the E12g and A1g peaks can be equivalent to the deposition of ten or more layers of ALD MoS2 [69]. A little consideration regarding the degrees of freedom for sulfur and Mo atoms, as represented in Figure 13a, lead to an understanding that the unconstrained state of sulfur causes an increase in the amplitude of the out-of-plane A1g mode of vibrations in monolayer MoS2. The increased A1g amplitude would result in a decreased E12g amplitude in monolayer MoS2. This change in amplitude causes a relative shift in Raman peaks for monolayer MoS2 is termed “Blue Shift,” resulting in a minimum distance between two peaks. With multilayer MoS2, sulfur atoms have reduced degrees of freedom with resistance from top and bottom layers, causing a decreased A1g and increased amplitude of vibration for E12g, which causes increased separation termed “Red Shift”. The photoluminescence characteristics evaluated in the past for monolayer MoS2 have one significant peak at 1.9 eV [70,71,72]. The multilayer ALD MoS2 evaluated here demonstrates the multiple peaks seen in Figure 14b caused by trion–exciton interactions due to multiple layers of MoS2. The Raman results of multilayer MoS2 are consistent with the thickness evaluation using AFM.
The ALD MoO3-sulfurized MoS2 was analyzed for crystallinity using the Rigaku XtaLab Synergy model at 40 kV and 40 mA in a plane goniometer for the Hypix-3000 detector. The X-ray diffraction data were plotted with Split Pseudo-Voigt profile curve fitting, and the peaks were compared with the reference JCPDS card 01-075-1539. The pristine MoS2 flake was also evaluated with the same X-ray diffraction settings.
Figure 15a represents the MoS2 structure observed before annealing for ALD MoO3, ALD MoS2, and the pristine MoS2 flake. The XRD characteristic parameters for pristine MoS2 with precise harmonic peaks at (002), (004), (006), (008), and (010) confirm a crystalline 2H-molybdenite structure with the reference card 01-075-1539 and also validate the equipment settings and procedure adopted for XRD analysis [73,74]. However, the ALD MoS2 and ALD MoO3, which were not annealed, did not show a harmonic peak, which confirms that the structure is amorphous.
The ALD MoS2 was annealed in an excess sulfur atmosphere at 850 °C in the same setup as discussed for sulfurization in Figure 11. The diffraction peaks of ALD MoS2 annealed at 850 °C stacked with the pristine MoS2 in Figure 15b does demonstrate harmonic peaks. Hence, it can be inferred that ALD MoO3 sulfurized to MoS2 exhibits a 2H-Molybdenite phase after annealing. The harmonic peak for ALD MoS2 at (004) is offset by that of pristine MoS2. This shift of the (004) peak may be due to the MoOxSy or excess sulfur impurities. The comparative XRD data for the annealed ALD MoS2 and pristine MoS2 flake mapped with the reference card are presented in Table 2. A comparison of the data in Table 3 confirms the 2H-Molybdenite crystalline phase for ALD MoS2 [75,76]. Thus, it can be inferred that the thermal cycle adopted for sulfurization followed by annealing is necessary for transforming amorphous ALD MoO3 sulfurized to crystalline MoS2.

7. Conclusions

Wafer-scale MoO3 was successfully synthesized in ALD using Mo(CO)6 as a precursor and Ozone as a reactant. The ALD MoO3 was sulfurized to MoS2 by modifying the CVD setup.
The step for using first-order reaction kinetics and the Arrhenius equation to relate temperature and time for the ALD cycle is explicitly elaborated to determine the ALD recipe parameters of reactor temperature and pulse as well as purge time. This procedure is a good guideline for the conformance of the ALD window, which was traditionally determined based on constant ALD growth per cycle due to self-saturated reaction characteristics studied using QCM.
A one-cycle discretized ALD recipe for monolayer wafer-scale synthesis of MoO3 is suggested. This recipe can be extrapolated to any other thin-film deposition as well, but it needs further validation. The 0.02 s precursor and reactant pulse, which provided wafer-scale MoO3, led to the concept of discretized pulsing. Table 2 lists the pulsing and cycles, which are many times higher.
The SEM and AFM morphological characterizations of MoO3 revealed distinct grain boundaries, meaning wafer-scale deposition has discontinuities leading to opportunities for further improvements. XPS analysis of MoO3 is consistent with documented binding energy peaks; however, residual carbon caused C-O peaks. The MoS2 Raman peaks endorse characteristics of Mo-S bonding vibrations, but the PL peak doublet is due to the multilayer deposition. The comparison of XRD characteristics observed for ALD MoO3 sulfurized to MoS2 with pristine MoS2 confirms the crystal structure. Beyond the reasoning for the deficiencies, phenomenological remedial measures have been suggested based on the critical analysis of the shortcomings.

Author Contributions

Conceptualization, Formal analysis, Methodology, and Writing—original draft, S.S.; STEM data curation, Writing—review and editing, and Lattice spacing data analysis, M.F.H.; Data curation for Raman and photoluminescence, Investigation, and Review, S.S.; Funding acquisition, Project administration, Resources, and Supervision, S.A. All authors have read and agreed to the published version of the manuscript.

Funding

This work was funded, in part, by the Air Force Office of Scientific Research (AFOSR)/Clarkson Aerospace (FA9550-21-1-0460) on 2D Materials and Manufacturing and by the National Science Foundation (NSF) Expand QISE grant (OSI #2329097).

Data Availability Statement

The data presented in this study are available on request from the corresponding author. The data are not publicly available due to academic restrictions.

Acknowledgments

This work was performed at the Joint School of Nanoscience and Nanotechnology, a member of the National Nanotechnology Coordinated Infrastructure (NNCI), which is supported by the National Science Foundation (Grant ECCS-2025462). This work, in part, was supported by the Center for Electrochemical Dynamics and Reactions on Surfaces (CEDARS), an Energy Frontier Research Center funded by the U.S. Department of Energy (DOE), Office of Science, Basic Energy Sciences (BES), via grant # DE-SC0023415.

Conflicts of Interest

The authors declare no conflicts of interest.

References

  1. Liu, Y.; Gu, F. A wafer-scale synthesis of monolayer MoS2 and their field-effect transistors toward practical applications. Nanoscale Adv. 2021, 3, 2117–2138. [Google Scholar] [CrossRef] [PubMed]
  2. Xia, Y.; Chen, X.; Wei, J.; Wang, S.; Chen, S.; Wu, S.; Zhou, P. 12-inch growth of uniform MoS2 monolayer for integrated circuit manufacture. Nat. Mater. 2023, 22, 1324–1331. [Google Scholar] [CrossRef] [PubMed]
  3. Demirtaş, M.; Odacı, C.; Shehu, Y.; Perkgöz, N.K.; Ay, F. Layer and size distribution control of CVD-grown 2D MoS2 using ALD-deposited MoO3 structures as the precursor. Mater. Sci. Semicond. Process. 2020, 108, 104880. [Google Scholar] [CrossRef]
  4. Romanov, R.I.; Kozodaev, M.G.; Myakota, D.I.; Chernikova, A.G.; Novikov, S.M.; Volkov, V.S.; Markeev, A.M. Synthesis of large area two-dimensional MoS2 films by sulfurization of atomic layer deposited MoO3 thin film for nanoelectronic applications. ACS Appl. Nano Mater. 2019, 2, 7521–7531. [Google Scholar] [CrossRef]
  5. Richey, N.E.; De Paula, C.; Bent, S.F. Understanding chemical and physical mechanisms in atomic layer deposition. J. Chem. Phys. 2020, 152, 040902. [Google Scholar] [CrossRef] [PubMed]
  6. Yanguas-Gil, A.; Elam, J.W. Self-Limited Reaction-Diffusion in Nanostructured Substrates: Surface Coverage Dynamics and Analytic Approximations to ALD Saturation Times. Chem. Vap. Depos. 2012, 18, 46–52. [Google Scholar] [CrossRef]
  7. Rothman, A.; Werbrouck, A.; Bent, S.F. Enhanced Growth in Atomic Layer Deposition of Ruthenium Metal: The Role of Surface Diffusion and Nucleation Sites. Chem. Mater. 2023, 36, 541–550. [Google Scholar] [CrossRef]
  8. Plummer, J.D.; Griffin, P.B. Material and process limits in silicon VLSI technology. Proc. IEEE 2001, 89, 240–258. [Google Scholar] [CrossRef]
  9. Schaller, R.R. Moore’s law: Past, present, and future. IEEE Spectr. 1997, 34, 52–59. [Google Scholar] [CrossRef]
  10. Borkar, S. Design challenges of technology scaling. IEEE Micro 1999, 19, 23–29. [Google Scholar] [CrossRef]
  11. Gargini, P. Roadmap evolution: From NTRS to ITRS, from ITRS 2.0 to IRDS. In Proceedings of the 2017 Fifth Berkeley Symposium on Energy Efficient Electronic Systems & Steep Transistors Workshop (E3S), Berkeley, CA, USA, 19–20 October 2017; IEEE: New York, NY, USA, 2017; pp. 1–62. [Google Scholar]
  12. Hills, G. Beyond-Silicon Computing: Nano-Technologies, Nano-Design, and Nano-Systems. In Emerging Computing: From Devices to Systems: Looking Beyond Moore and Von Neumann; Springer: Singapore, 2022; pp. 15–45. [Google Scholar]
  13. Das, S.; Sebastian, A.; Pop, E.; McClellan, C.J.; Franklin, A.D.; Grasser, T.; Singh, R. Transistors based on two-dimensional materials for future integrated circuits. Nat. Electron. 2021, 4, 786–799. [Google Scholar] [CrossRef]
  14. Balog, R.; Jørgensen, B.; Nilsson, L.; Andersen, M.; Rienks, E.; Bianchi, M.; Hornekær, L. Bandgap opening in graphene induced by patterned hydrogen adsorption. Nat. Mater. 2010, 9, 315–319. [Google Scholar] [CrossRef] [PubMed]
  15. Wu, W.C.; Hung, T.Y.; Sathaiya, D.M.; Arutchelvan, G.; Hsu, C.F.; Su, S.K.; Chien, C.H. Comprehensive Study of Contact Length Scaling Down to 12 nm With Monolayer MoS2 Channel Transistors. IEEE Trans. Electron Devices 2023, 70, 6680–6686. [Google Scholar] [CrossRef]
  16. Splendiani, A.; Sun, L.; Zhang, Y.; Li, T.; Kim, J.; Chim, C.Y.; Wang, F. Emerging photoluminescence in monolayer MoS2. Nano Lett. 2010, 10, 1271–1275. [Google Scholar] [CrossRef] [PubMed]
  17. Radisavljevic, B.; Radenovic, A.; Brivio, J.; Giacometti, V.; Kis, A. Single-layer MoS2 transistors. Nat. Nanotechnol. 2011, 6, 147–150. [Google Scholar] [CrossRef]
  18. Liu, H.; Neal, A.T.; Ye, P.D. Channel length scaling of MoS2 MOSFETs. ACS Nano 2012, 6, 8563–8569. [Google Scholar] [CrossRef] [PubMed]
  19. Molina-Sánchez, A.; Sangalli, D.; Hummer, K.; Marini, A.; Wirtz, L. Effect of spin-orbit interaction on the optical spectra of single-layer, double-layer, and bulk MoS2. Phys. Rev. B 2013, 88, 045412. [Google Scholar] [CrossRef]
  20. Yue, Q.; Kang, J.; Shao, Z.; Zhang, X.; Chang, S.; Wang, G.; Li, J. Mechanical and electronic properties of monolayer MoS2 under elastic strain. Phys. Lett. A 2012, 376, 1166–1170. [Google Scholar] [CrossRef]
  21. Akhter, M.J.; Kuś, W.; Mrozek, A.; Burczyński, T. Mechanical properties of monolayer MoS2 with randomly distributed defects. Materials 2020, 13, 1307. [Google Scholar] [CrossRef]
  22. Cao, Y. Roadmap and direction toward high-performance MoS2 hydrogen evolution catalysts. ACS Nano 2021, 15, 11014–11039. [Google Scholar] [CrossRef]
  23. Wang, T.; Chen, S.; Pang, H.; Xue, H.; Yu, Y. MoS2-based nanocomposites for electrochemical energy storage. Adv. Sci. 2017, 4, 1600289. [Google Scholar] [CrossRef] [PubMed]
  24. Voiry, D.; Salehi, M.; Silva, R.; Fujita, T.; Chen, M.; Asefa, T.; Chhowalla, M. Conducting MoS2 nanosheets as catalysts for hydrogen evolution reaction. Nano Lett. 2013, 13, 6222–6227. [Google Scholar] [CrossRef] [PubMed]
  25. Shokri, A.; Salami, N. Gas sensor based on MoS2 monolayer. Sens. Actuators B Chem. 2016, 236, 378–385. [Google Scholar] [CrossRef]
  26. Taffelli, A.; Dirè, S.; Quaranta, A.; Pancheri, L. MoS2 based photodetectors: A review. Sensors 2021, 21, 2758. [Google Scholar] [CrossRef] [PubMed]
  27. Singh, E.; Singh, P.; Kim, K.S.; Yeom, G.Y.; Nalwa, H.S. Flexible molybdenum disulfide (MoS2) atomic layers for wearable electronics and optoelectronics. ACS Appl. Mater. Interfaces 2019, 11, 11061–11105. [Google Scholar] [CrossRef] [PubMed]
  28. Chen, X.; Park, Y.J.; Kang, M.; Kang, S.K.; Koo, J.; Shinde, S.M.; Ahn, J.H. CVD-grown monolayer MoS2 in bioabsorbable electronics and biosensors. Nat. Commun. 2018, 9, 1690. [Google Scholar] [CrossRef] [PubMed]
  29. Lü, H.; Zhang, Y.; Liu, X.; Wang, Y.; Zhang, Q.; Yin, H. Theoretical limit of how small we can make MoS2 transistor channels. J. Phys. D: Appl. Phys. 2021, 55, 105304. [Google Scholar] [CrossRef]
  30. Jeon, J.; Jang, S.K.; Jeon, S.M.; Yoo, G.; Jang, Y.H.; Park, J.H.; Lee, S. Layer-controlled CVD growth of large-area two-dimensional MoS2 films. Nanoscale 2015, 7, 1688–1695. [Google Scholar] [CrossRef] [PubMed]
  31. Choudhury, T.H.; Huet, B.; Zhang, X.; Bansal, A.; Redwing, J.M. Scalable synthesis of 2D materials. In 2D Materials for Electronics, Sensors and Devices; Elsevier: Amsterdam, The Netherlands, 2023; pp. 1–54. [Google Scholar]
  32. Waite, A.R.; Pacley, S.; Glavin, N.R.; Voevodin, A.A.; Muratore, C. Tailoring ultra-thin MoS2 films via post-treatment of solid-state precursor phases. Thin Solid Film. 2018, 649, 177–186. [Google Scholar] [CrossRef]
  33. Zhan, L.; Wan, W.; Zhu, Z.; Shih, T.M.; Cai, W. MoS2 materials synthesized on SiO2/Si substrates via MBE. J. Phys. Conf. Ser. 2017, 864, 012037. [Google Scholar] [CrossRef]
  34. Serna, M.I.; Yoo, S.H.; Moreno, S.; Xi, Y.; Oviedo, J.P.; Choi, H.; Quevedo-Lopez, M.A. Large-area deposition of MoS2 by pulsed laser deposition with in situ thickness control. Acs Nano 2016, 10, 6054–6061. [Google Scholar] [CrossRef] [PubMed]
  35. George, A.S.; Mutlu, Z.; Ionescu, R.; Wu, R.J.; Jeong, J.S.; Bay, H.H.; Ozkan, C.S. Wafer-scale synthesis and high-resolution structural characterization of atomically thin MoS2 layers. Adv. Funct. Mater. 2014, 24, 7461–7466. [Google Scholar] [CrossRef]
  36. Liu, F.; Wu, W.; Bai, Y.; Chae, S.H.; Li, Q.; Wang, J.; Zhu, X.Y. Disassembling 2D van der Waals crystals into macroscopic monolayers and reassembling into artificial lattices. Science 2020, 367, 903–906. [Google Scholar] [CrossRef]
  37. Li, H.; Wu, J.; Yin, Z.; Zhang, H. Preparation and applications of mechanically exfoliated single-layer and multilayer MoS2 and WSe2 nanosheets. Acc. Chem. Res. 2014, 47, 1067–1075. [Google Scholar] [CrossRef] [PubMed]
  38. Liu, N.; Kim, P.; Kim, J.H.; Ye, J.H.; Kim, S.; Lee, C.J. Large-area atomically thin MoS2 nanosheets prepared using electrochemical exfoliation. ACS Nano 2014, 8, 6902–6910. [Google Scholar] [CrossRef]
  39. Eda, G.; Yamaguchi, H.; Voiry, D.; Fujita, T.; Chen, M.; Chhowalla, M. Photoluminescence from chemically exfoliated MoS2. Nano Lett. 2011, 11, 5111–5116. [Google Scholar] [CrossRef]
  40. Sebastian, A.; Pendurthi, R.; Choudhury, T.H.; Redwing, J.M.; Das, S. Benchmarking monolayer MoS2 and WS2 field-effect transistors. Nat. Commun. 2021, 12, 693. [Google Scholar] [CrossRef]
  41. Tan, L.K.; Liu, B.; Teng, J.H.; Guo, S.; Low, H.Y.; Loh, K.P. Atomic layer deposition of a MoS2 film. Nanoscale 2014, 6, 10584–10588. [Google Scholar] [CrossRef]
  42. Diskus, M.; Nilsen, O.; Fjellvåg, H. Growth of thin films of molybdenum oxide by atomic layer deposition. J. Mater. Chem. 2011, 21, 705–710. [Google Scholar] [CrossRef]
  43. Cremers, V.; Puurunen, R.L.; Dendooven, J. Conformality in atomic layer deposition: Current status overview of analysis and modelling. Appl. Phys. Rev. 2019, 6, 021302. [Google Scholar] [CrossRef]
  44. Suntola, T. Atomic layer epitaxy. Mater. Sci. Rep. 1989, 4, 261–312. [Google Scholar] [CrossRef]
  45. Suntola, T. Surface chemistry of materials deposition at atomic layer level. Appl. Surf. Sci. 1996, 100, 391–398. [Google Scholar] [CrossRef]
  46. Ritala, M.; Leskelä, M. Atomic layer deposition. In Handbook of Thin Films; Academic Press: Cambridge, MA, USA, 2002; pp. 103–159. [Google Scholar]
  47. Puurunen, R.L. Surface chemistry of atomic layer deposition: A case study for the trimethylaluminum/water process. J. Appl. Phys. 2005, 97, 121301. [Google Scholar] [CrossRef]
  48. George, S.M. Atomic layer deposition: An overview. Chem. Rev. 2010, 110, 111–131. [Google Scholar] [CrossRef] [PubMed]
  49. Shirazi, M.; Kessels WM, M.; Bol, A.A. Strategies to facilitate the formation of free standing MoS2 nanolayers on SiO2 surface by atomic layer deposition: A DFT study. APL Mater. 2018, 6, 111107. [Google Scholar] [CrossRef]
  50. Nanayakkara, C.E.; Vega, A.; Liu, G.; Dezelah, C.L.; Kanjolia, R.K.; Chabal, Y.J. Role of initial precursor chemisorption on incubation delay for molybdenum oxide atomic layer deposition. Chem. Mater. 2016, 28, 8591–8597. [Google Scholar] [CrossRef]
  51. Paul, S.; Torsi, R.; Robinson, J.A.; Momeni, K. Effect of the substrate on MoS2 monolayer morphology: An integrated computational and experimental study. ACS Appl. Mater. Interfaces 2022, 14, 18835–18844. [Google Scholar] [CrossRef] [PubMed]
  52. Shahmohammadi, M.; Mukherjee, R.; Sukotjo, C.; Diwekar, U.M.; Takoudis, C.G. Recent advances in theoretical development of thermal atomic layer deposition: A review. Nanomaterials 2022, 12, 831. [Google Scholar] [CrossRef] [PubMed]
  53. Diskus, M.; Balasundaram, M.; Nilsen, O.; Fjellvåg, H. Influence of precursors chemistry on ALD growth of cobalt–molybdenum oxide films. Dalton Trans. 2012, 41, 2439–2444. [Google Scholar] [CrossRef]
  54. Nandi, D.K.; Sarkar, S.K. Atomic layer deposition of molybdenum oxide for solar cell application. Appl. Mech. Mater. 2014, 492, 375–379. [Google Scholar] [CrossRef]
  55. Liu, H.; Yang, R.B.; Yang, W.; Jin, Y.; Lee, C.J. Atomic layer deposition and post-growth thermal annealing of ultrathin MoO3 layers on silicon substrates: Formation of surface nanostructures. Appl. Surf. Sci. 2018, 439, 583–588. [Google Scholar] [CrossRef]
  56. Dai, T.; Ren, Y.; Qian, L.; Liu, X. Characterization of molybdenum oxide thin films grown by atomic layer deposition. J. Electron. Mater. 2018, 47, 6709–6715. [Google Scholar] [CrossRef]
  57. Knoops, H.C.; Potts, S.E.; Bol, A.A.; Kessels WM, M. Atomic layer deposition. In Handbook of Crystal Growth; Elsevier: North-Holland, Amsterdam, The Netherlands, 2015; pp. 1101–1134. [Google Scholar]
  58. Shirazi, M.; Kessels WM, M.; Bol, A.A. Initial Stage of Atomic Layer Deposition of 2D-MoS2 on a SiO2 Surface. Phys. Chem. Chem. Phys. 2018, 20, 16861–16875. Available online: https://pure.tue.nl/ws/portalfiles/portal/102383306/M.Shirazi_W.M.M.Kessels_A.A.Bol.pdf (accessed on 6 July 2024). [CrossRef] [PubMed]
  59. Zeng, L.; Richey, N.E.; Palm, D.W.; Oh, I.K.; Shi, J.; Maclsaac, C.; Bent, S.F. Modified atomic layer deposition of MoS2 thin films. J. Vac. Sci. Technol. A 2020, 38, 060403. [Google Scholar] [CrossRef]
  60. Diware, M. Shraddha Ganorkar. In 2D Nanomaterials: Chemistry and Properties; CRC Press: Boca Raton, FL, USA, 2022; Volume 139. [Google Scholar]
  61. Greczynski, G.; Hultman, L. Reliable determination of chemical state in X-ray photoelectron spectroscopy based on sample-work-function referencing to adventitious carbon: Resolving the myth of apparent constant binding energy of the C 1s peak. Appl. Surf. Sci. 2018, 451, 99–103. [Google Scholar] [CrossRef]
  62. Ganta, D.; Sinha, S.; Haasch, R.T. 2-D material molybdenum disulfide analyzed by XPS. Surf. Sci. Spectra 2014, 21, 19–27. [Google Scholar] [CrossRef]
  63. Weber, T.; Muijsers, J.C.; Van Wolput JH, M.C.; Verhagen CP, J.; Niemantsverdriet, J.W. Basic reaction steps in the sulfidation of crystalline MoO3 to MoS2, as studied by X-ray photoelectron and infrared emission spectroscopy. J. Phys. Chem. 1996, 100, 14144–14150. [Google Scholar] [CrossRef]
  64. van Esbroeck, N.M.; Sharma, A. Towards 2D-MoS2 Thin Films: Optimization of Thermal Sulfurization of ALD-Grown MoO3; Eindhoven University of Technology: Eindhoven, The Netherlands, 2016; Available online: https://pure.tue.nl/ws/portalfiles/portal/176691394/Esbroeck_BEP_verslag.pdf (accessed on 20 July 2024).
  65. Keller, B.D.; Bertuch, A.; Provine, J.; Sundaram, G.; Ferralis, N.; Grossman, J.C. Process control of atomic layer deposition molybdenum oxide nucleation and sulfidation to large-area MoS2 monolayers. Chem. Mater. 2017, 29, 2024–2032. [Google Scholar] [CrossRef]
  66. Pyeon, J.J.; Kim, S.H.; Jeong, D.S.; Baek, S.H.; Kang, C.Y.; Kim, J.S.; Kim, S.K. Wafer-scale growth of MoS2 thin films by atomic layer deposition. Nanoscale 2016, 8, 10792–10798. [Google Scholar] [CrossRef]
  67. Jin, Z.; Shin, S.; Han, S.J.; Min, Y.S. Novel chemical route for atomic layer deposition of MoS 2 thin film on SiO 2/Si substrate. Nanoscale 2014, 6, 14453–14458. [Google Scholar] [CrossRef]
  68. Available online: http://srdata.nist.gov/xps/SpectraIdentifier (accessed on 5 July 2024).
  69. Shendokar, S.; Aryeetey, F.; Hossen, M.F.; Ignatova, T.; Aravamudhan, S. Towards Low-Temperature CVD Synthesis and Characterization of Mono-or Few-Layer Molybdenum Disulfide. Micromachines 2023, 14, 1758. [Google Scholar] [CrossRef] [PubMed]
  70. Mak, K.F.; Lee, C.; Hone, J.; Shan, J.; Heinz, T.F. Atomically thin MoS2: A new direct-gap semiconductor. Phys. Rev. Lett. 2010, 105, 136805. [Google Scholar] [CrossRef] [PubMed]
  71. Jurca, T.; Moody, M.J.; Henning, A.; Emery, J.D.; Wang, B.; Tan, J.M.; Marks, T.J. Low-temperature atomic layer deposition of MoS2 films. Angew. Chem. Int. Ed. 2017, 56, 4991–4995. [Google Scholar] [CrossRef] [PubMed]
  72. Kim, D.H.; Park, J.C.; Park, J.; Cho, D.Y.; Kim, W.H.; Shong, B.; Park, T.J. Wafer-scale growth of a MoS2 monolayer via one cycle of atomic layer deposition: An adsorbate control method. Chem. Mater. 2021, 33, 4099–4105. [Google Scholar] [CrossRef]
  73. Jang, Y.; Yeo, S.; Kim, H.; Kim, S.H. Wafer-scale, conformal and direct growth of MoS2 thin films by atomic layer deposition. Appl. Surf. Sci. 2016, 365, 160–165. [Google Scholar] [CrossRef]
  74. Kumar, P.; Singh, M.; Sharma, R.K.; Reddy, G.B. An experimental study: Role of different ambient on sulfurization of MoO3 into MoS2. J. Alloys Compd. 2016, 671, 440–445. [Google Scholar] [CrossRef]
  75. Quilty, C.D.; Housel, L.M.; Bock, D.C.; Dunkin, M.R.; Wang, L.; Lutz, D.M.; Marschilok, A.C. Ex situ and operando XRD and XAS analysis of MoS2: A lithiation study of bulk and nanosheet materials. ACS Appl. Energy Mater. 2019, 2, 7635–7646. [Google Scholar] [CrossRef]
  76. Khan, M.; Kumar, S.; Mishra, A.; Sulania, I.; Tripathi, M.N.; Tripathi, A. Study of structural and electronic properties of few-layer MoS2 film. Mater. Today Proc. 2022, 57, 100–105. [Google Scholar] [CrossRef]
Figure 1. Semiconductor feature-size transition scale.
Crystals 14 00673 g001
Figure 2. Hypothetical pulsing of precursor and reactant in one ALD cycle.
Crystals 14 00673 g002
Figure 3. ALD equipment schematic.
Crystals 14 00673 g003
Figure 4. ALD temperature window [57].
Crystals 14 00673 g004
Figure 5. Relationship of activation and Gibbs free energy.
Crystals 14 00673 g005
Figure 6. Time and temperature estimation for selected Ea [59].
Crystals 14 00673 g006
Figure 7. (a) Conventional pulsing vs. (b) discretized pulsing for one cycle of ALD.
Crystals 14 00673 g007
Figure 8. ALD MoS2 morphology and thickness evaluation.
Crystals 14 00673 g008aCrystals 14 00673 g008b
Figure 9. 2D thin-film nucleation and growth mechanisms [60].
Crystals 14 00673 g009
Figure 10. XPS analysis of ALD MoO3.
Crystals 14 00673 g010
Figure 11. Secondary one-side-blind tube used for sulfur confinement.
Crystals 14 00673 g011
Figure 12. Mo3d and S2p characteristic XPS peaks for ALD MoO3 sulfurized to MoS2.
Crystals 14 00673 g012
Figure 13. Mo-S atomic arrangement in MoS2.
Crystals 14 00673 g013
Figure 14. (a) Raman shift and (b) PL peaks for multilayer MoS2.
Crystals 14 00673 g014
Figure 15. 2H crystalline structure of ALD MoS2 compared with pristine MoS2.
Crystals 14 00673 g015
Table 1. ALD recipe interface.
InstructionChannelValuesUnit
0Wait 5s
1Flow020sccm
2Heater13135°C
3Heater8167°C
4Heater9167°C
5Heater10150°C
6Wait 600s
7Ozone Flow 1On
8Wait 10s
9Ozone Flow 1On
10Wait 30s
11Pulse2 for Mo(CO)60.02s
12Wait 7s
13Pulse0 for Ozone0.02s
14Wait 7s
15Go To10200Cycles
16Ozone Flow 0Off
17Wait 20s
18Ozone Flow 0Off
19Flow020sccm
Table 2. Summary of process parameters for ALD growth of MoO3.
Parameters—ALD of MoO3—No Sulfurization—Mo(CO)6 and Ozone (04)
ReferenceEqpt TypeSubsSubs CondtPreC1PulsePreC2PulsePurgeCyclesR-T/PVP-HeatPost ProcessingIssues/Remarks
53 Diskus-2010F120-Electro
By Suntola
Si(111) soda-LGNMMo(CO)61 sH2O + Ozone, 15%, 500 cm3/m3 s5 s, N2-300 cm3/min1000152–172°3.5 mbarAnneal—200–600Thk-35 to 70 nm for 1000 cyc. Combined Pulse H2O + Oz used
54 Nandi-2014Custom builtNMNMMo(CO)61 sOzone—1 gm/h1 s15 sNM165–175°1 TorrAnn—500QCM Studies. MoCO6-
55 Hongfei Liu-2017Custom Built SS-Cross FloSi 1.0 cm2 Ace/EtOh/DIW-SoniMo(CO)62 sOzone—
O-D-P-M-D-P
0.5 s2 s-Dwell 8 s-N2Purge50–200120°1 Torr550–750 °C for 15minGPC at 120 °C &150 °C are
0.9 ± 0.1Å/cyc & 3.4 ± 1.4Å/cyc
56 Tinj Dai-2018PE-ALDSi(111), Qrz, Si(100)Ace/IPA/DIWMo(CO)64 sO2–Plasma, 12 sccm, 180 W12 s60 s, 40 s1000
77n
162°1.33 × 10⁻⁶Β-α 300–4000.76 A/cyc; 13.56 MHz- RF-ICP, Procs Window-157-172
Table 3. Comparable XRD lattice parameters for pristine and ALD MoS2 annealed.
Lattice ParametersPristine MoS2ALD MoS2
a (Å)3.157923.13171
b (Å)3.157923.13171
c (Å)12.3062812.53826
α = β °9090
γ °120120
2θ, °—1st/d (Å)14.39/6.146614.2/6.2
2θ, °—2nd/d (Å)28.99/3.076933/2.712
2θ, °—3rd/d (Å)44.11/2.0512244.5/2.04
2θ, °—4th/d (Å)60.08/1.5387169.17/1.357
Disclaimer/Publisher’s Note: The statements, opinions and data contained in all publications are solely those of the individual author(s) and contributor(s) and not of MDPI and/or the editor(s). MDPI and/or the editor(s) disclaim responsibility for any injury to people or property resulting from any ideas, methods, instructions or products referred to in the content.