
Gemological Characteristics and Trace Chemical Element Analysis of Emerald in Kafubu, Zambia


Abstract
1. Introduction
2. Geological Setting
3. Materials and Methods
4. Results
4.1. Visual Appearance and Gemological Properties of Emerald
4.2. Observation Under Microscope
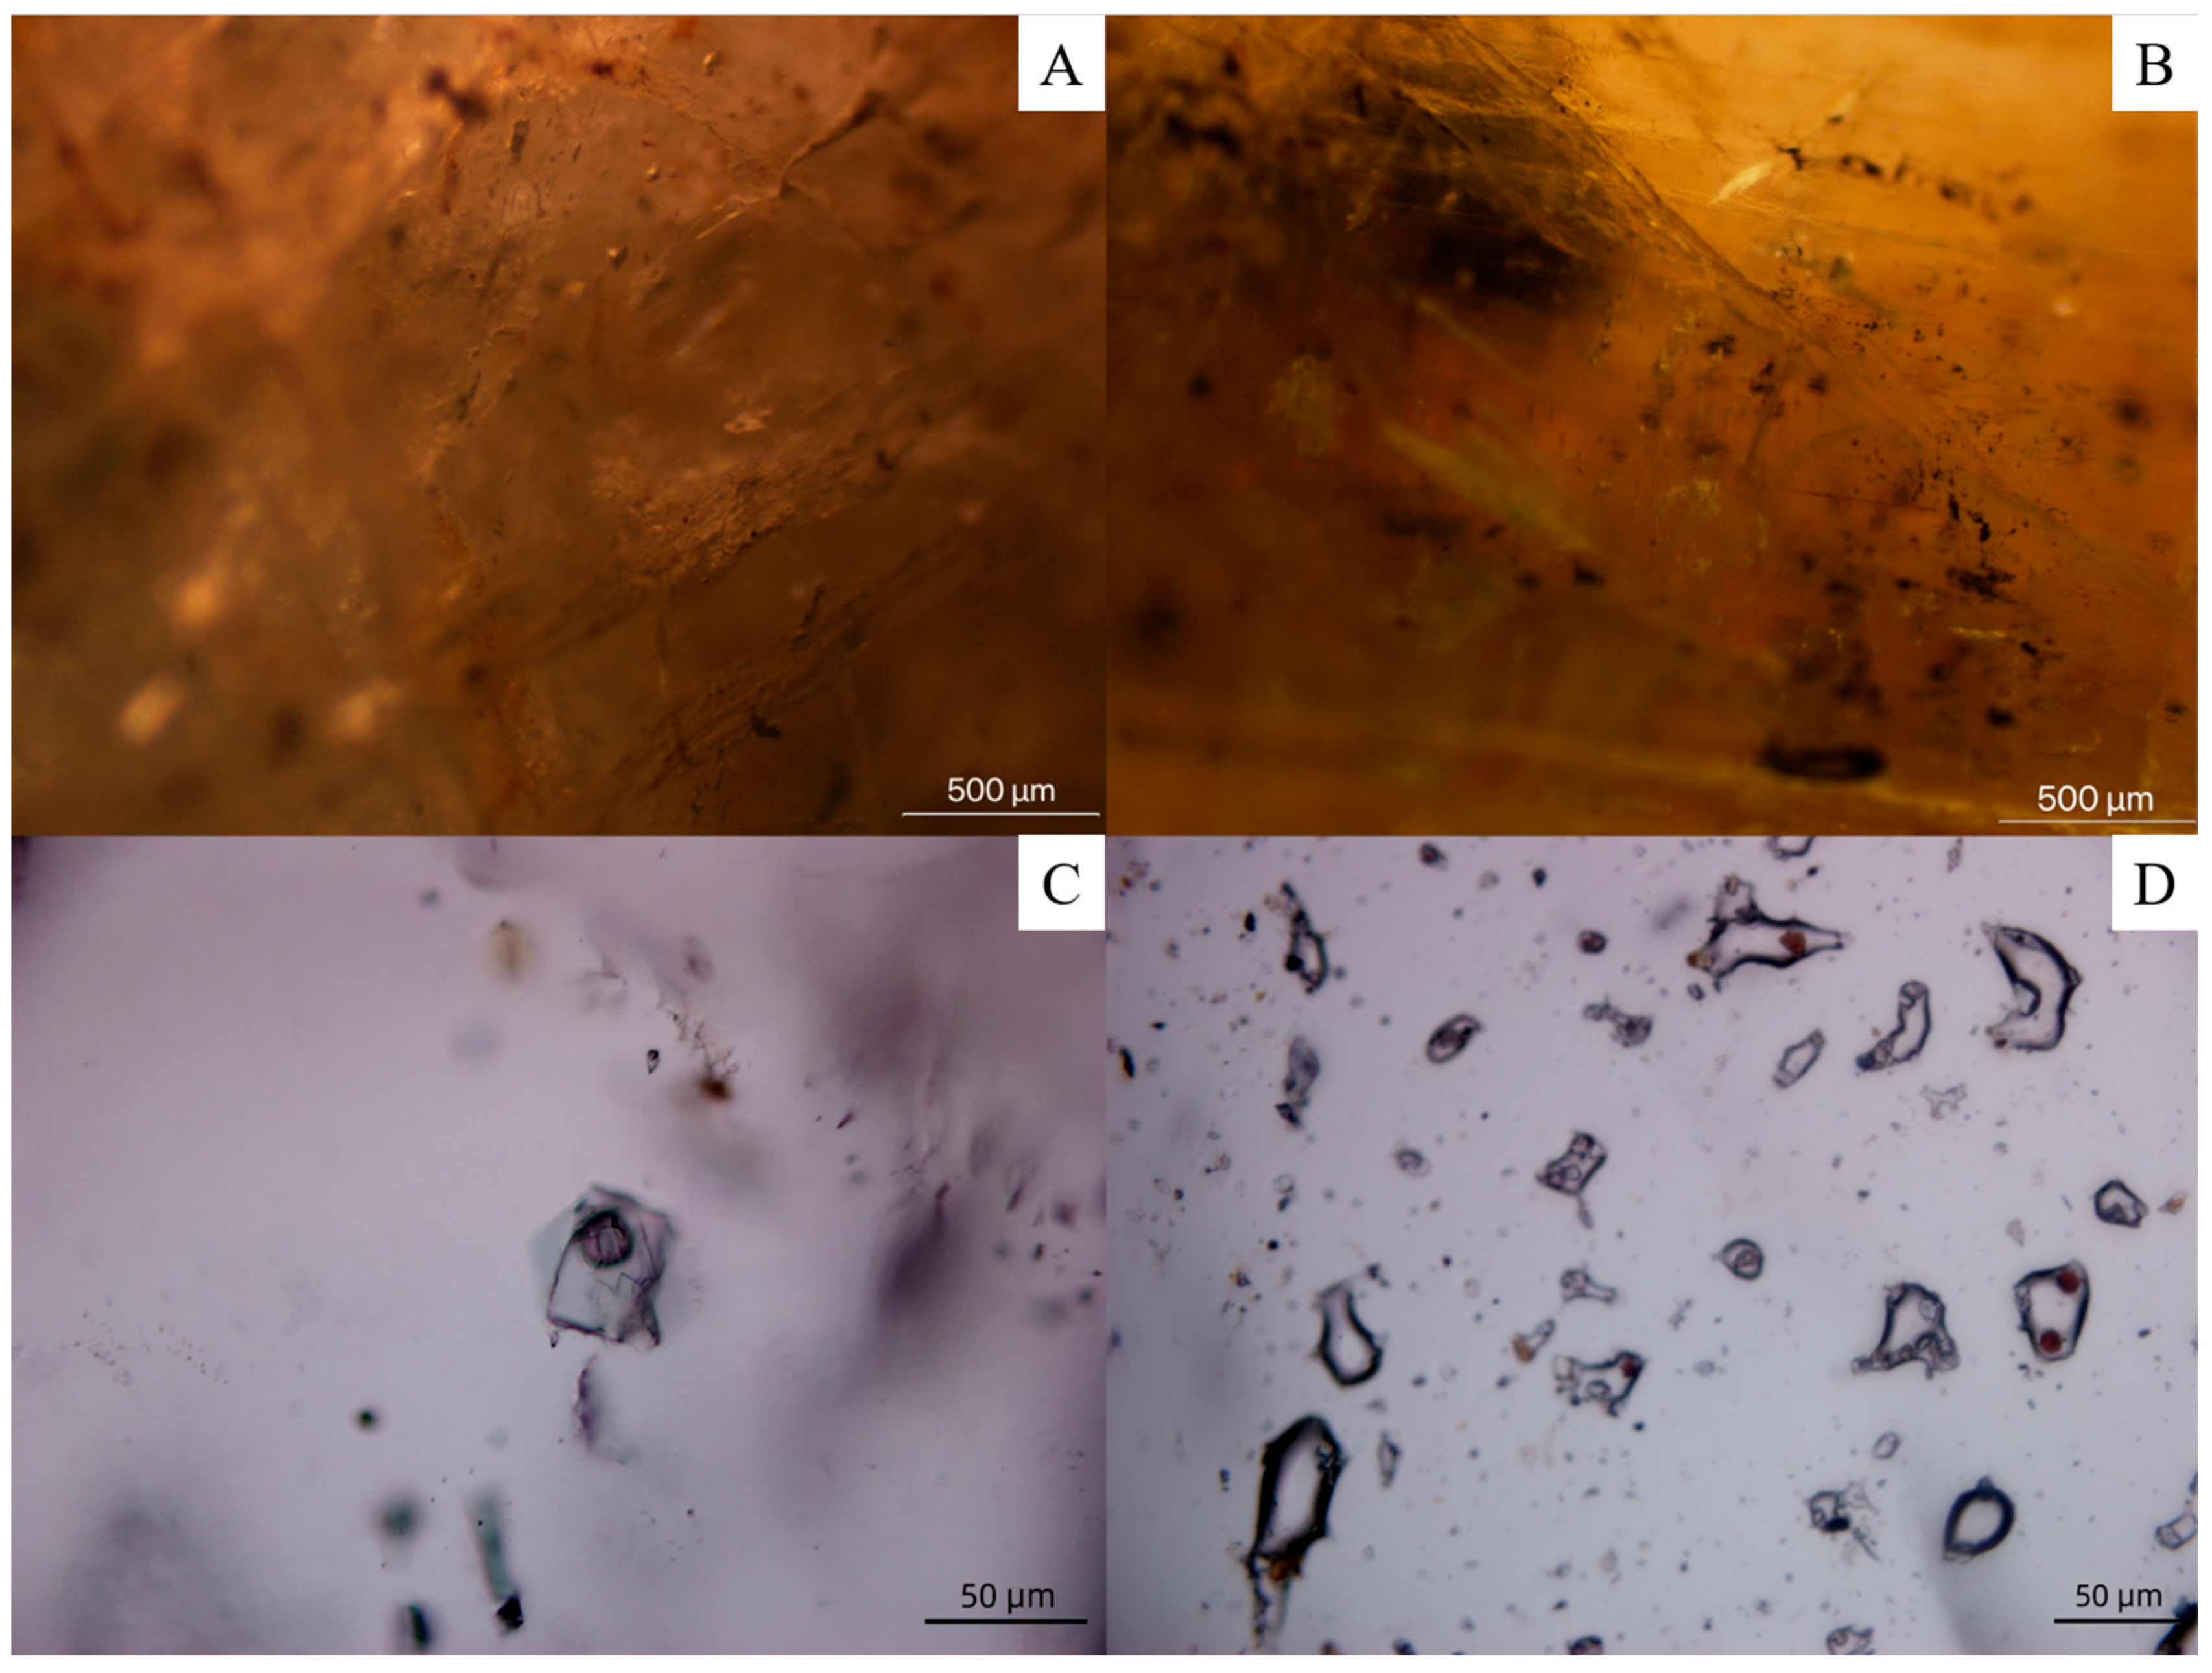
4.2.1. Fractures and Fluid Inclusions
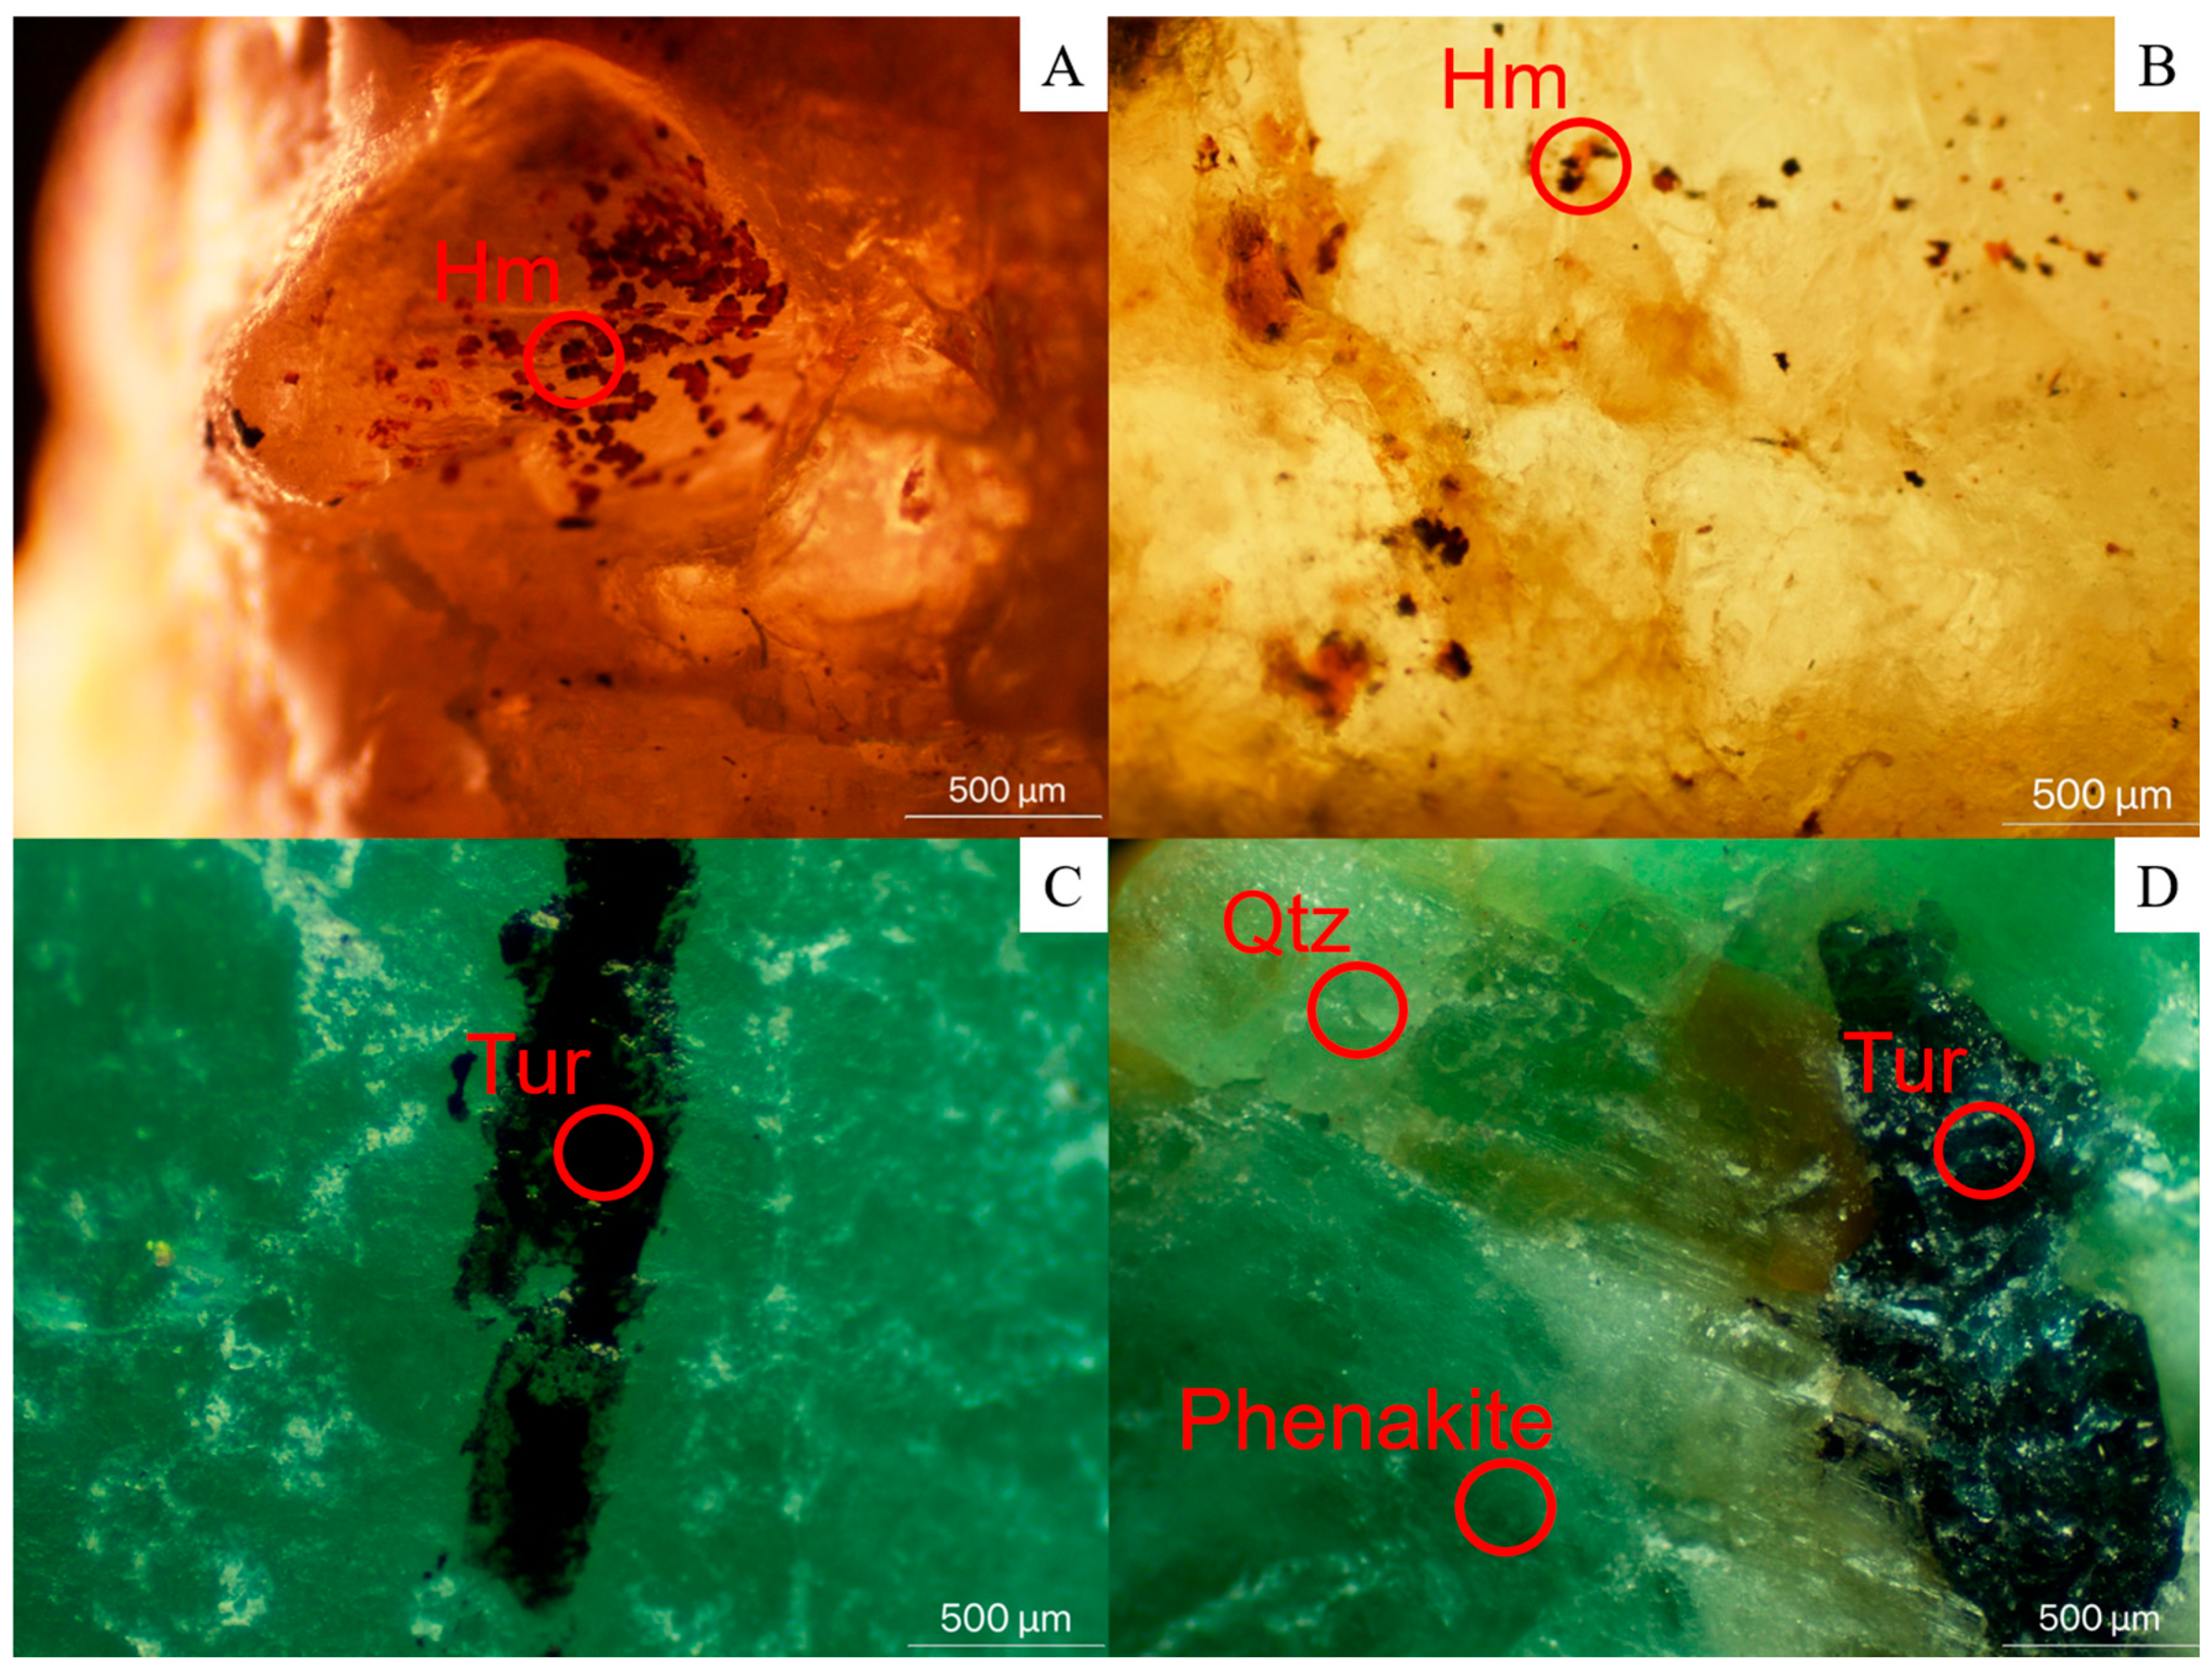
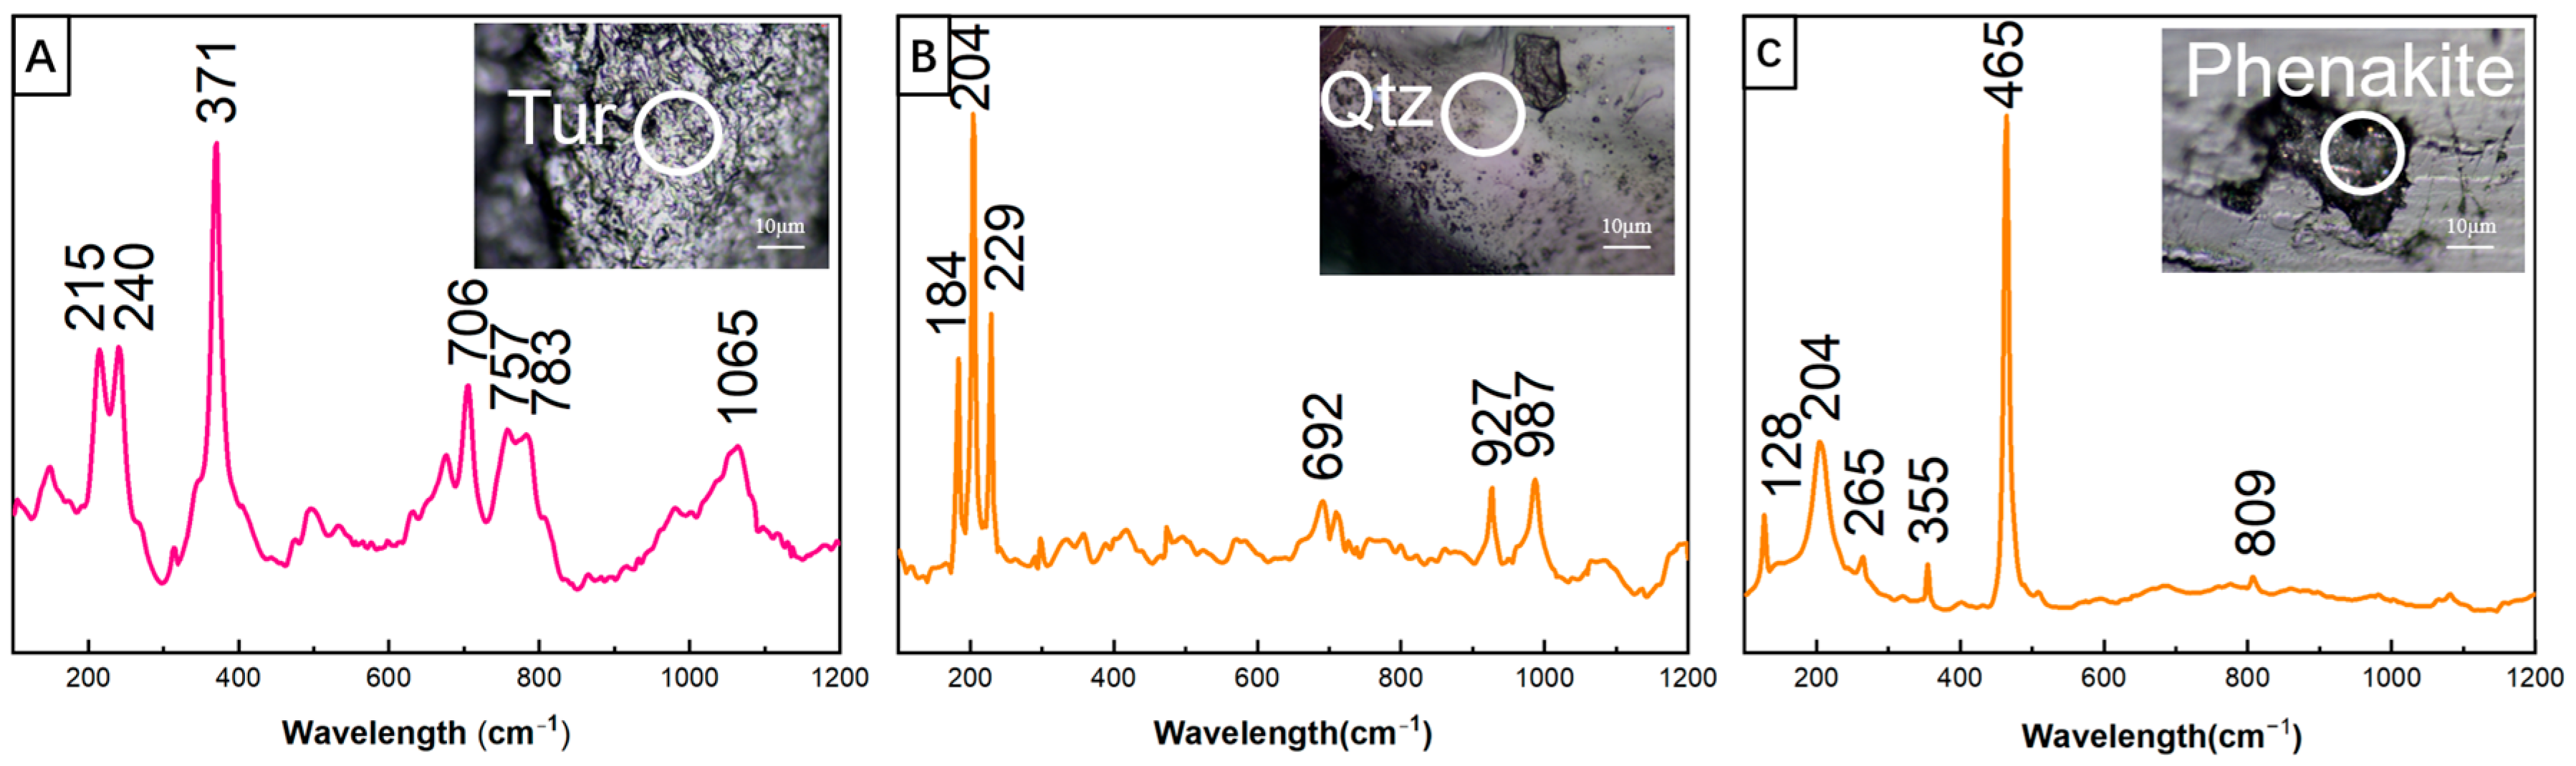
4.2.2. Mineral Inclusions
4.3. Spectral Characteristics
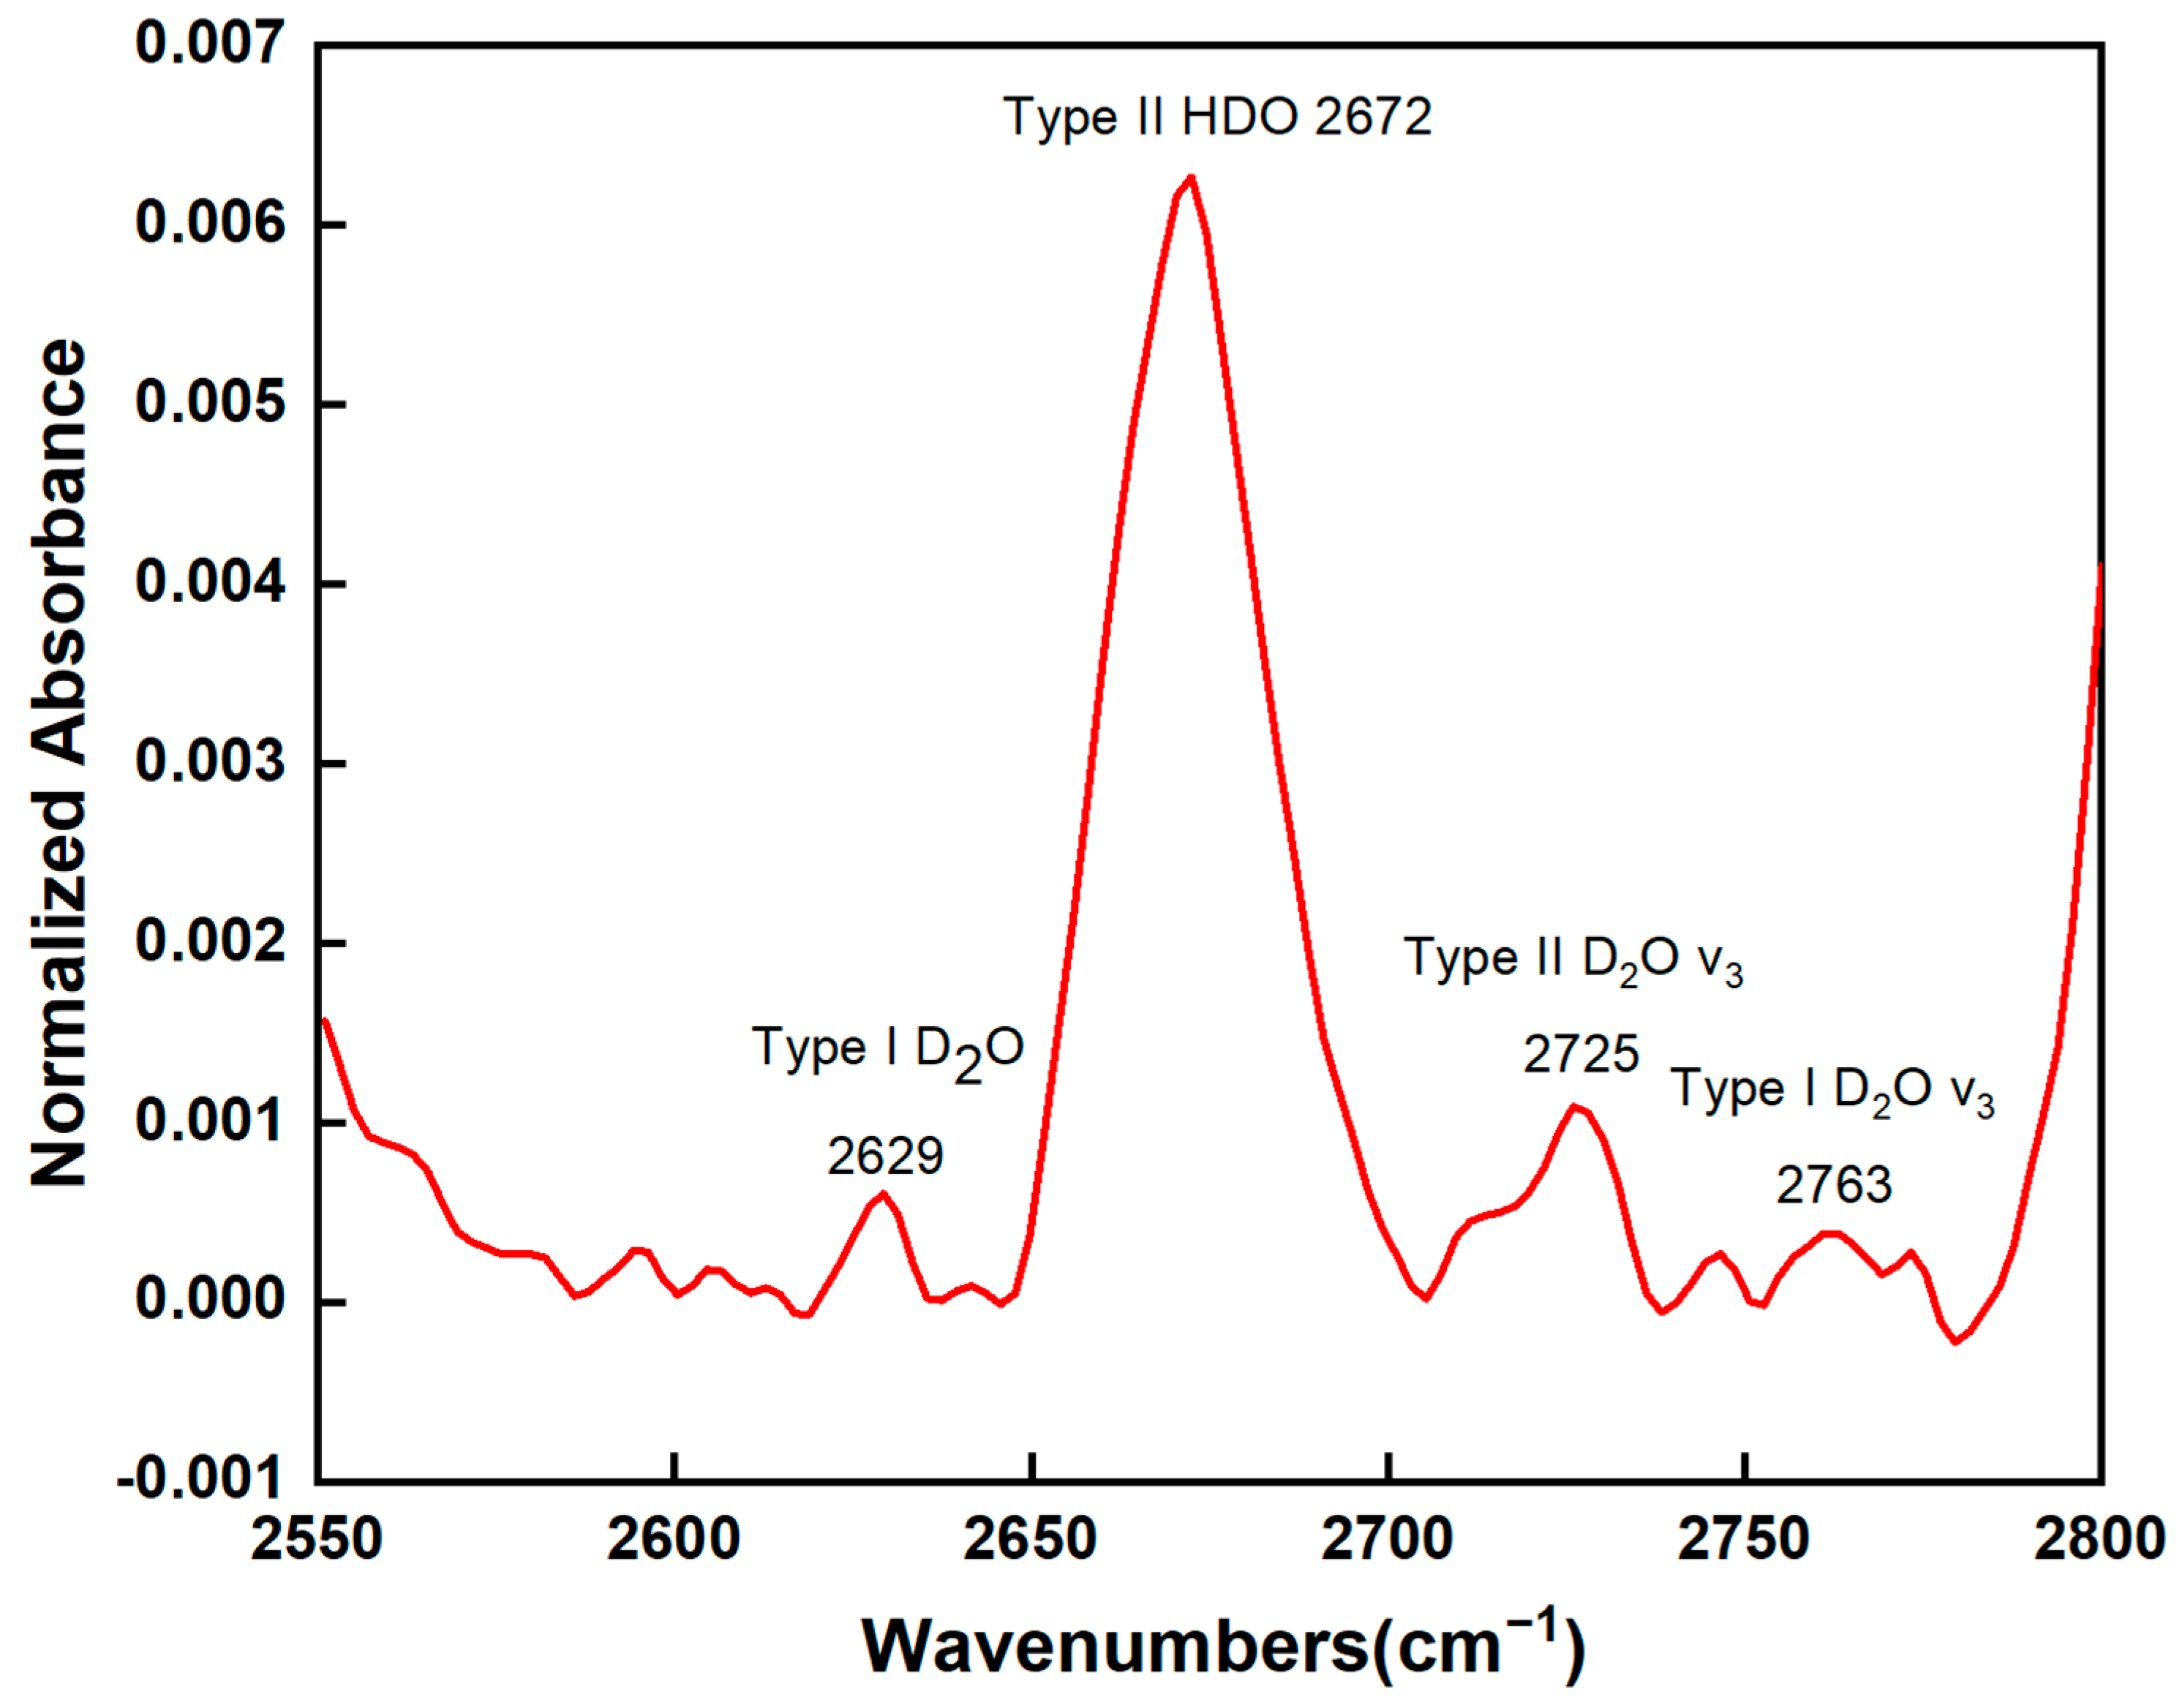
4.3.1. FTIR Spectroscopy
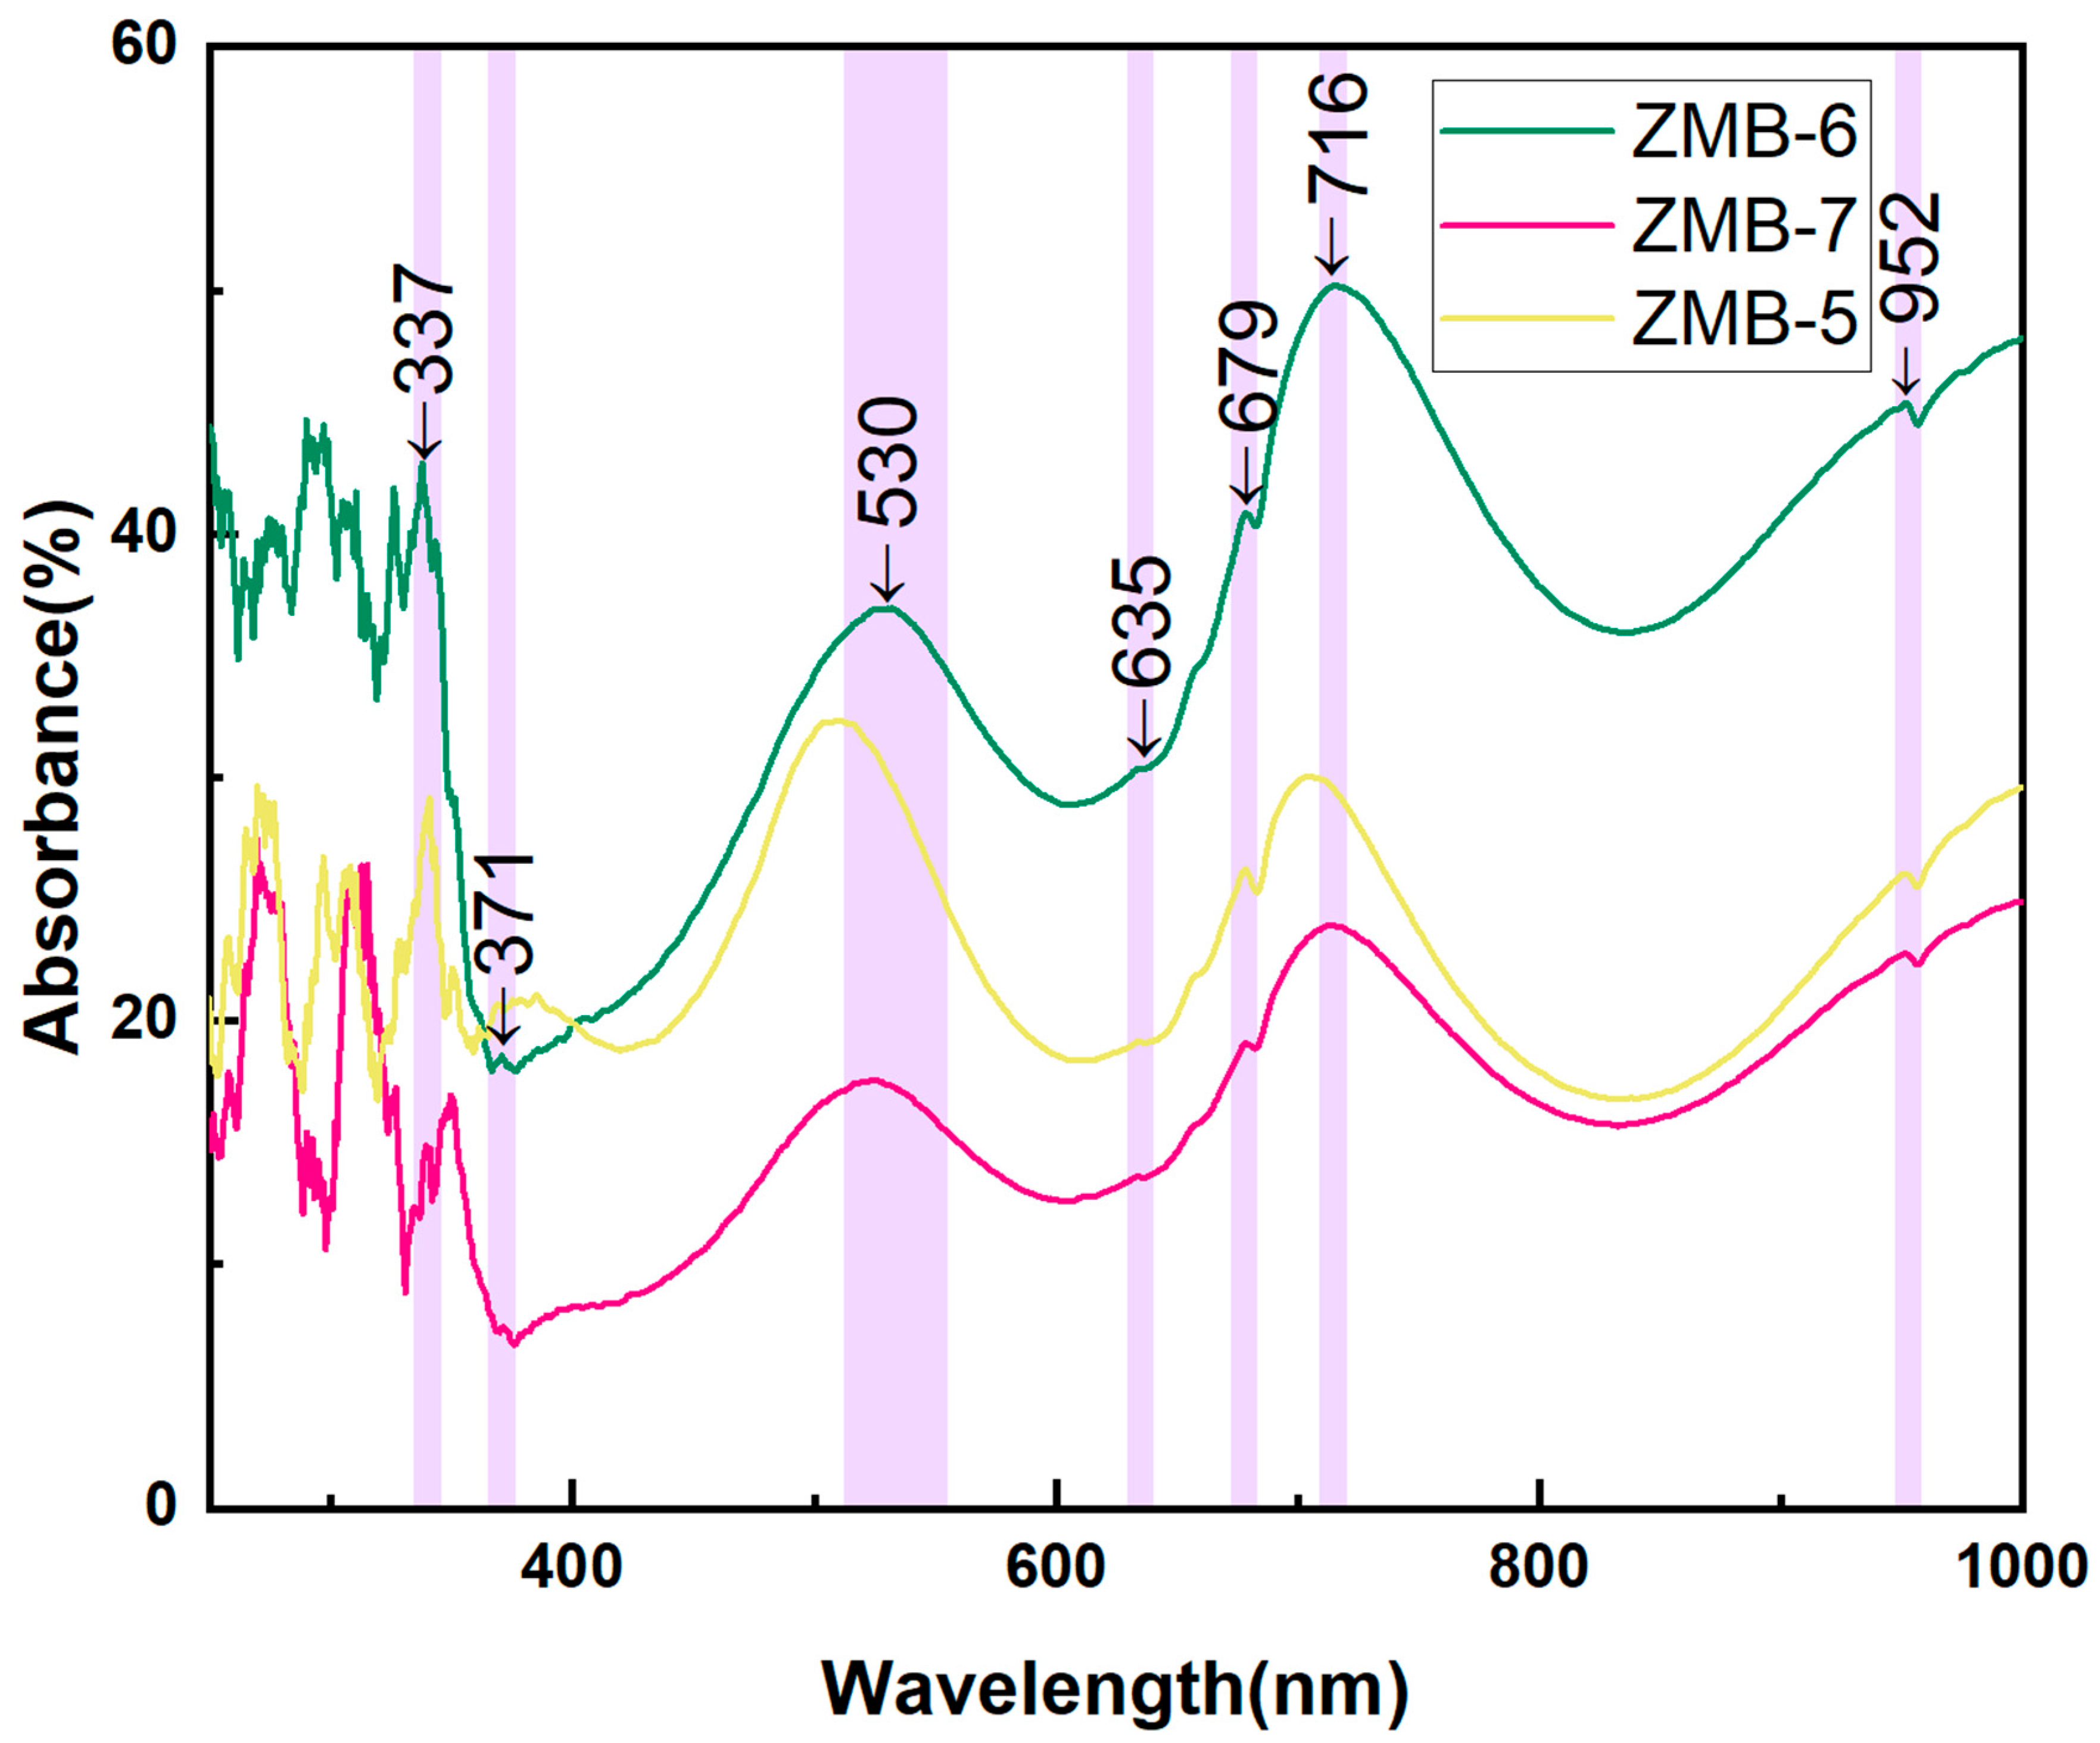
4.3.2. UV–Vis–NIR Spectroscopy
4.4. LA-ICP-MS Trace Element Analysis
5. Discussion
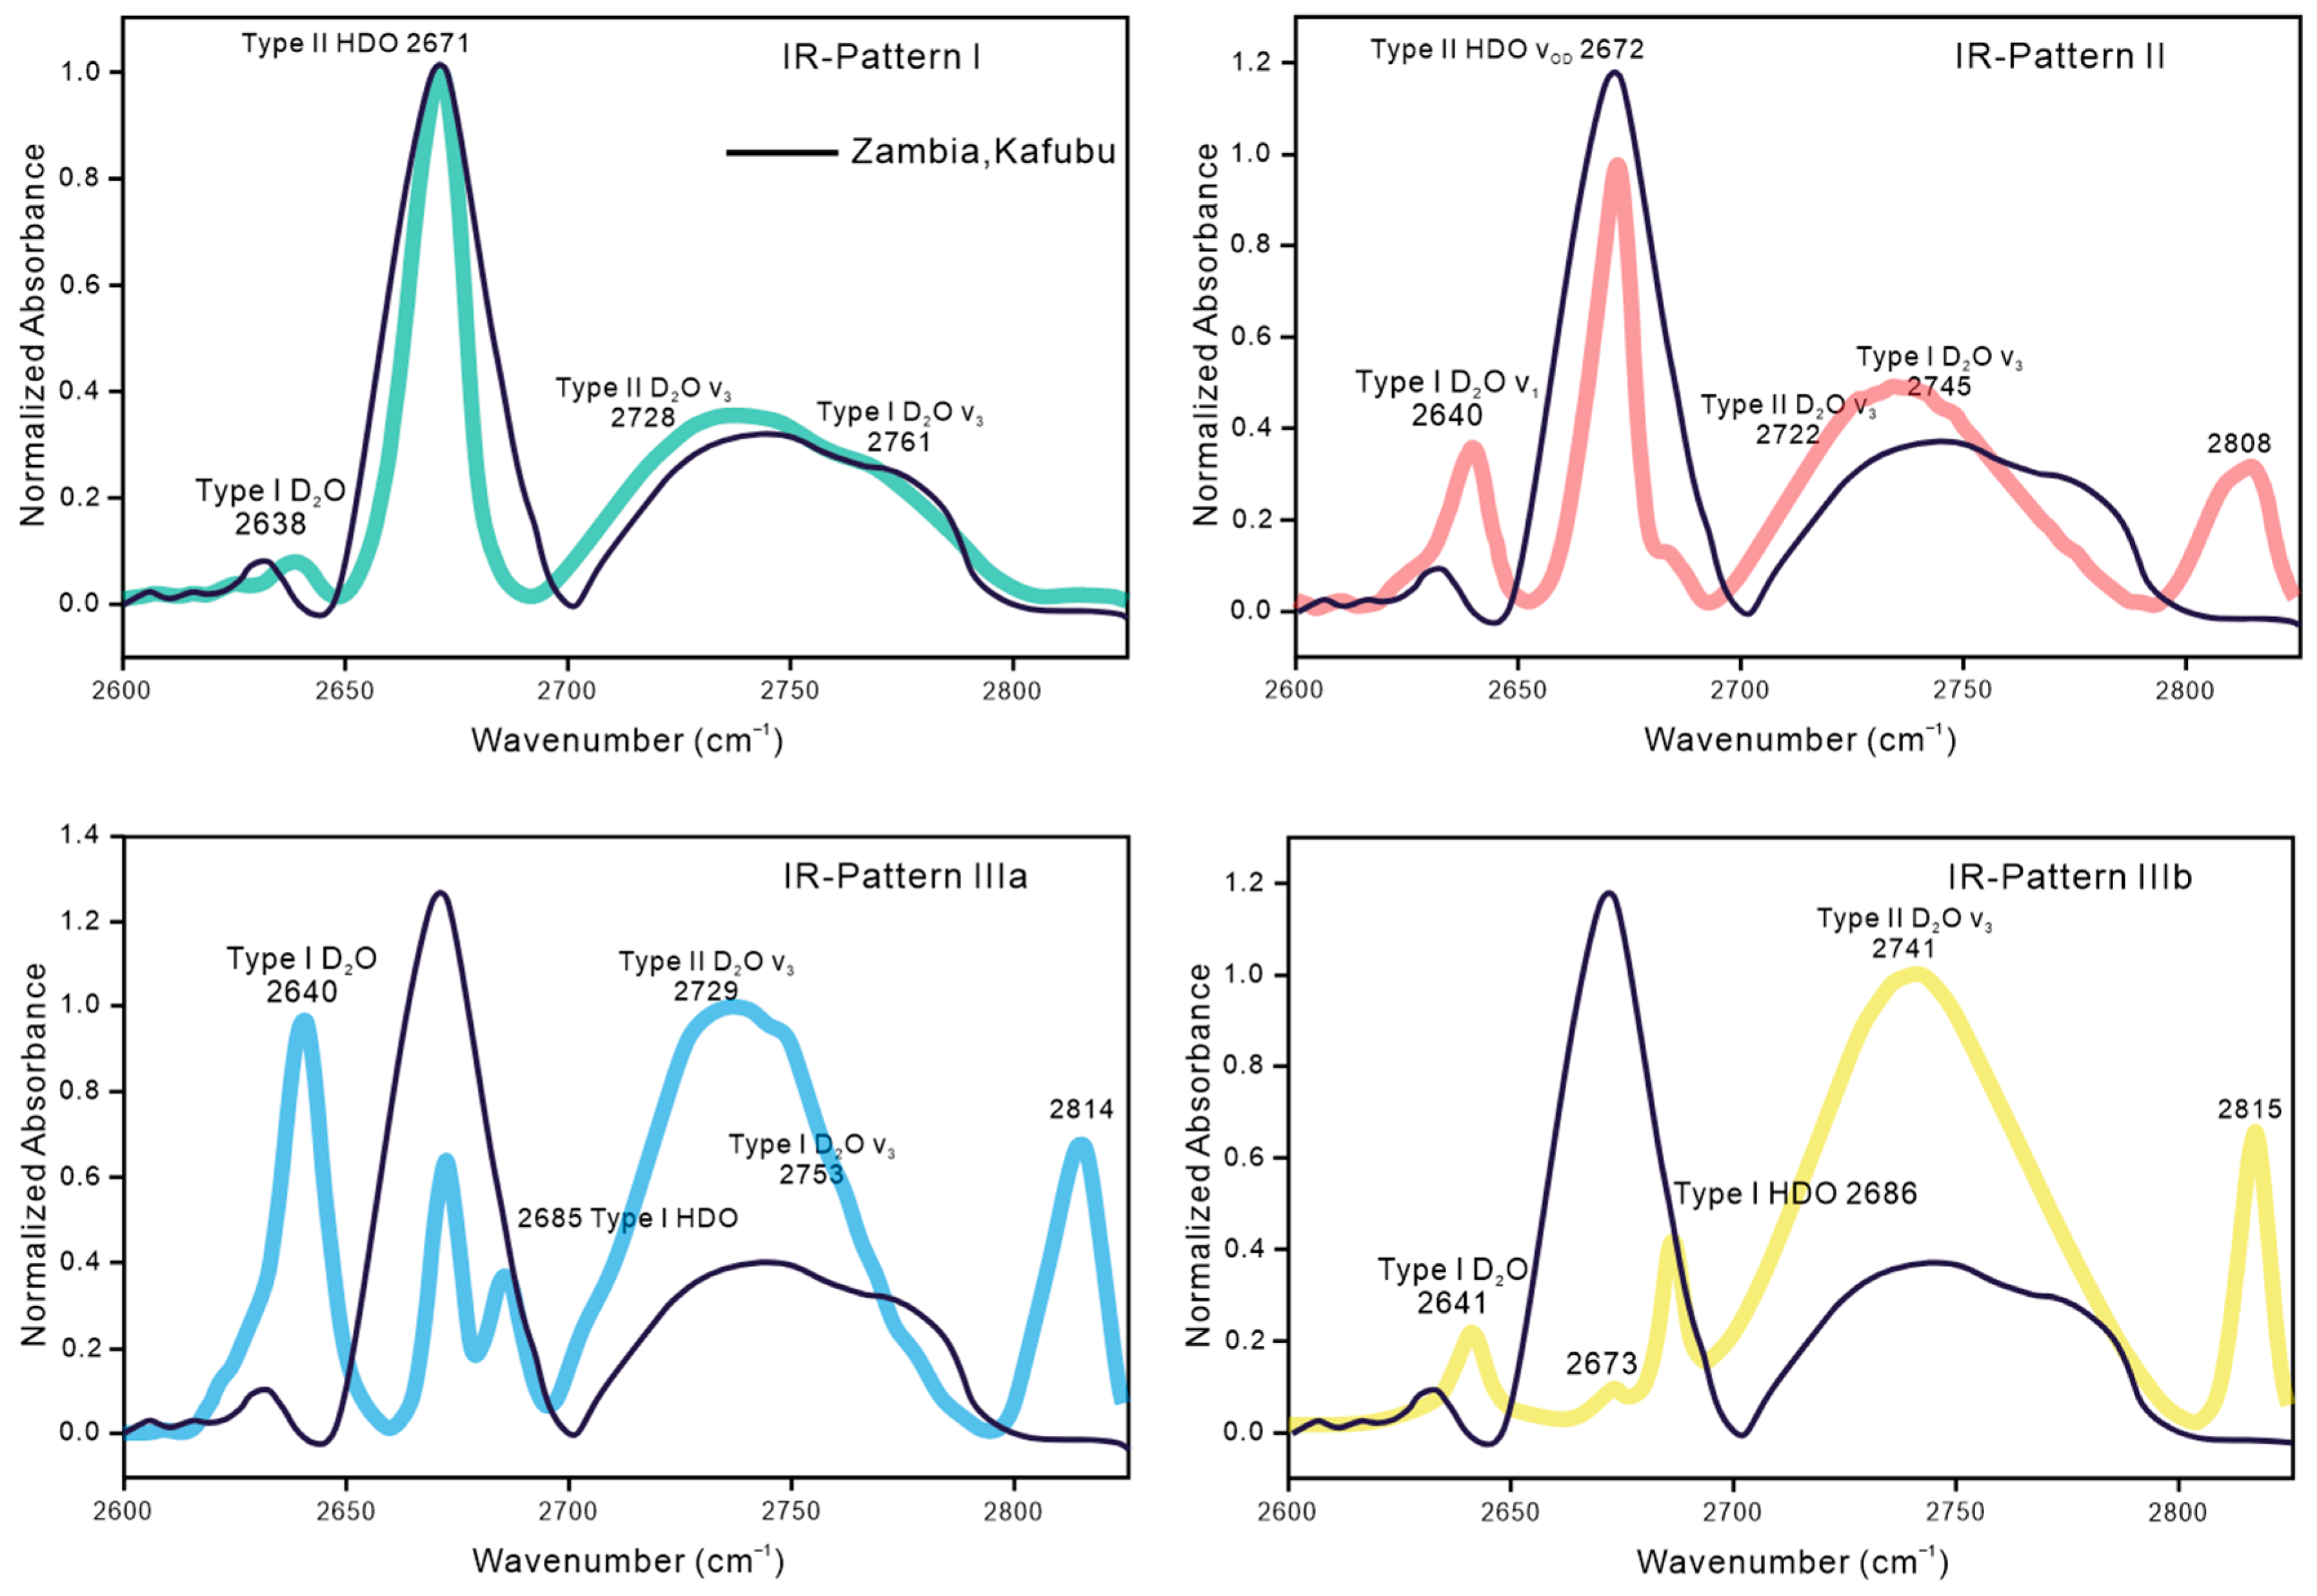
5.1. OD Vibration and Emerald Origin Determination
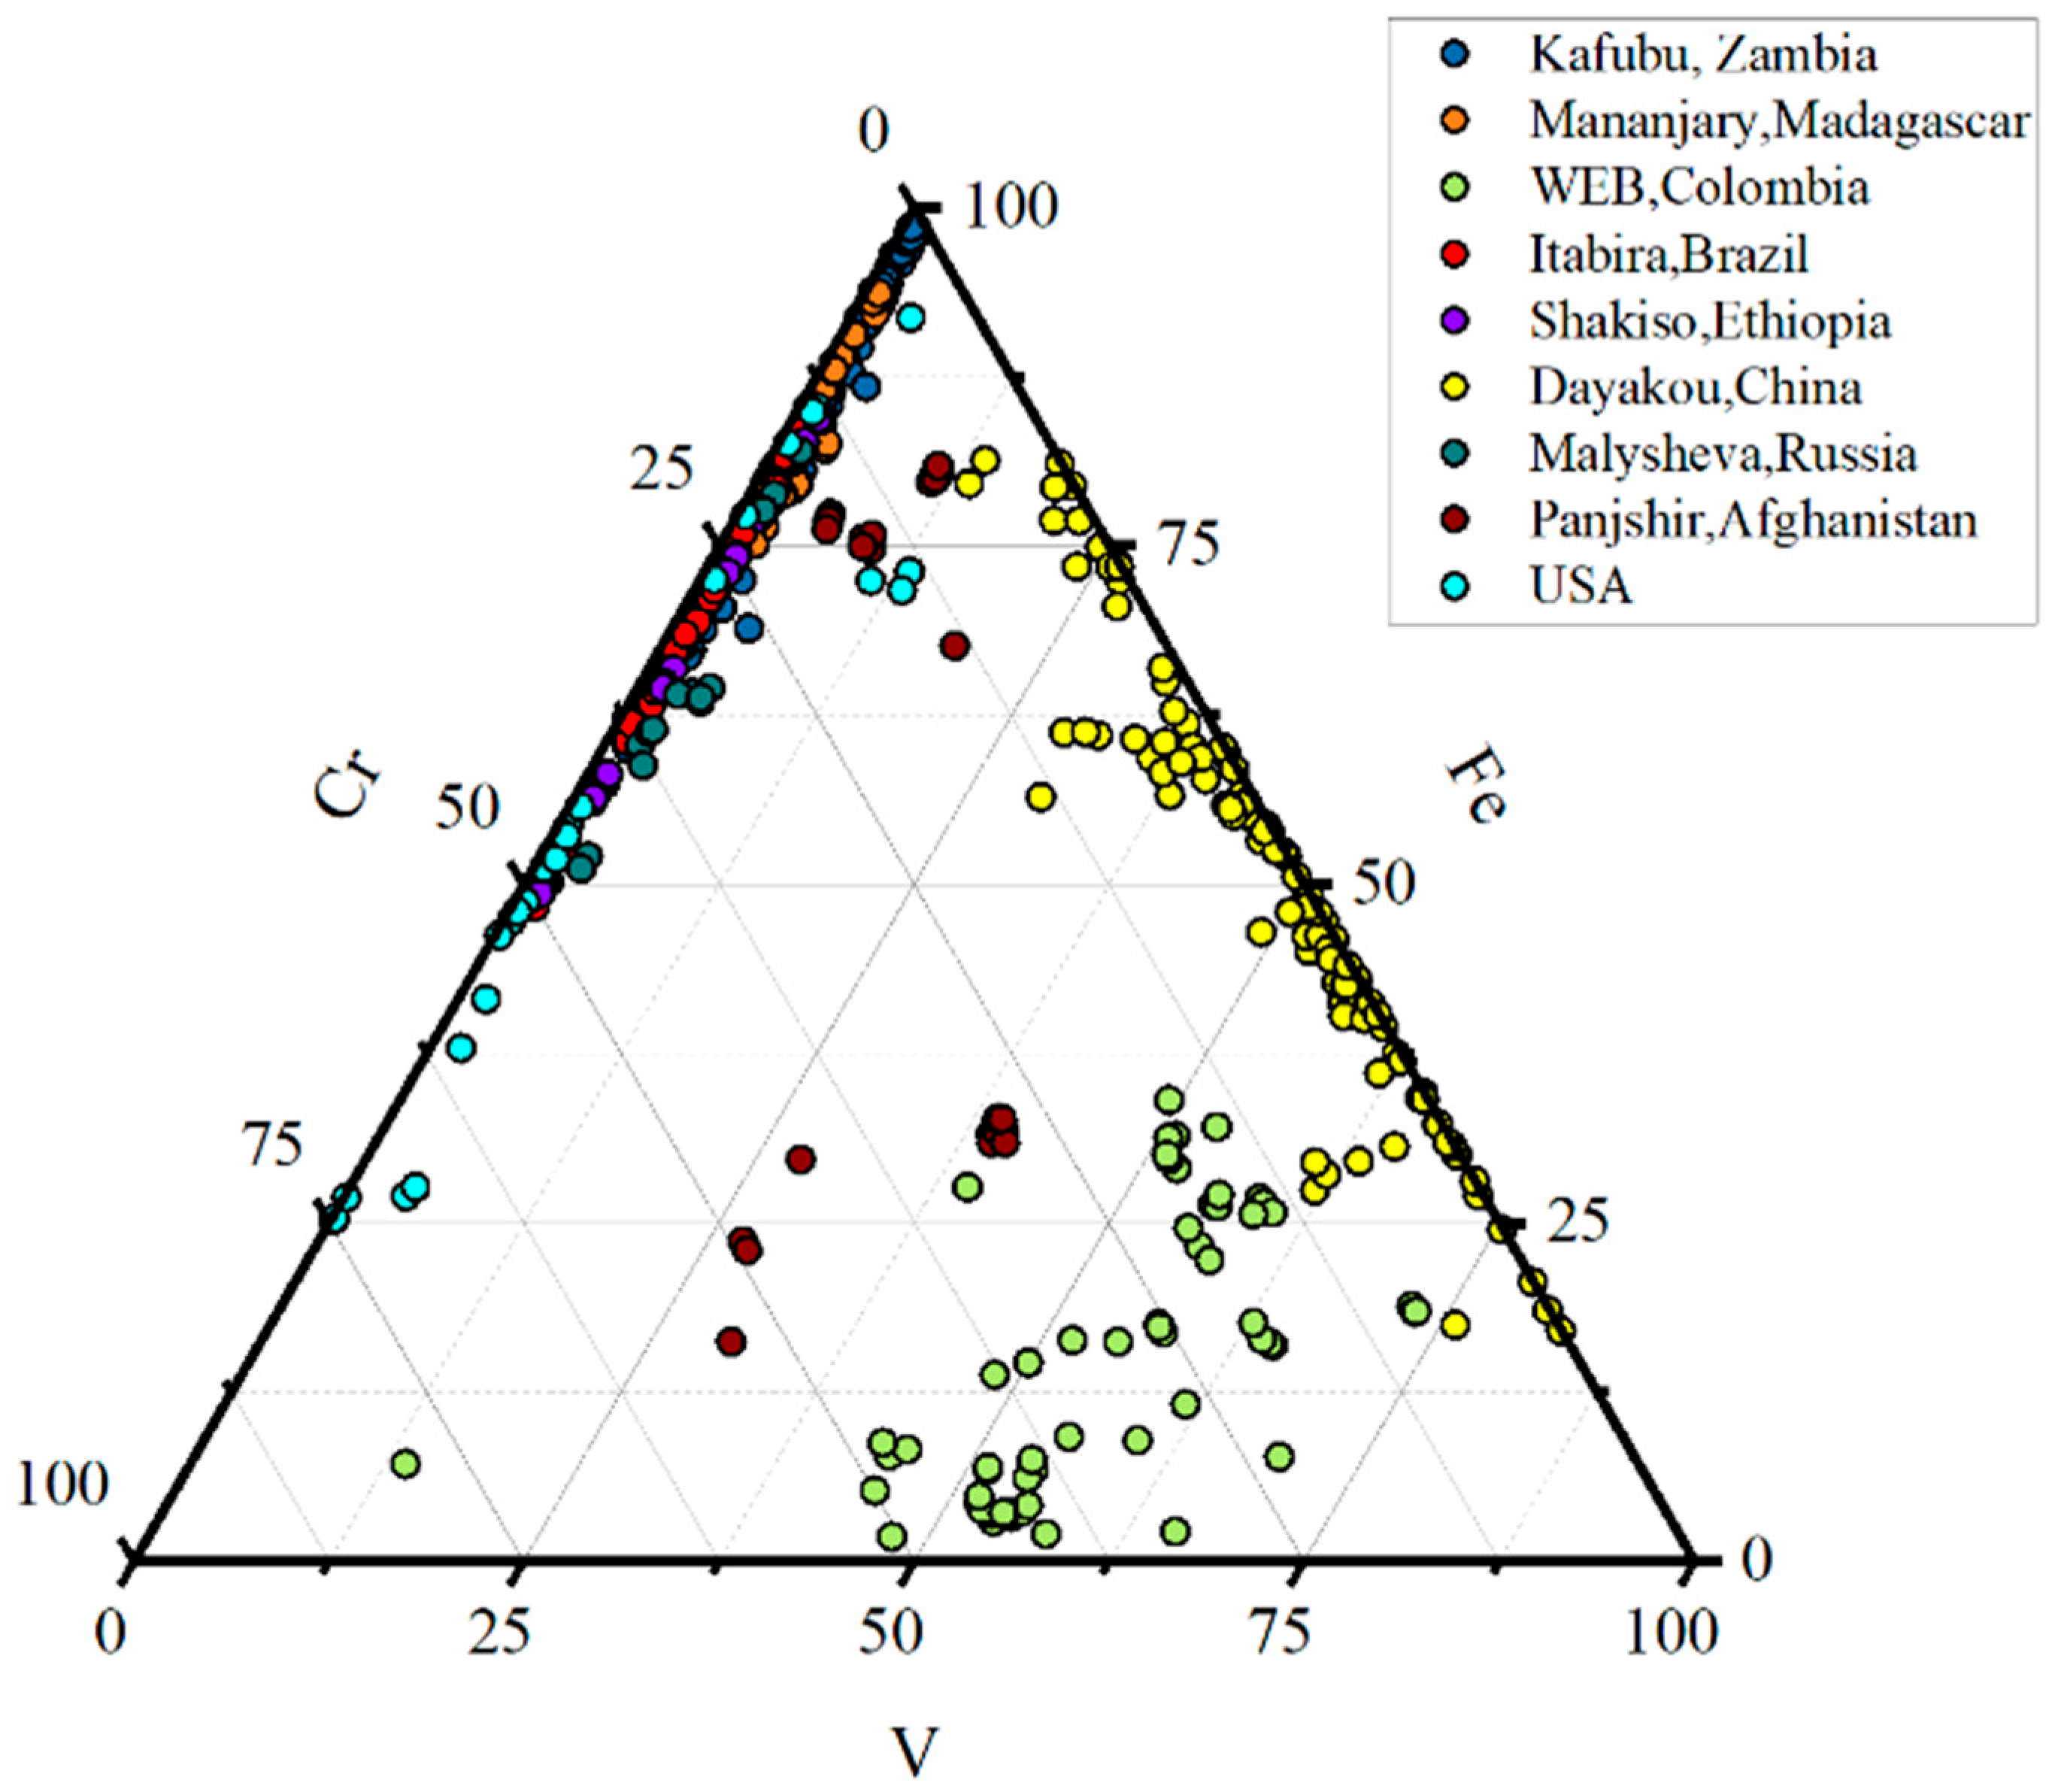
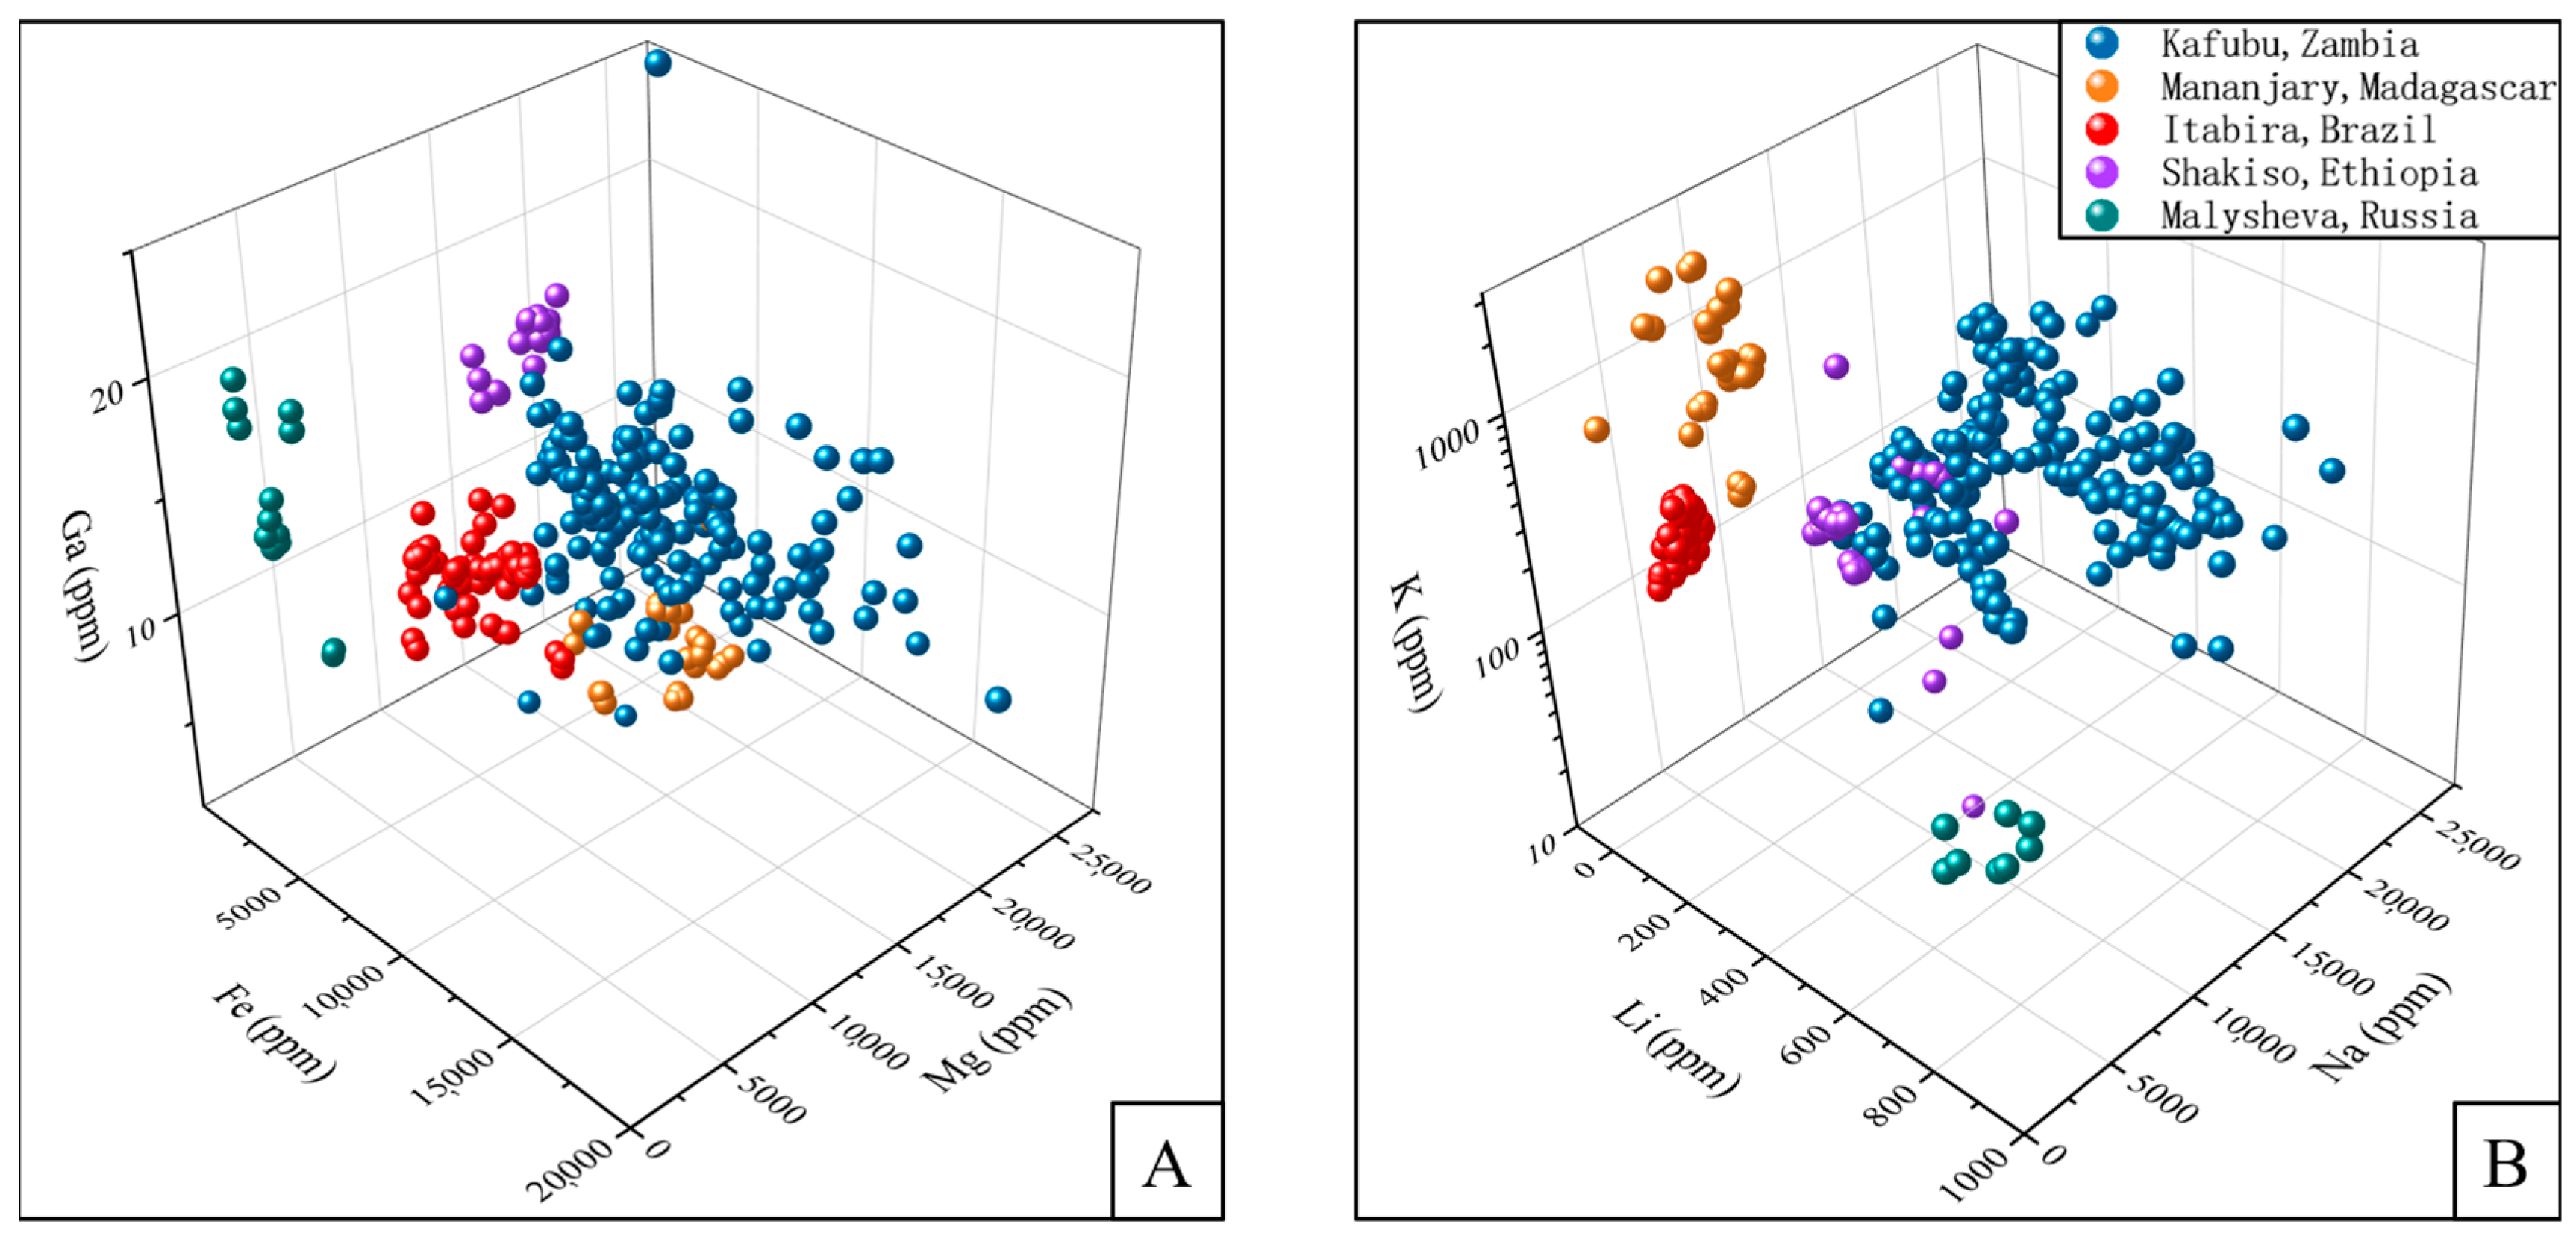
5.2. Compositional Diagrams and Emerald Origin Determination
6. Conclusions
Author Contributions
Funding
Data Availability Statement
Acknowledgments
Conflicts of Interest
Appendix A

| ZMB-1 | ZMB-2 | ZMB-3 | ZMB-4 | ZMB-5 | ZMB-6 | ZMB-7 | ZMB-8 | |
|---|---|---|---|---|---|---|---|---|
| Picture |  |  |  |  |  |  |  |  |
| Color | Green with a hint of yellow | Green | Green | Dark green | Turquoise | Green | Dark green | Green with a hint of yellow |
| Transparency | Transparent | Transparent | Transparent | Transparent | Transparent | Opaque | Opaque | Opaque |
| Polarizing filter | Four bright and four dark extinctions | Four bright and four dark extinctions | Four bright and four dark extinctions | Four bright and four dark extinctions | Four bright and four dark extinctions | Four bright and four dark extinctions | Four bright and four dark extinctions | Four bright and four dark extinctions |
| Bicoloroscope | Dichroism is moderate, blue/green | Strong dichroism, blue-green/yellow-green | Strong dichroism, blue/light green | Bicolorism is moderate, blue-green/light yellow-green. | Unpredictable | Unpredictable | Unpredictable | Weak dichroism, green/light yellowish green |
| Refractive index | 1.579–1.586 | 1.577–1.585 | 1.575–1.582 | 1.587–1.595 | Unpredictable | Unpredictable | unpredictable | 1.578–1.585 |
| Density (g/cm3) | 2.7346 | 2.7582 | 2.7344 | 2.7486 | 2.7366 | 2.8324 | 2.7652 | 2.7842 |
| Ultraviolet fluorescence | SW/LW: inertia | SW/LW: inertia | SW/LW: inertia | SW/LW: inertia | SW: inertia; LW: strong green fluorescence | SW: inertia; LW: strong green fluorescence | SW: inertia; LW: medium green fluorescence | SW/LW: inertia |
| Type of Deposit | Type IA | ||||
|---|---|---|---|---|---|
| Deposits | Zambia | Brazil | South Africa | Ethiopia | Zambia |
| Under a magnifying glass to observe | Colorless and transparent particles attached to the surface; a large number of two/three-phase inclusions and healed fractures inside; black inclusions (black tourmaline) | Negative crystals, forming CO2-rich two-phase inclusions; partially healed fissures with two-phase inclusions—typically square, rectangular, or comma-like; mineral inclusions: rounded crystals of sodic plagioclase, platelets of phlogopite, thin flakes of hematite, and clusters of minute grains of quartz | Common biotite, apatite and quartz, visible hematite, pyrite, pyrrhotite, zircon, molybdenite and galena, etc. | Tiny granular grains and iridescent films; the internal growth characteristics are usually straight, presenting prismatic color bands along the crystal prism faces; mineral inclusions: brown mica flakes, plagioclase, magnetite spinel, calcite, quartz, and talc | Fluid inclusions are usually massive or irregularly shaped multiphase inclusions; brown mica is a common inclusion, and appears as round or pseudo-hexagonal green flakes; oxide minerals such as magnetite, hematite or ilmenite makeup |
| Chelsea filter | Dark green | Pink to red (stones with saturated colors) or no reaction | Green | Green | Dark Green |
| Refractive index | 1.577–1.595 | no = 1.587–1.591; ne = 1.578–1.583 | 1.583–1.594 | no = 1.580–1.593; ne = 1.569–1.584 | no = 1.585–1.602; ne = 1.578–1.593 |
| SG | 2.73–2.83 | 2.65–2.74 | 2.75 | 2.68–2.76 | 2.71–2.81 |
| Ultraviolet fluorescence | SW: inertia; LW: inertia/medium-strong green fluorescence | Inertia | Inertia | Inertia | SW: inertia; LW: inertia/medium-strong green fluorescence |
| Data Source | this study | [14] | [31] | [31] | [5] |
| Type of Deposit | Type IIB | Type IIC | |||
| Deposits | USA | Colombia | Afghanistan | ||
| Under a magnifying glass to observe | Common serrated polyphase inclusions (containing one bubble, one large colorless cubic crystal); possibly with smaller groups of daughter crystals; mineral inclusions: feldspar, carbonate, quartz, dolomite, pyrite, black shale, etc. | Small serrated fluid inclusions; rare mineral inclusions: pyrite, limonite, beryl, carbonate minerals, and feldspar | |||
| Chelsea filter | Green | Pink to red (stones with saturated colors) or no reaction. | Pink to red | ||
| Refractive index | 1.581–1.588 | no = 1.571–1.579; ne = 1.565–1.578 | no = 1.577–1.590; ne = 1.570–1.582 | ||
| SG | 2.73 | 2.65–2.73 | 2.72–2.89 | ||
| Ultraviolet fluorescence | SW: medium green fluorescence; LW: inertia/medium-strong green fluorescence | Inertia | |||
| Data Source | [31] | [13,32,33] | [31] | ||
| Li | Be | Na2O | MgO | Al2O3 | SiO2 | K2O | Sc | TiO2 | V | Cr | MnO | FeO | Co | |
| 7 | 9 | 23 | 24 | 27 | 29 | 39 | 45 | 49 | 51 | 52 | 55 | 56 | 59 | |
| ppm | ppm | wt.% | wt.% | wt.% | wt.% | wt.% | ppm | wt.% | ppm | ppm | wt.% | wt.% | ppm | |
| ZMB-2-1 | 293 | 45674 | 1.81 | 2.28 | 15.0 | 67.2 | 0.039 | 50.2 | 0.0036 | 70.9 | 370 | 0.0019 | 0.79 | 3.53 |
| ZMB-2-2 | 257 | 48026 | 1.89 | 2.57 | 15.6 | 65.2 | 0.037 | 65.6 | 0.0043 | 99.9 | 1087 | 0.0007 | 0.97 | 1.71 |
| ZMB-2-3 | 276 | 47506 | 1.85 | 2.43 | 15.5 | 65.8 | 0.025 | 66.4 | 0.0045 | 94.3 | 1133 | 0.0020 | 0.89 | 1.70 |
| ZMB-2-4 | 235 | 46271 | 1.68 | 2.19 | 17.1 | 65.1 | 0.035 | 65.2 | 0.0022 | 88.3 | 956 | 0.0019 | 0.80 | 1.70 |
| ZMB-2-5 | 490 | 46083 | 1.50 | 1.79 | 17.0 | 65.6 | 0.028 | 79.4 | 0.0052 | 63.5 | 44.0 | 0.0000 | 0.81 | 3.23 |
| ZMB-2-6 | 363 | 48239 | 1.86 | 2.35 | 15.7 | 65.5 | 0.018 | 57.3 | 0.0056 | 88.3 | 1090 | 0.0027 | 0.78 | 2.75 |
| ZMB-2-7 | 269 | 49378 | 1.87 | 2.47 | 15.5 | 65.3 | 0.033 | 70.7 | 0.0032 | 102 | 1083 | 0.0021 | 0.88 | 1.10 |
| ZMB-2-8 | 320 | 46786 | 1.81 | 2.27 | 16.9 | 64.8 | 0.036 | 73.7 | 0.0037 | 94.1 | 932 | 0.0015 | 0.81 | 1.94 |
| ZMB-2-9 | 402 | 47373 | 1.73 | 2.24 | 15.8 | 65.9 | 0.039 | 40.8 | 0.0036 | 64.3 | 43.2 | 0.0026 | 0.89 | 2.20 |
| ZMB-2-10 | 245 | 46898 | 1.65 | 2.13 | 16.0 | 66.2 | 0.042 | 53.4 | 0.0043 | 81.4 | 443 | 0.0027 | 0.72 | 2.39 |
| ZMB-4-1 | 341 | 45708 | 1.63 | 2.19 | 16.7 | 65.3 | 0.040 | 65.9 | 0.0038 | 52.1 | 93.1 | 0.0008 | 1.15 | 4.64 |
| ZMB-4-2 | 412 | 46106 | 1.64 | 2.39 | 16.4 | 65.0 | 0.046 | 23.3 | 0.0039 | 86.9 | 134 | 0.0015 | 1.39 | 3.75 |
| ZMB-4-3 | 240 | 46297 | 1.84 | 2.50 | 16.2 | 64.8 | 0.046 | 34.8 | 0.0042 | 88.5 | 342 | 0.0010 | 1.46 | 4.93 |
| ZMB-4-4 | 246 | 46856 | 1.84 | 2.48 | 15.1 | 65.7 | 0.042 | 33.2 | 0.0040 | 103 | 285 | 0.0016 | 1.48 | 3.92 |
| ZMB-4-5 | 256 | 45760 | 1.72 | 2.23 | 16.7 | 65.1 | 0.044 | 61.3 | 0.0035 | 58.4 | 111 | 0.0013 | 1.23 | 5.52 |
| ZMB-4-6 | 275 | 45806 | 1.65 | 2.09 | 15.5 | 66.6 | 0.039 | 54.1 | 0.0015 | 54.5 | 80.4 | 0.0023 | 1.16 | 4.72 |
| ZMB-4-7 | 290 | 45139 | 1.74 | 2.35 | 15.8 | 65.7 | 0.051 | 31.0 | 0.0047 | 94.2 | 202 | 0.0018 | 1.48 | 4.75 |
| ZMB-4-8 | 321 | 47841 | 1.97 | 2.63 | 15.2 | 65.5 | 0.028 | 20.0 | 0.0049 | 80.8 | 132 | 0.0000 | 1.10 | 3.97 |
| ZMB-4-9 | 289 | 46412 | 1.91 | 2.60 | 15.6 | 65.7 | 0.032 | 23.6 | 0.0031 | 79.2 | 116 | 0.0004 | 1.09 | 2.08 |
| ZMB-4-10 | 302 | 44518 | 1.61 | 2.16 | 15.4 | 66.9 | 0.038 | 63.1 | 0.0033 | 54.6 | 93.5 | 0.0020 | 1.22 | 5.05 |
| ZMB-8-1 | 280 | 45402 | 1.45 | 1.62 | 17.5 | 65.3 | 0.019 | 133 | 0.0029 | 70.9 | 628 | 0.0032 | 1.17 | 3.83 |
| ZMB-8-2 | 312 | 45919 | 1.42 | 1.60 | 17.5 | 65.4 | 0.019 | 134 | 0.0049 | 68.8 | 622 | 0.0016 | 1.10 | 3.58 |
| ZMB-8-3 | 321 | 45950 | 1.32 | 1.59 | 17.8 | 65.2 | 0.025 | 111 | 0.0045 | 71.4 | 583 | 0.0012 | 1.01 | 5.00 |
| ZMB-8-4 | 241 | 45509 | 1.33 | 1.48 | 16.7 | 66.6 | 0.032 | 126 | 0.0038 | 64.1 | 376 | 0.0011 | 1.02 | 3.36 |
| ZMB-8-5 | 410 | 47834 | 0.99 | 1.07 | 17.0 | 66.7 | 0.0077 | 39.0 | 0.0043 | 30.0 | 352 | 0.0028 | 0.74 | 2.71 |
| ZMB-8-6 | 321 | 45703 | 1.34 | 1.59 | 17.8 | 65.2 | 0.030 | 135 | 0.0048 | 70.6 | 447 | 0.0011 | 1.09 | 4.44 |
| ZMB-8-7 | 294 | 44903 | 1.32 | 1.48 | 17.5 | 65.8 | 0.026 | 122 | 0.0044 | 66.6 | 655 | 0.0026 | 1.09 | 3.39 |
| ZMB-8-8 | 217 | 45825 | 1.40 | 1.57 | 17.4 | 65.5 | 0.022 | 129 | 0.0048 | 72.1 | 610 | 0.0016 | 1.14 | 3.38 |
| ZMB-8-9 | 349 | 46775 | 1.26 | 1.47 | 18.2 | 64.8 | 0.014 | 117 | 0.0058 | 65.3 | 473 | 0.0025 | 1.00 | 4.46 |
| ZMB-8-10 | 297 | 46047 | 1.42 | 1.59 | 17.7 | 65.0 | 0.026 | 135 | 0.0035 | 71.9 | 600 | 0.0036 | 1.17 | 3.78 |
| Ni | Cu | Zn | Ga | Rb | Sr | Y | Sn | Cs | Ba | La | Ce | Pr | Nd | |
| 60 | 63 | 66 | 71 | 85 | 88 | 89 | 118 | 133 | 137 | 139 | 140 | 141 | 146 | |
| ppm | ppm | ppm | ppm | ppm | ppm | ppm | ppm | ppm | ppm | ppm | ppm | ppm | ppm | |
| ZMB-2-1 | 17.2 | 0.0000 | 16.7 | 9.95 | 38.5 | 0.0000 | 0.0000 | 1.40 | 631 | 0.0000 | 0.0000 | 0.0000 | 0.050 | 0.0000 |
| ZMB-2-2 | 31.1 | 1.87 | 22.6 | 12.2 | 45.3 | 0.25 | 0.10 | 0.0000 | 811 | 0.62 | 0.0000 | 0.0000 | 0.0000 | 0.0000 |
| ZMB-2-3 | 0.0000 | 6.19 | 9.76 | 11.0 | 30.7 | 0.20 | 0.0000 | 4.13 | 443 | 0.0000 | 0.0000 | 0.0000 | 0.0000 | 0.0000 |
| ZMB-2-4 | 23.9 | 0.90 | 9.56 | 9.33 | 29.0 | 0.036 | 0.0000 | 0.62 | 469 | 0.0000 | 0.021 | 0.0000 | 0.069 | 0.0000 |
| ZMB-2-5 | 31.2 | 1.41 | 18.0 | 14.9 | 73.0 | 0.0000 | 0.0000 | 1.54 | 2872 | 0.22 | 0.0000 | 0.053 | 0.0000 | 0.0000 |
| ZMB-2-6 | 36.3 | 0.0000 | 25.0 | 1.08 | 29.9 | 0.0000 | 0.0000 | 0.65 | 432 | 0.0000 | 0.26 | 0.0000 | 0.0000 | 0.0000 |
| ZMB-2-7 | 0.0000 | 0.0000 | 18.4 | 7.93 | 28.0 | 0.0000 | 0.0000 | 0.0000 | 344 | 1.76 | 0.0000 | 0.0000 | 0.0000 | 0.0000 |
| ZMB-2-8 | 10.1 | 1.88 | 6.25 | 6.75 | 27.4 | 0.0000 | 0.077 | 0.0000 | 671 | 0.16 | 0.0000 | 0.0000 | 0.0000 | 0.0000 |
| ZMB-2-9 | 0.0000 | 0.0000 | 34.2 | 12.0 | 52.2 | 0.0000 | 0.043 | 0.32 | 964 | 0.0000 | 0.0000 | 0.0000 | 0.0000 | 0.0000 |
| ZMB-2-10 | 2.07 | 1.79 | 17.8 | 6.70 | 20.2 | 0.051 | 0.0000 | 0.0000 | 383 | 0.25 | 0.0000 | 0.0000 | 0.0000 | 0.28 |
| ZMB-4-1 | 7.19 | 1.26 | 23.0 | 11.6 | 42.1 | 0.0000 | 0.0000 | 0.73 | 1498 | 0.0000 | 0.012 | 0.0000 | 0.0094 | 0.054 |
| ZMB-4-2 | 0.0000 | 0.0000 | 9.83 | 9.84 | 40.8 | 0.0000 | 0.038 | 0.28 | 1455 | 0.0000 | 0.0000 | 0.014 | 0.0000 | 0.0000 |
| ZMB-4-3 | 7.97 | 0.0000 | 20.9 | 8.99 | 39.9 | 0.022 | 0.0000 | 0.066 | 1503 | 0.0000 | 0.0000 | 0.0000 | 0.0000 | 0.062 |
| ZMB-4-4 | 0.0000 | 0.0000 | 23.7 | 10.3 | 40.6 | 0.0000 | 0.036 | 0.37 | 1568 | 0.0000 | 0.027 | 0.052 | 0.0000 | 0.25 |
| ZMB-4-5 | 0.0000 | 0.24 | 12.1 | 12.2 | 43.7 | 0.030 | 0.024 | 0.0000 | 1406 | 0.0000 | 0.0000 | 0.0000 | 0.0000 | 0.084 |
| ZMB-4-6 | 0.0000 | 1.90 | 15.7 | 12.2 | 45.3 | 0.0000 | 0.0000 | 0.14 | 1368 | 0.0000 | 0.0000 | 0.027 | 0.0000 | 0.0000 |
| ZMB-4-7 | 7.73 | 0.0000 | 18.1 | 8.76 | 40.3 | 0.0096 | 0.023 | 0.41 | 1522 | 0.0000 | 0.0000 | 0.017 | 0.014 | 0.0000 |
| ZMB-4-8 | 13.8 | 0.0000 | 14.6 | 8.92 | 41.3 | 0.051 | 0.0000 | 2.50 | 958 | 0.25 | 0.0000 | 0.0000 | 0.0000 | 0.0000 |
| ZMB-4-9 | 0.0000 | 0.40 | 7.62 | 10.7 | 39.6 | 0.0000 | 0.0000 | 2.79 | 1014 | 0.0000 | 0.0000 | 0.0000 | 0.024 | 0.0000 |
| ZMB-4-10 | 1.51 | 0.0000 | 11.7 | 14.0 | 44.2 | 0.0000 | 0.0000 | 0.18 | 1395 | 0.0000 | 0.0000 | 0.0000 | 0.0000 | 0.0000 |
| ZMB-8-1 | 8.67 | 0.58 | 36.3 | 15.4 | 30.1 | 0.043 | 0.035 | 0.0000 | 675 | 0.0000 | 0.0000 | 0.0000 | 0.0000 | 0.0000 |
| ZMB-8-2 | 2.80 | 5.22 | 34.5 | 18.1 | 28.9 | 0.0000 | 0.0000 | 0.31 | 684 | 0.0000 | 0.0000 | 0.024 | 0.0000 | 0.23 |
| ZMB-8-3 | 0.0000 | 0.0000 | 26.9 | 16.2 | 25.6 | 0.0000 | 0.0000 | 0.0000 | 603 | 0.0000 | 0.0000 | 0.017 | 0.0000 | 0.0000 |
| ZMB-8-4 | 0.0000 | 0.0000 | 32.5 | 13.4 | 22.5 | 0.0000 | 0.0000 | 0.0000 | 647 | 0.0000 | 0.0000 | 0.0000 | 0.0000 | 0.0000 |
| ZMB-8-5 | 18.3 | 2.25 | 50.8 | 10.7 | 18.2 | 0.066 | 0.054 | 1.93 | 409 | 0.0000 | 0.0000 | 0.0000 | 0.0000 | 0.37 |
| ZMB-8-6 | 10.2 | 0.0000 | 36.4 | 15.7 | 26.8 | 0.038 | 0.0000 | 0.0000 | 684 | 0.0000 | 0.0000 | 0.022 | 0.0000 | 0.0000 |
| ZMB-8-7 | 9.71 | 0.15 | 30.9 | 12.4 | 28.2 | 0.13 | 0.081 | 1.45 | 628 | 0.0000 | 0.0000 | 0.020 | 0.0000 | 0.0000 |
| ZMB-8-8 | 2.41 | 0.0000 | 29.8 | 16.0 | 25.9 | 0.0000 | 0.0000 | 0.0000 | 678 | 0.15 | 0.0000 | 0.0000 | 0.015 | 0.34 |
| ZMB-8-9 | 14.4 | 0.0000 | 25.2 | 16.0 | 24.8 | 0.0000 | 0.0000 | 0.92 | 652 | 0.0000 | 0.0000 | 0.0000 | 0.0000 | 0.0000 |
| ZMB-8-10 | 10.9 | 0.0000 | 35.3 | 15.1 | 30.5 | 0.033 | 0.0000 | 0.0000 | 699 | 0.0000 | 0.0000 | 0.038 | 0.0000 | 0.091 |
| Sm | Eu | Gd | Tb | Dy | Ho | Er | Tm | Yb | Lu | Hf | Ta | W | Pb | |
| 147 | 153 | 157 | 159 | 163 | 165 | 166 | 169 | 172 | 175 | 178 | 181 | 182 | 204 | |
| ppm | ppm | ppm | ppm | ppm | ppm | ppm | ppm | ppm | ppm | ppm | ppm | ppm | ppm | |
| ZMB-2-1 | 0.33 | 0.088 | 0.89 | 0.0000 | 0.35 | 0.0000 | 0.0000 | 0.0000 | 0.20 | 0.0000 | 0.14 | 0.0000 | 0.063 | 0.0000 |
| ZMB-2-2 | 0.40 | 0.0000 | 0.36 | 0.0000 | 0.0000 | 0.0000 | 0.15 | 0.0000 | 0.0000 | 0.10 | 0.0000 | 0.053 | 0.0000 | 0.0000 |
| ZMB-2-3 | 0.32 | 0.0000 | 0.28 | 0.0000 | 0.0000 | 0.0000 | 0.0000 | 0.0000 | 0.37 | 0.082 | 0.27 | 0.0000 | 0.18 | 0.0000 |
| ZMB-2-4 | 0.0000 | 0.0000 | 0.10 | 0.0000 | 0.0000 | 0.0000 | 0.044 | 0.014 | 0.20 | 0.060 | 0.0000 | 0.0000 | 0.0000 | 4.06 |
| ZMB-2-5 | 0.0000 | 0.0000 | 0.0000 | 0.020 | 0.0000 | 0.020 | 0.11 | 0.018 | 0.0000 | 0.019 | 0.0000 | 0.0000 | 0.0000 | 0.0000 |
| ZMB-2-6 | 0.0000 | 0.0000 | 0.0000 | 0.0000 | 0.0000 | 0.0000 | 0.0000 | 0.0000 | 0.21 | 0.0000 | 0.15 | 0.0000 | 0.20 | 4.67 |
| ZMB-2-7 | 0.0000 | 0.0000 | 0.0000 | 0.051 | 0.20 | 0.0000 | 0.0000 | 0.048 | 0.075 | 0.017 | 0.0000 | 0.0000 | 0.22 | 4.49 |
| ZMB-2-8 | 0.0000 | 0.0000 | 0.0000 | 0.0000 | 0.0000 | 0.0000 | 0.0000 | 0.0000 | 0.0000 | 0.026 | 0.0000 | 0.013 | 0.0000 | 0.16 |
| ZMB-2-9 | 0.0000 | 0.090 | 0.0000 | 0.0000 | 0.0000 | 0.0000 | 0.0000 | 0.0000 | 0.0000 | 0.0073 | 0.15 | 0.0000 | 0.0000 | 2.52 |
| ZMB-2-10 | 0.0000 | 0.0000 | 0.0000 | 0.022 | 0.087 | 0.0000 | 0.0000 | 0.041 | 0.0000 | 0.042 | 0.0000 | 0.0000 | 0.093 | 1.79 |
| ZMB-4-1 | 0.062 | 0.033 | 0.055 | 0.0000 | 0.0000 | 0.0000 | 0.0000 | 0.0000 | 0.037 | 0.033 | 0.054 | 0.0000 | 0.0000 | 0.0000 |
| ZMB-4-2 | 0.076 | 0.0000 | 0.067 | 0.0000 | 0.0000 | 0.0000 | 0.0000 | 0.0000 | 0.13 | 0.0099 | 0.033 | 0.0000 | 0.043 | 1.07 |
| ZMB-4-3 | 0.0000 | 0.0000 | 0.064 | 0.0096 | 0.0000 | 0.0000 | 0.055 | 0.0000 | 0.17 | 0.0093 | 0.0000 | 0.0000 | 0.0000 | 0.0000 |
| ZMB-4-4 | 0.0000 | 0.0000 | 0.0000 | 0.0000 | 0.0000 | 0.019 | 0.17 | 0.0000 | 0.085 | 0.019 | 0.062 | 0.038 | 0.0000 | 0.0000 |
| ZMB-4-5 | 0.0000 | 0.0000 | 0.0000 | 0.0000 | 0.0000 | 0.0000 | 0.0000 | 0.0000 | 0.0000 | 0.025 | 0.0000 | 0.0000 | 0.056 | 0.0000 |
| ZMB-4-6 | 0.15 | 0.0000 | 0.0000 | 0.0000 | 0.16 | 0.0000 | 0.0000 | 0.038 | 0.27 | 0.0000 | 0.0000 | 0.020 | 0.0000 | 0.94 |
| ZMB-4-7 | 0.0000 | 0.025 | 0.083 | 0.0000 | 0.0000 | 0.0000 | 0.0000 | 0.0000 | 0.0000 | 0.024 | 0.0000 | 0.0000 | 0.0000 | 0.51 |
| ZMB-4-8 | 0.0000 | 0.0000 | 0.0000 | 0.0000 | 0.088 | 0.0000 | 0.0000 | 0.0000 | 0.097 | 0.0000 | 0.0000 | 0.022 | 0.28 | 0.0000 |
| ZMB-4-9 | 0.16 | 0.0000 | 0.0000 | 0.022 | 0.086 | 0.0000 | 0.062 | 0.0000 | 0.095 | 0.042 | 0.069 | 0.0000 | 0.18 | 4.05 |
| ZMB-4-10 | 0.13 | 0.034 | 0.0000 | 0.0000 | 0.069 | 0.017 | 0.0000 | 0.0000 | 0.076 | 0.017 | 0.055 | 0.017 | 0.0000 | 4.14 |
| ZMB-8-1 | 0.0000 | 0.0000 | 0.0000 | 0.0000 | 0.037 | 0.0093 | 0.0000 | 0.017 | 0.041 | 0.0090 | 0.030 | 0.0000 | 0.0000 | 0.0000 |
| ZMB-8-2 | 0.13 | 0.036 | 0.12 | 0.0000 | 0.0000 | 0.018 | 0.052 | 0.0000 | 0.080 | 0.018 | 0.0000 | 0.0000 | 0.23 | 0.0000 |
| ZMB-8-3 | 0.0000 | 0.0000 | 0.0000 | 0.0000 | 0.0000 | 0.0000 | 0.0000 | 0.0000 | 0.0000 | 0.0000 | 0.0000 | 0.0000 | 0.0000 | 0.0000 |
| ZMB-8-4 | 0.0000 | 0.0000 | 0.0000 | 0.023 | 0.0000 | 0.0000 | 0.0000 | 0.021 | 0.10 | 0.022 | 0.15 | 0.0000 | 0.097 | 5.47 |
| ZMB-8-5 | 0.0000 | 0.0000 | 0.0000 | 0.0000 | 0.0000 | 0.029 | 0.0000 | 0.0000 | 0.13 | 0.0000 | 0.0000 | 0.0000 | 0.12 | 7.28 |
| ZMB-8-6 | 0.0000 | 0.0000 | 0.11 | 0.0000 | 0.0000 | 0.017 | 0.0000 | 0.0000 | 0.0000 | 0.032 | 0.0000 | 0.0000 | 0.0000 | 4.00 |
| ZMB-8-7 | 0.0000 | 0.0000 | 0.097 | 0.015 | 0.0000 | 0.0000 | 0.0000 | 0.014 | 0.0000 | 0.0000 | 0.047 | 0.0000 | 0.12 | 0.0000 |
| ZMB-8-8 | 0.099 | 0.0000 | 0.18 | 0.013 | 0.053 | 0.0000 | 0.0000 | 0.0000 | 0.0000 | 0.0000 | 0.043 | 0.0000 | 0.056 | 2.88 |
| ZMB-8-9 | 0.0000 | 0.0000 | 0.0000 | 0.031 | 0.12 | 0.0000 | 0.0000 | 0.029 | 0.0000 | 0.0000 | 0.0000 | 0.0000 | 0.0000 | 0.0000 |
| ZMB-8-10 | 0.0000 | 0.0000 | 0.0000 | 0.0000 | 0.0000 | 0.0000 | 0.0000 | 0.0000 | 0.063 | 0.0000 | 0.0000 | 0.014 | 0.0000 | 2.27 |
| Samples | Element | Min–Max | Average (SD) | Median |
|---|---|---|---|---|
| Panjsher, Afghanistan 38 samples [17] | Li | 93–254 | 172.6 | 161 |
| Na | 1072.4–12,680 | 6345.8 | 6269.4 | |
| Mg | 1320–14,300 | 6510.7 | 5786.0 | |
| K | 33.3–713.6 | 496.1 | 662.3 | |
| Sc | 76–669.1 | 275.5 | 277 | |
| V | 36–2680 | 1306.4 | 1710 | |
| Cr | 576–4740 | 1353.8 | 1255 | |
| Mn | - | - | - | |
| Fe | 1394.7–6510 | 3202.2 | 2235 | |
| Co | - | - | - | |
| Ni | - | - | - | |
| Zn | - | - | - | |
| Ga | 14.4–38.6 | 21.5 | 17.4 | |
| Rb | 20.2–102 | 65.1 | 47.5 | |
| Cs | 35.3–52.3 | 40.8 | 38.1 | |
| Itabira, Brazil 301 samples (54 samples, [11]; 247 samples, [12]) | Li | 30.3–359 | 57.9 | 55.1 |
| Na | 3598–6305.9 | 4912.1 | 4989.0 | |
| Mg | 6814.3–12,422.7 | 9214.3 | 9256.7 | |
| K | 33.2–1150 | 257.7 | 238.5 | |
| Sc | 17.5–153 | 60.3 | 51.2 | |
| V | 52.5–177 | 116.5 | 117.5 | |
| Cr | 997–5700 | 2508.5 | 2360 | |
| Mn | 4.5–24.1 | 14.1 | 13.4 | |
| Fe | 2460–9120 | 5225.5 | 5217.2 | |
| Co | 1.9–3.0 | 2.47 | 2.47 | |
| Ni | -- | - | - | |
| Zn | 28.4–87.4 | 55.3 | 57.2 | |
| Ga | 6.7–13.8 | 11.4 | 11.9 | |
| Rb | 7.4–91.8 | 33.2 | 31.3 | |
| Cs | 16.8–1130 | 94.0 | 78.7 | |
| Dayakou, China 126 samples (112 samples, [34]; 6 samples, [25]; 8 samples, [35]) | Li | 159.7–654.2 | 345.6 | 320.5 |
| Na | 4590.3–15,442.0 | 8323.0 | 8140.4 | |
| Mg | 2634–10,149.3 | 5883.3 | 5585.2 | |
| K | 11.9–1761.1 | 247.7 | 168.1 | |
| Sc | 7.1–163.0 | 63.2 | 57.2 | |
| V | 598–11,788.9 | 3635.2 | 3150.9 | |
| Cr | 1.6–1053.4 | 117.7 | 43.9 | |
| Mn | 24.0–272.5 | 68.5 | 62.0 | |
| Fe | 1266.6–12,964 | 3302.2 | 2962 | |
| Co | 0.26–4.15 | 1.85 | 1.40 | |
| Ni | 9.0–313.9 | 111.3 | 93.2 | |
| Zn | 12.5–1489.3 | 117.7 | 58.9 | |
| Ga | 4.0–35.9 | 10.9 | 11.2 | |
| Rb | 8.0–73.1 | 23.3 | 21.9 | |
| Cs | 535.2–5034.3 | 1731.5 | 1607.0 | |
| Muzo, Colombia 250 samples (24 samples, [11]; 3 samples, [16]; 25 samples, [26]; 11 samples, [27]; 187 samples, [8]) | Li | 24–164 | 72 | 66.6 |
| Na | 1483.7–9860 | 3062.2 | 2262.7 | |
| Mg | 1720–6830 | 3986.1 | 3769.6 | |
| K | 5.4–359 | 22.2 | 17.1 | |
| Sc | 2–1093 | 353.0 | 226.6 | |
| V | 317–13,190 | 4675.4 | 3520.0 | |
| Cr | 172–10,700 | 3309.5 | 2388.5 | |
| Mn | 38–817 | 267.5 | 69.5 | |
| Fe | 16.8–5001 | 285.2 | 70.0 | |
| Co | 0.02–1.69 | 0.26 | 0.12 | |
| Ni | 0.29–46 | 8.5 | 4.5 | |
| Zn | 1–538 | 66.2 | 35.5 | |
| Ga | 9.75–78 | 42.3 | 39.4 | |
| Rb | 0.6–13 | 3.6 | 2.0 | |
| Cs | 2.2–56 | 11.3 | 10.5 | |
| Halo-Shakiso, Ethiopia 191 samples (20 samples, [11]; 2 samples, [16]; 11 samples, [28]; 4 samples, [12]; 3 samples, [29]; 151 samples, [17]) | Li | 177.9–531 | 305.4 | 302.1 |
| Na | 6342.9–15,000 | 9716.4 | 7771.0 | |
| Mg | 8750–15,377.6 | 13,684.0 | 14,171.5 | |
| K | 7.6–889 | 341.7 | 336.9 | |
| Sc | 30.5–150.0 | 86.0 | 65.1 | |
| V | 85–129 | 105.8 | 102.7 | |
| Cr | 734.3–5010 | 2810.9 | 2625.0 | |
| Mn | 7.9–75.1 | 23.7 | 19.6 | |
| Fe | 1960.7–5390 | 4020.9 | 4006.2 | |
| Co | 1.3–13.8 | 2.0 | 1.6 | |
| Ni | 8.3–16.0 | 12.3 | 12.9 | |
| Zn | 20.8–146 | 47.4 | 39.4 | |
| Ga | 16.4–24.2 | 20.0 | 19.6 | |
| Rb | 14.7–166 | 61.2 | 60.1 | |
| Cs | 151–675 | 372.4 | 368 | |
| Mananjary, Madagascar 165 samples (26 samples, [11]; 2 samples, [16]; 12 samples, [27]; 4 samples, [8]; 113 samples, [36]; 8 samples, [30]) | Li | 35–712.2 | 113.9 | 114.8 |
| Na | 2003.0–8939.5 | 7141.1 | 7344.5 | |
| Mg | 5608.3–18,995.8 | 15,363.8 | 15,618.8 | |
| K | 107–3150 | 1473.2 | 1200 | |
| Sc | 19–309 | 74.2 | 48.0 | |
| V | 52–386 | 177.5 | 145.0 | |
| Cr | 232–3770 | 1852.5 | 1570 | |
| Mn | 4–28.5 | 14.5 | 15 | |
| Fe | 3320–15,869 | 9315.0 | 9140.0 | |
| Co | 1.7–4.5 | 3.0 | 3.0 | |
| Ni | 9–57.5 | 28.2 | 27.0 | |
| Zn | 5–120 | 20.9 | 15.8 | |
| Ga | 6.1–13.1 | 8.8 | 8.3 | |
| Rb | 12.7–407.0 | 140.4 | 139.0 | |
| Cs | 97–1945 | 548 | 326 | |
| Malysheva, Russia 199 samples (15 samples, [11]; 3 samples, [16]; 4 samples, [12]; 177 samples, [36]) | Li | 298.4–1641.9 | 747.9 | 738 |
| Na | 2596.5–4562.5 | 3387.8 | 3152.9 | |
| Mg | 2834.3–6271.6 | 4237.4 | 3859.5 | |
| K | 30.5–8830 | 1361.5 | 95.5 | |
| Sc | 19.5–148 | 58.9 | 54.6 | |
| V | 29.8–189.7 | 98.1 | 101.9 | |
| Cr | 318–1700 | 820.5 | 775.5 | |
| Mn | 13.5–22.6 | 19.2 | 20.6 | |
| Fe | 864–8800 | 2497.6 | 2215.6 | |
| Co | 1.1–2.1 | 1.5 | 1.5 | |
| Ni | 13.4–23.2 | 17.6 | 17.6 | |
| Zn | 38.1–62.6 | 48.6 | 45.4 | |
| Ga | 6.3–19.5 | 13.7 | 13.7 | |
| Rb | 7.9–361 | 45.7 | 16.3 | |
| Cs | 107–2180 | 504.2 | 308 | |
| USA 29 samples [27] | Li | - | - | - |
| Na | - | - | - | |
| Mg | - | - | - | |
| K | - | - | - | |
| Sc | - | - | - | |
| V | 7.5–31.6 | 19.2 | 16.3 | |
| Cr | 23.5–4030 | 1082.9 | 933 | |
| Mn | - | - | - | |
| Fe | 125–2460 | 1087.4 | 1180 | |
| Co | - | - | - | |
| Ni | - | - | - | |
| Zn | - | - | - | |
| Ga | - | - | - | |
| Rb | - | - | - | |
| Cs | - | - | - | |
| Kafubu, Zambia 8 samples, this study | Li | 84–1140 | 554.7 | 569.7 |
| Na | 7233–23,700 | 14,614.7 | 15,326.1 | |
| Mg | 8030.5–23,900 | 15,384 | 15,256 | |
| K | 30–2728 | 513.4 | 466 | |
| Sc | 2.7–1534 | 320.9 | 292.4 | |
| V | 29.9–778 | 153.4 | 112.7 | |
| Cr | 43.2–10,800 | 2047.9 | 1771.6 | |
| Mn | 5.3–103 | 21.9 | 16.4 | |
| Fe | 4620–22,000 | 8941.4 | 8999.9 | |
| Co | 0.9–7.17 | 3.1 | 2.74 | |
| Ni | 4.7–50 | 18.5 | 18.7 | |
| Zn | 3.2–204.4 | 29.0 | 20.9 | |
| Ga | 1.1–50.5 | 13.8 | 13.4 | |
| Rb | 9.3–493.6 | 70.8 | 56.4 | |
| Cs | 128.4–2872.2 | 1285.3 | 1186.6 |
References
- Zwaan, J.C.; Seifert, A.V.; Vrána, S.; Laurs, B.M.; Anckar, B.; Simmons, W.B.; Falster, A.U.; Lustenhouwer, W.J.; Muhlmeister, S.; Koivula, J.I.; et al. Emeralds from the Kafubu Area, Zambia. Gems Gemol. 2005, 41, 116–148. [Google Scholar] [CrossRef]
- Zhang, Y.; Yu, X.-Y. Inclusions and Gemological Characteristics of Emeralds from Kamakanga, Zambia. Minerals 2023, 13, 341. [Google Scholar] [CrossRef]
- Gao, R.; Chen, Q.; Li, Y.; Huang, H. Update on Emeralds from Kagem Mine, Kafubu Area, Zambia. Minerals 2023, 13, 1260. [Google Scholar] [CrossRef]
- Giuliani, G.; Groat, L.A.; Marshall, D.; Fallick, A.E.; Branquet, Y. Emerald Deposits: A Review and Enhanced Classification. Minerals 2019, 9, 105. [Google Scholar] [CrossRef]
- Schwartz, D.; Giuliani, G. Emerald Deposits: A Review. Aust. Gemmol. 2001, 21, 17–23. [Google Scholar]
- Schwarz, D.; Giuliani, G.; Grundmann, G.; Glas, M. The Origin of Emerald. Emeralds World Extralapis Engl. 2002, 2, 18–23. [Google Scholar]
- Barton, M.D.; Young, S. Non-Pegmatitic Deposits of Beryllium: Mineralogy, Geology, Phase Equilibria and Origin. Rev. Mineral. Geochem. 2002, 50, 591–691. [Google Scholar] [CrossRef]
- Saeseaw, S.; Pardieu, V.; Sangsawong, S. Three-Phase Inclusions in Emerald and Their Impact on Origin Determination. Gems Gemol. 2014, 50, 114–132. [Google Scholar] [CrossRef]
- Marshall, D.; Downes, P.J.; Ellis, S.; Greene, R.; Loughrey, L.; Jones, P. Pressure–Temperature–Fluid Constraints for the Poona Emerald Deposits, Western Australia: Fluid Inclusion and Stable Isotope Studies. Minerals 2016, 6, 130. [Google Scholar] [CrossRef]
- Long, Z.-Y.; Yu, X.-Y.; Jiang, X.; Guo, B.-J.; Ma, C.-Y.; You, Y.; Zheng, Y.-Y. Fluid Boiling and Fluid-Rock Interaction as Primary Triggers for Emerald Deposition: Insights from the Dayakou Emerald Deposit (China). Ore Geol. Rev. 2021, 139, 104454. [Google Scholar] [CrossRef]
- Karampelas, S.; Al-Shaybani, B.; Mohamed, F.; Sangsawong, S.; Al-Alawi, A. Emeralds from the Most Important Occurrences: Chemical and Spectroscopic Data. Minerals 2019, 9, 561. [Google Scholar] [CrossRef]
- Saeseaw, S.; Renfro, N.D.; Palke, A.C.; Sun, Z.; McClure, S.F. Geographic Origin Determination of Emerald. Gems Gemol. 2019, 55. [Google Scholar] [CrossRef]
- (Hanco) Zwaan, J.C.; Jacob, D.E.; Hager, T.; Cavalcanti Neto, M.; Canis, J. Emeralds From the Fazenda Bonfim Region, Rio Grande Do Norte, Brazil. Gems Gemol. 2012, 48, 2–17. [Google Scholar] [CrossRef]
- Santiago, J.S.; da Souza, V.S.; de Filgueiras, B.C.; Jiménez, F.A.C. Emerald from the Fazenda Bonfim Deposit, Northeastern Brazil: Chemical, Fluid Inclusions and Oxygen Isotope Data. Braz. J. Geol. 2018, 48, 457–472. [Google Scholar] [CrossRef]
- Zheng, Y.-Y.; Yu, X.-Y.; Xu, B.; Guo, H.-S.; Zhao, S.-Y.; Tang, J.; Yan, Y.; Gao, Y.-J. New Insights of Emerald Geographic Origin Determination Based on the Infrared Spectroscopy of D2O and HDO Molecules. Vib. Spectrosc. 2024, 135, 103746. [Google Scholar] [CrossRef]
- Aurisicchio, C.; Conte, A.M.; Medeghini, L.; Ottolini, L.; De Vito, C. Major and Trace Element Geochemistry of Emerald from Several Deposits: Implications for Genetic Models and Classification Schemes. Ore Geol. Rev. 2018, 94, 351–366. [Google Scholar] [CrossRef]
- Alonso-Perez, R.; Day, J.M.D.; Pearson, D.G.; Luo, Y.; Palacios, M.A.; Sudhakar, R.; Palke, A. Exploring Emerald Global Geochemical Provenance through Fingerprinting and Machine Learning Methods. Artif. Intell. Geosci. 2024, 5, 100085. [Google Scholar] [CrossRef]
- De Araújo Neto, J.F.; de Brito Barreto, S.; Carrino, T.A.; Müller, A.; de Santos, L.C.M.L. Mineralogical and Gemological Characterization of Emerald Crystals from Paraná Deposit, NE Brazil: A Study of Mineral Chemistry, Absorption and Reflectance Spectroscopy and Thermal Analysis. Braz. J. Geol. 2019, 49, e20190014. [Google Scholar] [CrossRef]
- Guo, H.; Yu, X.; Zheng, Y.; Sun, Z.; Ng, M.F.-Y. Inclusion and Trace Element Characteristics of Emeralds from Swat Valley, Pakistan. Gems Gemol. 2020, 56, 336–355. [Google Scholar] [CrossRef]
- Sliwa, A.S.; Nguluwe, C.A. Geological Setting of Zambian Emerald Deposits. Precambrian Res. 1984, 25, 213–228. [Google Scholar] [CrossRef]
- Wood, D.L.; Nassau, K. The Characterization of Beryl and Emerald by Visible and Infrared Absorption Spectroscopy. Am. Mineral. 1968, 53, 777–800. [Google Scholar]
- Platonov, A.N.; Taran, M.N.; Minko, O.E.; Polshyn, E.V.; Pol’shin, E.H.V. Optical Absorption Spectra and Nature of Color of Iron Containing Beryls; Pascal and Francis Bibliographic Databases: Vandœuvre-lès-Nancy, France, 1978. [Google Scholar]
- Taran, M.N.; Rossman, G.R. Optical Spectroscopic Study of Tuhualite and a Re-Examination of the Beryl, Cordierite, and Osumilite Spectra. Am. Mineral. 2001, 86, 973–980. [Google Scholar] [CrossRef]
- Spinolo, G.; Fontana, I.; Galli, A. Optical Absorption Spectra of Fe2+ and Fe3+ in Beryl Crystals. Phys. Status Solidi B 2007, 244, 4660–4668. [Google Scholar] [CrossRef]
- Bai, F.; Pan, H.; Li, X. Replacement Degree of Al3+ and Cr/V Ratio in High-V Emeralds from Malipo, Yunnan, China. Arab. J. Geosci. 2019, 12, 377. [Google Scholar] [CrossRef]
- Ordóñez, R.A.; Castellano, M.J.; Danalatos, G.N.; Wright, E.E.; Hatfield, J.L.; Burras, L.; Archontoulis, S.V. Insufficient and Excessive N Fertilizer Input Reduces Maize Root Mass across Soil Types. Field Crops Res. 2021, 267, 108142. [Google Scholar] [CrossRef]
- Alonso-Perez, R.; Day, J.M.D. Rare Earth Element and Incompatible Trace Element Abundances in Emeralds Reveal Their Formation Environments. Minerals 2021, 11, 513. [Google Scholar] [CrossRef]
- Huang, Z.; Li, G.; Weng, L.; Zhang, M. Gemological and Mineralogical Characteristics of Emerald from Ethiopia. Crystals 2023, 13, 233. [Google Scholar] [CrossRef]
- Vertriest, W.; Girma, D.; Wongrawang, P.; Atikarnsakul, U.; Schumacher, K. Land of Origins: A Gemological Expedition to Ethiopia. Gems Gemol. 2019, 55, 72–88. [Google Scholar] [CrossRef]
- Pardieu, V.; Sangsawong, S.; Cornuz, L.; Raynaud, V.; Luetrakulprawat, S. Update on Emeralds from the Mananjary-Irondro Area, Madagascar. J. Gemmol. 2020, 37, 416–425. [Google Scholar] [CrossRef]
- Zheng, Y.; Yu, X.; Xu, B.; Guo, H.; Yan, Y.; Zhang, Y.; Tang, J.; Zhao, S. A Review of Research on the Emerald Origin Determination. Acta Petrol. Mineral. 2024, 43, 525–561. [Google Scholar]
- Blak, A.R.; Isotani, S.; Watanabe, S. Optical Absorption and Electron Spin Resonance in Blue and Green Natural Beryl. Phys. Chem. Miner. 1982, 8, 161–166. [Google Scholar] [CrossRef]
- Giuliani, G.; Branquet, Y.; Fallick, A.E.; Groat, L.; Marshall, D. Emerald Deposits around the World, Their Similarities and Differences. InColor 2016, 55–66. [Google Scholar]
- Zheng, Y.; Yu, X.; Guo, H. Major and Trace Element Geochemistry of Dayakou Vanadium-Dominant Emerald from Malipo (Yunnan, China): Genetic Model and Geographic Origin Determination. Minerals 2019, 9, 777. [Google Scholar] [CrossRef]
- Xu, C. Study on the Gemological and mineralogical Characteristic of Vanadium Rich Emeralds from Malipo Yunnan; China University of Geosciences: Beijing, China, 2016. [Google Scholar]
- Palke, A.C.; Lawley, F.J.; Vertriest, W.; Wongrawang, P.; Katsurada, Y. The Russian Emerald Saga: The Mariinsky Priisk Mine. InColor 2019, 44, 36–46. [Google Scholar]


Disclaimer/Publisher’s Note: The statements, opinions and data contained in all publications are solely those of the individual author(s) and contributor(s) and not of MDPI and/or the editor(s). MDPI and/or the editor(s) disclaim responsibility for any injury to people or property resulting from any ideas, methods, instructions or products referred to in the content. |
© 2025 by the authors. Licensee MDPI, Basel, Switzerland. This article is an open access article distributed under the terms and conditions of the Creative Commons Attribution (CC BY) license (https://creativecommons.org/licenses/by/4.0/).
Share and Cite
Jiang, Y.; Zhao, S.; Zhang, Z.; Xu, B. Gemological Characteristics and Trace Chemical Element Analysis of Emerald in Kafubu, Zambia. Crystals 2025, 15, 385. https://doi.org/10.3390/cryst15050385
Jiang Y, Zhao S, Zhang Z, Xu B. Gemological Characteristics and Trace Chemical Element Analysis of Emerald in Kafubu, Zambia. Crystals. 2025; 15(5):385. https://doi.org/10.3390/cryst15050385
Chicago/Turabian StyleJiang, Yiwei, Siyi Zhao, Zhiyi Zhang, and Bo Xu. 2025. "Gemological Characteristics and Trace Chemical Element Analysis of Emerald in Kafubu, Zambia" Crystals 15, no. 5: 385. https://doi.org/10.3390/cryst15050385
APA StyleJiang, Y., Zhao, S., Zhang, Z., & Xu, B. (2025). Gemological Characteristics and Trace Chemical Element Analysis of Emerald in Kafubu, Zambia. Crystals, 15(5), 385. https://doi.org/10.3390/cryst15050385