Article

Chromone-Based Copper(II) Complexes as Potential Antitumour Agents: Synthesis, Chemical Characterisation and In Vitro Biological Evaluation

by
Nikolina Filipović
1,
Tomislav Balić
1,
Martina Medvidović-Kosanović
1,
Dominik Goman
1,
Berislav Marković
2,
Dalibor Tatar
1,
Sunčica Roca
3 and
Katarina Mišković Špoljarić
4,*
1
Department of Chemistry, Josip Juraj Strossmayer University of Osijek, Cara Hadrijana 8/A, 31000 Osijek, Croatia
2
Faculty of Dental Medicine and Health, Josip Juraj Strossmayer University of Osijek, Crkvena 21, 31000 Osijek, Croatia
3
NMR Centre, Ruđer Bošković Institute, Bijenička Cesta 54, 10000 Zagreb, Croatia
4
Faculty of Medicine, Josip Juraj Strossmayer University of Osijek, Josipa Hutlera 4, 31000 Osijek, Croatia
*
Author to whom correspondence should be addressed.
Crystals 2025, 15(5), 389; https://doi.org/10.3390/cryst15050389
Submission received: 1 March 2025 / Revised: 16 April 2025 / Accepted: 17 April 2025 / Published: 23 April 2025

Abstract

:
Three new complexes of copper(II) and chromone-2-carboxylic acid, a ligand from the group of hydroxypyrones, were synthesised according to the principles of green chemistry. The complexes were characterised by FT–IR and NMR spectroscopy, thermal and electrochemical analysis, and their structures are proposed. The results show the formation of mononuclear (1) and dinuclear hydroxo-bridged dinuclear copper(II) complexes (2 and 3). The results of cyclic voltammetry show that the copper in all complexes is in the +2-oxidation state. The antiproliferative activity was determined by MTT assay on 2D cell models in vitro on seven cell lines. The activity spectrum of complexes 13 ranged from the highest to the lowest value in the tumour cell lines tested, in the following order: Hep G2 > NCI-H358 > HT-29 > KATO III > MDA-MB 231 > Caco-2. The most effective concentration was 10−5 mol dm−3, which suppressed the growth of Hep G2 cells as follows: 69.5% (1), 64.8% (2) and 64% (3). The calculated selectivity index clearly shows that Hep G2 is the most sensitive cell line to copper complexes (SI = 1.623 (1); 1.557 (2), 1.431 (3).

1. Introduction

Heterocyclic compounds and their derivatives have attracted the interest of researchers for decades due to their vast variety of crystal and molecular structures. Among large the number of natural and synthetically obtained heterocyclic compounds, hydroxypyranones and benzopyranones have been used for the preparation of complexes with transition metals due to their excellent coordination abilities and biological activity [1,2,3,4]. Hydroxypyranones are characterised by the presence of a pyranone ring to which functional groups such as hydroxyl or carboxyl groups can be attached (Figure 1a). The most common heteroatoms in hydroxypyranones are oxygen atoms, while nitrogen atoms are an integral part of the hydroxypyridinone ring. The above-mentioned groups of compounds are interesting for application in medicinal chemistry due to the possibility of pyranone ring modification, which results in the formation of various biologically active derivatives [5]. The fused system of the pyranone ring with a benzene forms the backbone of a group of heterocyclic compounds called benzopyranones (Figure 1b) [6,7]. Among benzopyranones, coumarins (benzopyran-2-ones) are important, and are used for medicinal purposes as anticoagulants (vitamin K blockers). The above property makes coumarins the most biologically and structurally studied group of heterocyclic compounds [8,9,10]. Chromone (benzopyran-4-one) and its derivatives occur in plants and are commonly found in algae and conifers. Like coumarins, they have various pharmacological properties and represent an interesting group of compounds with potential biological applications [11,12,13,14,15,16]. They are characterised by a variety of applications in organic synthesis and a high affinity towards metal ion complexation, which makes them suitable ligands for the preparation of metallo-pharmaceuticals [17,18]. One of the most important structures within this group are tocopherols. Tocopherols are a group of compounds belonging to vitamin E, an essential nutrient that plays a key role in protecting cells from oxidative stress. Structurally, they are derivatives of chromanol and differ in the number and position of the methyl groups on the ring, which divides them into alpha (α), beta (β), gamma (γ) and delta (δ) tocopherols. Among them, α-tocopherol shows the highest biological activity in humans and is most found in food supplements [19,20,21].
The importance of chromones as ligands lies in the chelation of biologically important metals such as iron, copper and zinc and their transport into the organs where deficiencies of these metals have been observed [17,22,23,24]. Some of these complexes are used for therapeutic purposes, such as vanadium complexes with proven insulin–mimetic properties [25] or as supplements for metal ion deficiency. The discovery of the chemotherapeutic agent cisplatin led to intensive research into copper metallodrugs in the field of medicinal chemistry [26,27]. Copper is an essential trace element of the human organism that is present in all tissues. It is involved in the formation of red blood cells, the maintenance of neurons and the immune system [28,29,30]. A lack of copper in the human body leads to fatigue, frequent colds, brittle bones and memory problems. On the other hand, an increased concentration of copper in the human body is toxic as it produces reactive oxygen species that directly cleave DNA and RNA [30]. Copper deprivation therapy (chelation) is used in the treatment of fibrosis and inflammation and has been shown to be effective in the treatment of Alzheimer’s disease in the elderly [31]. Various copper complexes have been tested in several in vitro and in vivo tests on mice and have led to a regression of tumour growth. Therapy with copper complexes has also been successful in anti-angiogenesis of tumours, i.e., it slows down the growth of malignant cancer cells [32,33,34,35,36].
In this work, we present the preparation and evaluation of the biological activity of three novel copper complexes formed from different copper(II) salts (sulphate, nitrate and acetate) and chromone-2-carboxylic acid as a ligand. The complexes were synthesised by the green synthesis method, and the putative structure was deduced from chemical characterisation (FT–IR, CHNS, TGA/DSC, NMR). The biological effect of the newly synthesised copper(II) complexes was evaluated by their suppressive activity against a series of malignant cell lines. This synthesis of copper compounds is in line with the basic principles of green chemistry, a scientific approach that aims to minimise the negative impact of chemical processes on the environment and human health. The use of environmentally friendly precursors, such as copper(II) salts and chromone-2-carboxylic acid, eliminates the need for toxic or poorly degradable reagents, contributing to the principles of waste prevention and safer chemical syntheses. In addition, the use of water and ethanol—solvents that belong to the category of green solvents—reduces the environmental footprint of the process in accordance with the design principle of less hazardous chemicals and solvents. The efficiency and economy of the synthesis also support the principles of maximum atomic efficiency and energy sustainability, highlighting this approach as an environmentally friendly alternative to conventional methods of synthesising metal complexes. This rational selection of reagents and methods contributes to the sustainable development of chemistry and industry and promotes the application of innovative and environmentally friendly technologies [37,38,39,40].

2. Materials and Methods

2.1. General Methods

The chemical characterisation of the complexes was performed using Elementar vario MACRO cube elemental analyser (Quantum Analytics, Woodlands, TX, USA) with a detection range as follows: C: 0.002–100%; H: 0.015–100%; N: 0.004–100%; S: 0.004–100%. IR spectra were recorded with the FTIR 8400S spectrophotometer equipped with the Diffuse Reflectance Spectroscopy (DRS) 8000 accessory in the range 4000–400 cm−1 (Shimadzu, Kyoto, Japan). All 1H and 13C NMR spectra were recorded using a Bruker AV600 spectrometer (Bruker BioSpin GmbH, Rheinstetten, Germany) equipped with a 5 mm diameter probe in DMSO-d6. The residual high-field signals of the solvent at 2.51 ppm for 1H and 39.51 ppm for 13C were used as a reference. The spectra of the copper(II) complexes were recorded with the following parameters: sweep width of 200 ppm, transmitter frequency offset of 70.0 ppm, relaxation delay of 1.0 s, acquisition time of 0.82 s, matrix sizes of 80 K (acquisition) and 64 K (FT), and 64 scans. The half-widths of the signals (Δν1/2, Hz) were read at half the signal height. 13C NMR signals were obtained with the following parameter values: sweep width of 2000 ppm (from −500 to 1500 ppm), transmitter frequency offset of −200; 250; 700; 1200 ppm as a function of sweep width, a relaxation delay of 1.0 s, an acquisition time of 0.84 s, matrix sizes of 124 K (acquisition) and 64 K (FT), and 500 number of scans. The spectra were recorded with Bruker standard methods: 1H (zg30) and 13C{1H} (zgpg30). Thermogravimetric analysis (TGA/DSC) was performed with a simultaneous thermogravimetric analyser and differential scanning calorimeter (Mettler–Toledo TGA/DSC1, Greifensee, Switzerland). The sample (10–20 mg) was placed in an aluminium oxide dish (7.0 × 10⁻⁵ dm3) and heated in an oxygen atmosphere to 600 °C at a rate of 10 °C min−1. Data acquisition and analysis were performed using the STARe Software 10.0 programme developed by Mettler Toledo. The diffractograms of all newly synthesised complexes and ligands were recorded on a Panalytical Aeris (Malvern, Worcestershire, UK) diffractometer using monochromatic CuKα X-rays (40 kV, 15 mA, λ = 1.5406 Å) at 295 K in Bragg–Brentan θ-θ geometry. The recording step was 0.02 °C in the 2θ range of 5–50 °C. The computer program Panalytical XRDMP 1.2.0.0 was used for data acquisition and HighScore Plus 5.0.109 for data processing. A PalmSens potentiostat/galvanostat (PalmSens BV, Utrecht, The Netherlands) controlled by PSTrace 4.2 software was used to perform the electrochemical experiments. A conventional three-electrode cell with a glassy carbon working electrode, an Ag/AgCl reference electrode and a platinum wire counter electrode was used. Before each measurement, the glassy carbon working electrode was polished with polished α–Al2O3 (0.05 µm, ALS, Tokio, Japan). The scan rate of cyclic voltammetry varied from 50 to 300 mV s−1. Stock solutions (c = 1 × 10⁻² mol dm−3) of the investigated compounds (ligand L and complexes (1), (2) and (3)) were prepared in DMSO. Before each measurement, the corresponding amount of each compound was diluted in 0.1 mol dm−3 KNO3 to the desired concentration.

2.2. Solution-Based Synthesis of the Copper(II) Complexes

All chemicals used in the preparation of the complexes were of reagent grade and were used without further purification. Copper(II) nitrate trihydrate (99%), ethanol and sodium hydroxide were purchased from T.T.T., Croatia. Copper(II) sulphate pentahydrate (99%), copper(II) acetate dihydrate (99%) and chromone-2-carboxylic acid (ligand, L) were purchased from Acros Organics (Waltham, MA, USA). All compounds were obtained by solution synthesis according to reaction Scheme 1.

2.2.1. Synthesis of [Cu(OH)(C2H5OH)(L)(H2O)2]—Complex (1)

Copper(II) sulphate pentahydrate (CuSO4·5H2O (0.1245 g; 0.05 mmol)) was dissolved in 5 cm3 of high-purity H2O. The resulting solution was mixed with an ethanolic solution of chromone-2-carboxylic acid (0.095 g: 0.5 mmol; 10 cm3 of warm ethanol). After mixing, the final solutions were adjusted to pH 7.2 with 0.1 mol dm−3 sodium hydroxide solution. The resulting reaction mixture contained a pale blue precipitate, which was filtered off, washed with 5 cm3 of cold water and dried in air (m = 0.143 g, yield 65.22%). DRS, (cm−1): 3500 (s), 3360 (s), 1749 (vs), 1700 (s), 1649 (s), 1550 (s), 1200 (w–m), 1050 (w), 850 (w), 750 (w), 500 (m). Analytical calculation for [Cu(OH)(C2H5OH)(L)(H2O)2] resulted with amount of carbon (40.93%) and hydrogen (4.58%). Experimental data revealed similar amount of carbon (41.30%), and hydrogen (4.33%) compared to analytical calculation. NMR: 1H NMR (DMSO-d6), δ [ppm] (Δν1/2 [Hz]): 7.90 (28) (2.1H), 7.39 (20) (1H). 13C NMR (DMSO d6), δ [ppm]: 188.9, 164.2, 121.5 ppm.

2.2.2. Synthesis of [Cu2(μ-OH)2(L)2(H2O)2]—Complex (2)

Copper(II) nitrate trihydrate solution (Cu(NO3)2·3H2O (0.1208 g; 0.5 mmol)) was prepared in the same way as for the synthesis of complex (1). The weighed copper(II) nitrate trihydrate was dissolved in 5 cm3 of ultrapure water and mixed with 10 cm3 chromone-2-carboxylic acid ethanolic solution (0.095 g; 0.5 mmol). The resulting suspension was adjusted to pH 7.2 with 0.1 NaOH, filtered, washed and dried (m = 0.136 g, yield 63.10%). DRS, (cm−1): 3500 (s), 3350 (s), 1650 (s), 1500 (s), 1150 (wm), 1000 (w), 750 (w), 500 (m). Analytical calculation for [Cu2(μ-OH)2(L)2(H2O)2] resulted with the amount of carbon (41.74%) and hydrogen (2.88%). Experimental data revealed similar amount of carbon (41.98%), and hydrogen (2.63%) compared to analytical calculation. Chemical characterisation of (2) was additionally resolved by NMR: 1H NMR (DMSO-d6), δ [ppm] (Δν1/2 [Hz]): 7.91 and 7.88 (68) (2.2H), 7.37 (38) (1H). 13C NMR (DMSO-d6), δ [ppm]: 194.1, 169.0, 128.4.

2.2.3. Synthesis of [Cu2(μ-OH)2(L)2(H2O)4]—Complex (3)

Complex (3) was prepared following a similar procedure to that for complexes (1) and (2), but without pH adjustment. Copper(II) acetate dihydrate (0.10883 g; 0.5 mmol) was dissolved in 5 cm3 ultrapure water. The resulting solution was mixed with 10 cm3 of ethanolic solution of chromone-2-carboxylic acid (0.095 g; 0.5 mmol), resulting in a pale blue suspension. Precipitate was filtered, washed and dried (m = 0.158 g, yield 77.34%). DRS (cm−1): 3400 (s), 3210 (s), 3100 (m), 1690 (vs), 1650 (s), 1610 (m), 1510 (s), 1430 (w), 1350 (m), 1250 (wm), 1070 (w), 850 (w), 770 (w), 510 (m). Analytical calculation for [Cu2(μ-OH)2(L)2(H2O)4]: resulted with amount of carbon (39.29%) and hydrogen (3.37%). Experimental data revealed similar amount of carbon (39.16%), and hydrogen (3.61%) compared to analytical calculation. Chemical characterisation of (3) was additionally resolved by NMR: 1H NMR (DMSO-d6), δ [ppm] (Δν1/2 [Hz]): 7.88 (95) (1.9H), 7.37 (71) (1H). 13C NMR (DMSO-d6), δ [ppm]: 192.6, 167.6.

2.3. Anticancer Activity Evaluation

2.3.1. Cell Lines

The anticancer effect of copper(II) complexes was investigated on 7 cell lines obtained from the American Type Culture Collection (ATCC, Rockville, MD, USA). The malignant cell lines were: Caco-2 and HT-29 (human colorectal adenocarcinoma), MDA-MB 231 (human breast adenocarcinoma), KATO III (human gastric adenocarcinoma), Hep G2 (hepatoblastoma), NCI-H358 (bronchioalveolar carcinoma). The normal cell line was MRC–5 (human fibroblasts from the lung). The cells were grown in a monolayer and cultured in Dulbecco’s modified Eagle medium–DMEM with high glucose, 10% FBS and 2 mmol dm−3 Glutamax. NCI-H358 was cultured in Rosswell Park Memorial Institute (RMPI 1640) medium containing 10% FBS, 2 mmol dm−3 Glutamax, 10 mmol dm−3 sodium pyruvate and 2 mmol dm−3 HEPES in aerated tissue culture flasks (Becton Dickinson Falcon, Heidelberg, Germany) in a humidified atmosphere under the conditions of 37 °C and 5% CO2 in a CO2 incubator (IGO 150 CELLlife TM, JOUAN, ThermoFisher Scientific, Waltham, MA, USA). The viability of the cells and the number of viable cells were confirmed by erythrosine B. The chemicals and media used for cell cultivation and assay were manufactured by Sigma Aldrich, St Louis, MO, USA. DMSO was manufactured by ACROS Organics, now Thermo Fisher Scientific, Waltham, MA, USA.

2.3.2. Chemicals

The tested compounds (copper(II) complexes and ligand) were dissolved in DMSO as 10−3 mol dm−3 stock solution. Final concentrations of solutions (10−5 mol dm−3, 10−6 mol dm−3, 10−7 mol dm−3) were prepared by diluting the stock solution in DMEM.

2.3.3. MTT Assay

The MTT (3-(4,5-dimethylthiazol-2-yl)-2,5-diphenyltetrazolium bromide) assay [41] is used to assess cellular metabolic activity as an indicator of cell permeability, proliferation and cytotoxicity. Cells were seeded in 96-well culture plates at a density of 2 × 10⁴ cells cm−3 and grown overnight. After 24 h, the cells were treated with freshly prepared dilutions of copper(II) complexes and ligands and incubated for 72 h. On the day of measurement, the medium was discarded and replaced with fresh MTT/PBS solution (5 mg cm−3) and then incubated at 37 °C for 4 h. DMSO was used to dissolve the water-insoluble MTT formazan crystals. The absorbance was measured at 595 nm using an Elisa microplate reader (iMark, BIO RAD, Hercules, CA, USA). All experiments were performed in triplicate. The IC50 values (concentration causing 50% inhibition of cell growth compared to untreated cells) were calculated for all cell lines [42]. The selectivity index (SI), which indicates the cytotoxic selectivity of the complexes against cancer cells compared to normal cells, was determined using the following formula [43]:
SI = (IC50 value of normal cell line)/(IC50 value of cancer cell line)

2.3.4. Statistical Analysis

Statistical analysis was performed by STATISTICTM, version 13.3 software for Windows. A nonparametric Mann–Whitney test was applied to evaluate differences between controls and treatments for MTT data evaluation. Selectivity index was appraised by the Student t-test. Results with (*) p < 0.05, (§) p < 0.01, and (#) p < 0.001 were considered significant.

3. Results

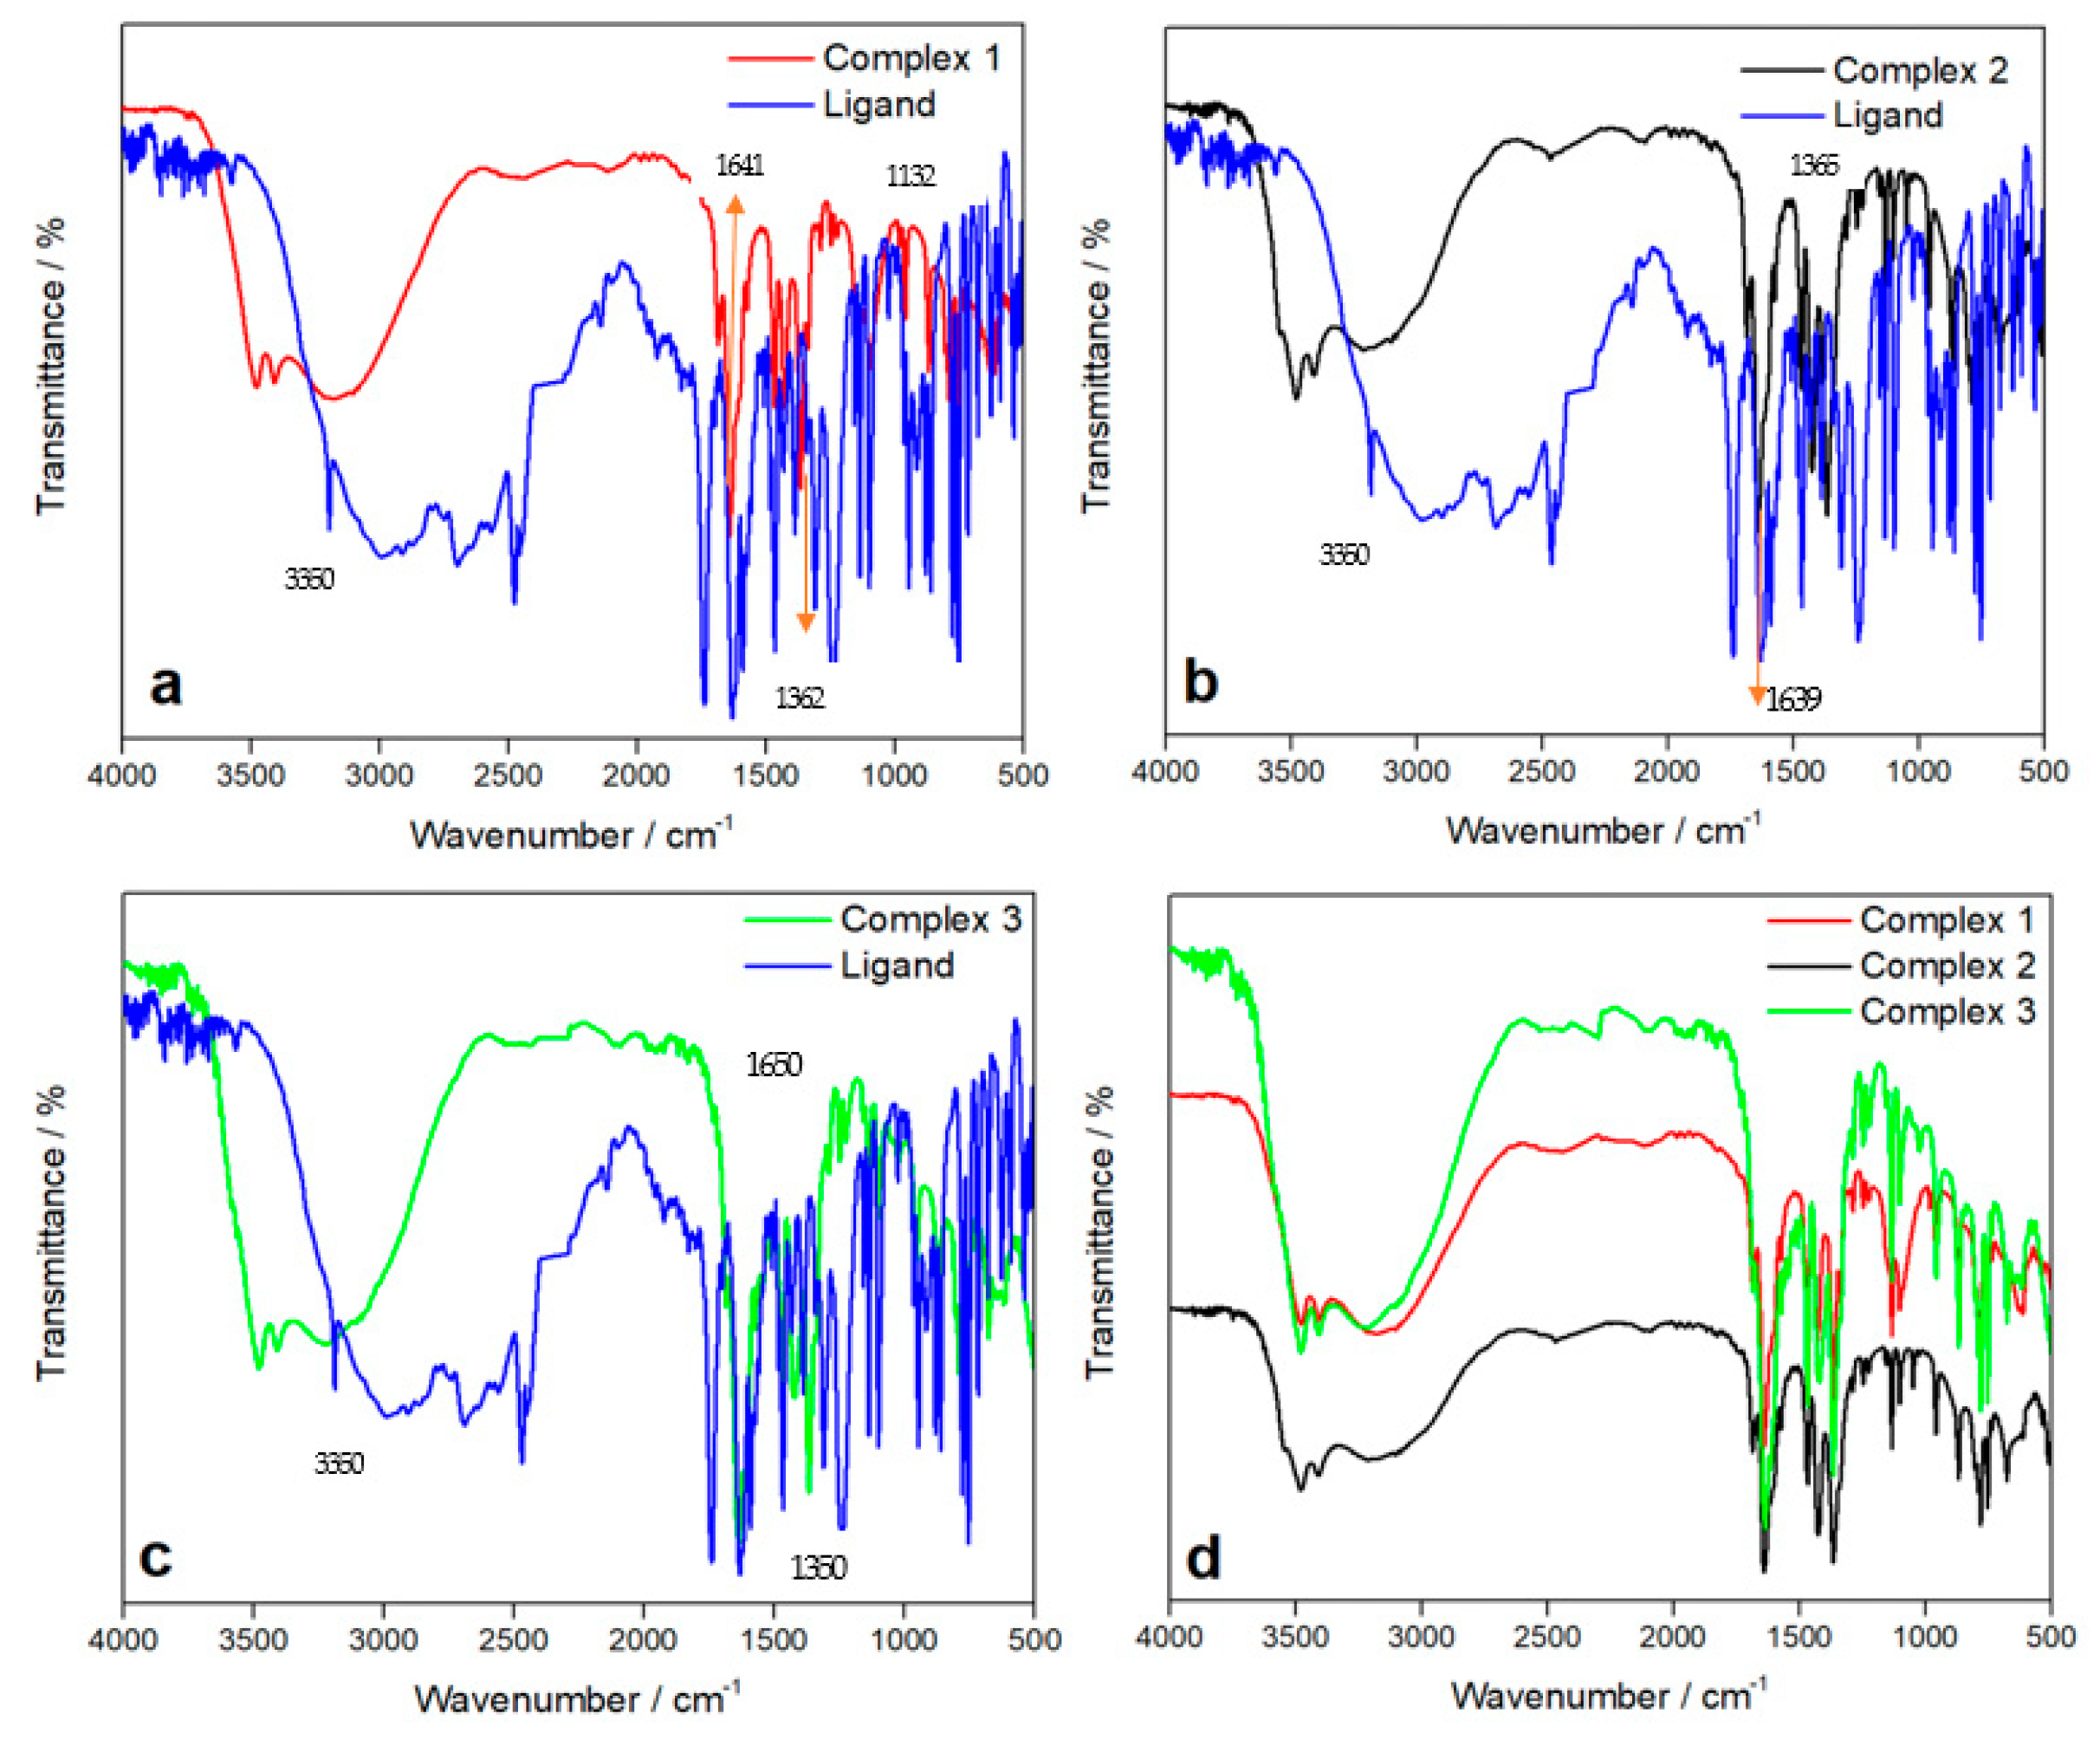
3.1. FT-IR Spectroscopy

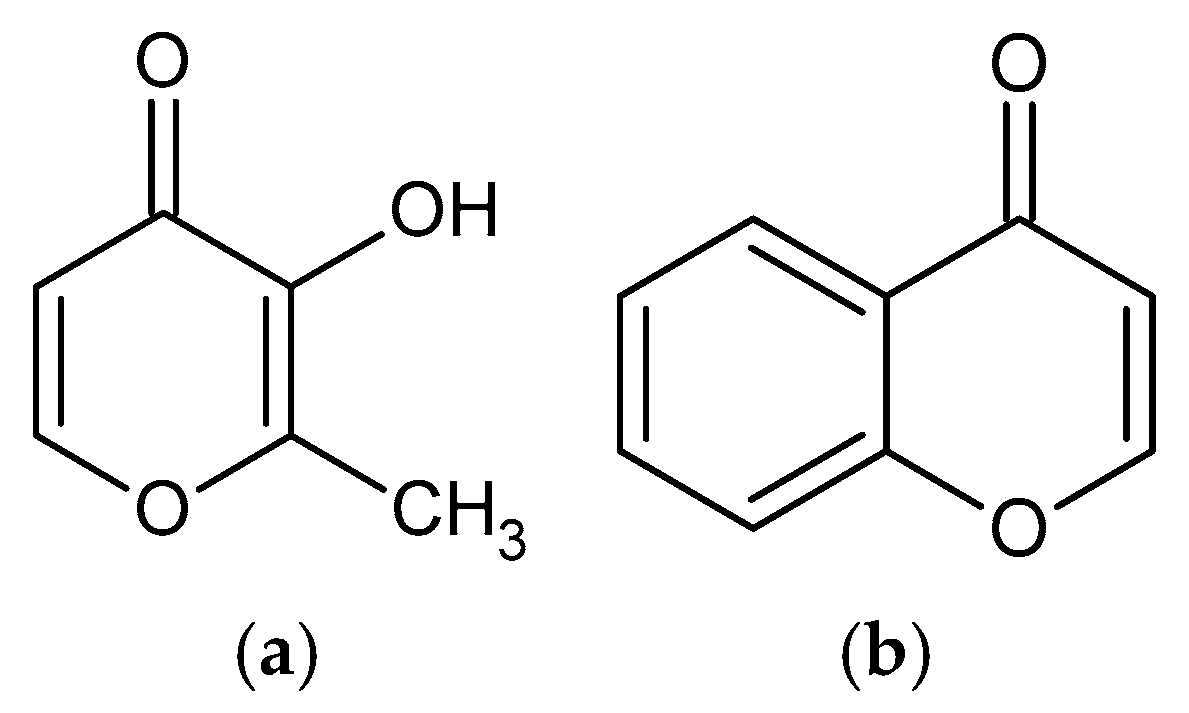
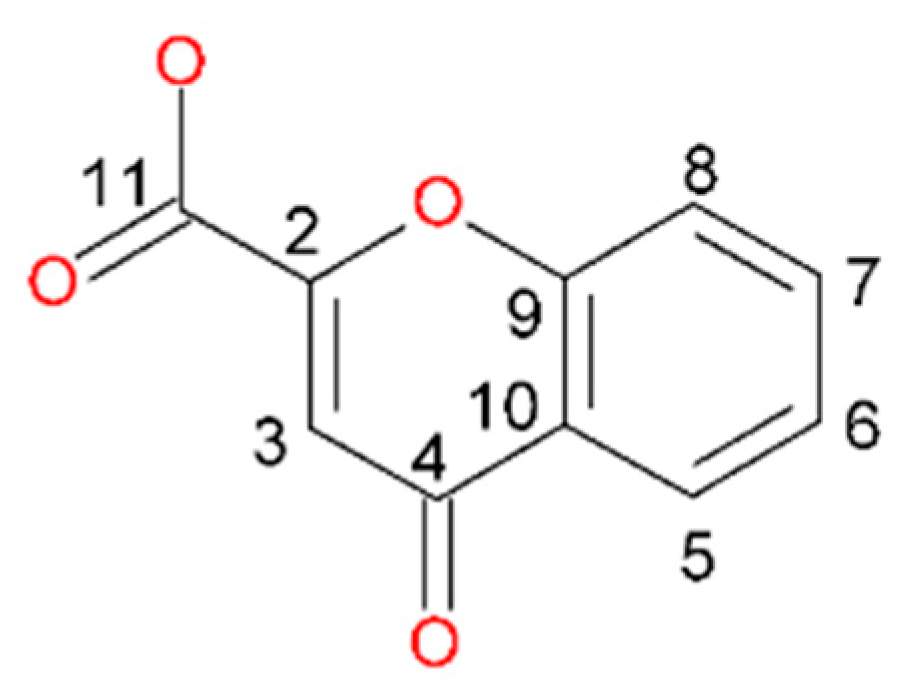
3.1.1. IR Spectrum of Ligand

A broad, strong maximum at 2750 cm−1 in the spectrum of the ligand molecule (blue coloured in Figure 2a–d) is due to the O–H stretching vibrations of the carboxylic acid group. The C=O and C–O stretching vibrations of the carboxylic group are at 1739 cm−1 and 1240 cm−1, respectively. A strong vibration at 1629 cm−1 is due to the C=O stretching vibration of the phenone group. O–H bending vibrations are located at 1386 cm−1 and 914 cm−1, respectively [44].

3.1.2. IR Spectra of Complexes

According to the IR spectra (Figure 2a–d), deprotonation of the carboxyl group of the chromone-2-carboxylic acid occurred in the complexes. In the IR spectra, there are no peaks close to 1750 cm−1 and 2750 cm−1 that are typical for OH and COOH group vibrations in the chromonic acid. The ligand is therefore present in deprotonated form. Broad and strong bands at 3350–3450 cm−1 is due to OH vibrations of water molecules. In complex (1), the peaks at 1641 and 1362 cm−1 can be attributed to the antisymmetric and symmetric vibrations of the carboxyl groups (Δν = 279 cm−1). In addition, absorption bands at 1132 and 611 cm−1 are visible, which are due to weak vibrations in the ethanol molecule. In complex (2), the antisymmetric and symmetric vibrations of the carboxyl groups are located at 1639 cm−1 and 1365 cm−1 (Δν = 274 cm−1). In complex (3), the peaks at 1650 and 1350 cm−1 can be assigned to the asymmetric and symmetric vibrations of the carboxyl groups (Δν = 300 cm−1). The C=O stretching vibrations of the phenone group overlapped with the asymmetric COO vibrations [45].

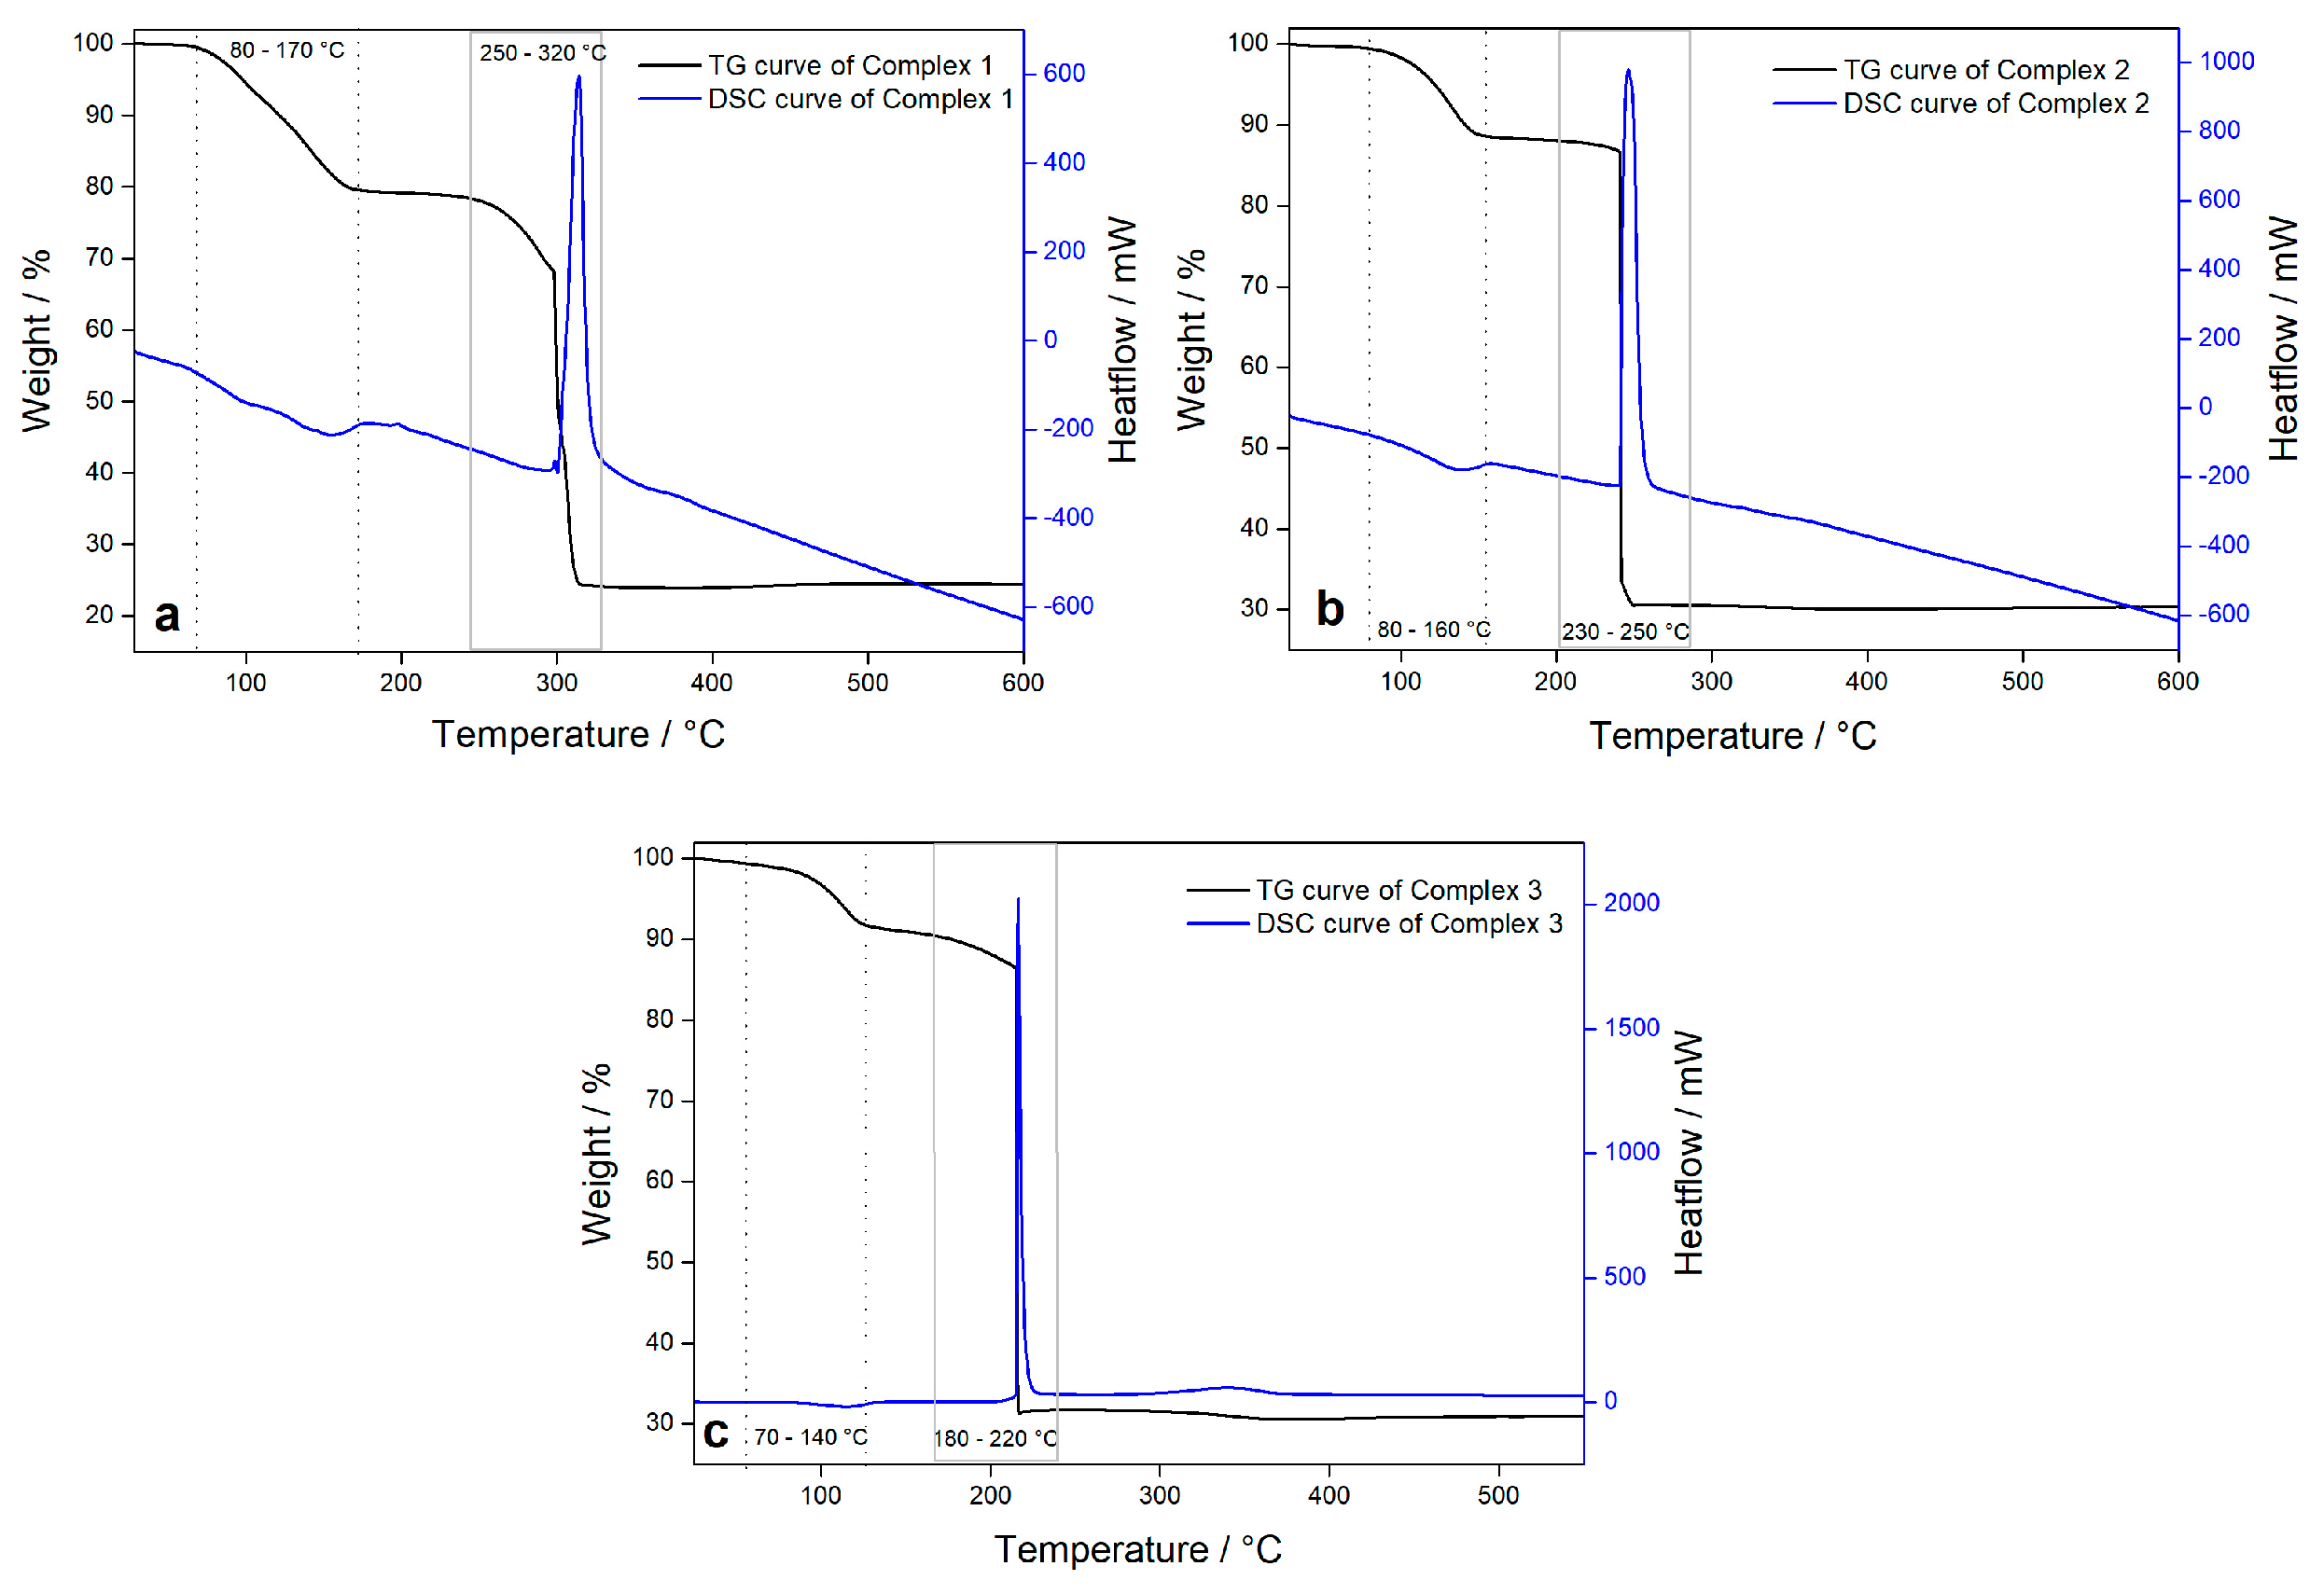
3.2. Thermal Analysis

The thermogravimetric curve of the complex (1) shows two distinct thermal events (Figure 3a). In the first step, a mass loss of 20.9% can be observed, presumably due to the loss of water molecules and solvent molecules (in this case ethanol). The first derivation of the TG curve (dTG) indicates the presence of an intermediate step with a mass loss of 9.2% in the temperature interval from 60 to 120 °C, which could be attributed to the evaporation of the ethanol molecule (calculated 13%). The second step in the temperature interval from 120 to 180 °C leads to a mass loss of 11.3% and can be attributed to the vaporisation of two water molecules (calculated 10.3%). Unfortunately, the evaporation limit of ethanol molecules and water molecules cannot be clearly distinguished even on the dTG curve. In the last step, there is a mass loss in the temperature interval of 260 to 320 °C with a mass loss of 55%, which corresponds to the thermal decomposition of a ligand molecule (calculated 54.1%). The remaining mass of 24.7% after thermal decomposition of the ligand is stable up to a temperature of 600 °C and can be attributed to the CuO. According to the analysis, the proportion of copper in the compound is 19.5% (calculated 18.6%). The first step of the thermal decomposition of complex (3) (Figure 2c) corresponds to a mass loss of 11% in the temperature interval from 60 °C to 180 °C. An analogous thermal decomposition was observed for complex (2) (Figure 3b), accompanied by a mass loss of 11.7%, which could be due to the evaporation of water molecules and the thermal decomposition of bridging hydroxide ions. Upon further heating, complex 3 thermally decomposes in one step at a temperature of about 220 °C. This thermal decomposition is accompanied by a mass loss of 63.5%, which corresponds to the thermal decomposition of two ligand molecules. In contrast to complex 3, this thermal decomposition step in 2 occurs at a slightly higher temperature of about 240 °C to 250 °C (Figure 3b) with a total mass loss of 57% (corresponding to the thermal decomposition of two ligand molecules). The thermogravimetrically determined proportion of Cu in complex 3 is 18.4% (assuming that the residue after combustion is CuO). In complex (2), the thermogravimetrically determined mass fraction of copper is 19.68% (under the same assumption as for complex (3)). The experimentally determined proportions of copper in complex (3) and (2) agree relatively well with proposed molecular structures (vide infra) (complex (3) 20.7%; complex (2) 22.0%). The calculated and experimentally determined values for the mass losses of water molecules, ethanol, ligands and the mass of the remaining CuO can be found in Table 1.

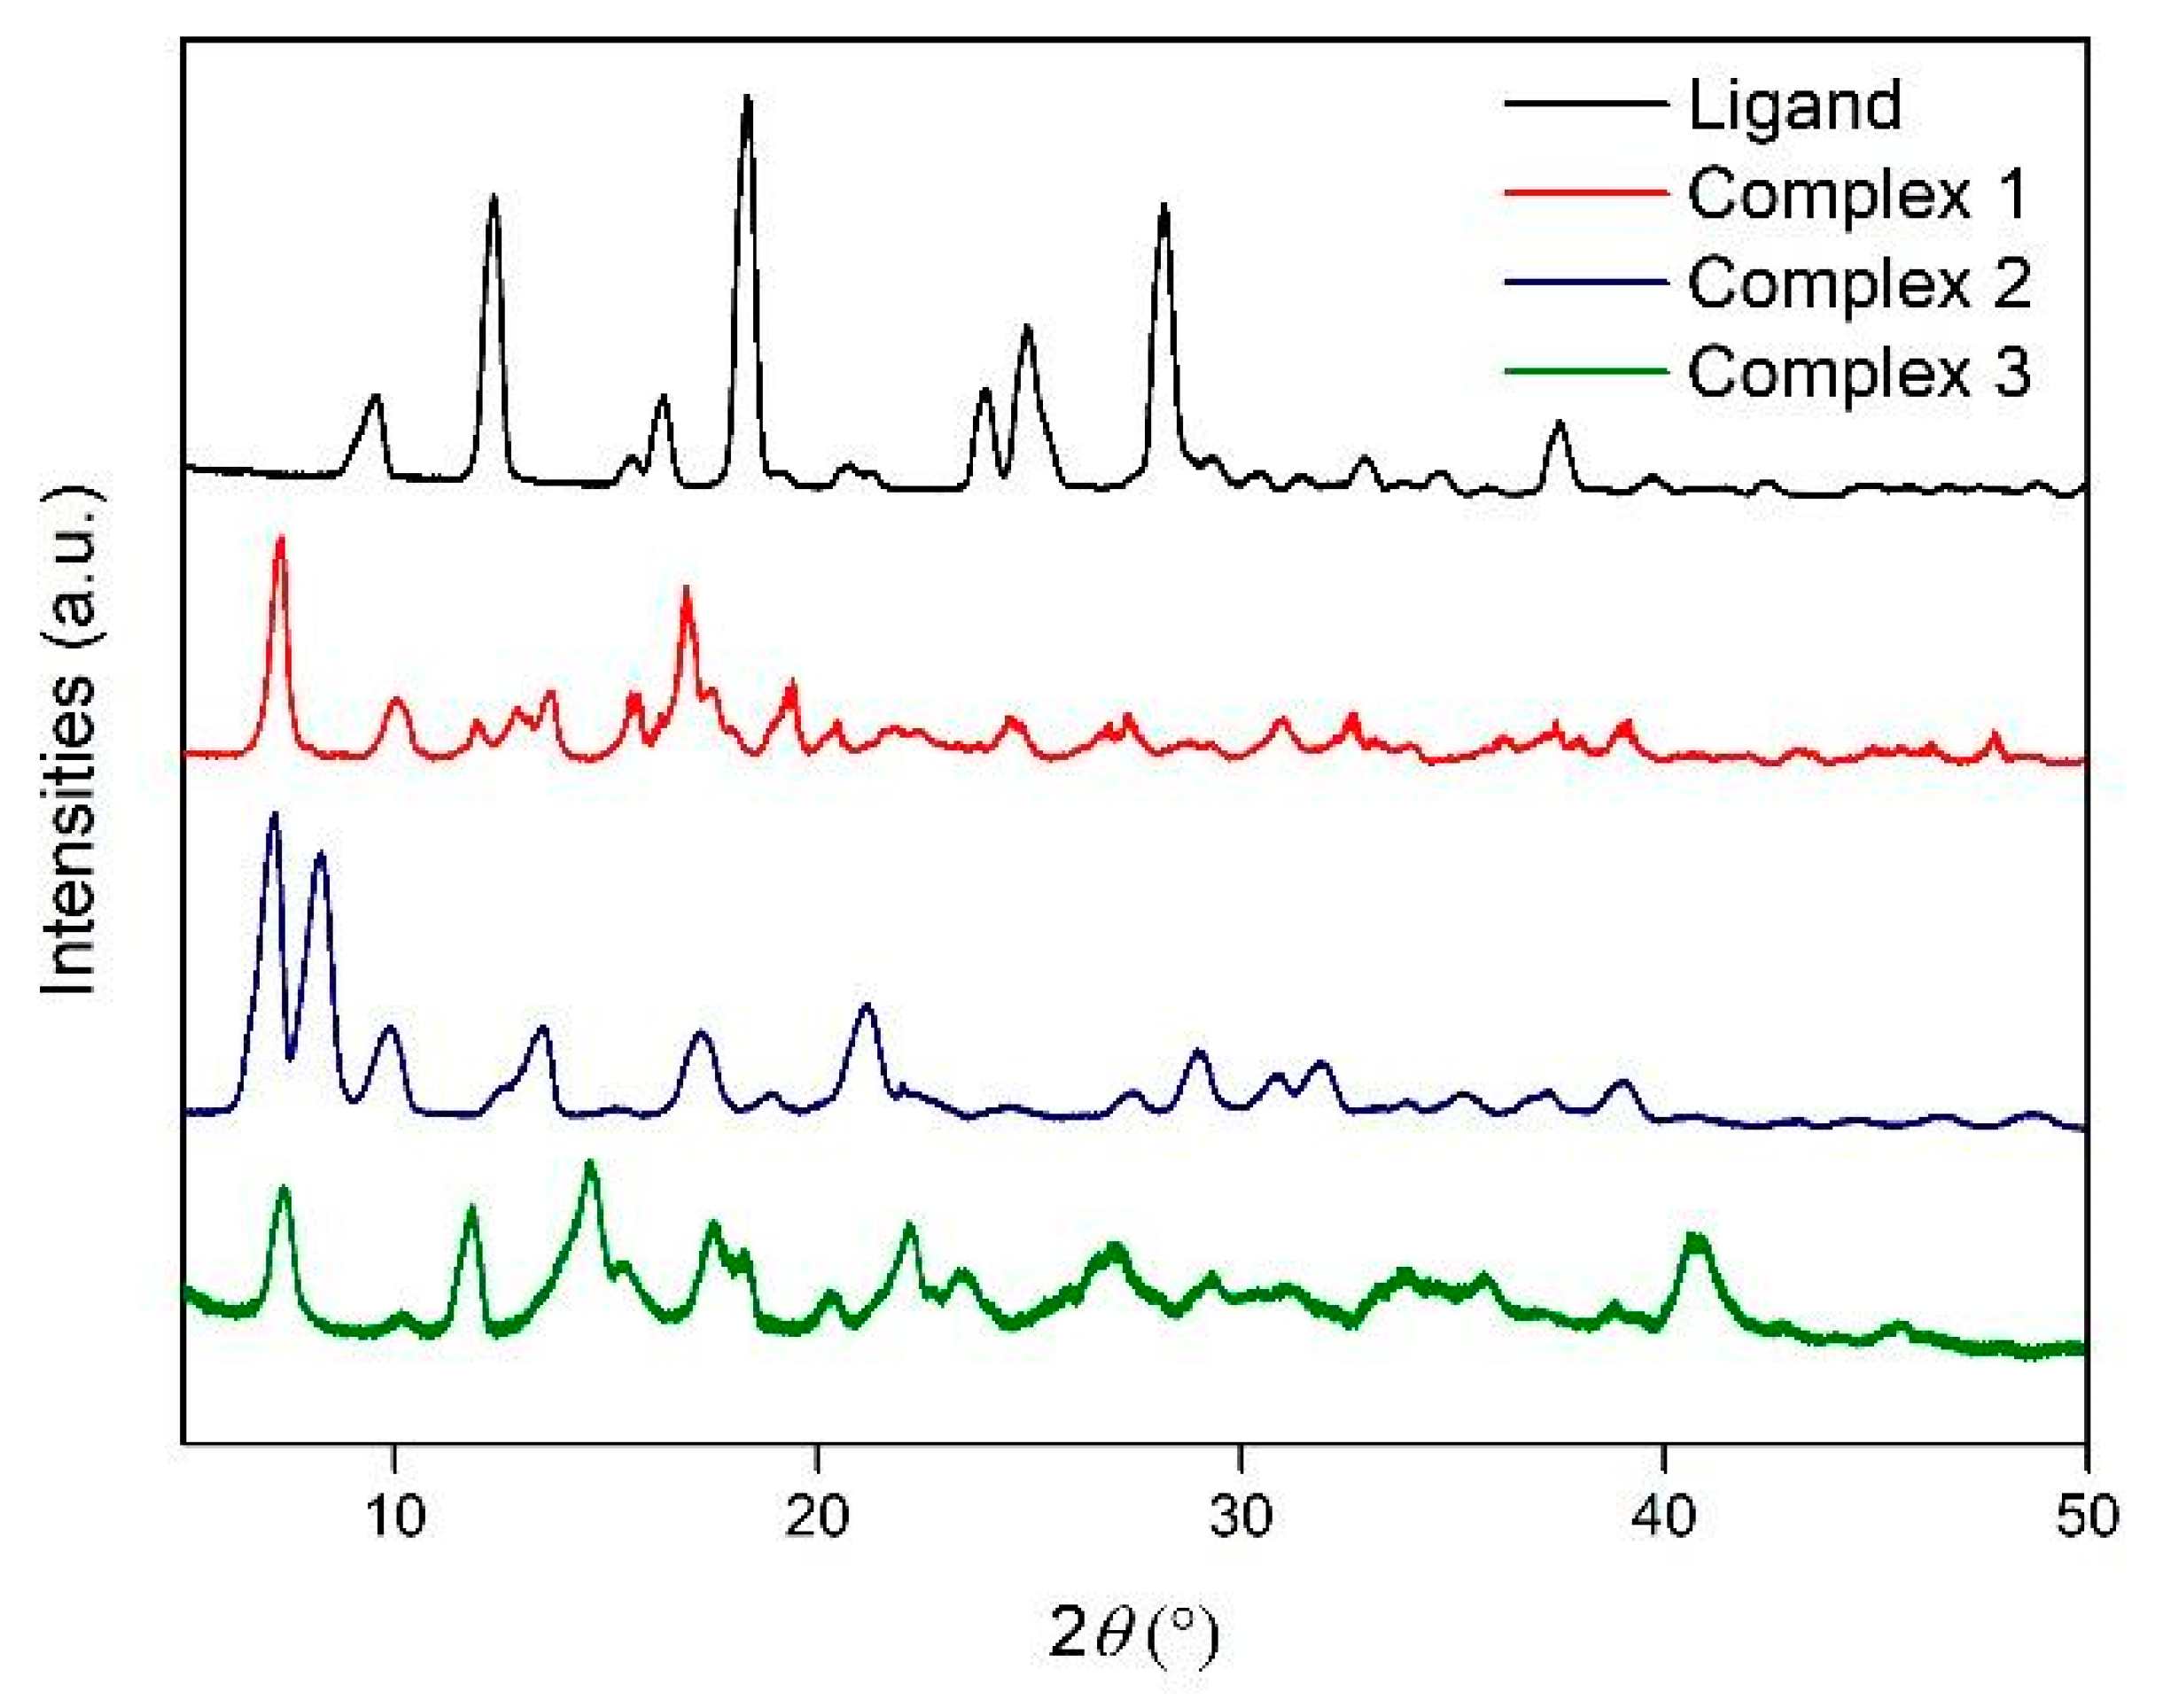
3.3. X-Ray Powder Difraction

The diffractograms of the complexes were compared to the diffractogram of the free ligand, and it can be concluded that different crystalline phases were formed. In addition, the diffractograms of the samples were analysed using the crystal structure database available in the X’Pert HighScore Plus program [46,47], but no matches were found with either the Cu(II) starting salt used or with some simple structures (e.g., Cu(II) hydroxides). The results of the PXRD analysis of complexes 2 and 3 show that although there are clear differences between the two diffractograms, there is also quite significant overlap. In the diffractogram of complex 2, several intense maxima were observed at the 2θ angles 12.6°, 13.4°, 18.5° and 26.3°. Diffraction maxima at 2θ angles of 13.4° and 26.5° are not present in complex 3. The existing differences in the diffractograms of complexes 2 and 3 indicate that they are two compounds with a similar, but not identical, crystal structure (Figure 4).

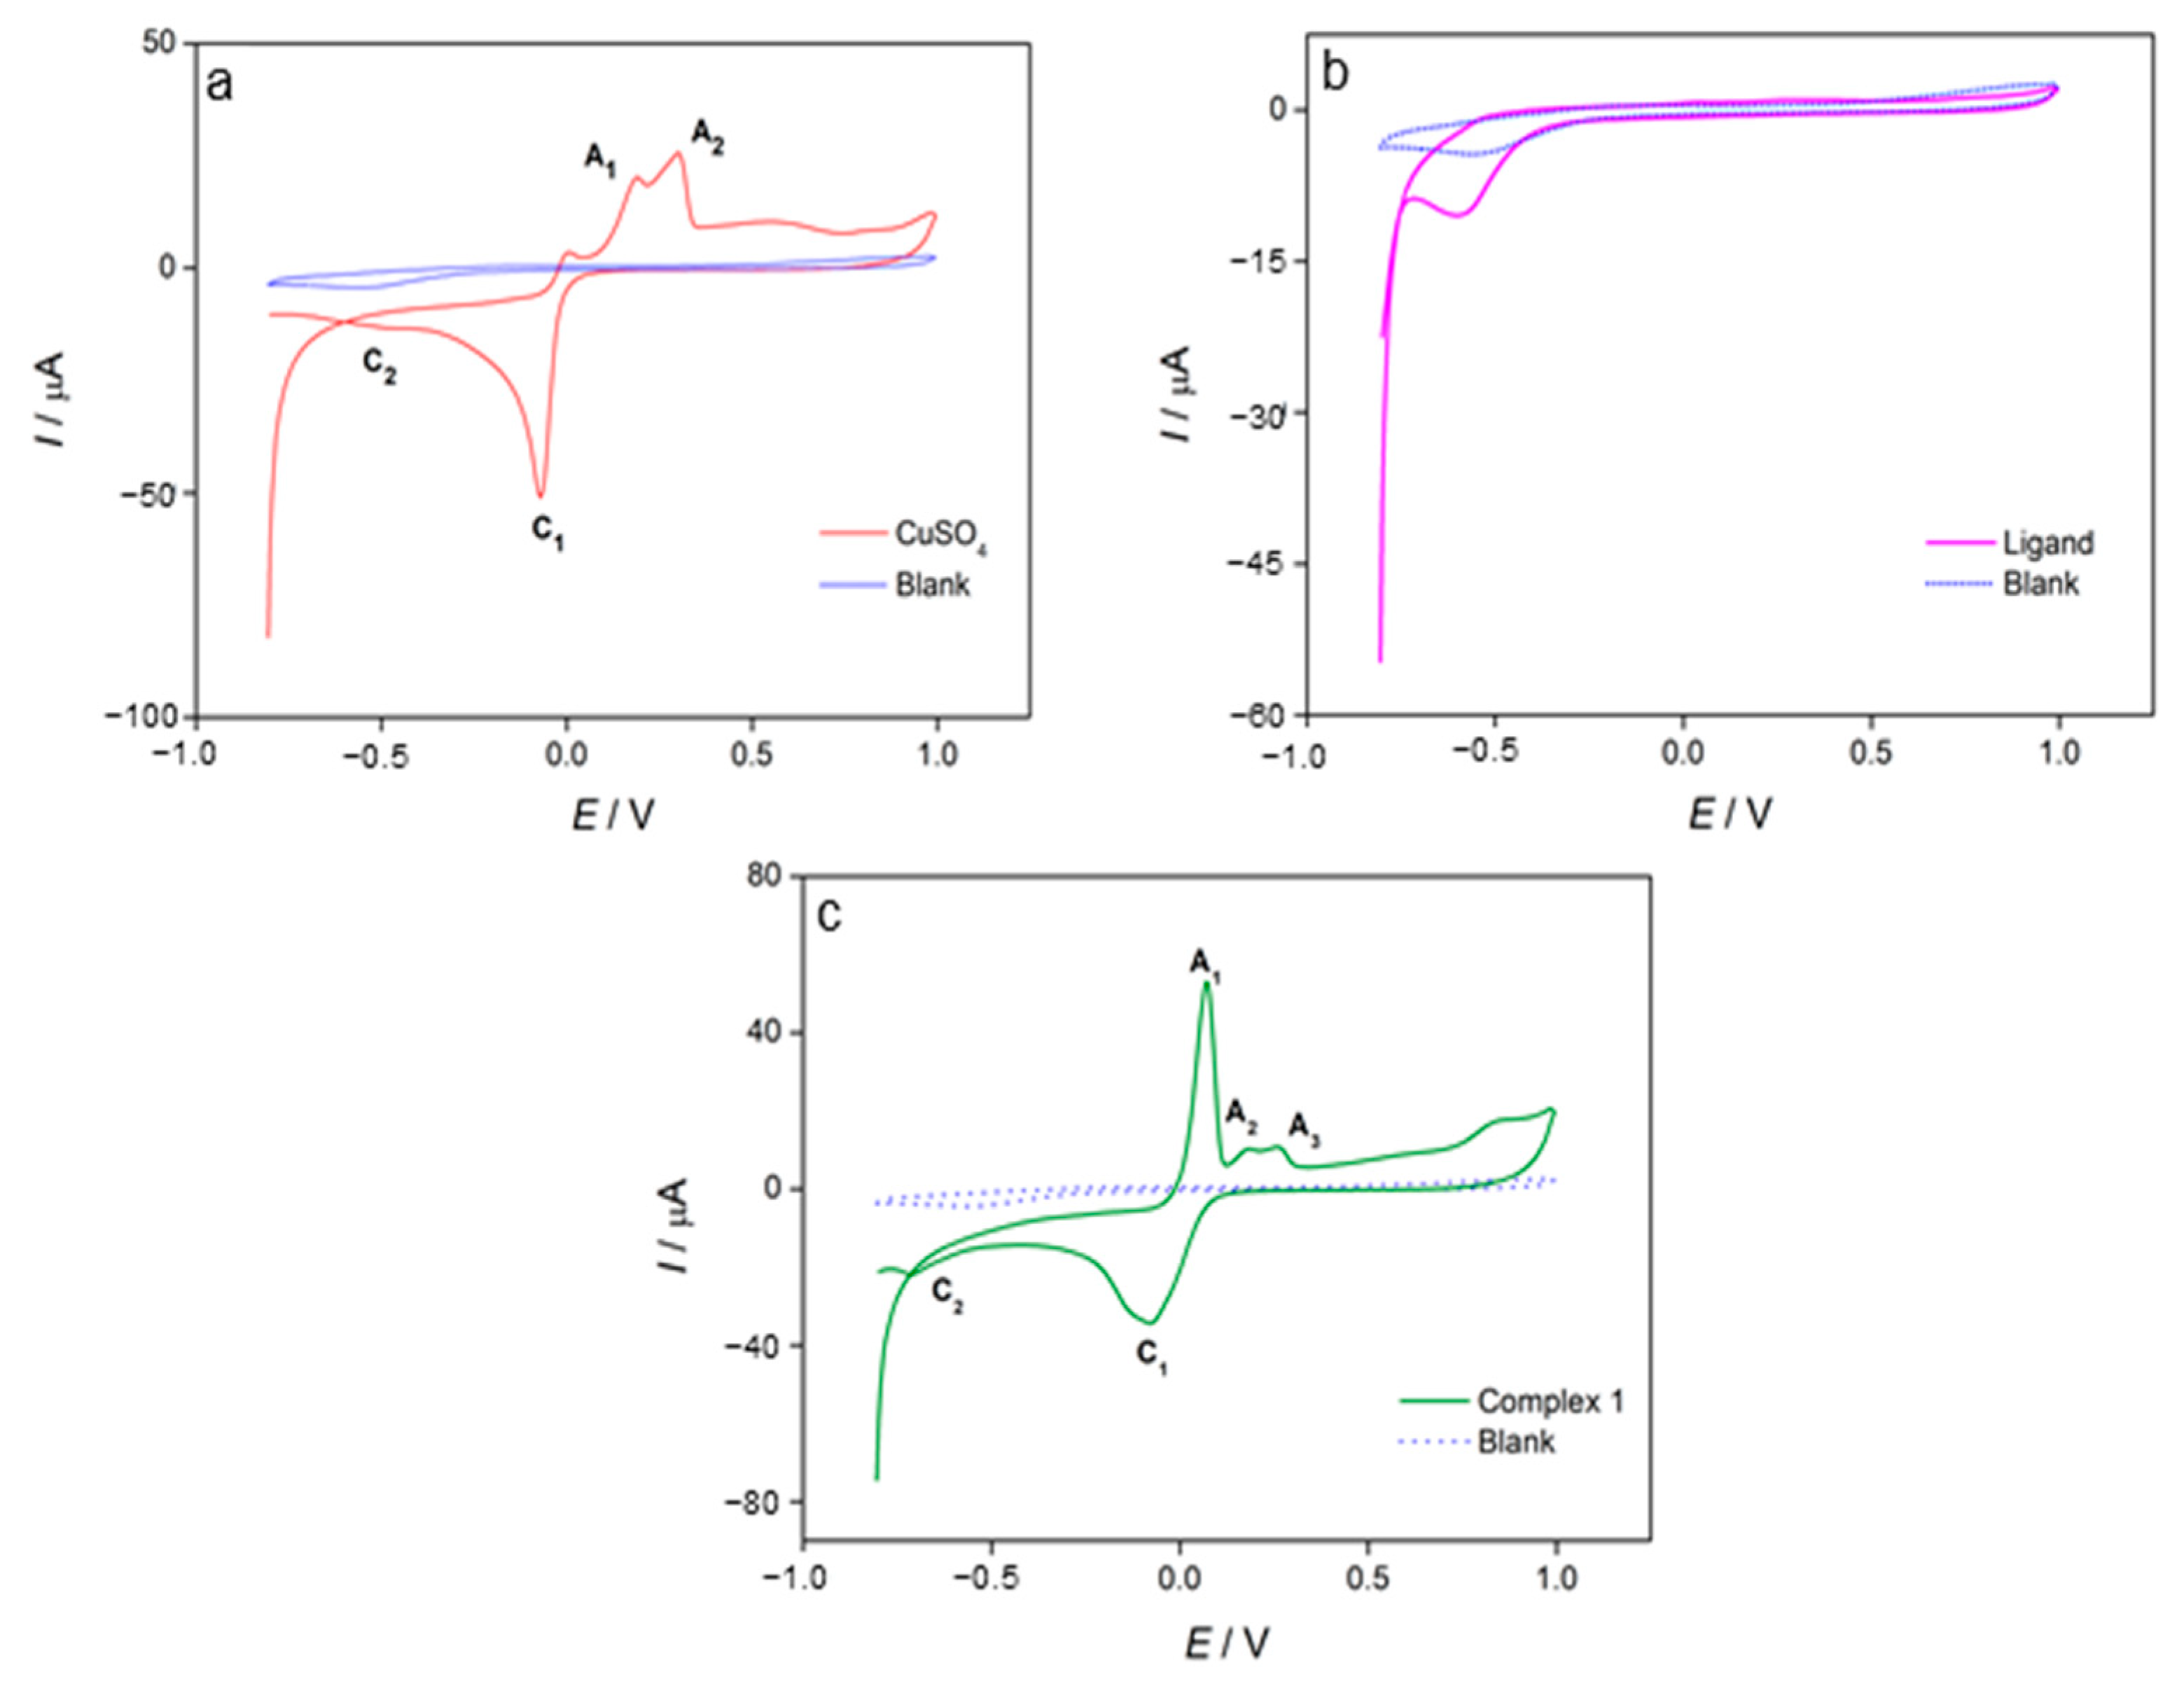
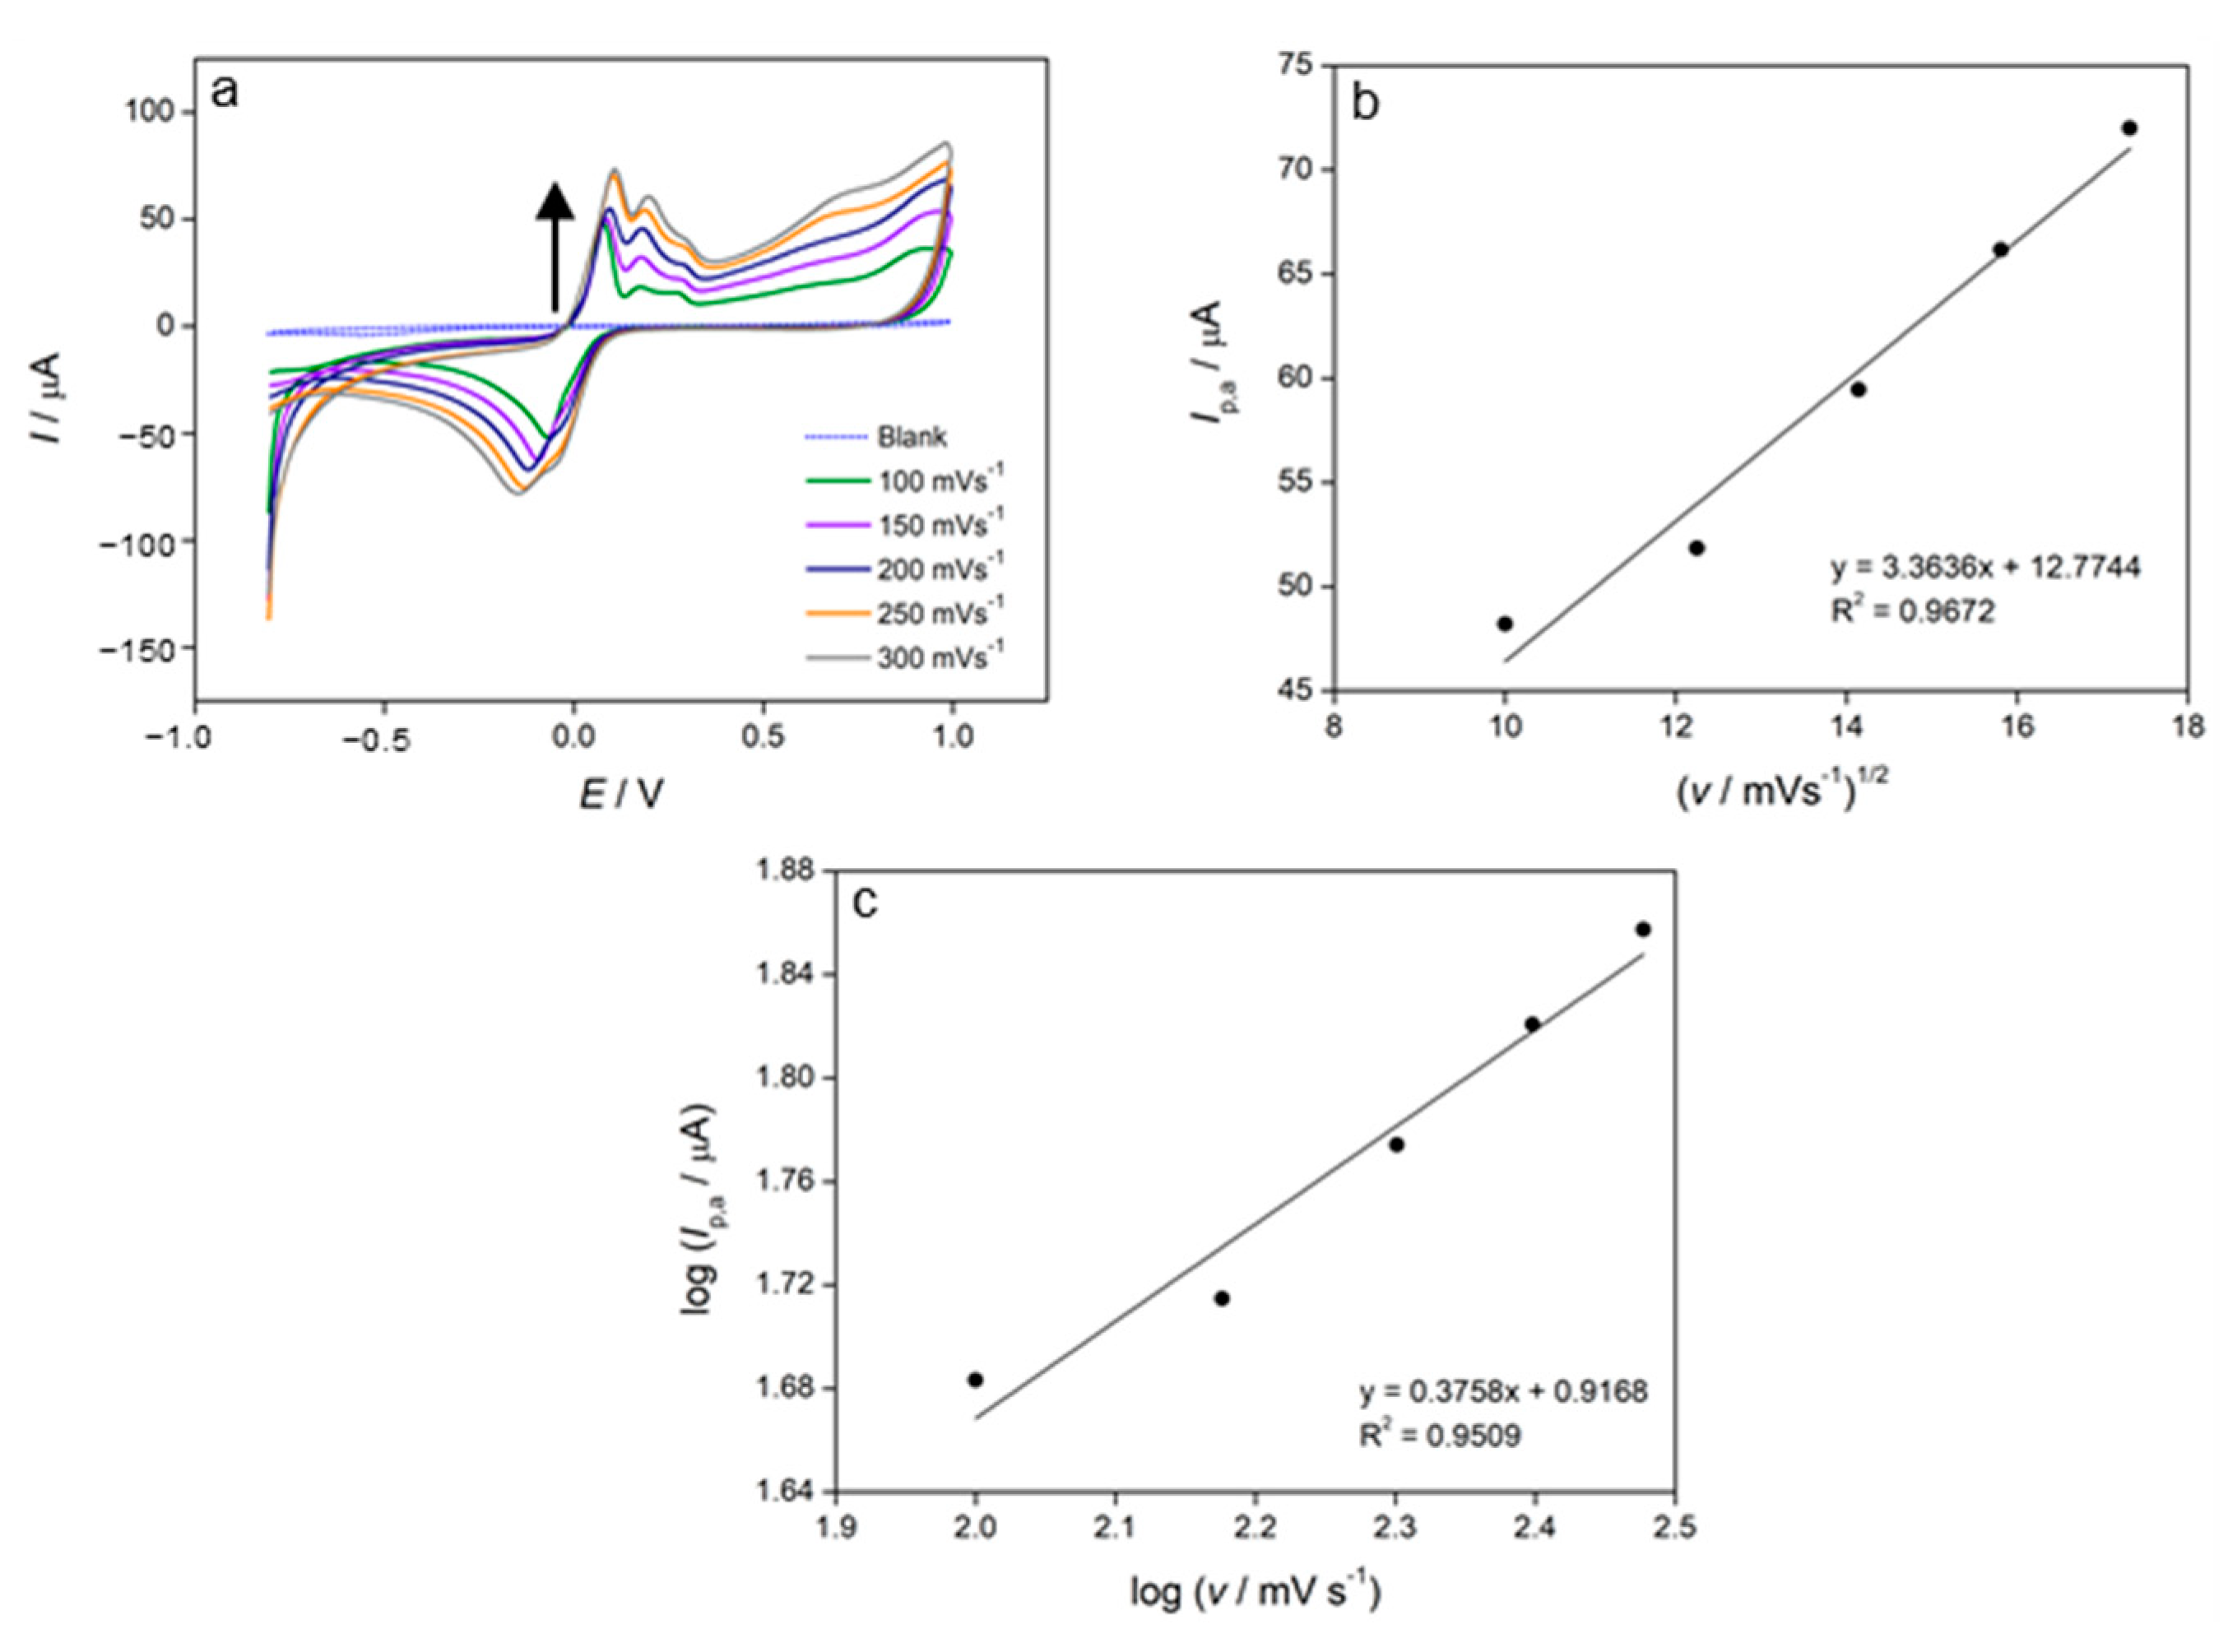
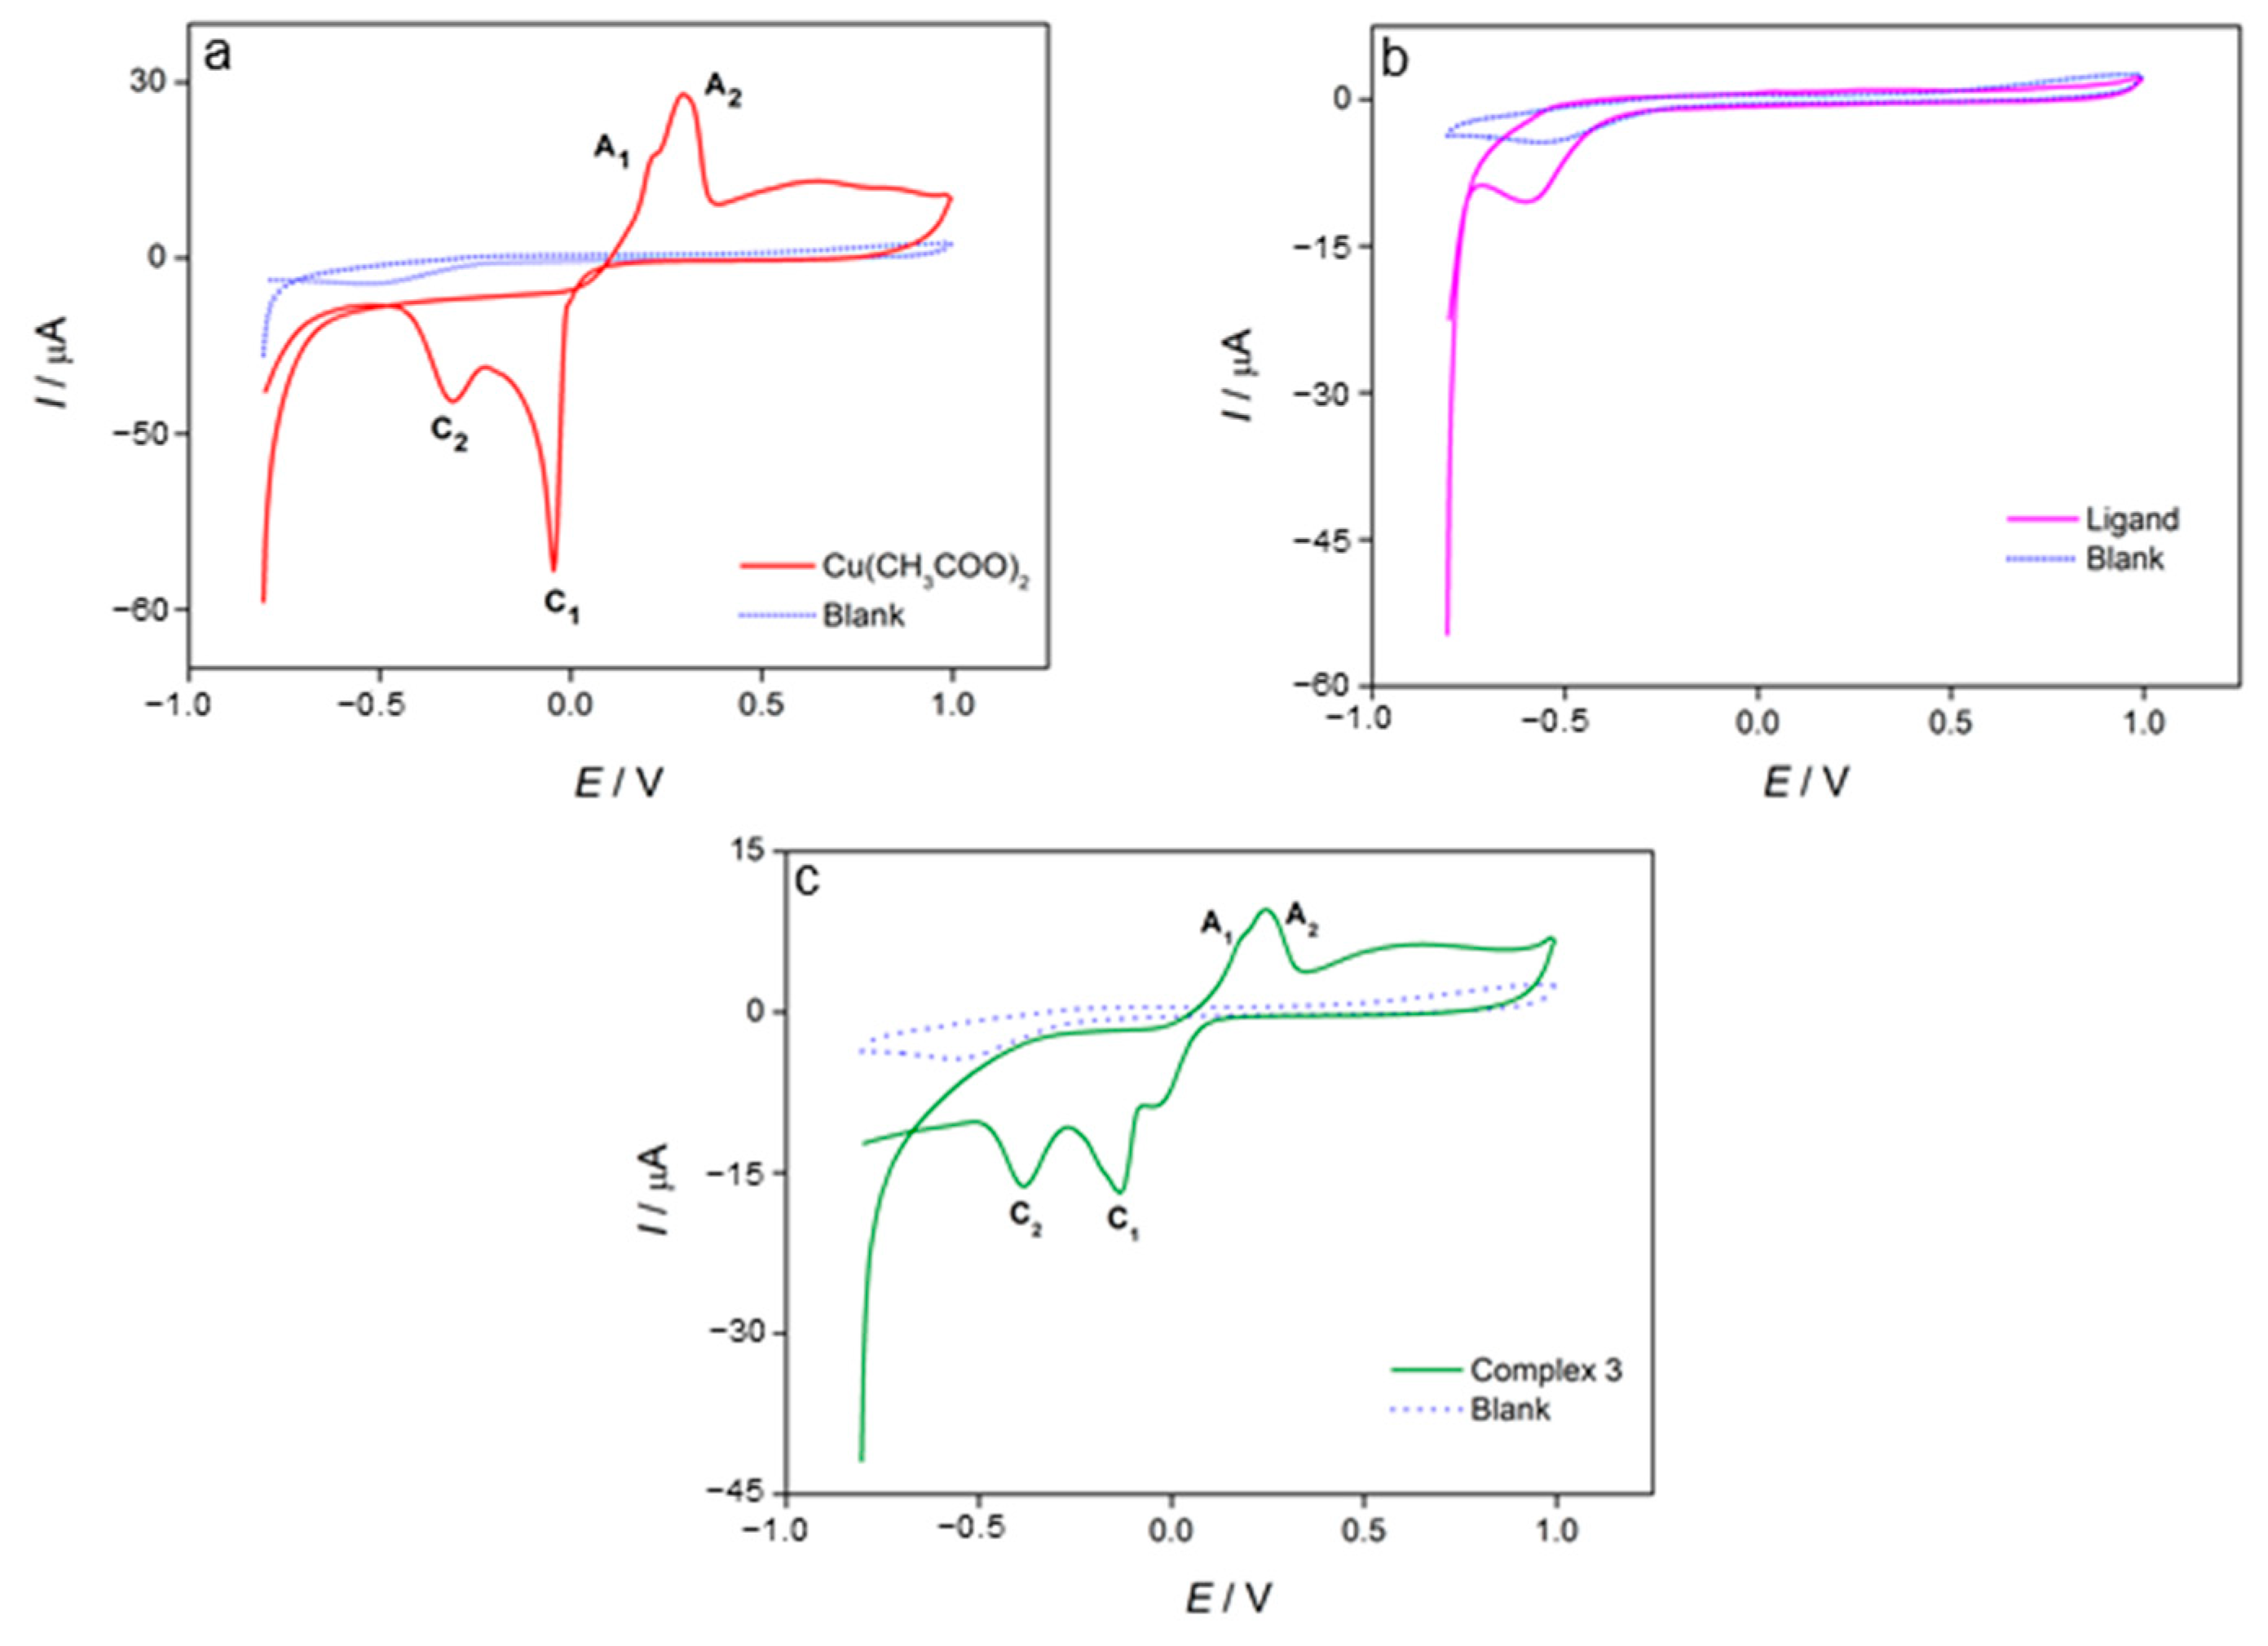
3.4. Cyclic Voltammetry

Cyclic voltammetry was used to analyse the electrochemical properties of the investigated compounds (ligand L and complexes 13). Figure 5 shows the cyclic voltammograms of copper (II) sulphate pentahydrate (CuSO4·5H2O) (Figure 3a), ligand L (Figure 5b and complex (1) (Figure 5c). The cyclic voltammogram of copper(II) sulphate pentahydrate (Figure 5a) showed two oxidation peaks, the first at the potential Ep,a,1 = 0.20 V (A1), which corresponds to the oxidation of copper from Cu0 to Cu+, and the second at the potential Ep,a,2 = 0.30 V (A2), which corresponds to the oxidation of copper from Cu+ to Cu2+. Two reduction peaks were observed at the potentials Ep,c,1 = −0.07 V (C1), corresponding to the reduction of Cu2+ to Cu+, and Ep,c,2 = −0.49 V (C2), corresponding to the reduction of Cu+ to Cu0 [39]. The cyclic voltammogram of ligand L (Figure 5b) showed no oxidation–reduction peaks. The cyclic voltammogram of complex (1) showed three oxidation current peaks (Figure 5c), with the first oxidation current peak (A1) at the potential Ep,a,1 = 0.08 V, which corresponds to the oxidation of copper in the complex, and two other oxidation current peaks related to the oxidation of free copper at the potentials Ep,a,2 = 0.20 V (A2), which corresponds to the oxidation of Cu0 to Cu+, and Ep,a,3 = 0.30 V (A3), which corresponds to the oxidation of Cu+ to Cu2+. Two reduction current peaks were observed at the potentials Ep,c,1 = −0.07 V (C1), which corresponds to the reduction of Cu2+ to Cu+, and Ep,c,2 = −0.70 V (C2), which corresponds to the reduction of Cu+ to Cu0 in the complex.
In Figure 6, the effect of scan rate on the oxidation peak potential and oxidation peak current of complex (1) was analysed. It was found that the oxidation peak current and oxidation peak potential increased with the increase in scan rate (Figure 6a). The anodic peak current (Ip,a) of the first anodic peak (A1) in a complex (1) is a linear function of the square root of the scan rate (v1/2) (R2 = 0.9672) (Figure 6b), confirming that the oxidation of copper in complex (1) is diffusion-controlled. The diffusion control was also confirmed in Figure 6c, as the linear relationship for the logarithm of the anodic peak current (log Ip,a) vs. the logarithm of the scan rate (log v) was obtained, and the slope was approximately 0.5 [48]. The oxidations peaks of free copper A2 and A3 were also analysed as the function of scan rate, and it was observed that the oxidation of free copper from Cu0 to Cu+ and from Cu+ to Cu2+ are adsorption-controlled processes since the anodic peak current (Ip,a) is a linear function of scan rate (v) and the slope of of logarithm of the anodic peak current (log Ip,a) vs. the logarithm of the scan rate (log v) line was around 1 for both peaks (shown in Figures S4 and S5 in Supplementary). The cathodic peaks that correspond to reduction of copper in complex (1) showed diffusion-controlled processes, since the cathodic peak current (Ip,c) is a linear function of the square root of scan rate (v1/2) and the slope of the of logarithm of the cathodic peak current (log Ip,c) vs. the logarithm of the scan rate (log v) line was around 0.5 for both peaks (shown in Figures S6 and S7 in the Supplementary Materials) [48].
Figure 7 shows cyclic voltammograms of Cu(NO3)2·3H2O (Figure 7a), ligand L (Figure 7b) and complex 2 (Figure 7c). The cyclic voltammogram of copper(II) nitrate trihydrate (Figure 7a) showed two oxidation peaks, the first at the potential Ep,a,1 = 0.20 V (A1), corresponding to the oxidation of copper from Cu0 to Cu+, and the second at the potential Ep,a,2 = 0.30 V (A2), corresponding to the oxidation of copper from Cu+ to Cu2+. Two reduction peaks were observed at the potentials Ep,c,1 = −0.08 V (C1), corresponding to the reduction of Cu2+ to Cu+, and Ep,c,2 = −0.36 V (C2), corresponding to the reduction of Cu+ to Cu0. The cyclic voltammogram of L (Figure 7b) showed no oxidation–reduction peaks. The cyclic voltammogram of complex 2 (Figure 7b) showed a broad oxidation peak around the potential Ep,a,1 = 0.20 V (A1), which corresponds to the oxidation of free copper to Cu2+, while the oxidation of copper in a complex was not detected. Two reduction peaks were detected at the potentials Ep,c,1 = −0.14 V (C1), corresponding to the reduction of Cu2+ to Cu+, and Ep,c,2 = −0.40 V (C2), corresponding to the reduction of Cu+ to Cu0 in the complex. The oxidations peak of free copper A1 was also analysed as the function of scan rate and it was observed that the oxidation of free copper from Cu0 to Cu2+ is under mixed adsorption-diffusion control since the anodic peak current (Ip,a) is a linear function of the square root of scan rate (v1/2), the anodic peak current (Ip,a) is a linear function of scan rate (v), and the slope of the of logarithm of the anodic peak current (log Ip,a) vs. the logarithm of the scan rate (log v) line was 0.8910 (shown in Figure S8 in Supplementary Materials). The cathodic peaks that correspond to the reduction of copper in complex (2) showed diffusion-controlled processes since the cathodic peak current (Ip,c) is a linear function of the square root of scan rate (v1/2) and the slope of the logarithm of the cathodic peak current (log Ip,c) vs. the logarithm of the scan rate (log v) line was around 0.5 for both peaks (shown in Figures S9 and S10 in Supplementary Materials) [48].
Figure 8 shows the cyclic voltammograms of Cu(CH3COO)2·2H2O (Figure 8a), ligand L (Figure 8b) and complex 3 (Figure 8c). The cyclic voltammogram of copper(II) acetate (Figure 8a) showed two oxidation peaks, the first at the potential Ep,a,1 = 0.20 V (A1), which corresponds to the oxidation of copper from Cu0 to Cu+, and the second at the potential Ep,a,2 = 0.30 V (A2), which corresponds to the oxidation of copper from Cu+ to Cu2+. Two reduction peaks were observed at the potentials Ep,c,1 = −0.05 V (C1), corresponding to the reduction of Cu2+ to Cu+, and Ep,c,2= −0.31 V (C2), corresponding to the reduction of Cu+ to Cu0. The cyclic voltammogram of the ligand (Figure 8b) showed no oxidation–reduction peaks. The cyclic voltammogram of complex 3 (Figure 8c) showed two oxidation peaks at the potentials Ep,a,1 = 0.20 V (A1), corresponding to the oxidation of free copper from Cu0 to Cu+, and Ep,a,2 = 0.30 V (A2), corresponding to the oxidation of free copper from Cu+ to Cu2+, while the oxidation of copper in a complex was not detected. Two reduction peaks were detected at the potentials Ep,c,1 = −0.14 V (C1), corresponding to the reduction of Cu2+ to Cu+, and Ep,c,2 = −0.40 V (C2), corresponding to the reduction of Cu+ to Cu0 in the complex. In Figures S11 and S12, the effect of scan rate on the oxidation peak potential and oxidation peak current of complex (3) was analysed. It was found that the oxidation peak current and oxidation peak potential increased with the increase in scan rate (Figures S11a and S12a). It was observed that the oxidation of free copper from Cu0 to Cu+ (A1) and from Cu+ to Cu2+ (A2) is under diffusion control since the anodic peak current (Ip,a) is a linear function of the square root of scan rate (v1/2) and the slope of the of logarithm of the anodic peak current (log Ip,a) vs. the logarithm of the scan rate (log v) line was around 0.5 for both peaks (shown in Figures S11 and S12 in Supplementary Materials). The cathodic peaks which correspond to the reduction of copper in complex (3) also showed diffusion-controlled processes since the cathodic peak current (Ip,c) is a linear function of the square root of scan rate (v1/2) and the slope of the logarithm of the cathodic peak current (log Ip,c) vs. the logarithm of the scan rate (log v) line was around 0.5 for both peaks (shown in Figures S13 and S14 in Supplementary Materials) [48].
A comparison of cyclic voltammograms of complexes (1), (2), and (3) is shown in Figure S15. In complex (1), the oxidation peak of copper in complex was observed, as well as the oxidation of free copper, while in complexes (2) and (3), only the oxidation of free copper was observed. In all complexes, two reduction peaks of copper in a complex were detected. From the obtained results, it can be concluded that the oxidation state of copper in all complexes is +2.

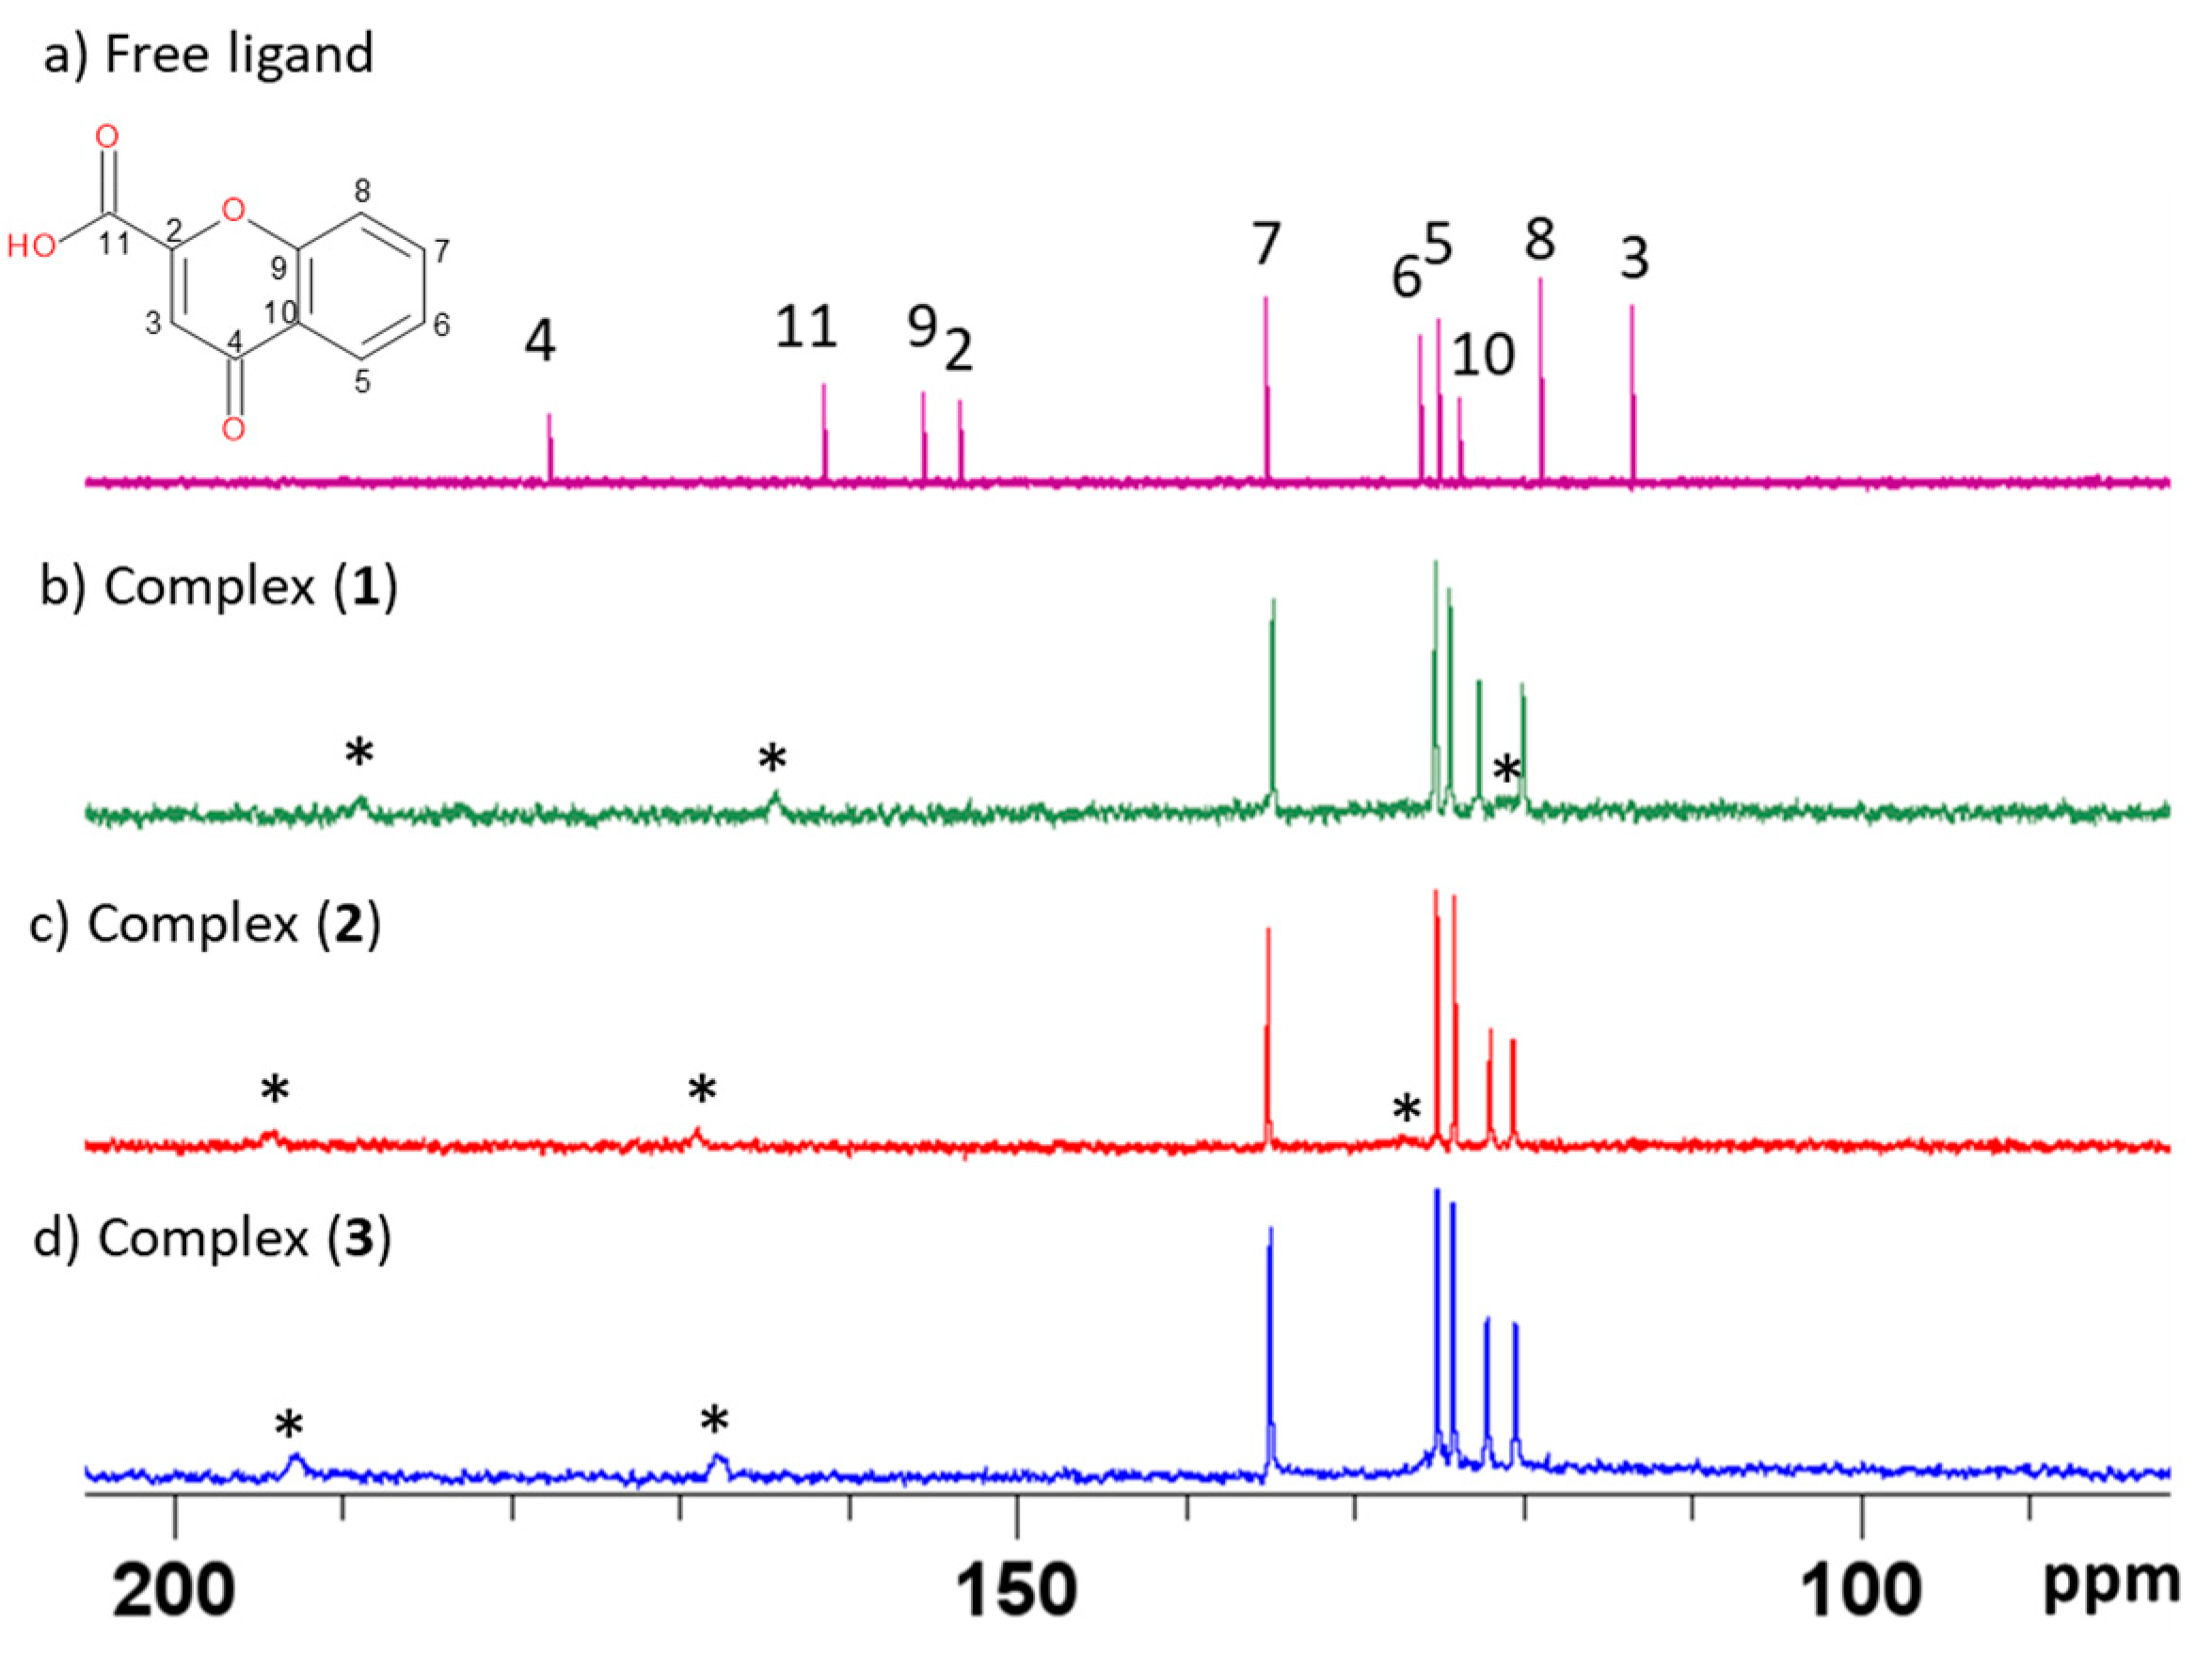
3.5. NMR Spectroscopy

The 1H and 13C NMR spectra of all complexes, with only one set of signals, look very similar in DMSO-d6 solution. Broad resonances in the range of 8.00–7.30 ppm were observed in the 1H NMR spectra of all complexes (13). To be sure, we verified the 1H spectrum with a spectral width (SW) of 170 ppm and a transmitter frequency offset (O1P) of 30 and 70 ppm, respectively, but no signal was detected in either the lower or upper magnetic field. The atomic enumeration used to assign the ligand in the NMR spectra is shown in Scheme 2.
The 13C NMR spectra of all complexes prepared were more informative than the 1H spectra. In the 13C spectra (Figure 9), two groups of signals can be recognised, one with narrower lines belonging to the free ligand and the other group belonging to the complex with three signals with very low intensity and broad lines (δ = 188.9, 164.2, 121.5 ppm (1); 194.1, 169.0, 128.4 ppm (2); 192.6, 167.6 ppm (3)). The signals of the complexes are marked with an asterisk in Figure 9. Due to the very low solubility of the complex and the presence of paramagnetic copper(II), we could not detect other signals. Due to the low concentration of the sample solution, the two-dimensional 1H-13C Heteronuclear Multiple Bond Correlation method (HMBC) also did not provide any data that would have been helpful in assigning the complexes.

4. Discussion

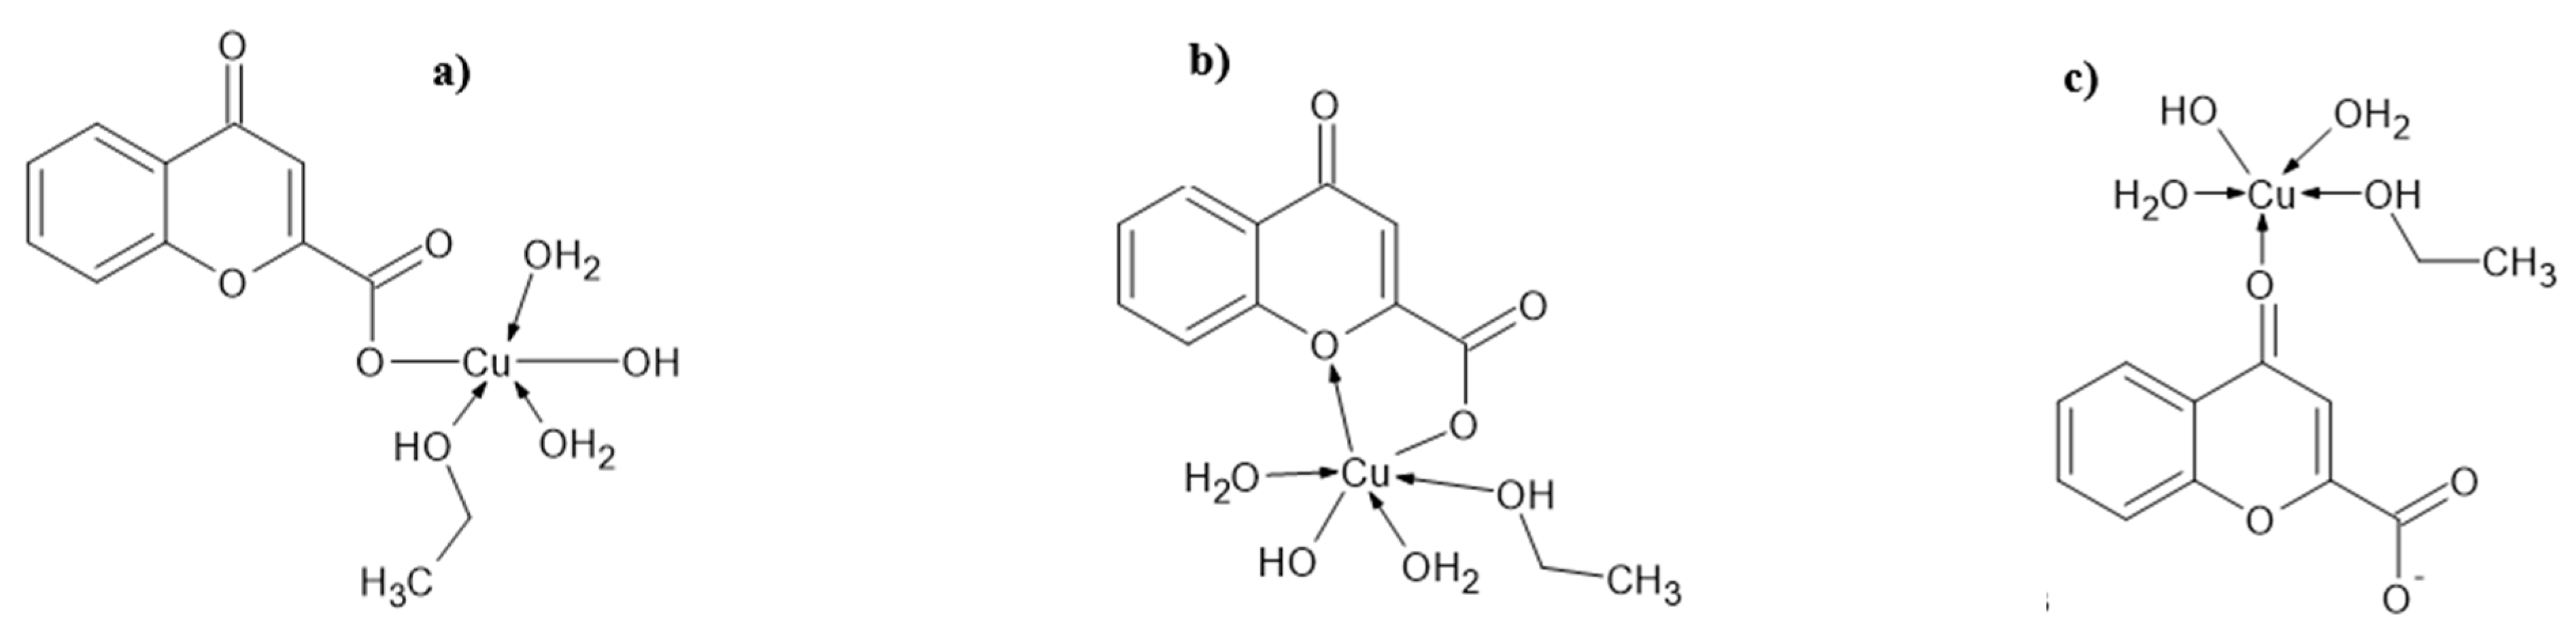
4.1. Proposed Structures of Complexes

Since it was not possible to obtain single crystals of sufficient quality, we relied on similar theoretical models from the literature to explain the structures. For structure prediction, we used previously reported crystal structures of metal complexes with 4-oxo-4H-pyrancarboxylic acids (chelidonic acid). A literature and database search revealed that carboxylates with a pyranone core exhibit different coordination modes with metal cations. The following coordination modes of ligands with metal cations are described in the literature: (a) via the oxygen of the phenon group, (b) bridging coordination and (c) chelate coordination. Ligand coordination via the phenonic group is rare, with the carboxyl group typically deprotonated depending on the charge of the metal cation. Only one reported Cu(II) complex, [Cu(H2O)5(chel)]·H2O, exhibits this coordination, in which water molecules complement the octahedral geometry. Bridging coordination is observed in Ag(I) coordination polymers and Mn(II) binuclear complexes. Similar patterns occur in divalent cations such as Cu(II), Co(II) and Zn(II), where charge neutrality is maintained by counterions or polymeric structures. Chelate coordination, in which the pyranone oxygen is involved as a donor, only occurs in Ca(II) complexes. This five-membered chelate system is thermodynamically favourable for larger cations, especially alkali and alkaline earth metals, due to the ether-like nature of the pyranone oxygen, which is consistent with the HSAB principle. The simultaneous coordination via the phenone and carboxyl groups is typical for larger cations such as Cd(II), Tb(III) and Gd(III) and leads to polymeric species. According to the results of the analysis, the molecule of complex (1) consists of a Cu cation in the +2-oxidation state, a ligand molecule, an ethanol molecule, two water molecules and a hydroxide ion. Since the oxidation state of Cu was determined to be +2 (by voltammetry and NMR analysis) and only one ligand molecule is present, it can be assumed that in the complex the ethanol molecule is coordinated in neutral form to the Cu(II) cation and one ligand molecule is coordinated in the carboxylate form. The charge of the Cu(II) cation is most likely neutralised by the coordination of the hydroxide ion. The water molecules are most likely coordinated to the Cu(II) cation, as shown by the relatively high desorption temperature of the water molecules (from 120 to 180 °C). After reviewing the crystallographic database (CSD database ver. 5.45) [49,50] and the analyses performed, three molecular structures of complex (1) can be proposed (Figure 10a–c). In all three proposed structures, the calculated amount of C and H is 40.97% and 4.58%, which is consistent with the experimentally determined values (C: 41.3% and H: 4.33%). The experimentally determined amount of copper in the compound of 19.5% also agrees well with the calculated proportion of 18.6%. Certain discrepancies in the experimentally determined proportions of water and ethanol in the compound can be explained by the possible evaporation of ethanol molecules at lower temperatures. Unfortunately, a detailed analysis of the IR spectra, which would provide information on whether ethanol is coordinated in anionic or neutral form, is not possible due to the overlap of the C–H and O–H vibrations of the ligand molecule, the water molecules and the ethanol (Figure 2a). Of the three proposed structures, structures b and c are less likely than structure a. Structure b is less likely due to the interaction of the pyranone oxygen as a hard base with the Cu(II) cation as a medium-weak acid (as noted in the previous chapter), although such coordination would lead to an octahedral geometry of the Cu(II) cation. In structure c, coordination of the phenone group to Cu(II) would have to be accompanied by a smaller shift (redshift) of the C=O vibration compared to the uncoordinated ligand, which was not observed when comparing the IR spectra of ligand and complex. Structure a, in which Cu(II) is one-dimensionally connected to the ligand, has been observed in complex compounds with kelidonic acid, but due to the presence of two carboxyl groups in this ligand, such structures are usually polymeric and the Cu(II) cation is additionally coordinated with anions or neutral molecules such as pyridine and water. Although the proposed structure a is more likely than the proposed structures b and c, since crystal structures of Cu(II) complexes in which the OH group is terminal are rare and characteristic of chelate or cyclic compounds with N-donor ligands, it cannot be claimed with certainty that this is the actual structure of complex 1. In many Cu complexes, the OH group acts as a bridging ligand between two cations (in some compounds even between three and four Cu cations), so that an alternative to the proposed structures would be structures in which the OH anion plays the role of a bridging ligand. In addition, the diffractogram of complex 1 was compared with the database of crystal structures contained in the X’Pert HighScore Plus program, and no matches were found with the Cu(II) starting salt used or with any other simple structure. According to the analytical results, complex 1 is certainly a complex with a stoichiometric ratio of 1:1 of ligand: metal and solvent molecules present. The charge of the cation is most likely neutralised by the ligand L in the deprotonated form (L) and by the terminal hydroxide ion [51,52].
CV analysis of complex (2) indicates the presence of a Cu(II) cation in the structure, and the Δν value is slightly lower than the previous compound. From the TG analysis of complex (2), the first step of thermal decomposition is due to the vaporisation of water molecules. According to the proposed structure (Figure 11), the compound contains two coordinated water molecules, one molecule per copper cation. The theoretical calculation of the water content in the compound gives a value of 12.4% and experimentally the first step of thermal decomposition gives a mass loss of 11%. The final residue after thermal analysis shows that 24% copper is present in the compound. According to the proposed structure, the calculated percentage of copper is 22%. The IR spectrum of complex (3) is similar to the previous structures, indicating a similar coordination mode. However, the TG analysis shows some differences in the low-temperature range. Unlike the previously described compounds, there are two thermal events in this interval, indicating the evaporation of water molecules in different environments (coordinated and crystalline water molecules). It can be assumed that the used copper source (Cu(CH3COO2) increases the concentration of OH ions in the synthesis.
Based on these conditions, the structure of (3) could be described as a dinuclear copper(II) complex in which the copper ions are monodentately coordinated by ligand molecules and bridged by two hydroxy anions (Figure 12). Similar structures and observations considering pH were previously reported for Cu(II) 1,10-phenanthroline and 3-nitrobenzoato complexes [43,44,45]. The first step in the TG curve shows a mass loss of 5%, which can be attributed to the evaporation of the OH bridging groups in the form of water molecules (calculated 5.5%). A similar phenomenon was previously observed in the thermal decomposition study of Cu(OH)2 close to 150 °C, and this process occurs by an oxolation mechanism [46]. The second step shows a mass loss of 8.6%, which corresponds well with the evaporation of 4 water molecules (calculated 10.1%). The final residue of 23% can be assigned to elemental Cu, which is in good agreement with the calculated value of 20.7%.
Despite the use of the same organic ligand and copper(II) ions to the prepared compounds are structurally different, even if the counterions (sulphate, nitrate, acetate) are not retained in the final crystalline structures. The resulting copper complexes exhibit a pronounced structural diversity, ranging from mononuclear to binuclear. This indicates that the initial counterions, although not present in the final products, control the self-assembly process through indirect interactions. Factors such as the different solubility of the salts, the pH of the reaction medium, the crystallisation kinetics and transient non-covalent interactions such as hydrogen bonding or ion pairing may contribute to this result. Similar trends have been described in the literature, where the use of different copper salts with identical ligands resulted in structurally different complexes. For example, Li et al. showed that different counterions (ClO4, NO3, BF4) affected the topology of Cu(II) complexes without being incorporated into the crystal structures [53]. Shin et al. also showed that the use of CuSO4 over CuSCN led to mono- or binuclear complexes, again without anion inclusion [54]. El-Faham et al. reported comparable results where different copper salts led to changes in nucleation without anion coordination [55]. La et al. reported the formation of binuclear and trinuclear Cu(II) complex compounds with salamo-like ligand driven by the presence of different counterions (Cl and ClO4). In both reported compounds, the anions are not coordinated to the Cu(II) ion. Interestingly, in the Cu(II) complex with ClO4 (CSD entry: ZIDFAX), a neutral ethanol molecule is coordinated to the Cu(II), indicating a particular affinity of this ion for ethanol coordination [56]. These findings are consistent with our results and support the notion that the nature of the metal salt can play a crucial role in determining the final structure of coordination complexes, even when anions are not present in the crystal structure.
In our study, complex 1 is a mononuclear species formed from copper(II) sulphate and the organic ligand, with the pH adjusted to 7.2 using NaOH solution. It is assumed that the mononuclear species are formed before the addition of the base, as the low initial hydroxide concentration is not sufficient to promote hydroxo-bridging or dimerization. This favours the formation of a stable mononuclear complex in which a single Cu2+ ion is coordinated by the ligand and possibly a solvent molecule, without bridging interactions. In contrast, complexes 2 and 3 are dinuclear, and each contain two μ-OH bridges between the copper centres, although the mechanism of hydroxide formation is different. Complex 2, synthesised from copper(II) nitrate under basic conditions, forms hydroxo- bridges by deprotonation of coordinated water upon addition of NaOH. Complex 3, synthesised from copper(II) acetate without the addition of a base, is based on the internal generation of OH- by the partial hydrolysis of acetate in aqueous solution. The pH rises to a slightly basic range (6.5–8.0), which is sufficient to form μ-OH bridges, but is only partially deprotonated, leaving two water molecules coordinated.
Although sulphate and nitrate ions are not present in the final complexes, their different chemical properties affect the reaction medium. Sulphate (SO42−), a hard, non-coordinating base, usually remains unbound as it has little donor ability, especially in the presence of stronger organic ligands. Its limited influence on pH under aqueous–alcoholic conditions support the formation of mononuclear complexes. Nitrate (NO3), on the other hand, is a labile and coordinating anion that can locally increase pH, facilitating water deprotonation and promoting the formation of μ-OH-bridged dinuclear species. These trends are consistent with the HSAB principle and emphasise the indirect role of the anion in determining nuclearity. Cu2+ ions typically favour five- or six-coordinate geometries, often adopting square-pyramidal or octahedral configurations. Under sulphate-based conditions with limited availability of hydroxide, the formation of a mononuclear species is favoured. When sufficient OH is present, as in nitrate and acetate systems, dinuclear complexes are formed that are stabilised by μ-OH bridges. The resulting complexes are neutral and fully coordinated, eliminating the need for counterions. This supports the conclusion that the initial anions only influence complex formation in the solution phase.
Spectroscopic data (e.g., FT-IR) confirm that none of the original anions are retained in the crystal structures, not even those classified as potentially coordinating [57,58,59,60]. For example, although sulphate is large and polarizable, it is absent in complex 1, which instead contains a coordinated ethanol molecule. A search of the Cambridge Structural Database (CSD) revealed 340 structures in which neutral ethanol coordinates to Cu2+, whereas anionic coordination is rare [61,62,63,64]. Similarly, the nitrate salt in complex 2 facilitates the deprotonation of water and the formation of dimers, while in complex 3, the acetate enables internal OH- formation. A CSD database search revealed 97 binuclear Cu–OH complexes with aromatic carboxylates, many of which were synthesised from copper(II) acetate [65,66]. These observations support the conclusion that the nuclearity of the complexes is more often determined by pH conditions and the availability of hydroxide ions than by the coordination ability of the precursor anions.
To better understand the thermodynamic stability of the obtained complexes, differential scanning calorimetry (DSC) was used to determine their decomposition enthalpies. This thermal analysis sheds light on how the structural organisation, the coordination environment around the copper centres, bridging interactions and the presence of additional coordinating molecules (such as water and ethanol) affect the energetic profile of each complex. The results clearly show that the mononuclear complex 1 has the most negative enthalpy value (–5.60 J/g), indicating the highest thermal stability of the three complexes. In contrast, the dinuclear, hydroxo-bridged complexes 2 and 3 exhibit less exothermic decomposition enthalpies of −3.27 J/g and −3.08 J/g, respectively, indicating a lower thermodynamic stability. The pronounced exothermic character of complex 1 is due to its compact mononuclear architecture, in which a single Cu2+ ion is coordinated by the organic ligand and further stabilised by two water molecules, an ethanol molecule and a hydroxide ion. A crucial factor for the increased stability is the lack of bridging interactions, which reduce the structural flexibility and potential lability of the complex and contribute to a more favourable and lower energy conformation. In addition, the coordinated ethanol molecule likely plays a role in further stabilising the structure through hydrogen bonding and solvation interactions, which help to reduce the overall energy of the system and increase thermodynamic stability [67].

4.2. Antitumour Activity

The antiproliferative effect of the complexes (13) and chromone-2-carboxylic acid as a ligand were tested against a panel of six tumour cell lines and normal human fibroblasts as markers for the selectivity of the synthesised compounds. The most potent concentration was 10−5 mol dm−3. The applied concentration showed a significant antiproliferative effect against the cell lines Hep G2, NCH-H 358, HT-29 and MRC-5. Hep G2 was suppressed by 69.5% ((2); p < 0.001); 64.8% ((3); p < 0.001); 64.0% ((1); p < 0.05). Cell growth of HT-29 cells was suppressed by 53.2% ((1); p < 0.001); 46.0% ((3); p < 0.05) and 32.5% ((2). Next, the NCH-H358 cell line (p < 0.05) was affected by the complexes as follows: 47.5% ((2); 45.6% (3) and 40.3% (1). The normal MRC-5 cell line was equally sensitive to all three complexes and showed a cell survival rate of 49.7% (p < 0.001) to 58.1% (p < 0.01). The growth of Caco-2, MDA-MB 231 and KATO III cell lines was not affected by the investigated complexes (Figure 13). The ligand shows no antiproliferative activity against any of the cell lines tested, including normal human fibroblasts. A concentration leading to 50% inhibition of cell growth (IC50) better reflects the differences between the complexes and their antiproliferative activity against the cell lines taken into evaluation. IC50 values indicate the activity of complexes (13) on the tumour cell lines, from the highest to the lowest, as follows: Hep G2 > NCI-H358 > HT-29 > KATO III > MDA-MB 231 > Caco-2 (Table 2). Based on the differences between the cell lines, the selectivity index (SI) was determined for the complexes (13). The selectivity index indicates the cytotoxic selectivity (i.e., drug safety) of the complexes against cancer cells. The selectivity index (SI) is defined as the ratio between the IC50 value of the normal cell line and the IC50 value of the cancer cell line [38]. The higher the ratio, the more effective and safer a drug would theoretically be in in vivo treatment. We considered SI values > 1.0 as significant selectivity since IC50 values are low. The selectivity index indicated that Hep G2 was the most sensitive cell line to the presentations of the complexes (SI = 1.623 (1); 1.557 (2), 1.431 (3), followed by HT-29 treated with complex (2) (SI = 1.009) and complex (3) (SI = 1.096) (Table 3). Since Caco-2 is the cell line most insensitive to the presence of complexes, we found the observed difference in sensitivity between HT-29 and Caco-2 cells very interesting, as both cell lines are colorectal adenocarcinomas.
Until now, the treatment of cancer has been based on the use of chemotherapeutic agents [68]. However, the success of platinum compounds, which are among the most common chemotherapeutic agents, is limited due to their general toxicity and the frequent occurrence of cancer resistance to this therapy [69]. Therefore, in recent years, attention has been focussed on organometallic compounds based on various metals, which offer new possibilities in the development of antitumour agents. The biological activity of such compounds strongly depends on the nature of the ligand and the metal itself. Copper is an important metal ion for the human metabolism and the function of enzymes. However, in combination with different ligands, new compounds are formed that can switch between the oxidation states (+1) and (+2), resulting in an antiproliferative effect. In some cases, copper modifies the backbone of the complex ligand and improves the affinity and specificity for DNA binding. The change in oxidation state is related to the cytotoxicity of the copper complexes synthesised to date, which have been tested in vitro and in vivo on various cell lines, including Hela, HT1080, SW872, MCF–7, A 549, Hep G2, HL-60 and normal human fibroblasts [70]. The introduction of a carboxyl group into the chromone core made the ligand more active than the methyl, ethyl and hydroxyl groups [71]. Since the ligand itself can influence cell growth, research has established that the ligand itself, i.e., chromone-2-carboxylic acid, has no antiproliferative effect. Furthermore, it is concluded that the proven antiproliferative properties of the prepared complexes are due to the effect of copper ions and their changes in oxidation states in synergy with chromone-2-carboxylic acid as well as to the assumed structure. Following the result showing that the ligand has no antiproliferative activity, we can consider it from the point of view of a prodrug. By definition, a prodrug is a compound that has little or no pharmacological activity and that is spontaneously or enzymatically modified in the body so that the bound component can become pharmacologically active [72,73]. Prodrugs can be divided into two classes: carrier-linked prodrugs and bioprecursor prodrugs [74,75]. In carrier-linked prodrugs, the drug is bound to a carrier moiety by an interim covalent bond. The rift of a carrier prodrug produces a molecular entity (active part of complex) and at least one by-product, the carrier, which may be biologically inert [76]. Since, according to the assumed structures, the copper ions are located in the centre of the resulting complexes 1–3 in the presence of coordinated water and hydroxyl groups, we can assume that upon arrival in the immediate vicinity of the cells or upon penetration into the cell, the bond between the ligand and the copper ions breaks, leading to an increase in the intracellular concentration of copper ions, which consequently leads to the death of sensitive cells such as Hep G2 cells. The released parts of the prodrug, which are components of complex 13, fulfil the requirement that all components of the prodrug except the target component, i.e., the copper ions, are non-toxic [74]. Increased copper concentrations in the cell lead to a disruption of the 3D structure of the protein, resulting in toxic stress that leads to cell death. The demonstrated antiproliferative effect of complexes 13, which are structurally quite simple compared to 8-dihydro-5H-thiopyrano [4,3-d]pyrimidine derivatives with chromone moiety, is comparable to the antiproliferative results of Sun and associates on Hep G2 cells [76]. Copper(II) complexes with 1,10-phenanthroline induced an antiproliferative effect against Hep G2 cells by inducing apoptosis via mitochondrial dysfunction, suggesting their potential as antitumour agents. In another study, the anti-cancer properties of copper(II) complexes with thiosemicarbazones on Hep G2 cells were investigated. These complexes showed potent cytotoxicity by arresting the cell cycle and inducing apoptosis, indicating their potential in the treatment of hepatoblastoma. In addition to the previously mentioned copper(II) complexes, the complexes with Schiff bases showed promotion of apoptosis on Hep G2 cells, making them potential candidates for the development of new therapeutic strategies against liver cancer. In general, the toxic effect of copper is associated with the induction of cell death by activating apoptosis as a mechanism of cell death [77,78,79,80,81]. The altered metabolism of cancer cells and the different responses of normal and tumour cells to copper exposure could pave the way for the success of copper-based anti-cancer complexes. The antiproliferative results obtained are consistent with published scientific findings [82]. Moreover, there seems to be a correlation between copper accumulation in cells and sensitivity to the metal complex in different tumour cell lines, in our case the biological activity of copper(II) coordination complexes with chromone-2-carboxylic acid. Copper accumulation occurs in some tumour cell lines because these cells have a reduced capacity to eliminate copper, leading to its accumulation and cell toxicity [70,82]. Studies on the interaction of copper compounds with Hep G2 cells indicate changes in the metabolism of lipids and lipoproteins, which could contribute to the understanding of their antitumour effect [72]. One response to these findings could be the activation of cuproptosis. Cuproptosis was first described by Tsvetkov et al. in 2022 [83]. The mechanism of cell death by cuproptosis activation is characterised by proteotoxic stress [84] due to the disruption of the function of certain mitochondrial enzymes at the Krebs cycle level [85,86]. The mechanism described differs from apoptosis, cell cycle arrest, necroptosis and ferroptosis. The observed antiproliferative effect of complexes 13 and selectivity to tumour cells may be the result of activation of cuproptosis, and investigation of the above mechanism of cell death is the next step in the study of the biological effect of copper complexes 13 with chromone-2-carboxylic acid.

5. Conclusions

Three novel copper(II) complexes with chromone-2-carboxylic acid were synthesised. Detailed spectroscopic, thermogravimetric and electrochemical analyses confirmed various structural characteristics of the complexes, including a mononuclear complex (1) and binuclear hydroxo-bridged complexes (2) and (3). All complexes showed antiproliferative activity, especially against Hep G2 cells, with noteworthy selectivity compared to normal cells. The results suggest that copper complexes can act as potential antitumour agents in synergy with the chromone ligand, while the ligand serves as a carrier (prodrug) and the therapeutic effect is mainly due to the intracellular release of Cu(II) ions. The mechanism of copper(II) complexes may be related to apoptosis or the possible activation of cuproptosis, which represents a new approach in the study of the anticancer activity of copper complexes. These results underline the importance of the choice of anions in the starting salts, which, although not incorporated into the final structures, indirectly influence the nucleation and assembly of the complexes by altering the pH and crystallisation conditions. The results support the further investigation of chromone-based transition metal complexes for the development of targeted, less toxic anticancer therapies.

Supplementary Materials

The following supporting information can be downloaded at: https://www.mdpi.com/article/10.3390/cryst15050389/s1, Figure S1. 1H (A) and 13C{1H} (B) NMR spectra of complex 1 (600 MHz, DMSO-d6, 25 °C), Figure S2. 1H (A) and 13C{1H} (B) NMR spectra of complex 2 (600 MHz, DMSO-d6, 25 °C), Figure S3. 1H (A) and 13C{1H} (B) NMR spectra of complex 3 (600 MHz, DMSO-d6, 25 °C), Figure S4. (a) The anodic peak current (Ip,a) as a function of scan rate (v) for the A2 oxidation peak in a complex (1), (b) Logarithm of anodic peak current (log Ip,a) as a function of the logarithm of scan rate (log v), Figure S5. (a) The anodic peak current (Ip,a) as a function of scan rate (v) for the A3 oxidation peak in a complex (1), (b) Logarithm of anodic peak current (log Ip,a) as a function of logarithm of scan rate (log v), Figure S6. (a) The cathodic peak current (Ip,c) as a function of the square root of scan rate (v1/2) for the C1 peak in a complex (1), (b) Logarithm of cathodic peak current (log Ip,c) as a function of the logarithm of scan rate (log v), Figure S7. (a) The cathodic peak current (Ip,c) as a function of the square root of scan rate (v1/2) for the C2 peak in a complex (1), (b) Logarithm of cathodic peak current (log Ip,c) as a function of the logarithm of scan rate (log v), Figure S8. (a) Cyclic voltammograms of complex (2) (c = 1 × 10⁻³ mol dm−3) recorded in 0.1 mol dm−3 KNO3 at different scan rates (v = 100–300 mV/s), (b) The anodic peak current (Ip,a) as a function of the square root of scan rate (v1/2) for the A1 peak in complex (2), (c) The anodic peak current (Ip,a) as a function of the square root of scan rate (v1/2) for the A1 peak in a complex (2) (d) Logarithm of anodic peak current (log Ip,a) as a function of the logarithm of scan rate (log v), Figure S9. (a) The cathodic peak current (Ip,c) as a function of the square root of scan rate (v1/2) for the C1 peak in a complex (2), (b) Logarithm of cathodic peak current (log Ip,c) as a function of the logarithm of scan rate (log v), Figure S10. (a) The cathodic peak current (Ip,c) as a function of the square root of scan rate (v1/2) for the C2 peak in a complex (2), (b) Logarithm of cathodic peak current (log Ip,c) as a function of the logarithm of scan rate (log v), Figure S11. (a) Cyclic voltammograms of complex (3) (c = 1 × 10⁻³ mol dm−3) recorded in 0.1 mol dm−3 KNO3 at different scan rates (v = 100–300 mV/s), (b) The anodic peak current (Ip,a) as a function of the square root of scan rate (v1/2) for the A1 peak in a complex (3), (b) Logarithm of anodic peak current (log Ip,a) as a function of the logarithm of scan rate (log v), Figure S12. (a) The anodic peak current (Ip,a) as a function of the square root of scan rate (v1/2) for the A2 peak in a complex (3), (b) Logarithm of anodic peak current (log Ip,a) as a function of the logarithm of scan rate (log v), Figure S13. (a) The cathodic peak current (Ip,c) as a function of the square root of scan rate (v1/2) for the C1 peak in a complex (3), (b) Logarithm of cathodic peak current (log Ip,c) as a function of the logarithm of scan rate (log v), Figure S14. (a) The cathodic peak current (Ip,c) as a function of the square root of scan rate (v1/2) for the C2 peak in a complex (3), (b) Logarithm of cathodic peak current (log Ip,c) as a function of the logarithm of scan rate (log v), Figure S15. Cyclic voltammograms of blank solution and investigated complexes (13) (c = 1 × 10⁻³ mol dm−3) recorded in 0.1 mol dm−3 KNO3. Scan rate 100 mV/s, n = 3. Table S1. IC50 values from literature for cis-Pt on panel of tested cell lines.

Author Contributions

Conceptualisation, writing—original draft preparation, writing—review and editing, formal analysis and investigation, N.F.; writing—original draft preparation, writing—review and editing, formal analysis and investigation, T.B., formal analysis, writing—original draft preparation, writing—review and editing, M.M.-K.; writing—original draft preparation, writing—review and editing, B.M.; formal analysis, writing—original draft preparation, writing—review and editing, D.G.; formal analysis, D.T.; formal analysis, writing—original draft preparation, writing—review and editing S.R.; writing—original draft preparation, writing—review and editing, formal analysis and investigation, K.M.Š. All authors have read and agreed to the published version of the manuscript.

Funding

This research received no external funding.

Data Availability Statement

The data used in this study are available upon request.

Acknowledgments

We thank Zora Popović for her support in the realisation of the conducted research.

Conflicts of Interest

The authors declare no conflicts of interest.

References

  1. Yan, Y.-L.; Miller, M.T.; Chao, Y.; Cohen, M.S. Synthesis of hidroxypyrone—Based matrix metalloproteinase inhibitors: Developing a structure—Activity relationship. Bioorg. Medic. Chem. Lett. 2009, 19, 1970–1976. [Google Scholar] [CrossRef] [PubMed]
  2. Toso, L.; Crisponi, G.; Nurchi, V.M.; Crespo-Alonso, M.; Lachowicz, J.I.; Santos, M.A.; Marques, S.M.; Niclós-Gutiérrez, J.; González-Pérez, J.M.; Domínguez-Martín, A.; et al. A family of hydroxypyrone ligands designed and synthesized as iron chelators. J. Inorg. Biochem. 2013, 127, 220–231. [Google Scholar] [CrossRef] [PubMed]
  3. Thompson, K.H.; Barta, C.A.; Orvig, C. Metal complexes of maltol and close analogues in medicinal inorganic chemistry. Chem. Soc. Rev. 2006, 35, 545–556. [Google Scholar] [CrossRef] [PubMed]
  4. Nurchi, V.M.; Crisponi, G.; Lachowicz, J.I.; Murgia, S.; Pivetta, T.; Remelli, M.; Rescigno, A.; Niclós-Gutíerrez, J.; González-Pérez, J.M.; Domínguez-Martín, A.; et al. Iron(III) and aluminum (III) complexes with hydroxypyrone ligands aimed to design kojic acid derivatives with new perspectives. J. Inorg. Biochem. 2010, 104, 560–569. [Google Scholar] [CrossRef]
  5. Kandioller, W.; Kurzwernhart, A.; Hanif, M.; Meier, S.M.; Henke, H.; Keppler, K.B.; Hartinger, C.G. Pyrone derivatives and metals: From natural products to metal–based drugs. J. Organomet. Chem. 2011, 696, 999–1010. [Google Scholar] [CrossRef]
  6. Lachowicz, J.I.; Nurchi, V.M.; Crisponi, G.; Jaraquemada-Pelaez, M.; Ostrowska, M.; Jezierska, J.; Gumienna-Kontecka, E.; Peana, M.; Zoroddu, M.A.; Choquesillo-Lazarte, D.; et al. Zinc (II) and copper (II) complexes with hydroxypyrone iron chelators. J. Inorg. Biochem. 2015, 151, 1–13. [Google Scholar] [CrossRef]
  7. Thompson, K.H.; McNeill, J.H.; Orvig, C. Vanadium compounds as insulin mimics. Chem. Rev. 1999, 99, 2561–2571. [Google Scholar] [CrossRef]
  8. Marzban, L.; McNeill, J.H. Insulin–like actions of Vanadium: Potential as a therapeutic agent. J. Tr. Elem. 2003, 16, 253–267. [Google Scholar] [CrossRef]
  9. Tsiani, E.; Fantus, I.G. Vanadium compounds: Biological actions and potential as pharmacological agents. Tr. Endo. Met. 1997, 8, 51–58. [Google Scholar] [CrossRef]
  10. Srivastava, A.K. Anti–diabetic and toxic effects of vanadium compounds. Mol. Cell. Biochem. 2000, 206, 177–182. [Google Scholar] [CrossRef]
  11. Thompson, K.H.; Liboiron, B.; Sun, Y.; Bellman, K.; Karunaratne, V.; Rawji, G.; Wheeler, J.; Sutton, K.; Bhanot, S.; Cassidy, C.; et al. Preparation and characterization of vanadyl complexes with bidentate maltol–type ligands: In vivo comparisons of anti–diabetic therapeutic potential. J. Bio. Inorg. Chem. 2003, 8, 66–74. [Google Scholar] [CrossRef] [PubMed]
  12. Domotor, O.; Aicher, S.; Schmidlehner, M.; Novak, S.M.; Roller, A.; Jakupec, M.A.; Kandioller, W.; Hartinger, C.; Keppler, B.; Enyedy, E. Antitumor pentamethylcyclopentadienyl rhodium complexes of maltol and allomaltol: Synthesis, solution speciation and bioavtivity. J. Inorg. Biochem. 2014, 134, 57–65. [Google Scholar] [CrossRef] [PubMed]
  13. Carland, M.; Tan, J.K.; White, J.M.; Stephenson, J.; Murraym, V.; Denny, W.A.; McFadyen, W.D. Synthesis, crystal structure and citotoxicity of diamine platinum (II) complexes containing maltol. J. Inorg. Biochem. 2005, 99, 1738–1743. [Google Scholar] [CrossRef]
  14. Thompson, K.H.; Chiles, J.; Yuen, V.G.; Tse, J.; McNeill, J.H.; Orvig, C. Comparison of anti-hyperglycemic effect amongst vanadium, molybdenum and other metal maltol complexes. J. Inorg. Biochem. 2004, 98, 683–690. [Google Scholar] [CrossRef] [PubMed]
  15. Livngstone, R. Rodds Chemistry of Carbon Compounds: Six Membered Ring Compounds with One Heteroatom; Elsevier: Amsterdam, The Netherlands, 1975; Chapter 20; pp. 1–397. [Google Scholar]
  16. Toso, L.; Crisponi, G.; Nurchi, V.M.; Crespo-Alonso, M.; Lachowicz, J.; Mansoori, D.; Arca, M.; Santos, M.A.; Marques, S.M.; Gano, L.; et al. Searching for new aluminium chelating agents: A family of hidroxypyrone ligands. J. Inorg. Biochem. 2014, 130, 112–121. [Google Scholar] [CrossRef]
  17. Nurchi, V.M. Kojic acid derivatives as powerfull chelators for iron (III) and aluminium(III). Dalton Trans. 2011, 40, 5984–5998. [Google Scholar] [CrossRef]
  18. Crisponi, G.; Nurchi, V.M.; Zoroddu, M.A. Iron chelating agents for iron overload diseas. Thalass. Rep. 2014, 4, 1–6. [Google Scholar]
  19. Yang, C.S.; Luo, P.; Zeng, Z.; Wang, H.; Malafa, M.; Suh, N. Vitamin E and cancer prevention: Studies with different forms of tocopherols and tocotrienols. Mol. Carcinog. 2020, 59, 365–389. [Google Scholar] [CrossRef]
  20. Aggarwal, V.; Kashyap, D.; Sak, K.; Tuli, H.S.; Jain, A.; Chaudhary, A.; Garg, V.K.; Sethi, G.; Yerer, M.B. Molecular Mechanisms of Action of Tocotrienols in Cancer: Recent Trends and Advancements. Int. J. Mol. Sci. 2019, 20, 656. [Google Scholar] [CrossRef]
  21. Trujillo, M.; Kharbanda, A.; Corley, C.; Simmons, P.; Allen, A.R. Tocotrienols as an Anti-Breast Cancer Agent. Antioxidants 2021, 10, 1383. [Google Scholar] [CrossRef]
  22. Zhou, T.; Kong, X.-L.; Hider, R.C. Synthesis and iron chelating properties of hydroxypyridinone and hydroxypyranone hexadentate ligands. Dalton Trans. 2019, 10, 1–8. [Google Scholar] [CrossRef]
  23. Hsieh, W.-Y.; Liu, S. Synthesis and Characterization of Cr (III) Complexes with 3-Hydroxy-4-Pyrones and 1,2-Dimethyl-3-Hydroxy-4-Pyridinone (DMHP): X-Ray Crystal Structures of Cr (DMHP)3 · 12H2O and Cr(ma)3. Synth. React. Inorg. Met. Org Nano-Met. Chem. 2005, 35, 61–70. [Google Scholar] [CrossRef]
  24. Nurchi, V.M.; Crisponi, G. Equilibrium studies of new bis-hidroxypyrone derivatives with Fe3+, Al3+, Cu2+, Zn2+. J. Inorg. Chem. 2018, 189, 103–114. [Google Scholar]
  25. Gomez-Ruiz, S.; Maksimović-Ivanić, D.; Mijatović, S.; Kaluđerović, G.N. On the discovery, biological effects and use of cisplatin and metallocenes in anticancer chemotherapy. Bioinorg. Chem. Appl. 2012, 20, 140284. [Google Scholar] [CrossRef] [PubMed]
  26. Dasari, S.; Bernard Tchoounwou, P. Cisplatin in cancer therapy: Molecular mechanisms of action. Eur. J. Pharm. 2014, 740, 364–378. [Google Scholar] [CrossRef] [PubMed]
  27. Alderden, R.A.; Hall, D.M.; Hambley, T.W. The discovery and development of cisplatin. J. Chem. Educ. 2006, 83, 728. [Google Scholar] [CrossRef]
  28. Tapiero, H.; Townsend, K.D. Trace elements in human physiology and patology. Copper. Biom. Pharm. 2003, 57, 386–398. [Google Scholar] [CrossRef]
  29. Angelova, M.; Asenova, S.; Nedkova, V.; Koleva-Kolarova, R. Copper in the human organism. Tr. J. Sci. 2011, 9, 88–98. [Google Scholar]
  30. Pavelkova, M. Biological role of copper as an essential trace element in the human organism. Slov. Farm. 2018, 67, 143–153. [Google Scholar] [CrossRef]
  31. Mishra, A.; Shukla, D.; Saraf, M. Copper: Its biological role and toxicity. J. Ind. Soc. 2019, 98, 26–36. [Google Scholar]
  32. Watir, S.M.; Ghobrial, I. Copper deficiency, a new triad: Anemia, leucopenia and myeloneuropathy. J. Com. Hosp. Intern. Med. Persp. 2017, 7, 265–268. [Google Scholar]
  33. Hart, P.; Galtrey, C.M.; Paviour, D.C.; Htut, M. Clinical Biochemistry: Metabolic and Clinical Aspects, 3rd ed.; Chapter 36, Biochemical Aspects of Nerological Disease; Churcill Livngstone: London, UK, 2014; pp. 683–701. [Google Scholar]
  34. Molinaro, C.; Martoriati, A.; Pelinski, L.; Caillau, K. Cooper complexes as anticancer agents targeting topoisomerases I and II. Cancers 2020, 12, 2863. [Google Scholar] [CrossRef]
  35. Hussain, A. Copper (II) complexes as potential anticancer and nonsteroidal anti-inflammatory agents: In vivo and in vitro studies. Nature 2019, 9, 5237. [Google Scholar] [CrossRef]
  36. Marzano, C.; Pellei, M.; Tisato, F.; Santini, C. Copper complexes as anticancer agents. Antican. Agen. Med. Chem. 2009, 9, 185–211. [Google Scholar] [CrossRef] [PubMed]
  37. Soltys, L.; Olkhovyy, O.; Tatarchuk, T.; Naushad, M. Green Synthesis of Metal and Metal Oxide Nanoparticles: Principles of Green Chemistry and Raw Materials. Magnetochemistry 2021, 7, 145. [Google Scholar] [CrossRef]
  38. Ratan, Z.A.; Haidere, M.F.; Nurunnabi, M.; Shahriar, S.M.; Ahammad, A.J.S.; Shim, Y.Y.; Reaney, M.J.T.; Cho, J.Y. Green Chemistry Synthesis of Silver Nanoparticles and Their Potential Anticancer Effects. Cancers 2020, 12, 855. [Google Scholar] [CrossRef] [PubMed]
  39. Cannavacciuolo, C.; Pagliari, S.; Frigerio, J.; Giustra, C.M.; Labra, M.; Campone, L. Natural Deep Eutectic Solvents (NADESs) Combined with Sustainable Extraction Techniques: A Review of the Green Chemistry Approach in Food Analysis. Foods 2023, 12, 56. [Google Scholar] [CrossRef]
  40. Brza, M.A.; Aziz, S.B.; Anuar, H.; Al Hazza, M.H.F. From Green Remediation to Polymer Hybrid Fabrication with Improved Optical Band Gaps. Int. J. Mol. Sci. 2019, 20, 3910. [Google Scholar] [CrossRef]
  41. Krasnowskaya, O.; Naumov, A.; Guk, D.; Gorelkin, P.; Erofeev, A.; Beloglazkina, E.; Majouga, A. Cooper coordination compounds as biologically active agents. Int. J. Mol. Sci. 2020, 21, 3965. [Google Scholar] [CrossRef]
  42. Liang, J.X.; Zhong, H.J.; Yang, G.; Vellaisamy, K.M.; Leung, C.H. Recent development of transition metal complexes with in vivo tumor activity. J. Inorg. Biochem. 2017, 77, 276–286. [Google Scholar] [CrossRef]
  43. Gashemi, M.; Turnbull, T.; Sebastian, S.; Kempson, I. The MTT Assay: Utility, Limitations, Pitfalls, and Interpretation in Bulk and Single-Cell Analysis. Int. J. Mol. Sci. 2021, 22, 12817. [Google Scholar] [CrossRef]
  44. Lica, J.J.; Wieczór, M.; Grabe, G.J.; Heldt, M.; Jancz, M.; Misiak, M.; Gucwa, K.; Brankiewicz, W.; Maciejewska, N.; Stupak, A.; et al. Effective Drug Concentration and Selectivity Depends on Fraction of Primitive Cells. Int. J. Mol. Sci. 2021, 22, 4931. [Google Scholar] [CrossRef]
  45. Bézivin, C.; Tomasi, S.; Lohézic-Le Dévéhat, F.; Boustie, J. Cytotoxic activity of some lichen extracts on murine and human cancer cell lines. Phytomedicine 2003, 10, 499–503. [Google Scholar] [CrossRef] [PubMed]
  46. Wu, J.-J.; Wang, W.-T.; Wang, M.; Liu, H.; Pan, H.-C. Electrochemical Behavior and Direct Quantitative Determination of Tanshinone IIA in Micro-emulsion. Int. J. Electrochem. Sci. 2016, 11, 5165–5179. [Google Scholar] [CrossRef]
  47. Groom, C.R.; Bruno, I.J.; Lightfoot, M.P.; Ward, S.C. The Cambridge structural database. Acta Crystallogr. Sect. B Struct. Sci. Cryst. Eng. Mater. 2016, B72, 171–179. [Google Scholar] [CrossRef] [PubMed]
  48. Masood, Z.; Muhammad, H.; Tahiri, I.A. Comparison of Different Electrochemical Methodologies for Electrode Reactions: A Case Study of Paracetamol. Electrochem 2024, 5, 57–69. [Google Scholar] [CrossRef]
  49. Eubank, K.F.; Kravtsov, V.C.; Eddaoudi, M. Synthesis of Organic Photodimeric Cage Molecules Based on Cycloaddition via Metal−Ligand Directed Assembly. J. Am. Chem. Soc. 2007, 129, 5820–5821. [Google Scholar] [CrossRef]
  50. Tseberlidis, G.; Intrieri, D.; Caselli, A. Catalytic Applications of Pyridine-Containing Macrocyclic Complexes. Eur. J. Inorg. Chem. 2017, 30, 3589–3603. [Google Scholar] [CrossRef]
  51. Chaudhary, N.K. Metal Complexes of a Novel Schiff Base Based on Penicillin: Characterization, Molecular Modeling, and Antibacterial Activity Study. Bioinorg. Chem. Appl. 2017, 4, 1–13. [Google Scholar] [CrossRef]
  52. Deacon, G.B.; Phillips, R.J. Relationship between the carbon-oxygen stretching frequencies of carboxylato complexes and he type of carboxylate coordination. Coord. Chem. Rev. 1980, 33, 227. [Google Scholar] [CrossRef]
  53. Li, J.; Zhang, Y.; Wang, C.; Liu, H.; Zhao, D. Effect of Anions on the Structure and Properties of Copper(II) Complexes with Schiff Base Ligands. J. Mol. Struct. 2024, 1298, 135123. [Google Scholar]
  54. Shin, J.; Hong, S.; Cho, W.; Kim, J. Dinuclear and Mononuclear Copper(II) Complexes: Structural Control by the Choice of Metal Salt. Inorg. Chim. Acta 2001, 318, 207–214. [Google Scholar]
  55. El-Faham, A.; El-Gammal, O.; Khalifa, M. Mononuclear versus Dinuclear Copper(II) Complexes: Role of the Metal Salt in Coordination Diversity. J. Mol. Struct. 2021, 1236, 130306. [Google Scholar]
  56. La, Y.-T.; Yan, Y.-J.; Gan, L.-L.; Xu, L.; Dong, W.-K. Novel phenoxo-bridged di- and tri-nuclear Cu(II) salamo-like complexes driven by various counter-anions. Inorganica Chim. Acta 2023, 546, 121336. [Google Scholar] [CrossRef]
  57. Díaz, P.; Benet-Buchholz, J.; Vilar, R.; White, A.J. Anion influence on the structures of a series of copper(II) metal-organic frameworks. Inorg. Chem. 2006, 20, 1617–1626. [Google Scholar] [CrossRef] [PubMed]
  58. Gatto, C.C.; Dias, L.M.; Paiva, C.A.; da Silva, I.C.R.; Freire, D.O.; Tormena, R.P.I.; Nascimento, É.C.M.; Martins, J.B.L. Effects of changing ions on the crystal design, non-covalent interactions, antimicrobial activity, and molecular docking of Cu(II) complexes with a pyridoxalhydrazone ligand. Front. Chem. 2024, 12, 1347370. [Google Scholar] [CrossRef]
  59. Fonari, A.; Leonova, E.S.; Yu, M. On justification of Cu(II) environment in mononuclear complexes: Joint X-ray and AIM studies. Polyhedron 2011, 30, 1710–1717. [Google Scholar] [CrossRef]
  60. Patel, A.K.; Jadeja, R.N.; Roy, H.; Pate, R.N.; Patel, S.K.; Butcher, R.J.; Cortijo, M.; Herrero, S. Copper(II) hydrazone complexes with different nuclearities and geometries: Synthesis, structural characterization, antioxidant SOD activity and antiproliferative properties. Polyhedron 2020, 186, 114624. [Google Scholar] [CrossRef]
  61. Available online: https://www.ccdc.cam.ac.uk/solutions/software/csd/ (accessed on 15 February 2025).
  62. Taş, M.; Yeşilel, O.Z.; Büyükgüngör, O. Novel Copper(II) Complexes of N-Phenylanthranilic Acid Containing Ethanol and Hydroxo Ligands. J. Inorg. Organomet. Polym. Mater. 2010, 20, 298–305. [Google Scholar] [CrossRef]
  63. Vrdoljak, V.; Pavlović, G.; Maltar-Strmečki, N.; Cindrić, M. Copper(ii) hydrazone complexes with different nuclearities and geometries: Synthetic methods and ligand substituent effects. New J. Chem. 2016, 40, 9263–9274. [Google Scholar] [CrossRef]
  64. Paine, T.K.; Weyhermüller, T.; Wieghardt, K.; Chaudhuri, P. The Methanol−Methanolate CH3OH···OCH3-Bridging Ligand: Tuning of Exchange Coupling by Hydrogen Bonds in Dimethoxo-Bridged Dichromium(III) Complexes. Inorg. Chem. 2002, 41, 6538–6540. [Google Scholar] [CrossRef] [PubMed]
  65. Clark, C.; Sephton, B.; Sephton, A.; Dugmore, T.; Hickson, M.; Betz, R. Crystal structure of bis((μ2-hydroxo)-aqua-(1,10-phenanthroline-κ2N,N′)-copper(II))bis((μ2-hydroxo)-(carbonato-κO)-(1,10-phenanthroline-κ2N,N′)-copper(II)) tetradecahydrate, C50H64Cu4N8O26. Z. Fur. Krist. New Cryst. Struct. 2015, 230, 168–170. [Google Scholar] [CrossRef]
  66. Zhang, Y.-Y.; Zhao, H.; Yang, E.-C.; Liu, Z.-Y.; Shang, Q.; Zhao, X.-J. Triazolate-based 3D frameworks and a 2D layer with centrosymmetric CuII7, CuII5, CuII4 clusters and tunable interlayer/interchain compactness: Hydrothermal syntheses, crystal structures and magnetic properties. Dalton Trans. 2015, 44, 5826–5836. [Google Scholar] [CrossRef]
  67. Leyva-Porras, C.; Cruz-Alcantar, P.; Espinosa-Solís, V.; Martínez-Guerra, E.; Piñón-Balderrama, C.I.; Compean Martínez, I.; Saavedra-Leos, M.Z. Application of Differential Scanning Calorimetry (DSC) and Modulated Differential Scanning Calorimetry (MDSC) in Food and Drug Industries. Polymers 2020, 12, 5. [Google Scholar] [CrossRef]
  68. Xi, Y.; Xu, P. Global colorectal cancer burden in 2020 and projections to 2040. Transl. Oncol. 2021, 14, 101174. [Google Scholar] [CrossRef] [PubMed]
  69. Tardito, S.; Luciano, M. Copper Compounds in Anticancer Strategies. Curr. Med. Chem. 2009, 16, 1325–1348. [Google Scholar] [CrossRef] [PubMed]
  70. Sigman, D.S.; Graham, D.R.; D’Aurora, V.; Stern, A.M. Oxygendependent cleavage of DNA by the 1,10-phenanthroline cuprous complex. Inhibition of Escherichia coli DNA polymerase I. J. Biol. Chem. 1979, 254, 12269–12272. [Google Scholar] [CrossRef]
  71. Mohsin, N.u.A.; Irfan, M.; Hassan, S.; Sallem, U. Current Strategies in Development of New Chromone Derivatives with Diversified Pharmacological Activities: A Review. Pharm. Chem. J. 2020, 54, 241–257. [Google Scholar] [CrossRef]
  72. Zhao, K.; Huang, J.; Zhao, Y.; Wang, S.; Xu, J.; Yin, K. Targeting STING in cancer: Challenges and emerging opportunities. Biochim. Biophys. Acta Rev. Cancer 2023, 1878, 188983. [Google Scholar] [CrossRef]
  73. Markovic, M.; Ben-Shabat, S.; Dahan, A. Prodrugs for Improved Drug Delivery: Lessons Learned from Recently Developed and Marketed Products. Pharmaceutics 2020, 12, 1031. [Google Scholar] [CrossRef]
  74. Abet, V.; Filace, F.; Recio, J.; Alvarez-Builla, J.; Burgos, C. Prodrug approach: An overview of recent cases. Eur. J. Med. Chem. 2017, 127, 810–827. [Google Scholar] [CrossRef] [PubMed]
  75. Wu, K.M. A New Classification of Prodrugs: Regulatory Perspectives. Pharmaceuticals 2009, 2, 77–81. [Google Scholar] [CrossRef]
  76. Sun, C.; Chen, C.; Xu, S.; Wang, J.; Zhu, Y.; Kong, D.; Tao, H.; Jin, M.; Zheng, P.; Zhu, W. Synthesis and anticancer activity of novel 4-morpholino-7,8-dihydro-5H-thiopyrano[4,3-d]pyrimidine derivatives bearing chromone moiety. Bioorg. Med. Chem. 2016, 24, 3862–3869. [Google Scholar] [CrossRef]
  77. Que, B.G.; Downey, K.M.; So, A.G. Degradation of deoxyribonucleic acid by a 1,10-phenanthroline-copper complex: The role of hydroxyl radicals. Biochemistry 1980, 19, 5987–5991. [Google Scholar] [CrossRef] [PubMed]
  78. Sigman, D.S. Nuclease activity of 1,10-phenanthroline-copper ion. ACC Chem. Res. 1986, 1, 180–186. [Google Scholar] [CrossRef]
  79. Dizdaroglu, M.; Aruoma, O.I.; Halliwell, B. Modification of bases in DNA by copper ion1,10-phenanthroline complexes. Biochemistry 1990, 29, 8447–8451. [Google Scholar] [CrossRef] [PubMed]
  80. Tsang, S.Y.; Tam, S.C.; Bremner, I.; Burkitt, M.J. Copper-1,10-phenanthroline induces internucleosomal DNA fragmentation in HepG2 cells, resulting from direct oxidation by the hydroxyl radical. Biochem. J. 1996, 317, 13–16. [Google Scholar] [CrossRef]
  81. Katsarou, M.E.; Efthimiadou, E.K.; Psomas, G.; Karaliota, A.; Vourloumis, D. Novel copper (II) complex of N-propyl-norfloxacinand 1,10-phenanthroline with enhanced antileukemic and DNA nuclease activities. J. Med. Chem. 2008, 51, 470–478. [Google Scholar] [CrossRef]
  82. Singh, N.K.; Yadav, P.N.; Kumbhar, A.A.; Pokhrel, Y.R. Anticancer potency of copper(II) complexes of thiosemicarbazones. J. Inorg. Biochem. 2020, 210, 111134. [Google Scholar] [CrossRef]
  83. Tsvetkov, P.; Coy, S.; Petrova, B.; Dreishpoon, M.; Verma, A.; Abdusamad, M.; Rossen, J.; Joesch-Cohen, L.; Humeidi, R.; Spangler, R.D.; et al. Copper induces cell death by targeting lipoylated TCA cycle proteins. Science 2022, 375, 1254–1261. [Google Scholar] [CrossRef]
  84. Cong, Y.; Li, N.; Zhang, Z.; Zhao, Z. Cuproptosis: Molecular mechanisms, cancer prognosis, and therapeutic applications. J. Transl. Med. 2025, 23, 104. [Google Scholar] [CrossRef] [PubMed]
  85. Kahlson, M.A.; Dixon, S.J. Copper-induced cell death. Science 2022, 18, 1231–1232. [Google Scholar] [CrossRef] [PubMed]
  86. Ji, P.; Wang, P.; Chen, H.; Xu, Y.; Ge, J.; Tian, Z.; Yan, Z. Potential of Copper and Copper Compounds for Anticancer Applications. Pharmaceuticals 2023, 16, 234. [Google Scholar] [CrossRef] [PubMed]
Figure 1. Structure formula of 3-hydroxy-2-methylpyran-4-one (a) and benzopyran-4-one (b).
Crystals 15 00389 g001
Scheme 1. Reaction scheme for obtaining complexes 13. The reaction scheme shows the synthesis routes of the produced complexes 1–3. Complex 1 was obtained by solution synthesis from copper(II) sulphate pentahydrate and chromone-2-carboxylic acid (L) in a stoichiometric ratio of 1:1. Three possible structures were obtained, labelled (a,b,c). The other two complexes were obtained by the reaction of the same ligand L and salt; copper(II) nitrate trihydrate (complex 2) and copper(II) acetate dihydrate (complex 3). All compounds were obtained at room temperature and atmospheric pressure.
Crystals 15 00389 sch001
Figure 2. (ac) IR spectra of the pure ligand and complexes studied (13), (d) overlap of the figures (ac).
Crystals 15 00389 g002
Figure 3. TG/DSC curves of 13 (ac) heated in an oxygen atmosphere to 600 °C at a rate of 10 °C min−1.
Crystals 15 00389 g003
Figure 4. Stacked diffractograms of complexes 13 and free ligand. The step size of data acquisition was 0.02°, 140 s per step.
Crystals 15 00389 g004
Figure 5. Cyclic voltammograms of blank solution and investigated compounds (c = 1 × 10⁻³ mol dm−3): (a) CuSO4·5H2O, (b) ligand L and (c) complex (1), recorded in 0.1 mol dm−3 KNO3. Scan rate 100 mV/s, n = 3.
Crystals 15 00389 g005
Figure 6. (a) Cyclic voltammograms of compound (1) (c = 1 × 10⁻³ mol dm−3) recorded in 0.1 mol dm−3 KNO3 at different scan rates (v = 100–300 mV/s), (b) the anodic peak current (Ip,a) of anodic peak A1 as a function of the square root of scan rate (v1/2) for the compound (1), (c) logarithm of anodic peak current (log Ip,a) as a function of logarithm of scan rate (log v).
Crystals 15 00389 g006
Figure 7. Cyclic voltammograms of blank solution and investigated compounds (c = 1 × 10⁻³ mol dm−3): (a) Cu(NO3)2·3H2O, (b) ligand L and (c) complex (2) recorded in 0.1 mol dm−3 KNO3. Scan rate 100 mV/s, n = 3.
Crystals 15 00389 g007
Figure 8. Cyclic voltammograms of blank solution and investigated compounds (c = 1 × 10⁻³ mol dm−3): (a) Cu(CH3COO)2·2H2O, (b) ligand L and (c) complex (3) recorded in 0.1 mol dm−3 KNO3. Scan rate 100 mV/s, n = 3.
Crystals 15 00389 g008
Scheme 2. Enumeration scheme of ligand used for assignment of NMR spectra.
Crystals 15 00389 sch002
Figure 9. A 150 MHz 13C NMR spectrum of (a) the free ligand with signal atoms assignments, (b) of complex (1), (c) complex (2) and (d) complex (3). The signals of the 13C atoms of the complex are marked with an asterisk.
Crystals 15 00389 g009
Figure 10. Proposed structures of complex (1).
Crystals 15 00389 g010
Figure 11. Proposed structure of complex (2).
Crystals 15 00389 g011
Figure 12. Proposed structure of complex (3).
Crystals 15 00389 g012
Figure 13. Antiproliferative effect of complexes (13) and ligand L. Data are presented as a percentage of cell viability (CV, %) as a function of concentration range. Bars represent the mean of three independent experiments performed in triplicate, and error bars correspond to SD. Values marked with (*; §; #) are statistically meaningful: (*) p < 0.05; (§) p < 0.01; (#) p < 0.001.
Crystals 15 00389 g013
Table 1. TGA analysis of the decomposition of complexes 1–3.
First StepSecond StepThird StepResidue
Temperature Range (°C)Temperature Range (°C)Temperature Range (°C)Temperature Range (°C)
Weight Loss (%)
exp./theo.
Weight Loss (%)
exp./theo.
Weight Loss (%)
exp./theo.
Weight Loss (%)
exp./theo.
Complex 160–120 °C120–180 °C260–320 °Cat 600 °C
Solvent molecules
20.9%/22.2%
H2O
11.3%/10.3%
Ligand molecules
55%/54.1%
CuO
19.5%/18.6%
Complex 260–180 °C220 °C/at 600 °C
H2O
11.7%/12.1%
Ligand molecules
57%/60%
/CuO
19.68%/22%
Complex 360–180 °C 240 °C/at 600 °C
H2O
11%/11.7%
Ligand molecules
63.5%/66%
/CuO
18.4%/20.7%
Table 2. Concentration of complexes (13) and ligand L that exerts 50% inhibition with respect to untreated cells (IC50). Data are presented as mean and standard deviation (x(SD)) of three independent experiments. Non-significant (n.s.) = IC50 > 100 µM.
Cell LinesIC50/µM
Complex (1)Complex (2)Complex (3)Ligand (L)
MDA-MB 23115.6 (1.6)15.7 (2.4)16.6 (0.4)n.s.
NCI-H35810.5 (1.3)10.9 (0.7)11.9 (1.3)n.s.
KATO III13.2 (1.8)13.4 (1.7)11.7 (3.1)n.s.
Hep G26.1 (0.8)7.0 (0.9)7.2 (1.2)n.s.
Caco-218.3 (0.7)19.0 (1.3)18.4 (2.7)n.s.
HT-2913.5 (2.8)10.8 (1.2)9.4 (1.5)n.s.
MRC-59.9 (0.6)10.9 (1.9)10.3 (1.1)n.s.
Table 3. Selectivity index (SI) of complexes (13). * SI values ≥ 1.0 were considered as significant selectivity. Student t-test was applied for comparisons among complexes (13) on each cell line (a—complexes (1) and (2); b—complexes (2) and (3); c—complexes (1) and (3). p < 0.05 (*).
Cell LinesSelectivity Index (SI)
Complex (1)Complex (2)Complex (3)
MDA-MB 2310.6350.6940.620
NCI-H3580.9431.000 b0.866
KATO III0.7500.8130.880 c
Hep G21.623 *1.557 *1.431 *
Caco-20.5410.5740.560
HT-290.733 b1.009 a1.096 c
Disclaimer/Publisher’s Note: The statements, opinions and data contained in all publications are solely those of the individual author(s) and contributor(s) and not of MDPI and/or the editor(s). MDPI and/or the editor(s) disclaim responsibility for any injury to people or property resulting from any ideas, methods, instructions or products referred to in the content.

