3.1. Mechanical Properties and Morphology of Binary BioPET/BioPA Blends
It has been reported that mechanical properties of PET are highly dependent on the processing conditions [
36,
37]. In addition, the mechanical properties of PET polymers are also dependent on the thermal treatment, quenching, annealing, etc. As it can be seen in
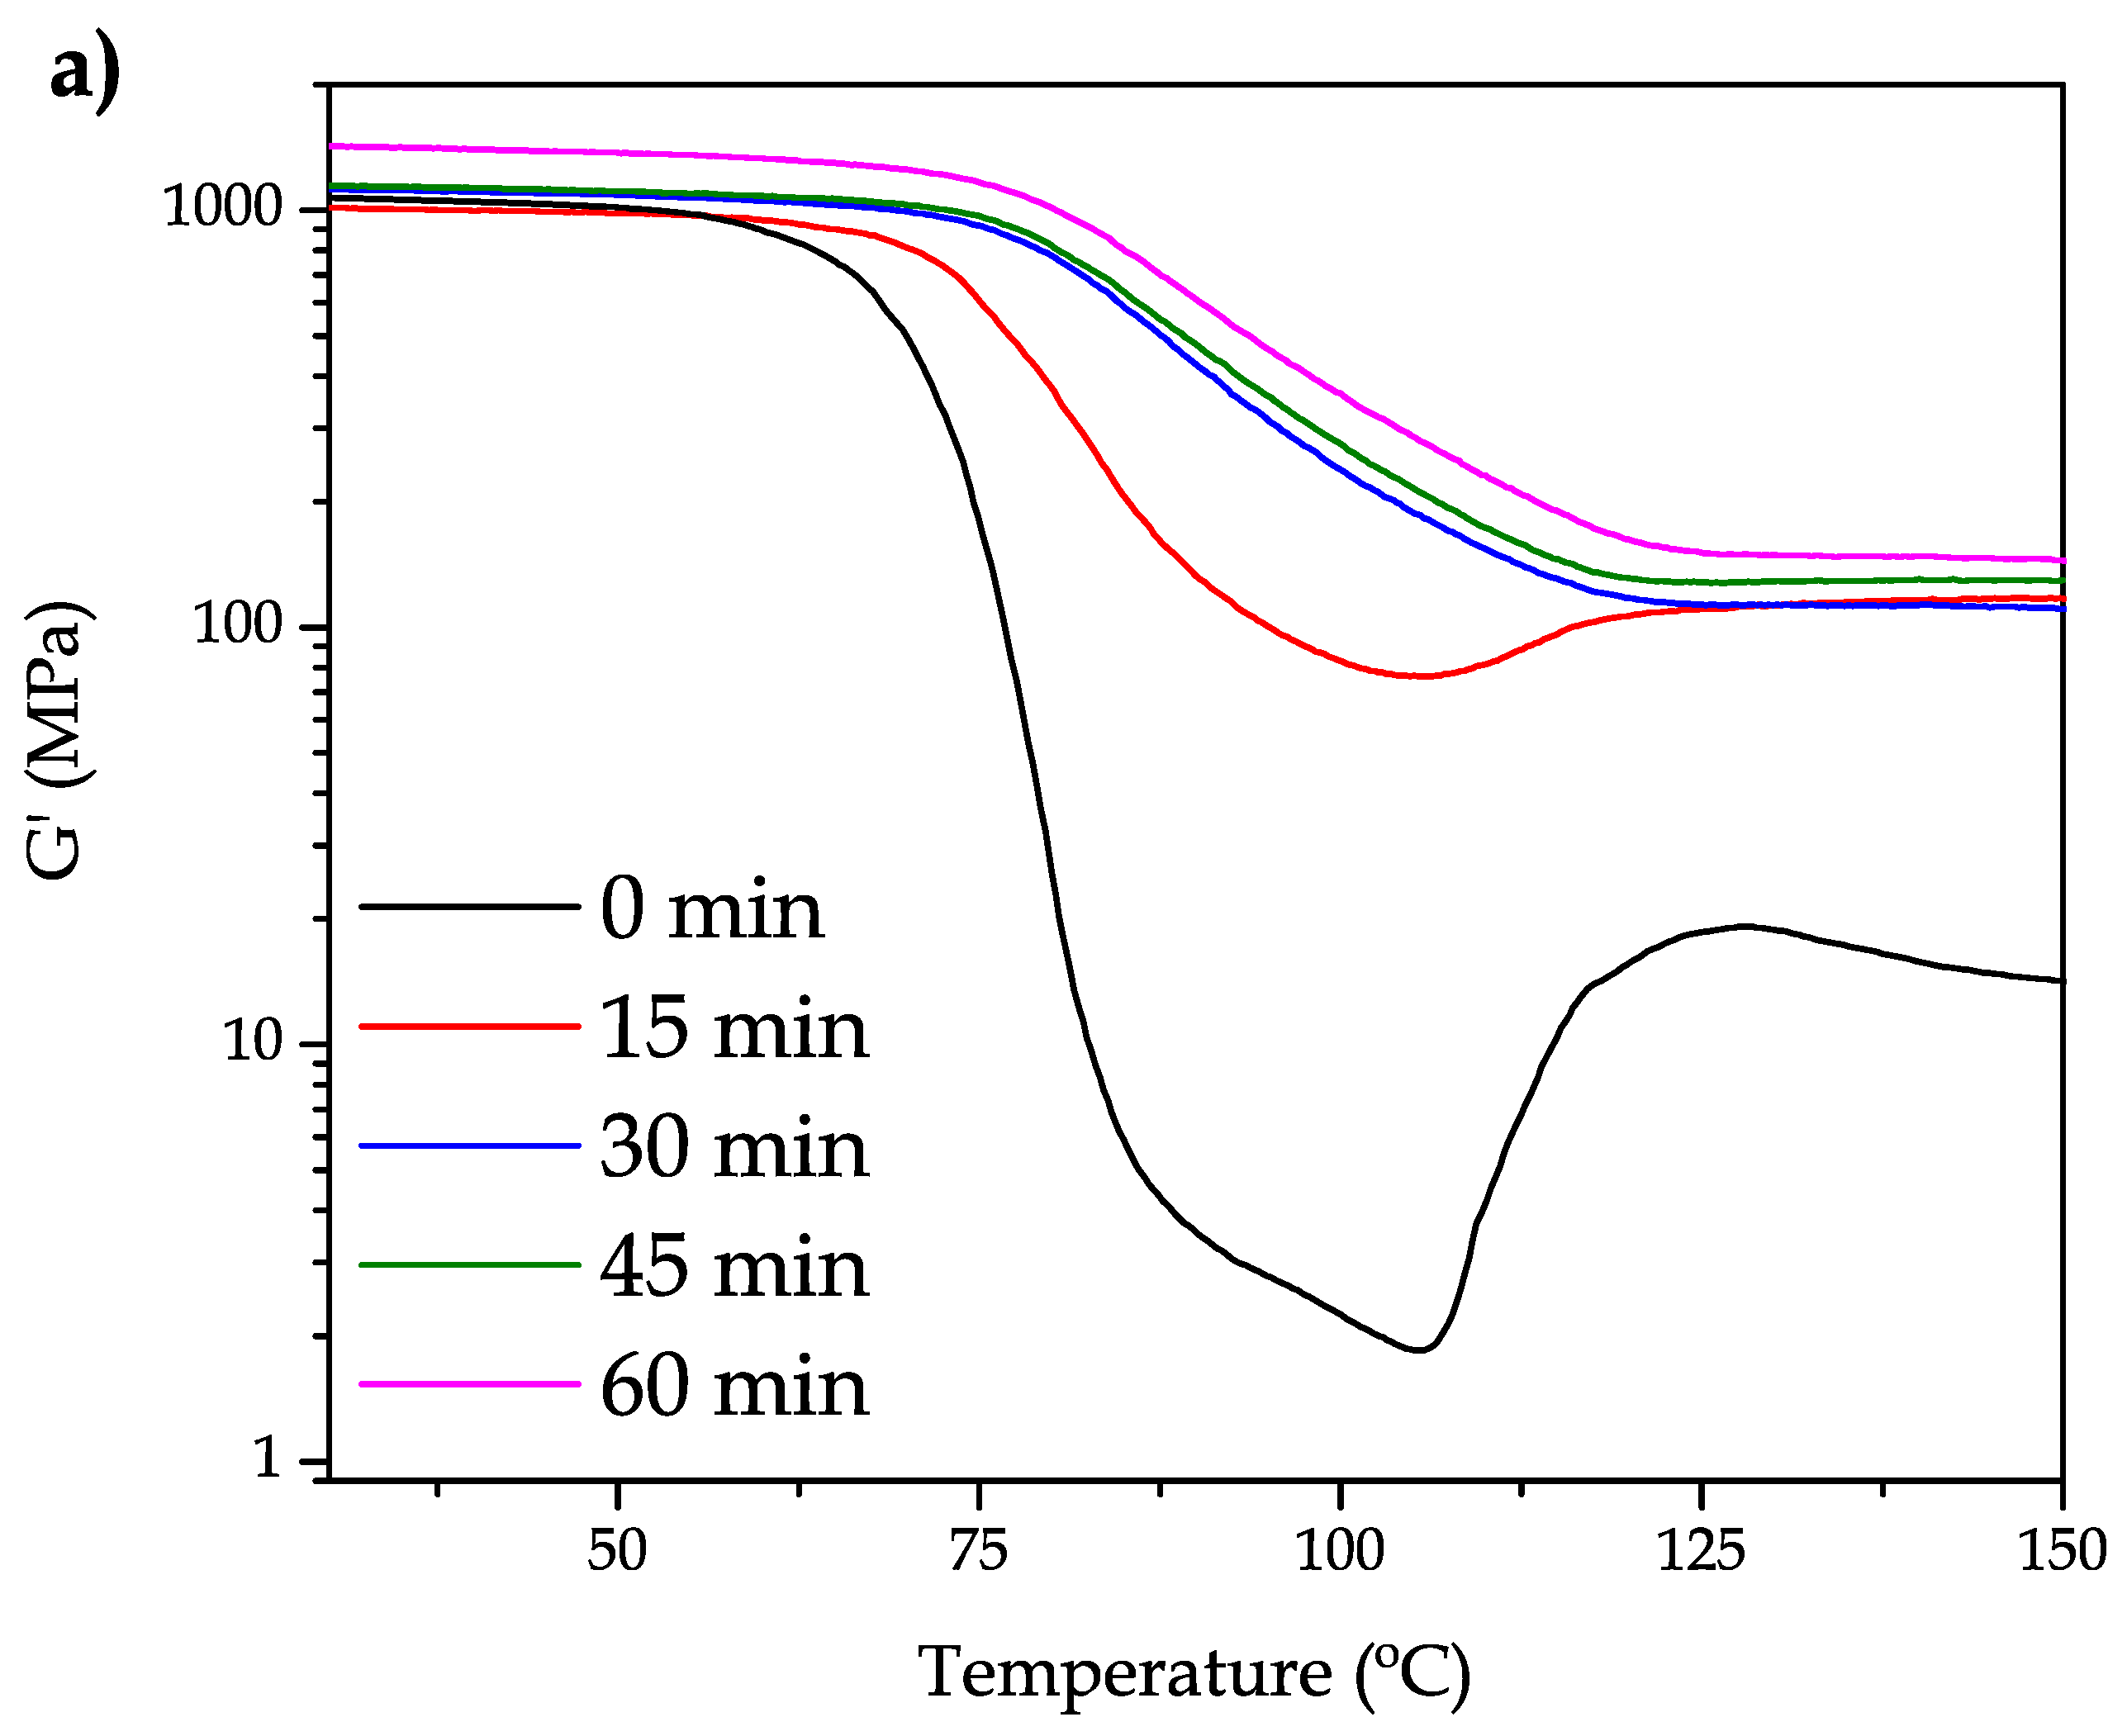
Figure 2, the mechanical and thermal properties of bioPET are highly dependent on the annealing time. To assess this, bioPET has been subjected to different annealing times and studied by dynamic-mechanical thermal analysis (DMTA).
Figure 2a shows the evolution of the storage modulus (
G′) as a function of the increasing temperature. DMTA is based on the use of a dynamical time-dependent stress function, σ = σ
0 sin(ωt) [σ
0 is the maximum stress and ω represents the frequency] which produces a sinusoidal strain (ε) given by ε = ε
0 sin(ωt-δ) where ε
0 is the maximum strain and δ is the phase angle which represents the delay (viscous) properties of the material. As the modulus represents the ratio between the maximum stress to the maximum strain, then it is possible to define the complex modulus (
G*) as σ
0 = ε
0 G* sin(ωt + δ). This expression can be expanded to give σ
0 = ε
0 G* sin(ωt) cos(δ) + ε
0 G* cos(ωt) sin(δ), which can be expressed as σ
0 = ε
0 G′ sin(ωt) + ε
0 G″ cos(ωt) with
G′ =
G* cos(δ) and
G″ =
G* sin(δ), thus leading to an elastic response related to
G′ (storage modulus) and a viscous response related to
G″ (loss modulus). As it can be derived, the ratio between the loss modulus (
G″) to the storage modulus (
G′) represents the damping factor or tanδ, which is directly related to the lost energy due to viscoelastic behaviour.
It can be seen that, neat bioPET shows a characteristic DMTA curve characterized by different zones. Below 60
, the storage modulus remains almost constant at a temperature range comprising between 60
and 80
, and a remarkable decrease in
G′ occurs. This decrease of near three orders of magnitude is representative of the glass transition process. In addition, information is provided about the high amorphous structure due to this three-fold change. Then, at the temperature range comprising between 106
and 125
, it is possible to observe an increase in
G′ which is directly related to the cold crystallization process which involves packing of polymer chains in an ordered way which gives increased stiffness. After 15 min annealing time at 110
, the morphology of the DMTA curve has changed in a remarkable way. As it can be seen, the decrease in
G′ is remarkably lower. The glass transition process has shifted to higher temperatures (probably due to the restriction of chain mobility in the crystalized structure) but it is still possible to find a slight increase in
G′ in the temperature range comprising between 106–120
. Nevertheless, with an annealing of 30 min, it is possible to conclude that the maximum crystallinity is achieved. The curves for 30 and 45 min are shifted to the right (higher temperatures) and the cold crystallization process has completely disappeared. Similar findings have been reported by A. Bartolotta et al. [
38] who showed a remarkable change in the glass transition onset from 40
(cold-drawn PET) up to 90
in highly crystalline PET. A. Bartolotta et al. attribute this phenomenon to an increase in density on glassy domains related to the presence of more crystal-packed domains and conclude that there is a link between the chain stiffness since there is a connection between the bulk glass to the ordered structures. Z. Chen et al. [
39] have also reported different crystallization mechanisms depending on the annealing temperature with remarkable changes, not only in the glass transition process but also on the melt temperature. In addition, the
G′ values are higher with increasing annealing time.
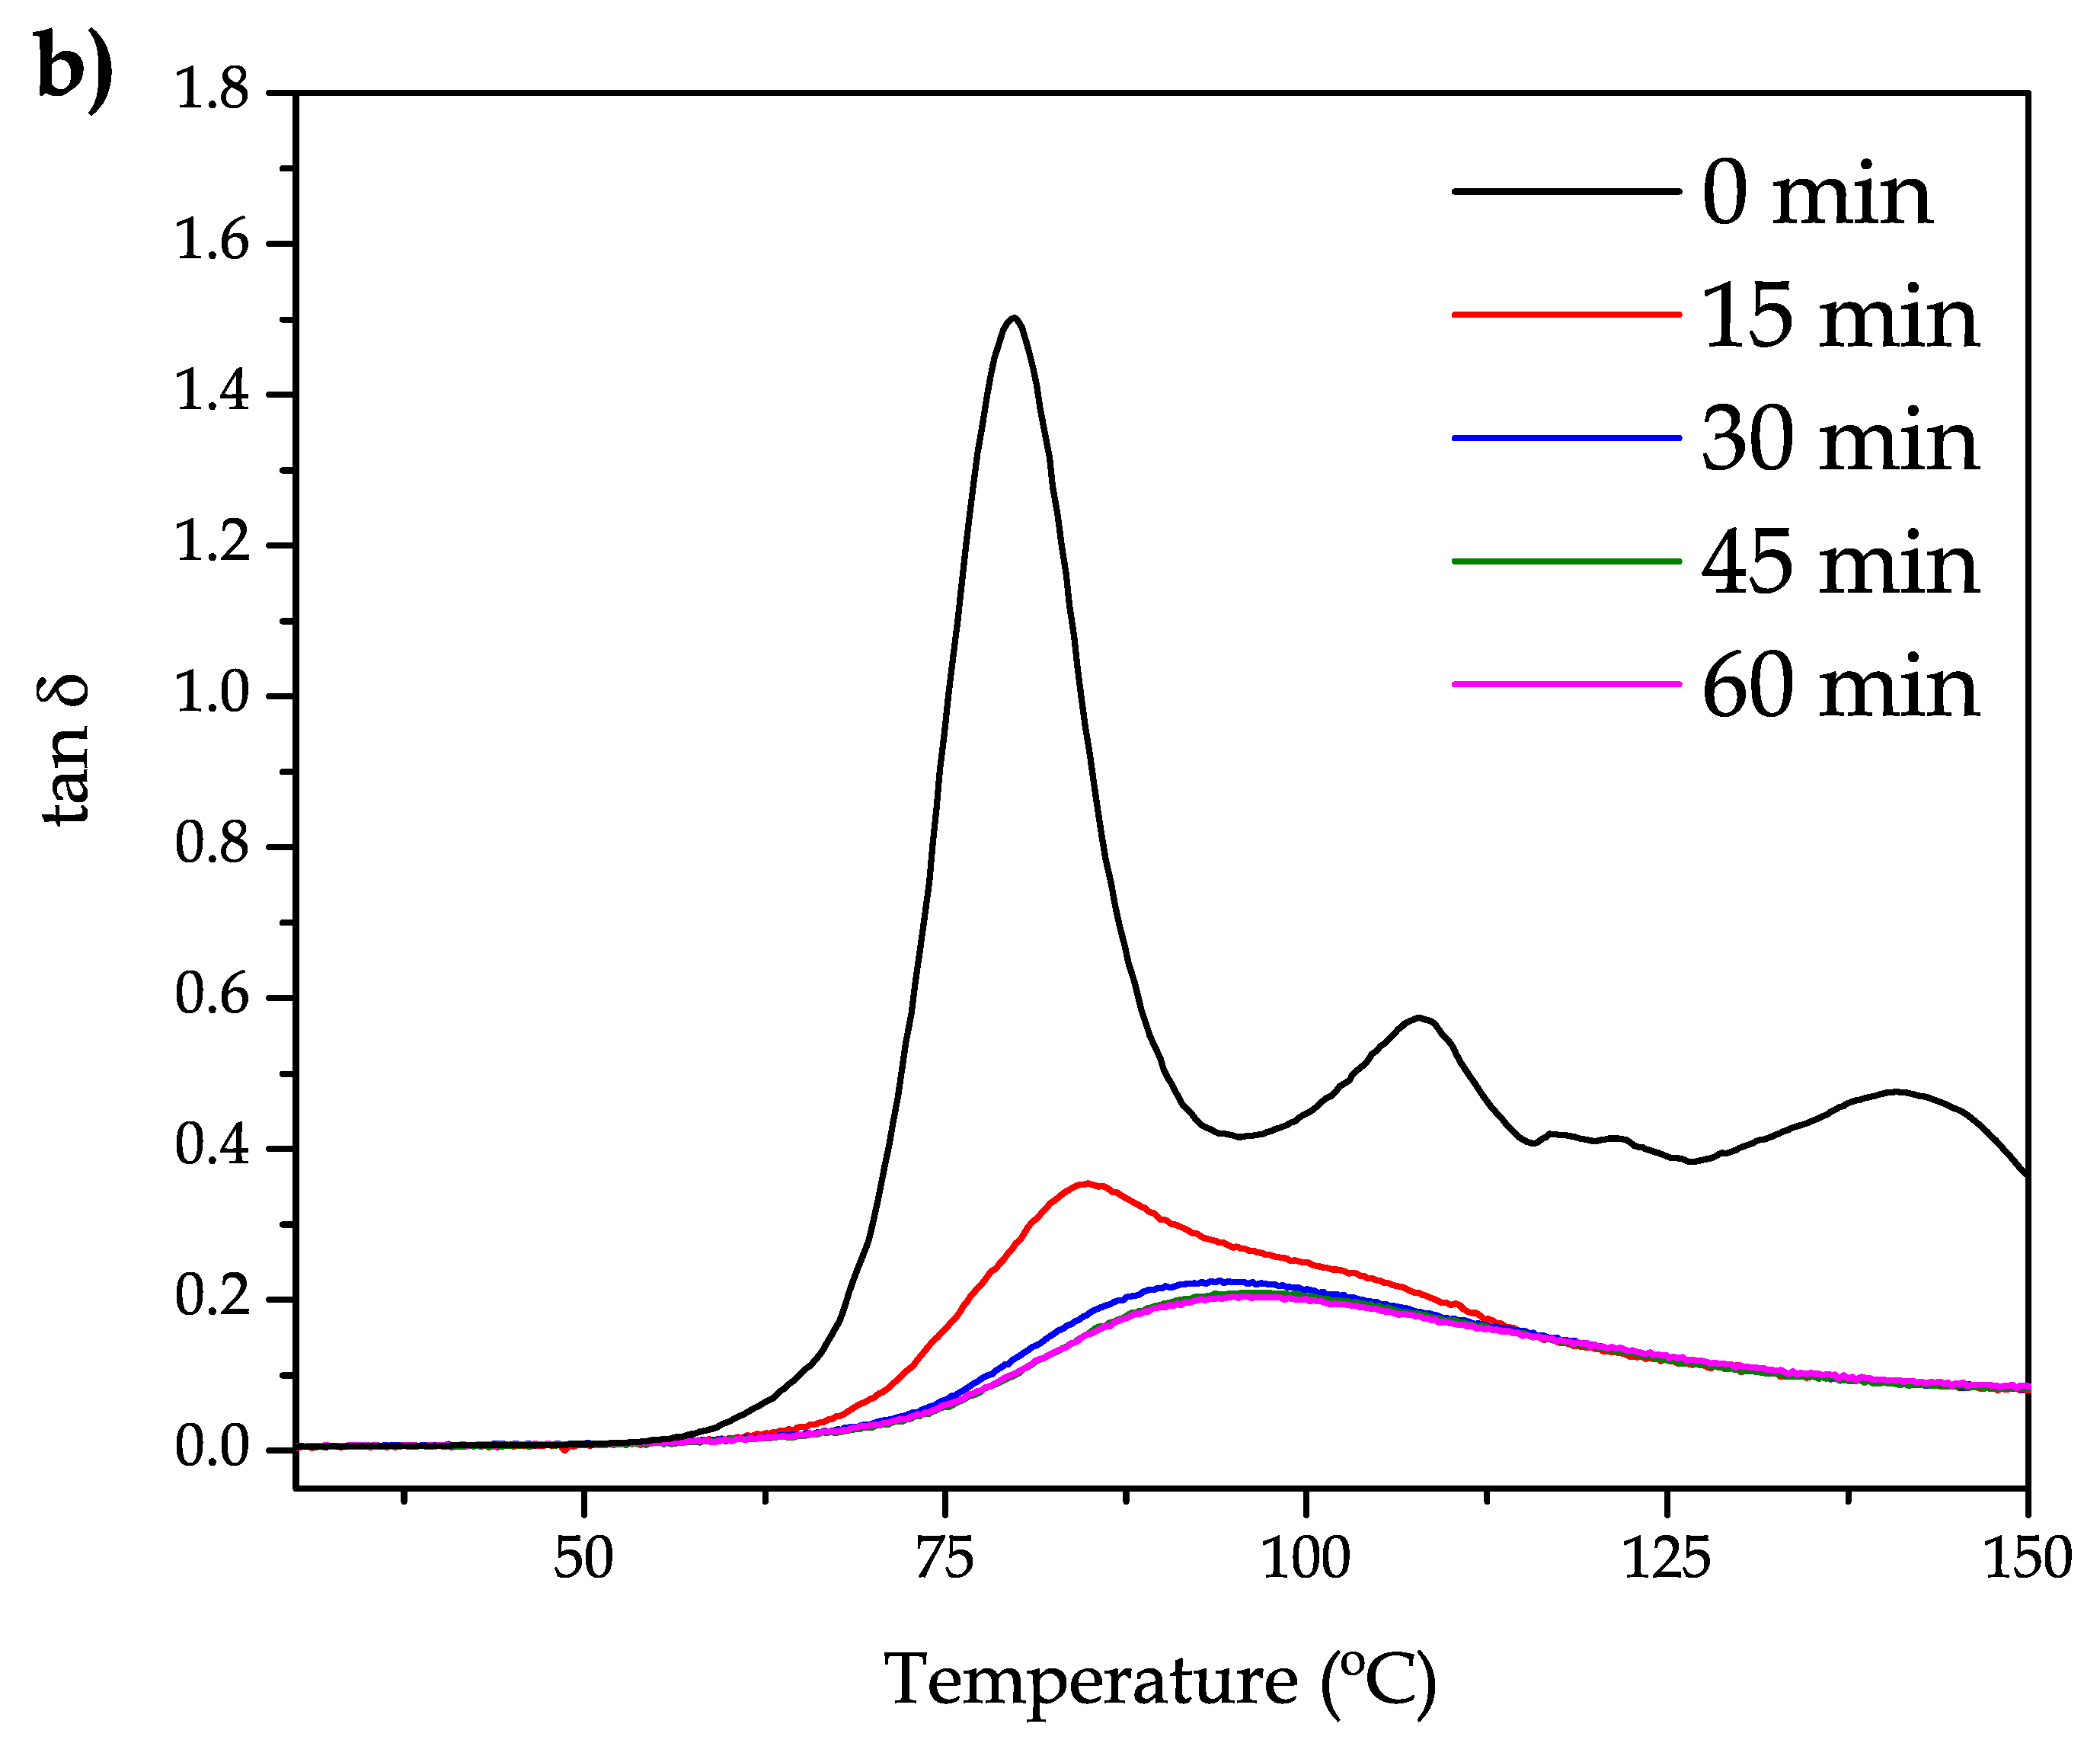
Figure 2b shows the evolution of the dynamic damping factor, tan δ. Notably, the maximum damping factor value decreases with the increasing annealing time. This is consistent with the damping factor definition which shows the ratio between the loss modulus (
G″) and the storage modulus (
G′). As the material becomes stiffer by the cold crystallization process, the denominator is higher, and this leads to lower damping factor values. It is worthy to note that the damping factor is related to the lost energy to stored energy ratio. As the annealing time increases, the material becomes stiffer and this is responsible for less lost energy. There are several methods to assess the glass transition temperature (
Tg) by using several methods from DMTA, i.e., the onset of the
G′ decrease, the peak maximum of
G″ or the peak maximum of the damping factor. The peak temperature of tan δ is widely used to give accurate values of
Tg. The un-annealed bioPET shows a
Tg of 79.9
which increases progressively with increasing annealing time at 110
resulting in values of 84.8
(15 min annealing), 93.7
(30 min annealing) and 96.3–96.4
for 45 and 60 min annealing. These results are in total accordance with those reported by A. Bartolotta et al. [
38], who showed a change in the onset of
Tg (using the
G′ method) from 40
up to 90
.
In this work, bioPET and its blends have been characterized without any annealing process, just as obtained by the injection moulding. Neat bioPET showed a tensile strength (σ
t) of 46.7 MPa and a relatively low elongation at yield (ε
y) of 3.87% which leads to a stiff material. The effect of the addition of bioPA to bioPET produces two important effects. On the one hand, the tensile strength decreases as expected in an immiscible blend as reported by K.C. Chiou et al. [
40], in PA6/PBT binary blends, but the decrease is not so pronounced. In fact, the maximum percentage decrease is close to 11% for the uncompatibilized blend containing 30 wt % bioPA. It is important to remark that the bio-based content of the blend containing 30 wt % bioPA is above 50% which is a positive property from an environmental point of view. On the other hand, the addition of a flexible polymer such as bioPA, provides improved elongation at yield up to values of 4.8% which represents a percentage increase of 24%, thus leading to improved ductile behaviour. The effect of the poly(styrene
-ran-glycidyl methacrylate) copolymer (PS
-GMA) Xibond™ 920 gives interesting results. It is worthy to note that the addition of 3 phr Xibond™ 920 leads to higher tensile strength regarding neat bioPET, reaching values of 47.1 MPa with a parallel increase in elongation up to values of 6.09% (57% increase compared to neat bioPET and 27% the same composition without compatibilizer). This indicates that Xibond™ 920 is providing somewhat compatibilization properties to this binary system. Similar findings have been obtained using a Zn
2+ ionomer on PET/PA6 blends with improved elongation at break and toughness compared to an uncompatibilized blend [
41]. Y. Huang et al. [
42], reported the exceptional compatibilizing effect of the glycidyl group by using an epoxy resin (E-44) as a compatibilizer in PET/PA6 blends. C.T. Ferreira et al. [
43] reported the potential of reactive extrusion of recycled PET and recycled PA by a reaction of the carboxyl end-chain groups in PET and the amine end-chain groups in PA with a noticeable improvement in mechanical properties using tin(II) 2-ethylhexanoate as a trans-reaction catalyst. Regarding the hardness, as both polymers show similar Shore D values, it is not possible to observe a tendency with varying composition as shown in
Table 3.
Regarding the impact strength which is measured through the Charpy impact test, it is worthy to note that all the developed materials have increased impact strength in comparison to neat bioPET. Neat bioPET offers a quite brittle behaviour with an impact-absorbed energy of 23.1 kJ·m
−2. The uncompatibilized binary blend with 10 wt % bioPA1010 offers an increased impact strength of 27.0 kJ·m
−2 (which represents a percentage increase of approximately 16.9%). This result is in total agreement with other ductile properties such as elongation at yield (ε
y). Y. Yan et al. [
44] reported the lubricant effect of PA56 on PET blends at a molecular level with the subsequent effect on mechanical properties. This phenomenon has been observed in other binary blends composed of a brittle polymer matrix in which a rubber-like material is finely dispersed, even with poor miscibility between them. J. Urquijo et al. [
45] reported a remarkable increase in both elongation at the break and impact strength in binary blends of poly(lactic acid) (PLA) and different loadings of poly(ε-caprolactone) (PCL). J. Urquijo et al. demonstrated the relevance of the elongation rate on the final elongation and, regarding the impact strength, they attributed the improvement to the small particle size of PCL-rich domains embedded in the brittle PLA-rich matrix which positively contributed to absorb energy in impact conditions. Similar findings have been reported with PLA/PCL, PHB/PCL, PLA/PBS binary blends [
46,
47,
48,
49], ternary PLA/PHB/PCL blends [
50], and some poly(ester) copolymers [
51]. This improved toughness is more evident in an uncompatibilzed blend containing 30 wt % bioPA1010 reaching an impact strength of 40.5 kJ·m
−2 (75.3% increase). The effect of the compatibilizer has a positive effect on improved toughness as it can be seen in
Table 2. Xibond™ 920 is a random copolymer of poly(styrene-glycidyl methacrylate) (PS
-GMA) and gives excellent results in compatibilizing condensation polymers. This is because of the glycidyl methacrylate group which can interact with both hydroxyl end-groups in bioPET and amine (primary or secondary) in bioPA1010, thus leading to somewhat compatibilization with a marked effect on impact strength. The addition of 5 phr Xibond™ 920 gives an impact strength of 44.6 kJ·m
−2 (93.1% increase compared to neat bioPET and an additional 10.1% compared to the uncompatibilized blend containing 30 wt % bioPA1010). It is evident the positive effect of the compatibilizer in improved toughness. With regard to the bio-based content, the blends with 30 wt % bioPA with compatibilizer show a bio-based content of approximately 50%. The GMA-based copolymers have been reported as good compatibilizers in different blends containing PAs or polyesters due to their reactivity with both polymers, such as PA6/PP [
52,
53], PA6/PVF [
54], PET/PP [
55], HDPE/PET [
56].
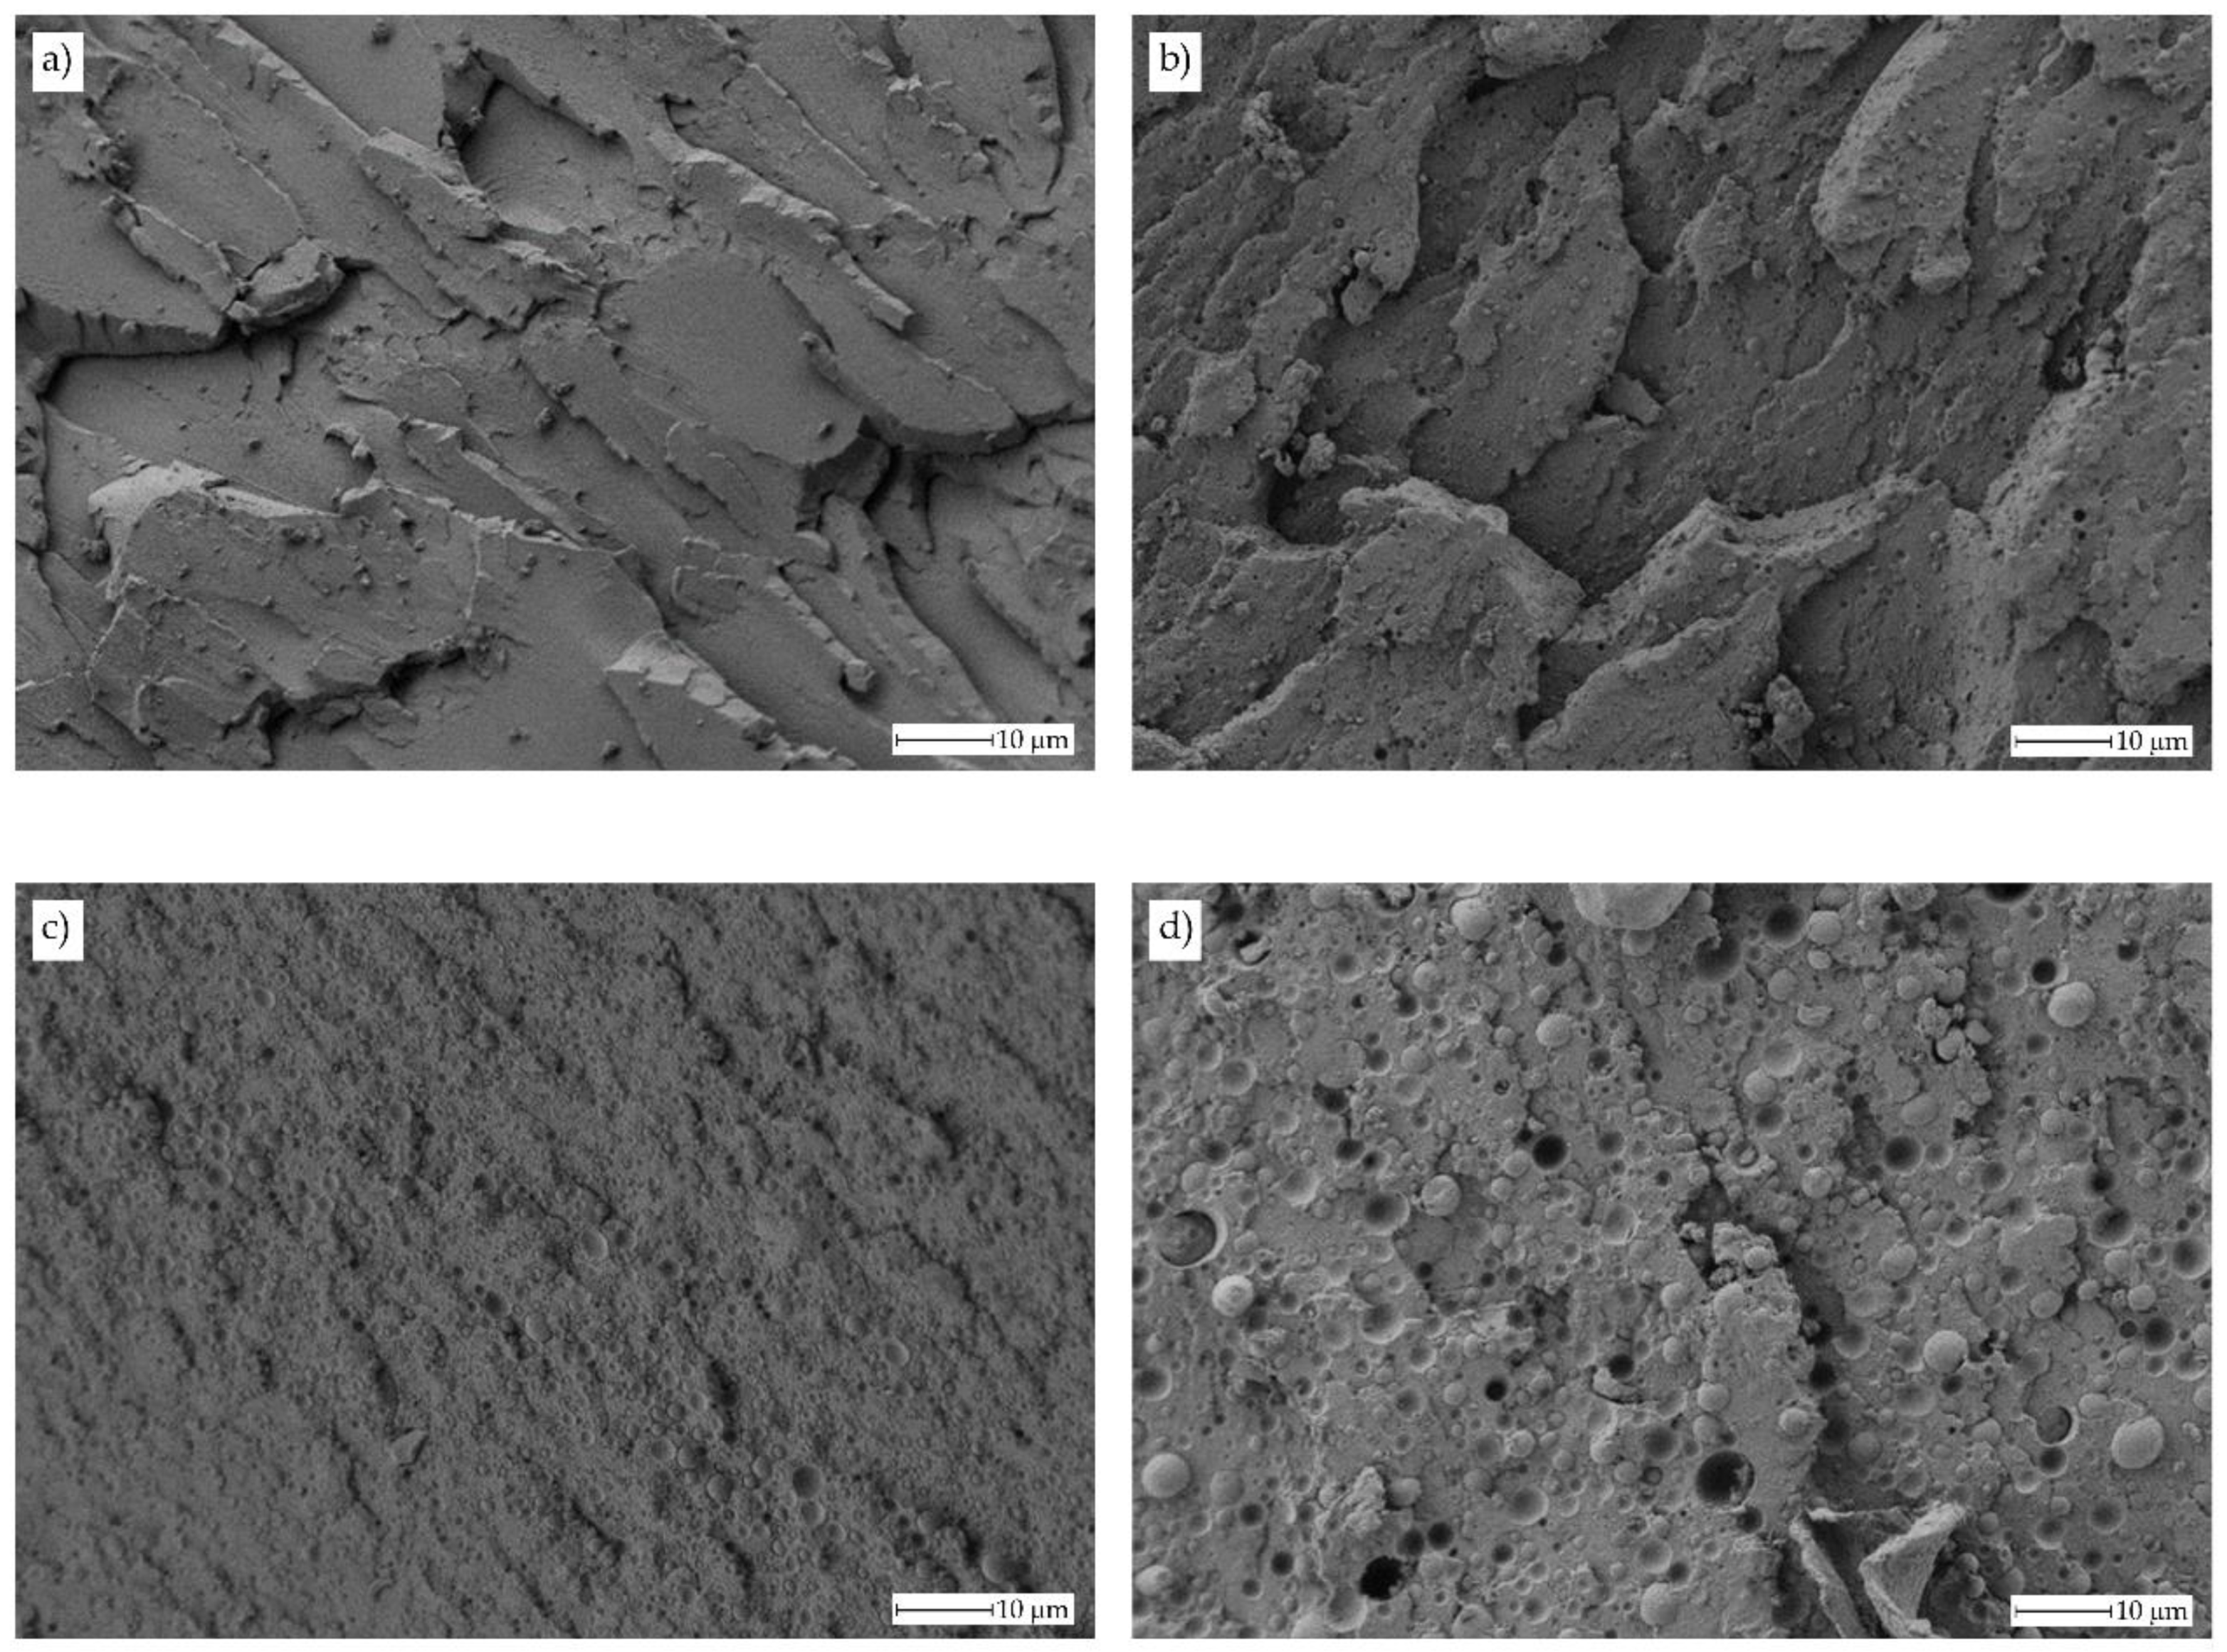
The improved toughness is directly related to the morphology of the obtained materials.
Figure 3 gathers FESEM images of uncompatibilized bioPET/bioPA blends.
Figure 3a shows the fracture surface of neat PET with a typical rigid and brittle material, that is, very smooth surfaces resulting from microcrack appearances and their growth without plastic deformation. This brittle behaviour for neat PET has been reported by A.R. McLauchlin et al. [
57] in PET/PLA blends.
Figure 3b shows the morphology of the uncompatibilized binary blend containing 10 wt % bioPA. This morphology is remarkably different to neat bioPET. In particular, it is possible to observe a brittle fracture surface with a noticeable increase in roughness due to presence of small-sized bioPA immiscible droplets embedded into the bioPET matrix. As the bioPA wt % increases, the roughness is more evident, and the characteristic brittle fracture disappears. In
Figure 3d, corresponding to the binary blend with 30 wt % bioPA, it is possible to observe the characteristic droplet-like structure of an immiscible polymer blend in which bioPA appears in the form of spherical droplets with an average size of approximately 3.9 ± 1.1 μm. This size is higher than the average size observed for lower bioPA content. It is evident that by increasing the bioPA content, the average particle size increases due to the particle coalescence as reported by A.M. Torres-Huerta et al. [
58] on PET/PLA and PET/chitosan blends. Y. Yan et al. [
44] reported the high immiscibility of PET blends with PA56 (up to 30 wt %) and used dissipative particle dynamics (DPD) to assess the immiscibility of both polymers and how the PA56 domains increase with increasing PA56 content. The poor compatibility between these polymers can be observed at a 30 wt % bioPA in the blends as the morphology shows the typical spherical bioPA droplets embedded in the matrix (sea-island morphology) as well as some voids with the same average diameter consisting of some bioPA droplets on the holes which have been produced after being pulled out during the impact test. This pulling out occurs because of the poor polymer-polymer interactions.
These results suggest that the poly(styrene
-ran-glycidyl methacrylate) copolymer (PS-GMA) can positively contribute to a partial compatibilization effect due to the reaction of the glycidyl groups with both hydroxyl terminal groups in bioPET and amine groups in bioPA [
54,
55]. Y. Huang et al. [
42] reported the reactivity of the glycidyl group of an epoxy resin (E-44) in a PET/PA6 binary blend. As the nature of both bioPET and bioPA is the same as petroleum-derived PET and other semicrystalline polyamides, it is possible to assume similar reactions as described in by Y. Huang et al. That study reported the greater tendency of the glycidyl group to react with polyamide due to the presence of many hydrogen bonding (together with carboxylic and amine end-chains) while the reaction of the glycidyl group with PET is restricted to hydroxyl and carboxyl end-chains. Moreover, Y. Huang et al. further reported evidences of these reactions by extracting the polyamide fraction by formic acid which was subjected to FTIR analysis. This analysis showed a shift of the N–H bending from 1560 to 1544 cm
−1 and shift of the C=O stretching from 1662 to 1642 cm
−1, both changes indicating the reaction of PA6 with the glycidyl group in E-44 epoxy resin. In addition, the characteristic peaks of PET at 1730, 1104 and 730 cm
−1 were also detectable by FTIR thus giving consistency to the grafting process.
The indirect effects of these reactions can also be detectable by a remarkable change in surface morphology as it can be seen in
Figure 4. The addition of PS-GMA Xibond™ 920 gives a noticeable decrease in the droplet size of bioPA-rich domains. There is not a great difference between the images corresponding to the compatibilized bioPET/bioPA blends containing 1, 3 or 5 phr PS-GMA. At this magnification (1000×), it can be realized that the droplet diameter has been reduced down to values under 1 μm. This situation can be clearly observed in
Figure 5 which shows a comparative FESEM image of the uncompatibilized blend with 30 wt % bioPA and the same blend with 3 phr PS-GMA Xibond™ 920.
As can be seen in
Figure 5, the uncompatibilized blend (
Figure 5a) shows a characteristic morphology, typical of poor polymer-polymer interactions. The particle droplet average diameter is 3.9 ± 1.1 μm as indicated previously. It is possible to observe this lack (or poor) interaction between both polymers. In fact, it is evident that some bioPA droplets have been removed (white rectangles) and there is a small gap between the bioPA spheres and the surrounding bioPET matrix (white arrows). Nevertheless, this gap is relatively low compared to other immiscible systems (it is in the nanoscale range), and this contributes to improved tensile properties and toughness as indicated previously. Furthermore, when observing
Figure 5b is that the droplet size has been reduced in a remarkable way in the same blend with 3 phr PS-GMA compatibilizer. The new droplet size for the compatibilized blend is 0.62 ± 0.27 μm which is remarkably lower than the average size of bioPA-rich domains in the uncompatibilized blend. In addition, the surface morphology of the polymer matrix is different. As can be seen in
Figure 5a for the uncompatibilized blend, the bioPET matrix is quite smooth while this surface is completely different in the compatibilized blend (
Figure 5b) since it is remarkably rougher as reported by Y. Pietrasanta et al. [
56] on HDPE/PET blends compatibilized with glycidyl polymers. Regarding the gap between the embedded bioPA droplets, the morphology is also different since these embedded bioPA domains seem to be more embedded in the compatibilized blend. Similar findings have been reported for other PET-based immiscible blends such as those developed by C. Carrot et al. [
59] (PET/PC) with a clear change in morphology in the presence of compatibilizers, O.M. Jazani et al. [
60] (PET/PP), A.M. Torres-Huerta et al. [
58] (PET/PLA) and (PET/chitosan), among others.
3.2. Thermal and Thermo-Mechanical Properties of Binary BioPET/BioPA Blends
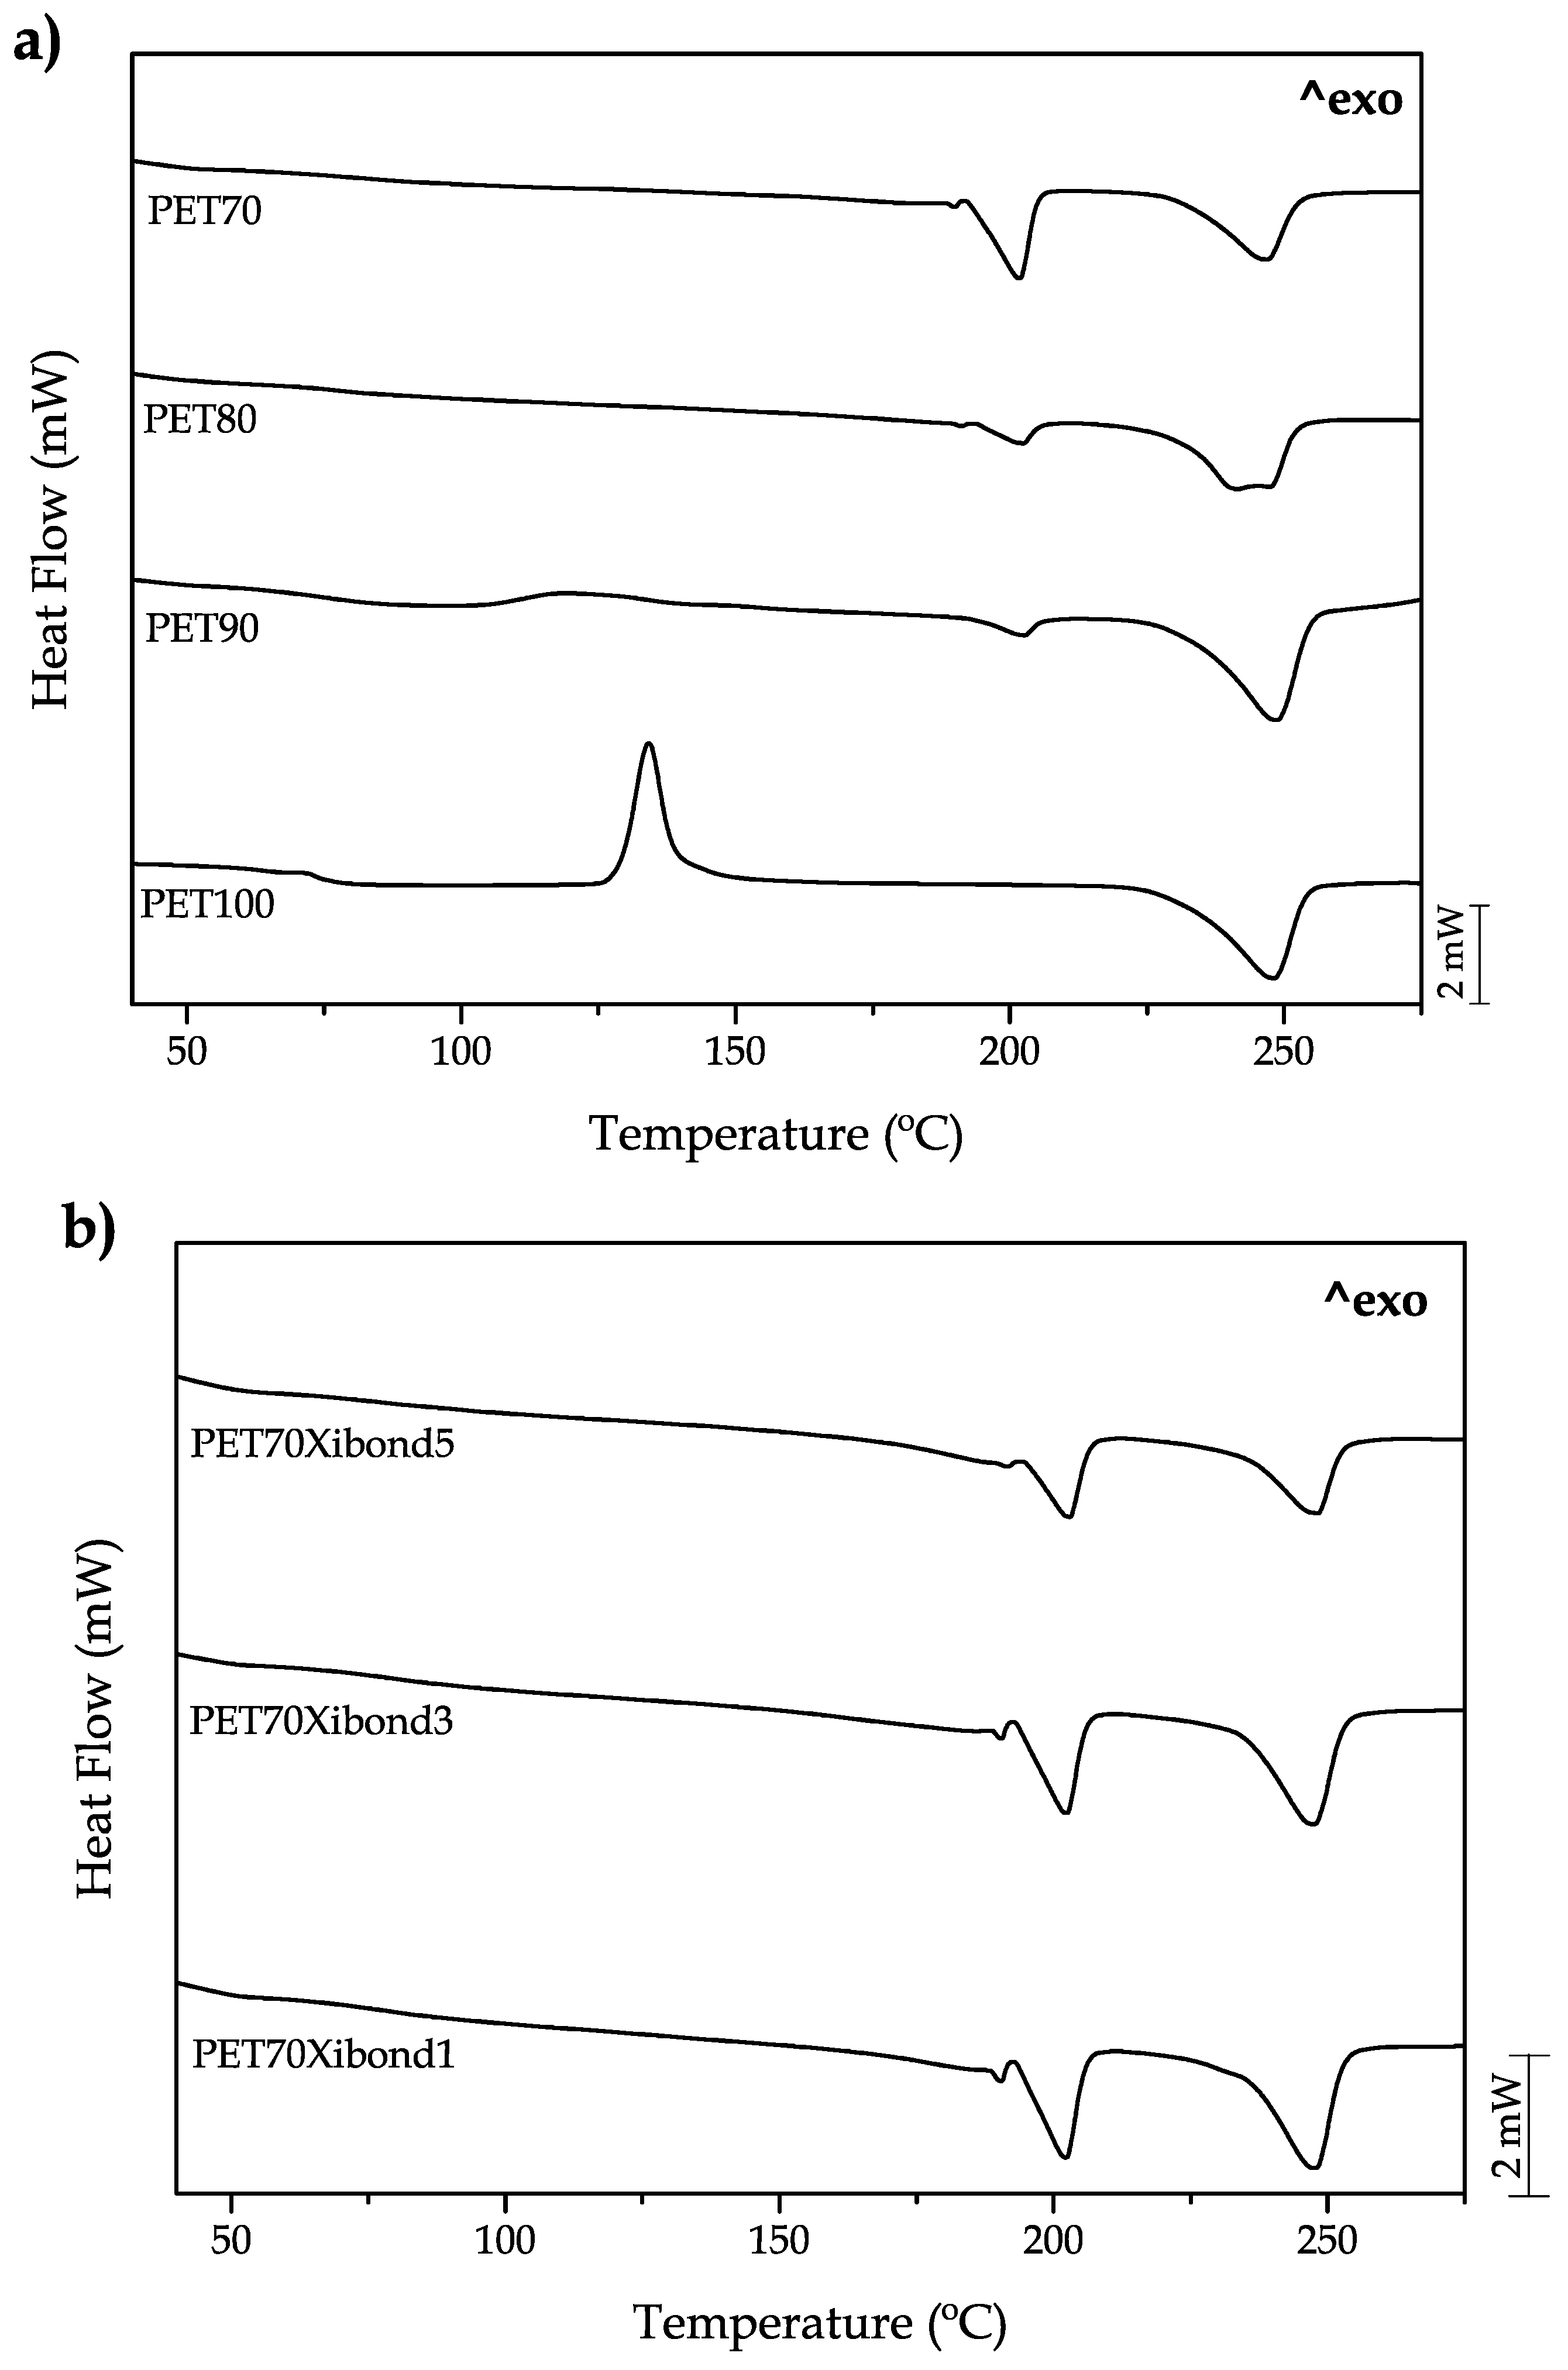
The main thermal transitions of the developed materials are gathered in
Figure 6. The neat bioPET shows in a clear way the main transitions. The step change in the 70–80
range corresponds to the glass transition phenomenon (
Tg) and it is 75.2 as shown in
Table 4. Then, a peak located in the 120–140
range corresponds to the cold crystallization process which involves crystallization of the fraction that has not been able to crystallize because of the cooling rate. This process shows a characteristic peak temperature (
Tcc_PET) of 133.2
. Finally, the melt process can be observed at higher temperatures of 225–260
with a peak temperature of 248.2
. The addition of bioPA up to 30 wt % on uncompatibilized blends does not provide any remarkable change in the
Tg with values of approximately 75–76
, very similar to neat bioPET. Although these
Tg values cannot be clearly seen in
Figure 6a,b, the
Tg values were obtained from the zoomed DSC thermograms in the 65–85
leading to the values shown in
Table 4. Regarding the cold crystallization process, bioPA plays a key role in this process. By the addition of 10 wt % bioPA, the peak temperature moved down to values of 121.9
thus indicating bioPA enables crystallization of bioPET. Above 10 wt % bioPA, the cold crystallization process disappears and a slight decrease in the maximum crystallinity of bioPET (calculated with the obtained melt enthalpy values, Δ
Hm_PET) can be detected as seen in
Table 3. In fact, neat bioPET shows a maximum degree of crystallinity of 22.7% and it is slightly reduced to the values of 19.9% for the uncompatibilized blend containing 30 wt % bioPA. The melt peak temperature does not change in a remarkable way for all the developed materials and moves between the 247–248
narrow range. The effect of the PS-GMA compatibilizer is interesting. As can be seen in
Table 4, a clear decrease in the crystallinity is detected from 19.9% (uncompatibilized blend with 30 wt % bioPA) to 17.3% in same composition with 3 phr Xibond™ 920. These results are in total agreement with those reported by Y. Huang et al. [
42] who indicated a key role of the interface on crystallization as the interface is directly related to two relevant phenomena: Crystal nucleation and crystal growth. Y. Huang et al. report the use of an epoxy resin (E-44) as a compatibilizer in PET/PA6 blends and they conclude that although the epoxy resin can positively contribute to improve mechanical properties, a decrease in crystallinity is observed with increasing E-44 content due to the formation of less perfect crystals as a consequence of the increased interactions. Moreover, this study confirmed independent crystallization of PET and PA6 as suggested by the wide angle of the x-ray diffraction spectroscopy (WAXD). In fact, Y. Huang et al. also report a different effect of epoxy compatibilization on hindering crystallization on both PET and PA6. The glycidyl group has more reactive points with PA6 due to the high number of hydrogen bonding in the structure while the reaction of the glycidyl group with PET is restricted to hydroxyl and carboxyl groups located at the end-chains. Y. Huang et al. reported a percentage decrease in the melt enthalpy of PET of approximately 25.9% while the decrease for PA6 is close to 40%. Due to the nature of both bioPET and bioPA, the same behaviour with the glycidyl compatibilizer is expected as can be seen in
Table 4 with a clear large decrease in the melt enthalpy of bioPA compared to bioPET with increasing Xibond™ 920. On the other hand, Quiles-Carrillo et al. [
61] reported a clear decrease in crystallinity by reactive extrusion of PLA with maleinized hemp seed oil (MHO). This decrease was attributed to the high reactivity of the maleic anhydride groups towards the hydroxyl groups in PLA which can give chain extension, branching and even, some crosslinking, all these phenomena having a negative effect on crystallization and formation of imperfect crystals. Quiles-Carrillo et al. [
62] also reported a similar effect on PLA by using another reactive compatibilizer derived from soybean oil, namely, acrylated epoxidized soybean oil (AESO).
The immiscibility of both polymers is also evident from DSC as two melt peaks are obtained with very slight changes in their corresponding peak temperature values. BioPA shows a melt peak located at 202–203
with whatever the composition may be. Nevertheless, the crystallinity is also affected by the presence of bioPET as the major component. As expected, the crystallinity of bioPA increases with increasing bioPA content from 9.8% (10 wt %) up to 16.9% (30 wt %) since the presence of higher bioPA loadings promote more intense and independent nucleation and crystal growth processes. Nevertheless, the effect of PS-GMA is the same as in the case of bioPET. The reaction between glycidyl groups in PS-GMA with both bioPET and bioPA polymer chains leads to the formation of imperfect crystals which is responsible for a decrease in the overall crystallinity as seen in
Table 4, down to values of 10.2% for the compatibilized blend with 30 wt % bioPA and 5 phr Xibond™ 920. Another interesting finding is that the compatibilizer leads to a slight increase in the
Tg of bioPET up to values of 78
which is indicating that chain mobility is restricted. Despite this, the determination of
Tg by DSC is sometimes complex and inaccurate due to the problems related to the base line and the dilution effect in polymer blends. Similar findings have been reported by D. Garcia-Garcia et al. [
63], using reactive extrusion of PHB and PCL with different dicumyl peroxide (DCP) loadings. The reaction of the free radicals generated by DCP can react with both PCL and PHB thus leading to partial compatibilization. These reactions reduce chain mobility as observed by the dynamic mechanical-thermal analysis (DMTA).
Regarding thermal stability (degradation at high temperatures),
Table 5 shows a summary of some thermal degradation parameters obtained by thermogravimetry (TGA). Two different characteristic temperatures are gathered in this table, the temperature required for a weight loss of 5% which is representative for the onset degradation (
T5%) and the maximum degradation rate temperature (
Tmax) which corresponds to the peak maximum of the first derivative TGA curve (DTG). As can be seen, the
T5% for the neat bioPET is 382.6
and the addition of bioPA contributes to delay the onset degradation process as the
T5% characteristic temperature is moved up to 397.4
for the uncompatibilized blend containing 30 wt % bioPA. This is because PA1010 has more thermal stability than PET. The effect of the PS-GMA compatibilizer is a slight increase in the onset degradation temperature up to values close to 404
with 3 phr Xibond™ 920. Regarding the maximum degradation rate, it is worthy to note a decreasing tendency with increasing bioPA loading on blends. This could be related to the fact that PA1010 is more thermally stable than PET but the degradation rate of PA1010 (change in weight loss with temperature) is higher than PET. For this reason, the
Tmax shows a decreasing tendency. S. Jiang et al. [
64] reported that the onset degradation temperature of PA1010 is located at 419.2
which is remarkably higher than PET, thus contributing to improved thermal stability.
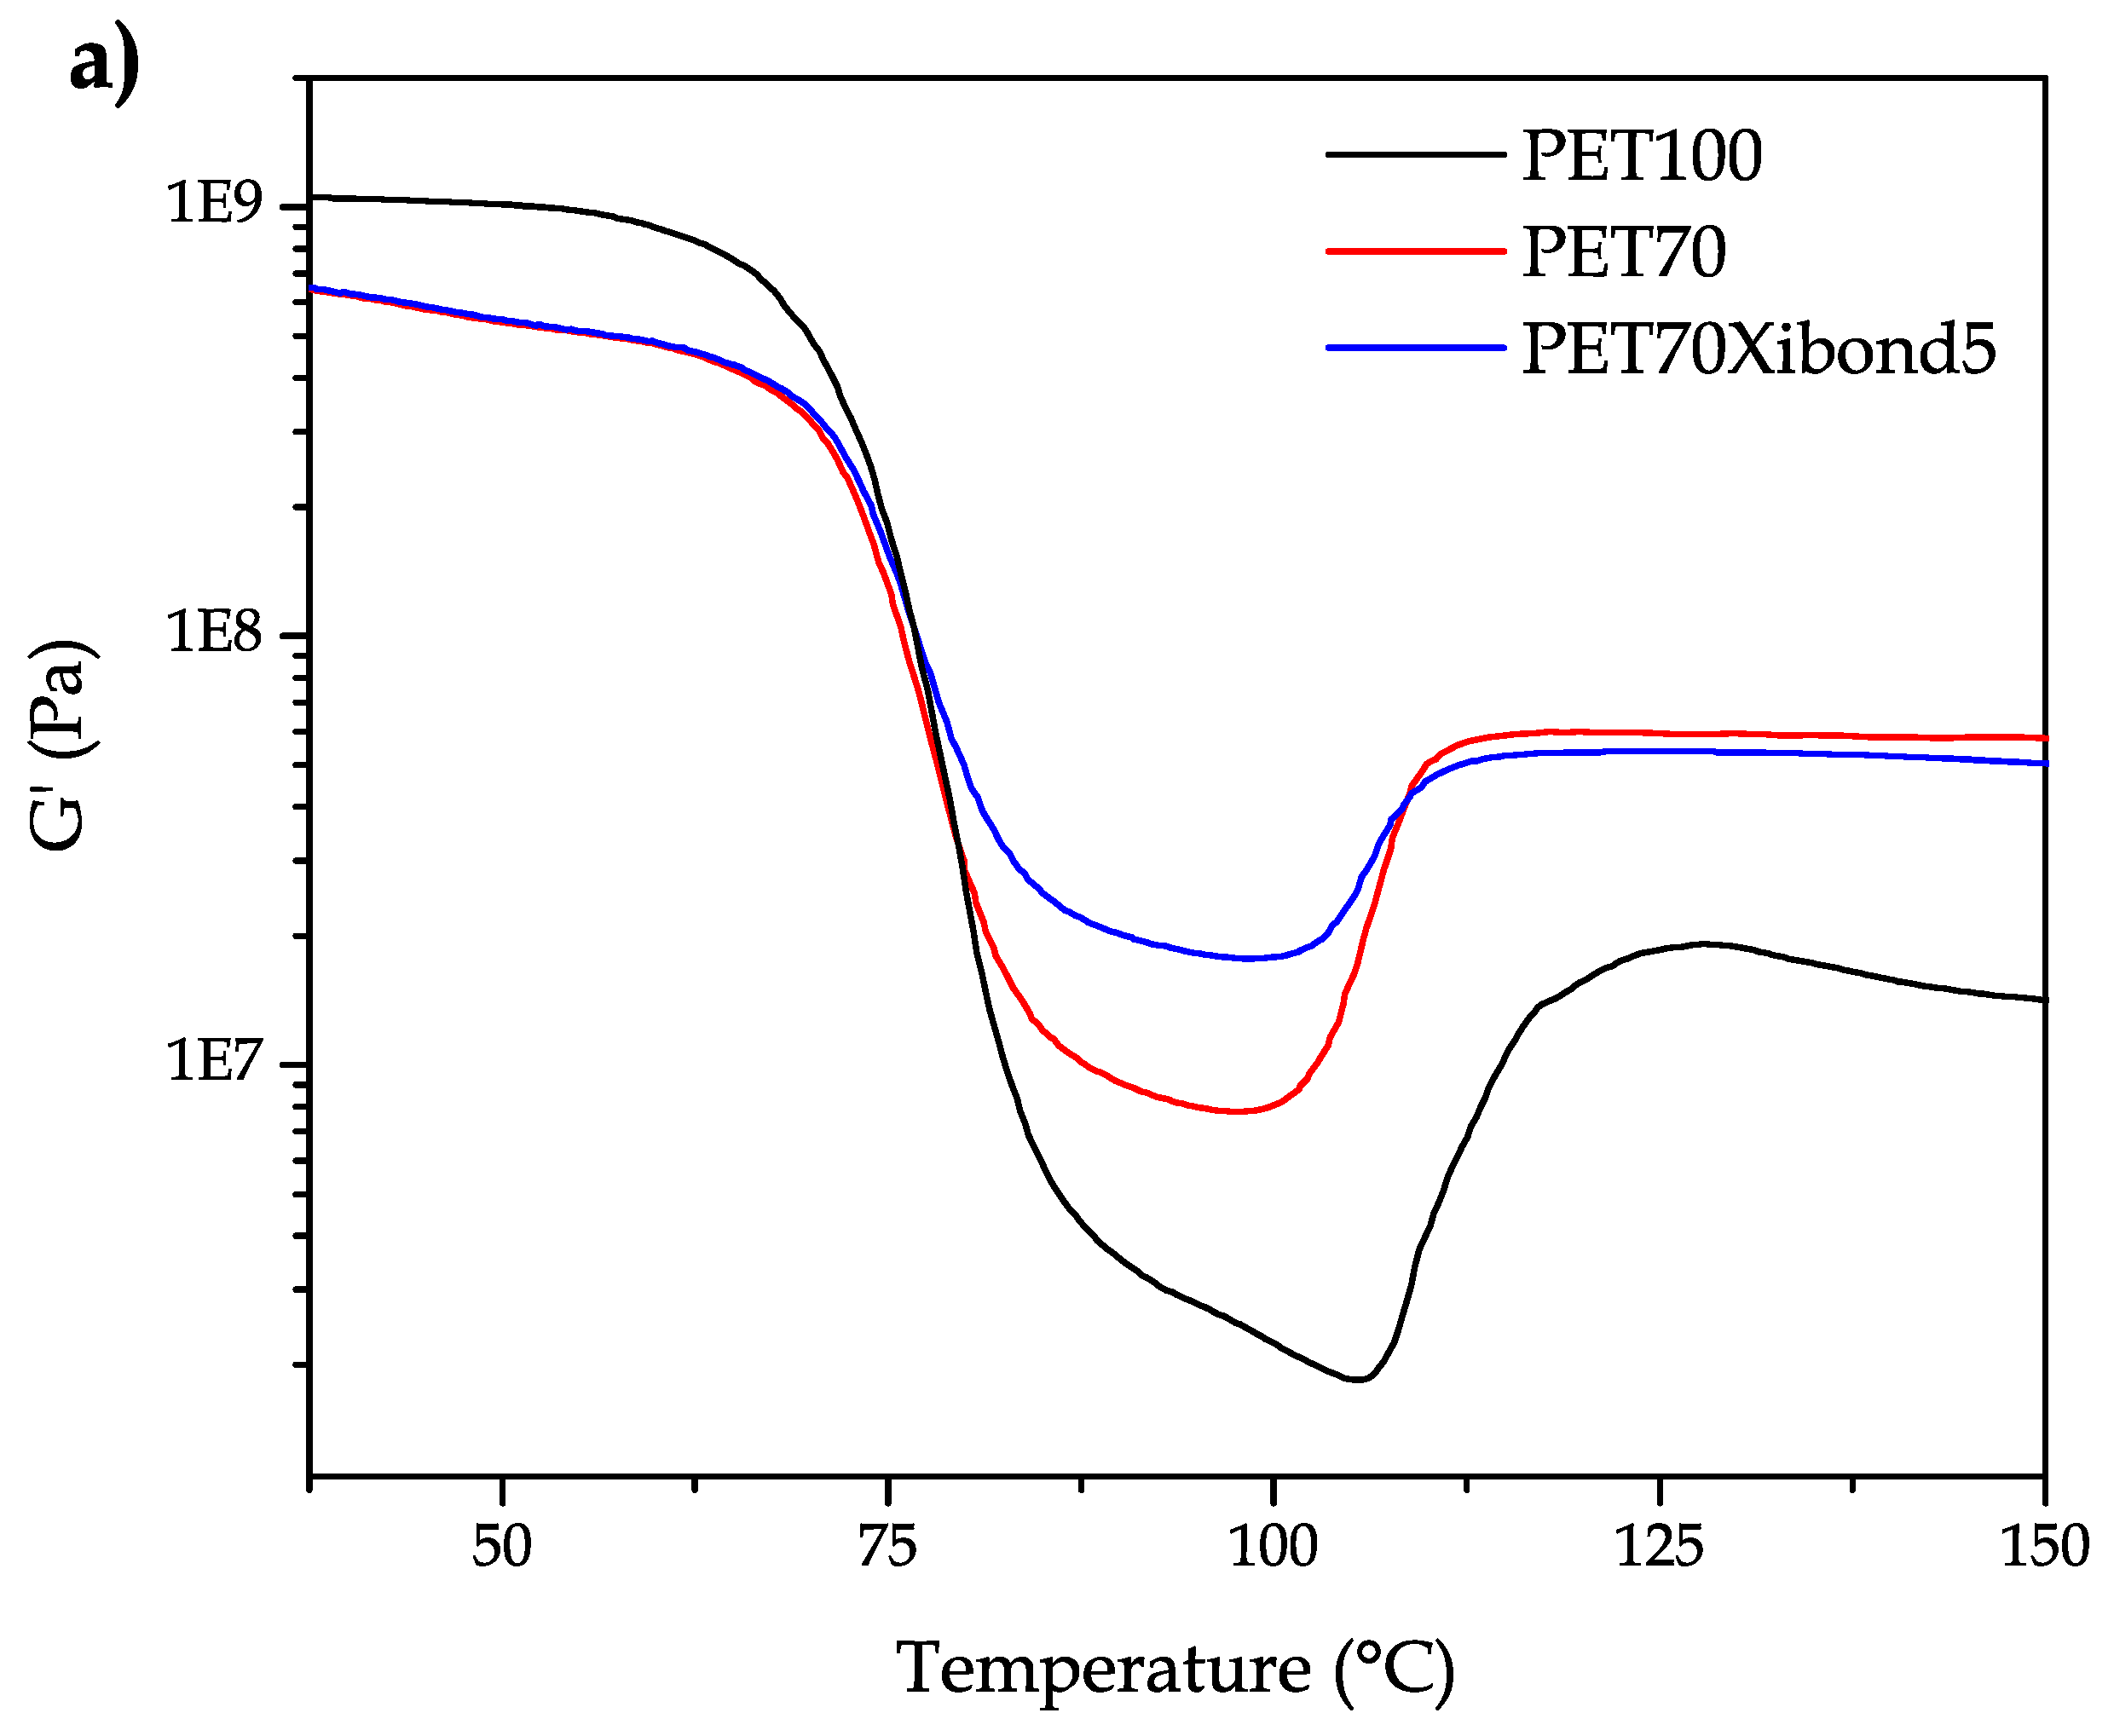
Regarding the effect of bioPA and the PS-GMA copolymer on mechanical-dynamical thermal properties,
Figure 7 gathers some characteristic curves corresponding to the neat bioPET and the uncompatibilized and compatibilized (5 phr Xibond™ 920) blend with 30 wt % bioPA. Two main effects can be observed on the storage modulus,
G′. On the one hand, bioPET is stiffer than its blends with bioPA independently of the PS-GMA compatibilizer. T. Serhatkulu et al. [
65] showed this flexibilization phenomenon on PET/PA6 blends. On the other hand, the presence of bioPA minimizes the cold crystallization process as observed in DSC. In fact, some cold crystallization occurs in bioPET/bioPA blends but DSC is not sensitive enough to detect it. However, these slight changes can be observed by DMTA as seen in
Figure 7a. Another interesting phenomenon is the shift of the cold crystallization process towards lower temperatures which is in total accordance with the results obtained by DSC. The intensity of the cold crystallization can be observed in
Figure 7b as the shoulder located to the right side. The
Tg values follow a similar tendency as that observed with DSC but DMTA seems to be more accurate to obtain these parameters. In particular, the
Tg for neat bioPET is 79.9
while the binary blend with 30 wt % bioPA shows a
Tg of 81.1
and the compatibilized blend (PET70Xibond5) offers a
Tg of 80.5
.
In addition to the dynamic mechanical-thermal analysis (DMTA), the dimensional stability has been studied by thermomechanical analysis (TMA).
Figure 8 shows the TMA profiles of neat bioPET as well as the uncompatibilized and compatibilized (5 phr Xiboond™ 920) blend containing 30 wt % bioPA. From these TMA curves, it is possible to see the thermal behaviour of these materials. Below 60
, all three materials show a linear expansion (see
Table 6 for values of the coefficient of linear thermal expansion, CLTE). Below this temperature, the slope is low compared to the slope above 120
. The glass transition temperature (
Tg) can be observed in the temperature range of 65–80
as the onset of a change in the slope. The slope is very high in the rubbery state from 80
up to 100
. Then, the slope is negative which is indicating increased dimensional stability. This is caused by the cold crystallization process. As seen previously by DSC, the cold crystallization peak is clearly detectable for neat bioPET and it is almost negligible for blends with high bioPA content. These results are in accordance with those shown in
Figure 6 as the highest change in the dimensions can be seen for neat bioPET due to the cold crystallization process. Nevertheless, this change is very short for the other developed materials. Finally, above 120
, the linear tendency stabilizes, therefore indicating the cold crystallization has finished. Regarding the CLTE values (
Table 6), it is worthy to note they follow the same tendency observed for ductile properties. The CLTE for neat bioPET is 152.4 μm m
−1 K
−1, and it increases with increasing bioPA loading up to values of 347.3 μm m
−1 K
−1. The effect of the compatibilizer is that expected since the reaction between the PS-GMA and bioPET and bioPA produces a restriction on chain mobility and this has a positive effect on dimensional stability. Notably, the CLTE value for the blend with 30 wt % bioiPA is compatibilized with 5 phr Xibond™ 920. All these results are in total agreement with the mechanical properties above-mentioned.

 ,
, 


