
Analysis and Simulation of Polymer Injectivity Test in a High Temperature High Salinity Carbonate Reservoir


Abstract
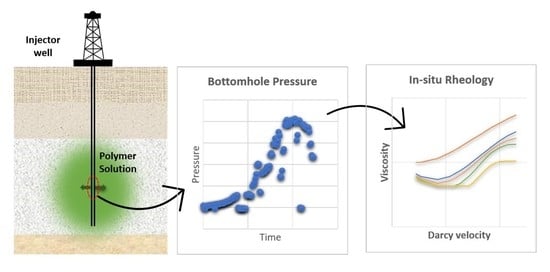
1. Introduction
2. Field Polymer Injectivity Test Summary
3. Simulation Approach
- Establish reliable model inputs by history matching water injection baseline BHP.
- Test BHP sensitivity to rate and/or concentration stepping with generic in situ rheology curves.
- Investigate the impact of RRF dependence on permeability and sensitivity to different permeability-RRF correlations.
- Use in situ rheology and RRF as key parameters to history match polymer injection and chase water BHP.
- Compare obtained polymer behavior to lab data.
3.1. Model Description
3.2. Polymer Properties
3.3. Water Injection Baseline History Match Approach
3.4. Impact of Rate and Concentration Stepping
- Constant rate and constant concentration
- Concentration steps at constant rate
- Rate steps with:
- ○
- Constant concentration
- ○
- Increasing concentration
- ○
- Decreasing concentration
3.5. Impact of Residual Resistance Factor (RRF)
3.6. Polymer Injection History Matching Approach
4. Results and Discussion
4.1. Water Injection Baseline History Matching
4.2. Sensitivity to Rate and Concentration Stepping
4.3. Sensitivity to Residual Resistance Factor (RRF)
4.4. Analysis of Field Bottom-Hole Pressure Data
4.5. History Matching Polymer Injection and Chase Water
5. Conclusions
- PLT logs of water baseline injection prior to polymer injection can be utilized to match vertical injection distribution across perforated zone. This practice can provide a more accurate permeability inputs especially for cases where significant uncertainty in permeability exists.
- Average RRF values corrected to weighted average formation capacity are sufficient for BHP history matching purposes as they yield similar results as permeability-dependent RRF correlations.
- Date from field downhole measurements of BHP versus injection rates can be utilized to detect in situ fluid rheology. Newtonian water injection showed linear trend while polymer injection showed a non-linear trend with increasing slope reflecting shear thickening behavior.
- The degree of degradation due to pre-shearing can be represented in the model by reducing injected concentration by the same percentage and applying multiple rheology realizations to account for degradation impact.
- The non-Newtonian behavior in the near-wellbore region can be distinguished from the Newtonian behavior by the characteristics of longer transient pressure build up due to the velocity-dependent viscosity.
Author Contributions
Funding
Institutional Review Board Statement
Informed Consent Statement
Acknowledgments
Conflicts of Interest
Appendix A

| Parameter | Value |
|---|---|
| Reservoir temperature | 120 °C |
| Bubble point pressure | 14,755 kPa |
| Oil density | 815.18 Kg/m3 |
| Oil viscosity | 0.32 mPa.s |
| Water density | 1174.79 Kg/m3 |


References
- Chauveteau, G. Molecular Interpretation of Several Different Properties of Flow of Coil Polymer Solutions through Porous Media in Oil Recovery Conditions. In Proceedings of the SPE Annual Technical Conference and Exhibition, San Antonio, TX, USA, 4–7 October 1981. SPE 10060. [Google Scholar]
- Sorbie, K.S. Polymer-Improved Oil Recovery; Springer Netherlands: Heidelberg, The Netherlands, 1991. [Google Scholar]
- Zamani, N.; Bondino, I.; Kaufmann, R.; Skauge, A. Effect of porous media properties on the onset of polymer extensional viscosity. J. Pet. Sci. Eng. 2015, 133, 483–495. [Google Scholar] [CrossRef]
- Zamani, N.; Bondino, I.; Kaufmann, R.; Skauge, A. Computation of polymer in-situ using direct numerical simulation. J. Pet. Sci. Eng. 2017, 159, 92–102. [Google Scholar] [CrossRef]
- Skauge, A.; Zamani, N.; Jacobsen, J.G.; Shiran, B.S.; Al-Shakry, B.; Skauge, T. Polymer flow in porous media: Relevance to enhanced oil recovery. Colloids Interfaces 2018, 2, 27. [Google Scholar] [CrossRef]
- Jacobsen, J.G.; Alzaabi, M.; Skauge, T.; Sorbie, K.; Skauge, A. Analysis and Simulation of Polymer Injectivity. In Proceedings of the 20th European Symposium on Improved Oil Recovery, Pau, France, 8–11 April 2019. [Google Scholar]
- Skauge, T.; Kvilhaug, O.A.; Skauge, A. Influence of Polymer Structural Conformation and Phase Behavior on In-situ Viscosity. In Proceedings of the 18th European Symposium on Improved Oil Recovery, Dresden, Germany, 14–16 April 2015. [Google Scholar]
- Skauge, T.; Skauge, A.; Salmo, I.C.; Ormehaug, P.A.; Al-Azri, N.; Wassing, L.M.; Glasbergen, G.; Van Wunnik, J.N.; Masalmeh, S.K. Radial and Linear Polymer Flow—Influence on Injectivity. In Proceedings of the SPE Improved Oil Recovery Conference, Tulsa, OK, USA, 11–13 April 2016. paper SPE-179694-MS. [Google Scholar]
- Jacobsen, J.G.; Skauge, T.; Sorbie, K.S.; Skauge, A. Qualification of new methods for measuring in-situ rheology of non-newtonian fluids in porous media. Polymers 2020, 12, 452. [Google Scholar] [CrossRef] [PubMed]
- Alzaabi, M.A.; Jacobsen, J.G.; Sumaiti, A.A.; Masalmeh, S.; Pettersen, Ø.; Skauge, A. Polymer Injectivity Test Design Using Numerical Simulation. Polymers 2020, 12, 801. [Google Scholar] [CrossRef] [PubMed]
- Sheng, J.J.; Leonhardt, B.; Azri, N. Status of polymer-flooding technology. J. Can. Pet. Technol. 2015, 54, 116–126. [Google Scholar] [CrossRef]
- Manrique, E.; Ahmadi, M.; Samani, S. Historical and Recent observations in polymer floods: An update review. CTF—Cienc. Tecnol. Futuro 2015, 6, 17–48. [Google Scholar] [CrossRef]
- Jouenne, S. Polymer Flooding in high temperature, high salinity conditions: Selection of polymer type and polymer chemistry, thermal stability. J. Pet. Sci. Eng. 2020, 195, 107545. [Google Scholar] [CrossRef]
- Dupuis, G.; Antignard, S.; Giovannetti, B.; Gaillard, N.; Jouenne, S.; Bourdarot, G.; Morel, D.; Zaitoun, A. A New Thermally Stable Synthetic Polymer for Harsh Conditions of Middle East Reservoirs. Part I. Thermal Stability and Injection in Carbonate Cores. In Proceedings of the Abu Dhabi International Petroleum Exhibition & Conference, Abu Dhabi, UAE, 13–16 November 2017. SPE 188479. [Google Scholar]
- Alfazazi, U.; AlAmeri, W.; Hashmet, M.R. Screening of New HPAM Base Polymers for Applications in High Temperature and High Salinity Carbonate Reservoirs. In Proceedings of the Abu Dhabi International Petroleum Exhibition and Conference, Abu Dhabi, UAE, 12–15 November 2018. SPE 192805. [Google Scholar]
- Masalmeh, S.; AlSumaiti, A.; Gaillard, N.; Daguerre, F.; Skauge, T.; Skuage, A. Extending Polymer Flooding Towards High-Temperature and High-Salinity Carbonate Reservoirs. In Proceedings of the Abu Dhabi International Petroleum Exhibition & Conference, Abu Dhabi, UAE, 11–14 November 2019. SPE-197647-MS. [Google Scholar]
- Skauge, T.; Ormehaug, P.A.; Al-Sumaiti, A.; Masalmeh, S.; Skauge, A. Polymer Stability at Harsh Temperature and Salinity Conditions. In Proceedings of the SPE Conference at Oman Petroleum & Energy Show, Muscat, Oman, 9–11 March 2020. SPE-2001780-MS. [Google Scholar]
- Seright, R.S.; Wavrik, K.E.; Zhang, G.; AlSofi, A.M. Stability and behavior in carbonate cores for new enhanced-oil-recovery polymers at elevated temperatures in hard saline brines. SPE Reserv. Eval. Eng. 2020, 24, 1–18. [Google Scholar] [CrossRef]
- Rachapudi, R.V.; Alshehhi, S.S.; BinAmro, A.A.; Masalmeh, S.K.; Dey, A.; Al Nuimi, S.M.; Kenawy, M.M.; Fabbri, C.; Romero, C.; Xu, S.; et al. World First Polymer Injectivity Test in High Salinity and High Temperature Carbonate Reservoir, Case Study from a Giant Reservoir in UAE. In Proceedings of the Abu Dhabi International Petroleum Exhibition & Conference, Abu Dhabi, UAE, 9–12 November 2020. SPE-203405. [Google Scholar]
- Hinestrosa, J.M.L.; Masalmeh, S.K. Interpretation of World First Polymer Injectivity Test in a HTHS Carbonate Reservoir using SW Radial Model. In Proceedings of the 21st European Symposium on Improved Oil Recovery, Vienna, Austria, 19–22 April 2021. [Google Scholar]
- Masalmeh, S.K.; Wei, L.; Hillgartner, H.; Al-Mjeni, R.; Blom, C. Developing High Resolution Static and Dynamic Models for Waterflood History Matching and EOR Evaluation of a Middle Eastern Carbonate Reservoir. In Proceedings of the Abu Dhabi International Petroleum Conference and Exhibition, Abu Dhabi, UAE, 11–14 November 2012. SPE-161485-MS. [Google Scholar]
- Masalmeh, S.K.; Wei, L.; Blom, C.; Jing, X.D. EOR Options for Heterogeneous Carbonate Reservoirs Currently Under Waterflooding. In Proceedings of the Abu Dhabi International Petroleum Exhibition & Conference, Abu Dhabi, UAE, 10–13 November 2014. SPE-171900. [Google Scholar]
- Delshad, M.; Kim, D.H.; Magbagbeola, O.A.; Huh, C.; Pope, G.A.; Tarahhom, F. Mechanistic Interpretation and Utilization of Viscoelastic Behavior of Polymer Solutions for Improved Polymer-Flood Efficiency. In Proceedings of the SPE Symposium on Improved Oil Recovery, Tulsa, OK, USA, 20–23 April 2008. SPE-113620-MS. [Google Scholar]


| Grid Type | Radial |
|---|---|
| Well type | Vertical |
| Grid dimensions | 20 × 1 × 89 |
| Innermost grid size | 0.08 m |
| Outermost grid size | 343 m |
| Total radius | 914 m |
| Layer thickness | 0.38–3.66 m |
| Total thickness | 90 m |
| Perforated section | Layers 23 to 55 (20 m) |
| Scenario | Value(s) |
|---|---|
| Constant rate | 480 m3/day |
| Rate steps | 160, 480, and 795 m3/day |
| Constant concentration | 1,600 ppm |
| Concentration steps | 600, 1,600, and 2,700 ppm |
| 2700 ppm | 1600 ppm | 600 ppm | |
|---|---|---|---|
| u | 0.02 to 300 m/day | ||
| µmax | 10 | 4.5 | 1.35 |
| n2 | 1.5 | ||
| λ2 | 1.00 E + 04 | ||
| µ∞ | 0.43 | ||
| µ0 | 10 | 4.5 | 2 |
| n1 | 0.2 | 0.5 | 0.8 |
| λ1 | 1.00 E + 06 | ||
| Scenario | RRF Correlation | Kmin (×10−15 m2) | Weighted Average RRF |
|---|---|---|---|
| Low | 5 | 4.171 | |
| Mid | 10 | 3.322 | |
| High | 20 | 2.506 |
| 3150 ppm | 2520 ppm | 1890 ppm | 1260 ppm | 630 ppm | |
|---|---|---|---|---|---|
| u | 0.02 to 120 m/day | ||||
| µmax | 17 | 8 | 5.5 | 4 | 2 |
| n2 | 1.36 | 1.52 | 1.6 | 1.75 | 2.2 |
| λ2 | 1.2 E + 03 | 2.0 E + 03 | 4.0 E + 03 | 6.0 E + 03 | 1.0 E + 04 |
| µ∞ | 0.43 | ||||
| µ0 | 2 | ||||
| n1 | 0.5 | ||||
| λ1 | 1.00 E + 07 | ||||
Publisher’s Note: MDPI stays neutral with regard to jurisdictional claims in published maps and institutional affiliations. |
© 2021 by the authors. Licensee MDPI, Basel, Switzerland. This article is an open access article distributed under the terms and conditions of the Creative Commons Attribution (CC BY) license (https://creativecommons.org/licenses/by/4.0/).
Share and Cite
Alzaabi, M.A.; Leon, J.M.; Skauge, A.; Masalmeh, S. Analysis and Simulation of Polymer Injectivity Test in a High Temperature High Salinity Carbonate Reservoir. Polymers 2021, 13, 1765. https://doi.org/10.3390/polym13111765
Alzaabi MA, Leon JM, Skauge A, Masalmeh S. Analysis and Simulation of Polymer Injectivity Test in a High Temperature High Salinity Carbonate Reservoir. Polymers. 2021; 13(11):1765. https://doi.org/10.3390/polym13111765
Chicago/Turabian StyleAlzaabi, Mohamed Adel, Juan Manuel Leon, Arne Skauge, and Shehadeh Masalmeh. 2021. "Analysis and Simulation of Polymer Injectivity Test in a High Temperature High Salinity Carbonate Reservoir" Polymers 13, no. 11: 1765. https://doi.org/10.3390/polym13111765
APA StyleAlzaabi, M. A., Leon, J. M., Skauge, A., & Masalmeh, S. (2021). Analysis and Simulation of Polymer Injectivity Test in a High Temperature High Salinity Carbonate Reservoir. Polymers, 13(11), 1765. https://doi.org/10.3390/polym13111765