
Simulation of the Hybrid Carbon-Aramid Composite Materials Based on Mechanical Characterization by Digital Image Correlation Method


Abstract
:
1. Introduction
2. Materials and Methods
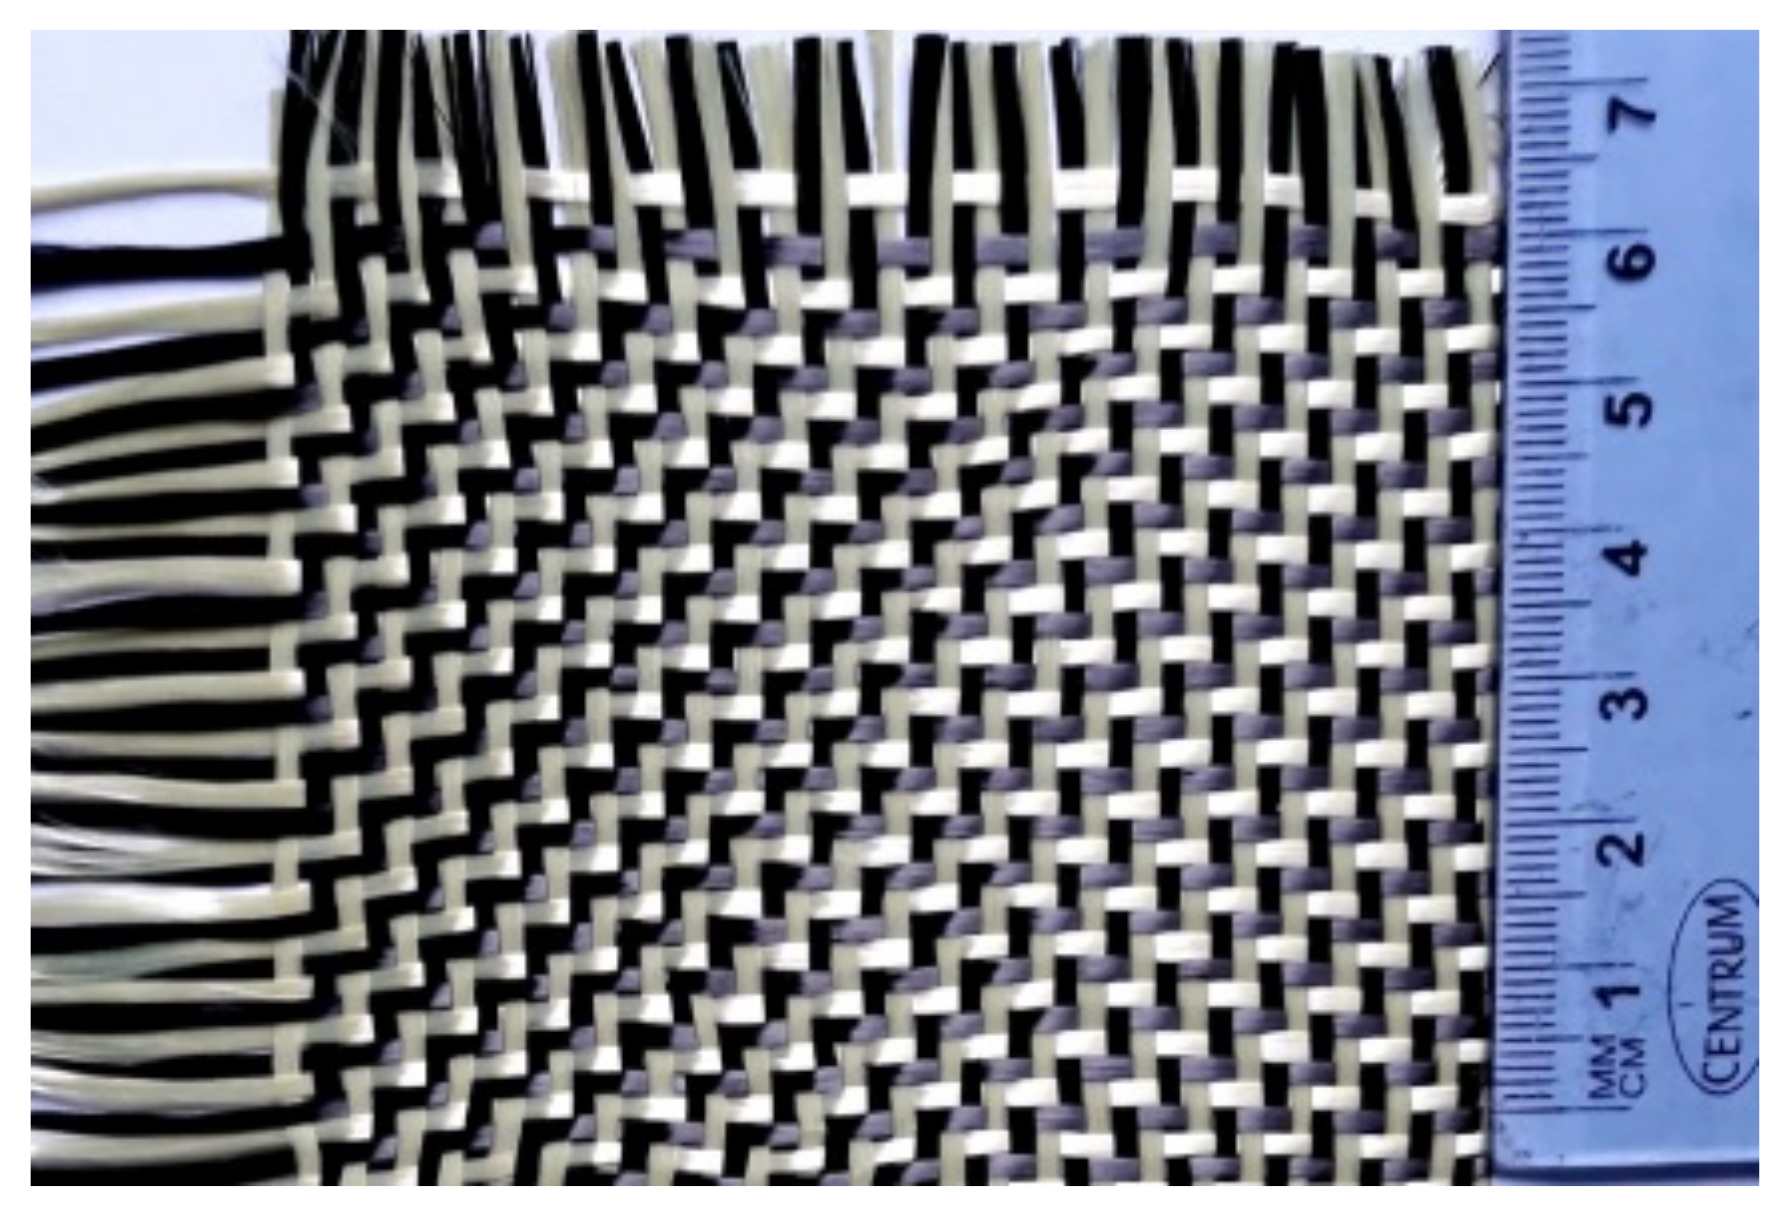
2.1. Materials
2.2. Experimental Work Method
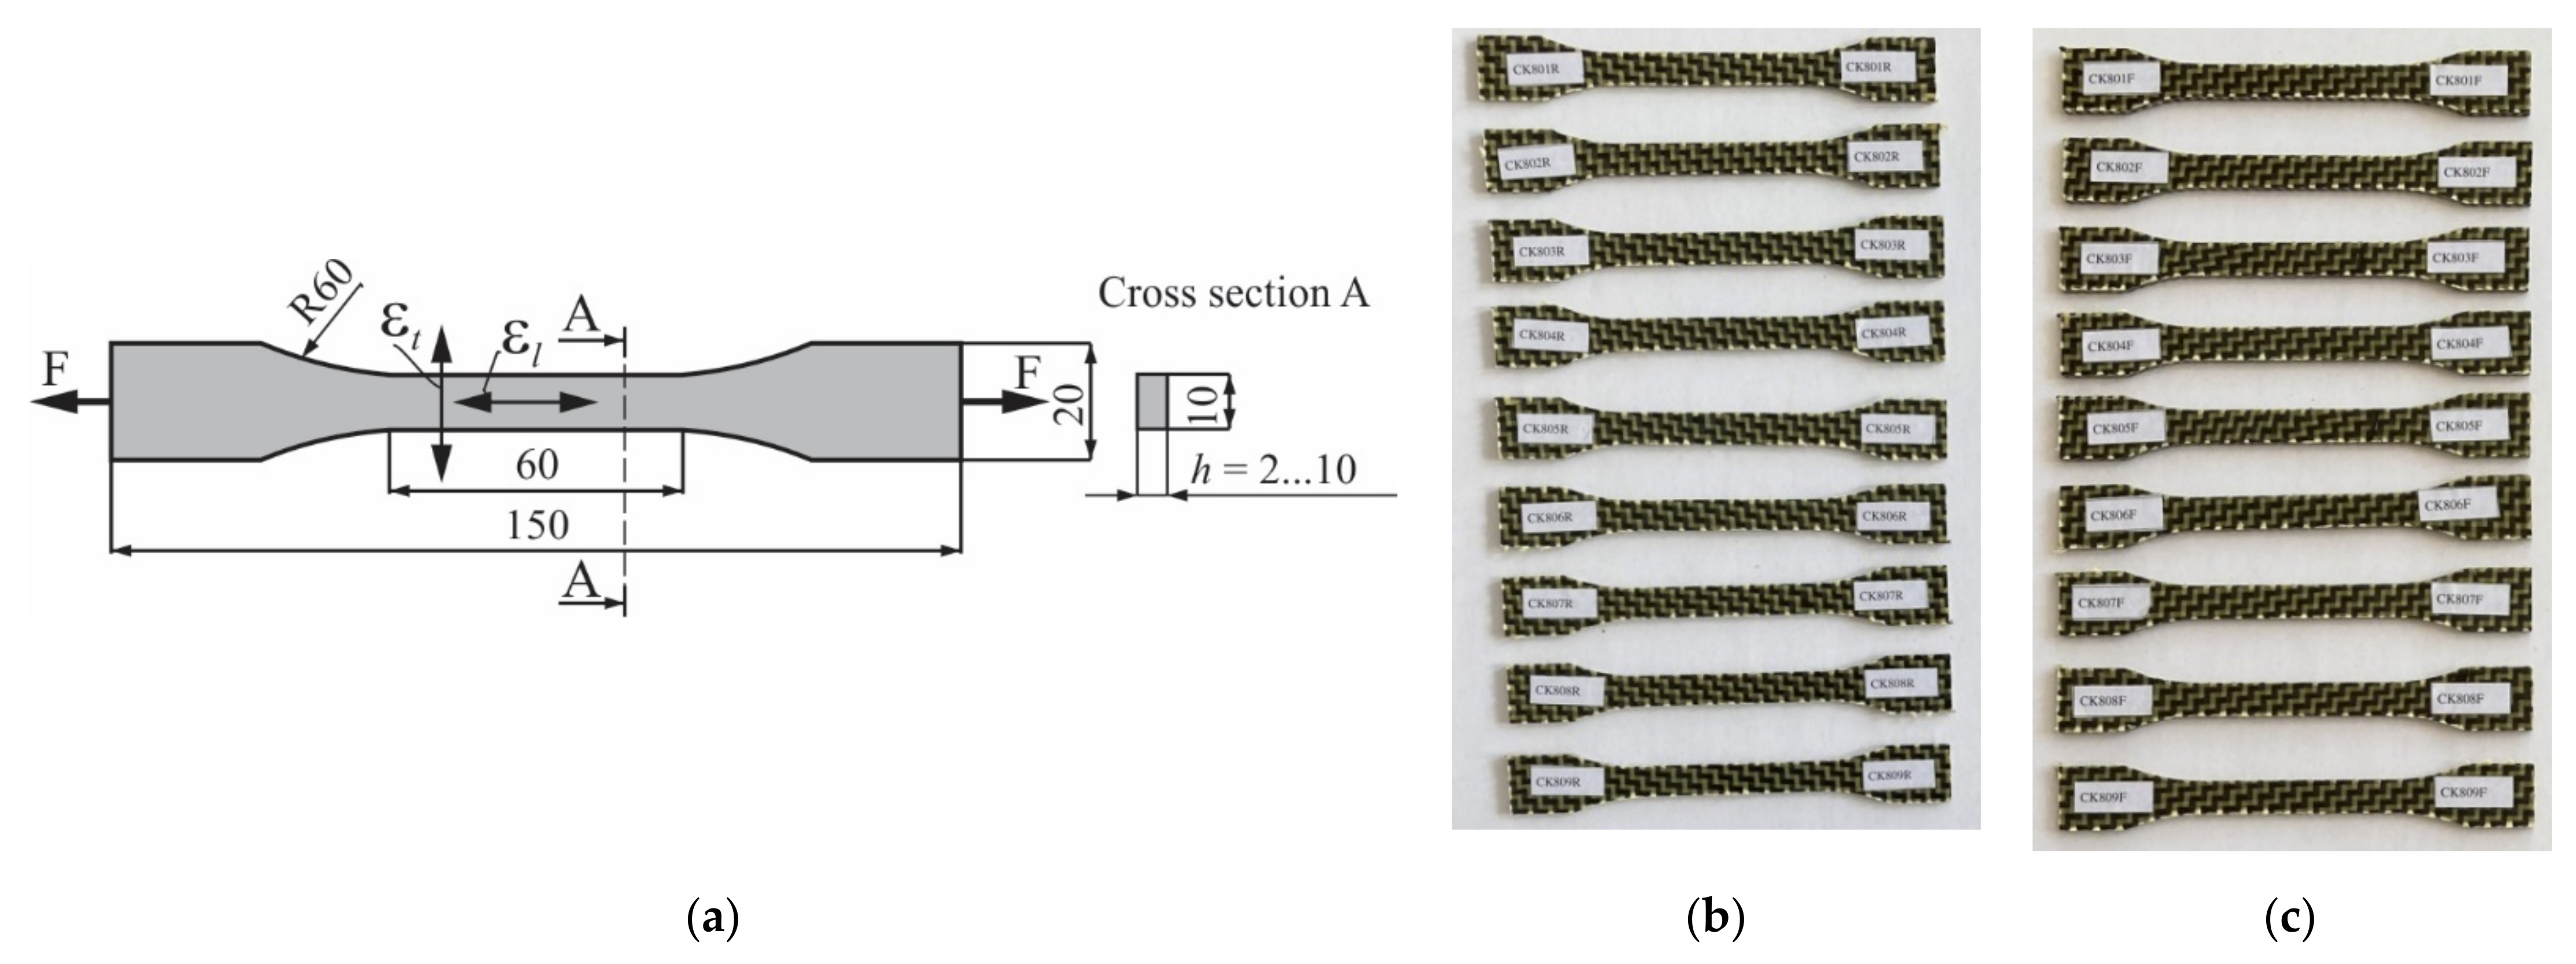
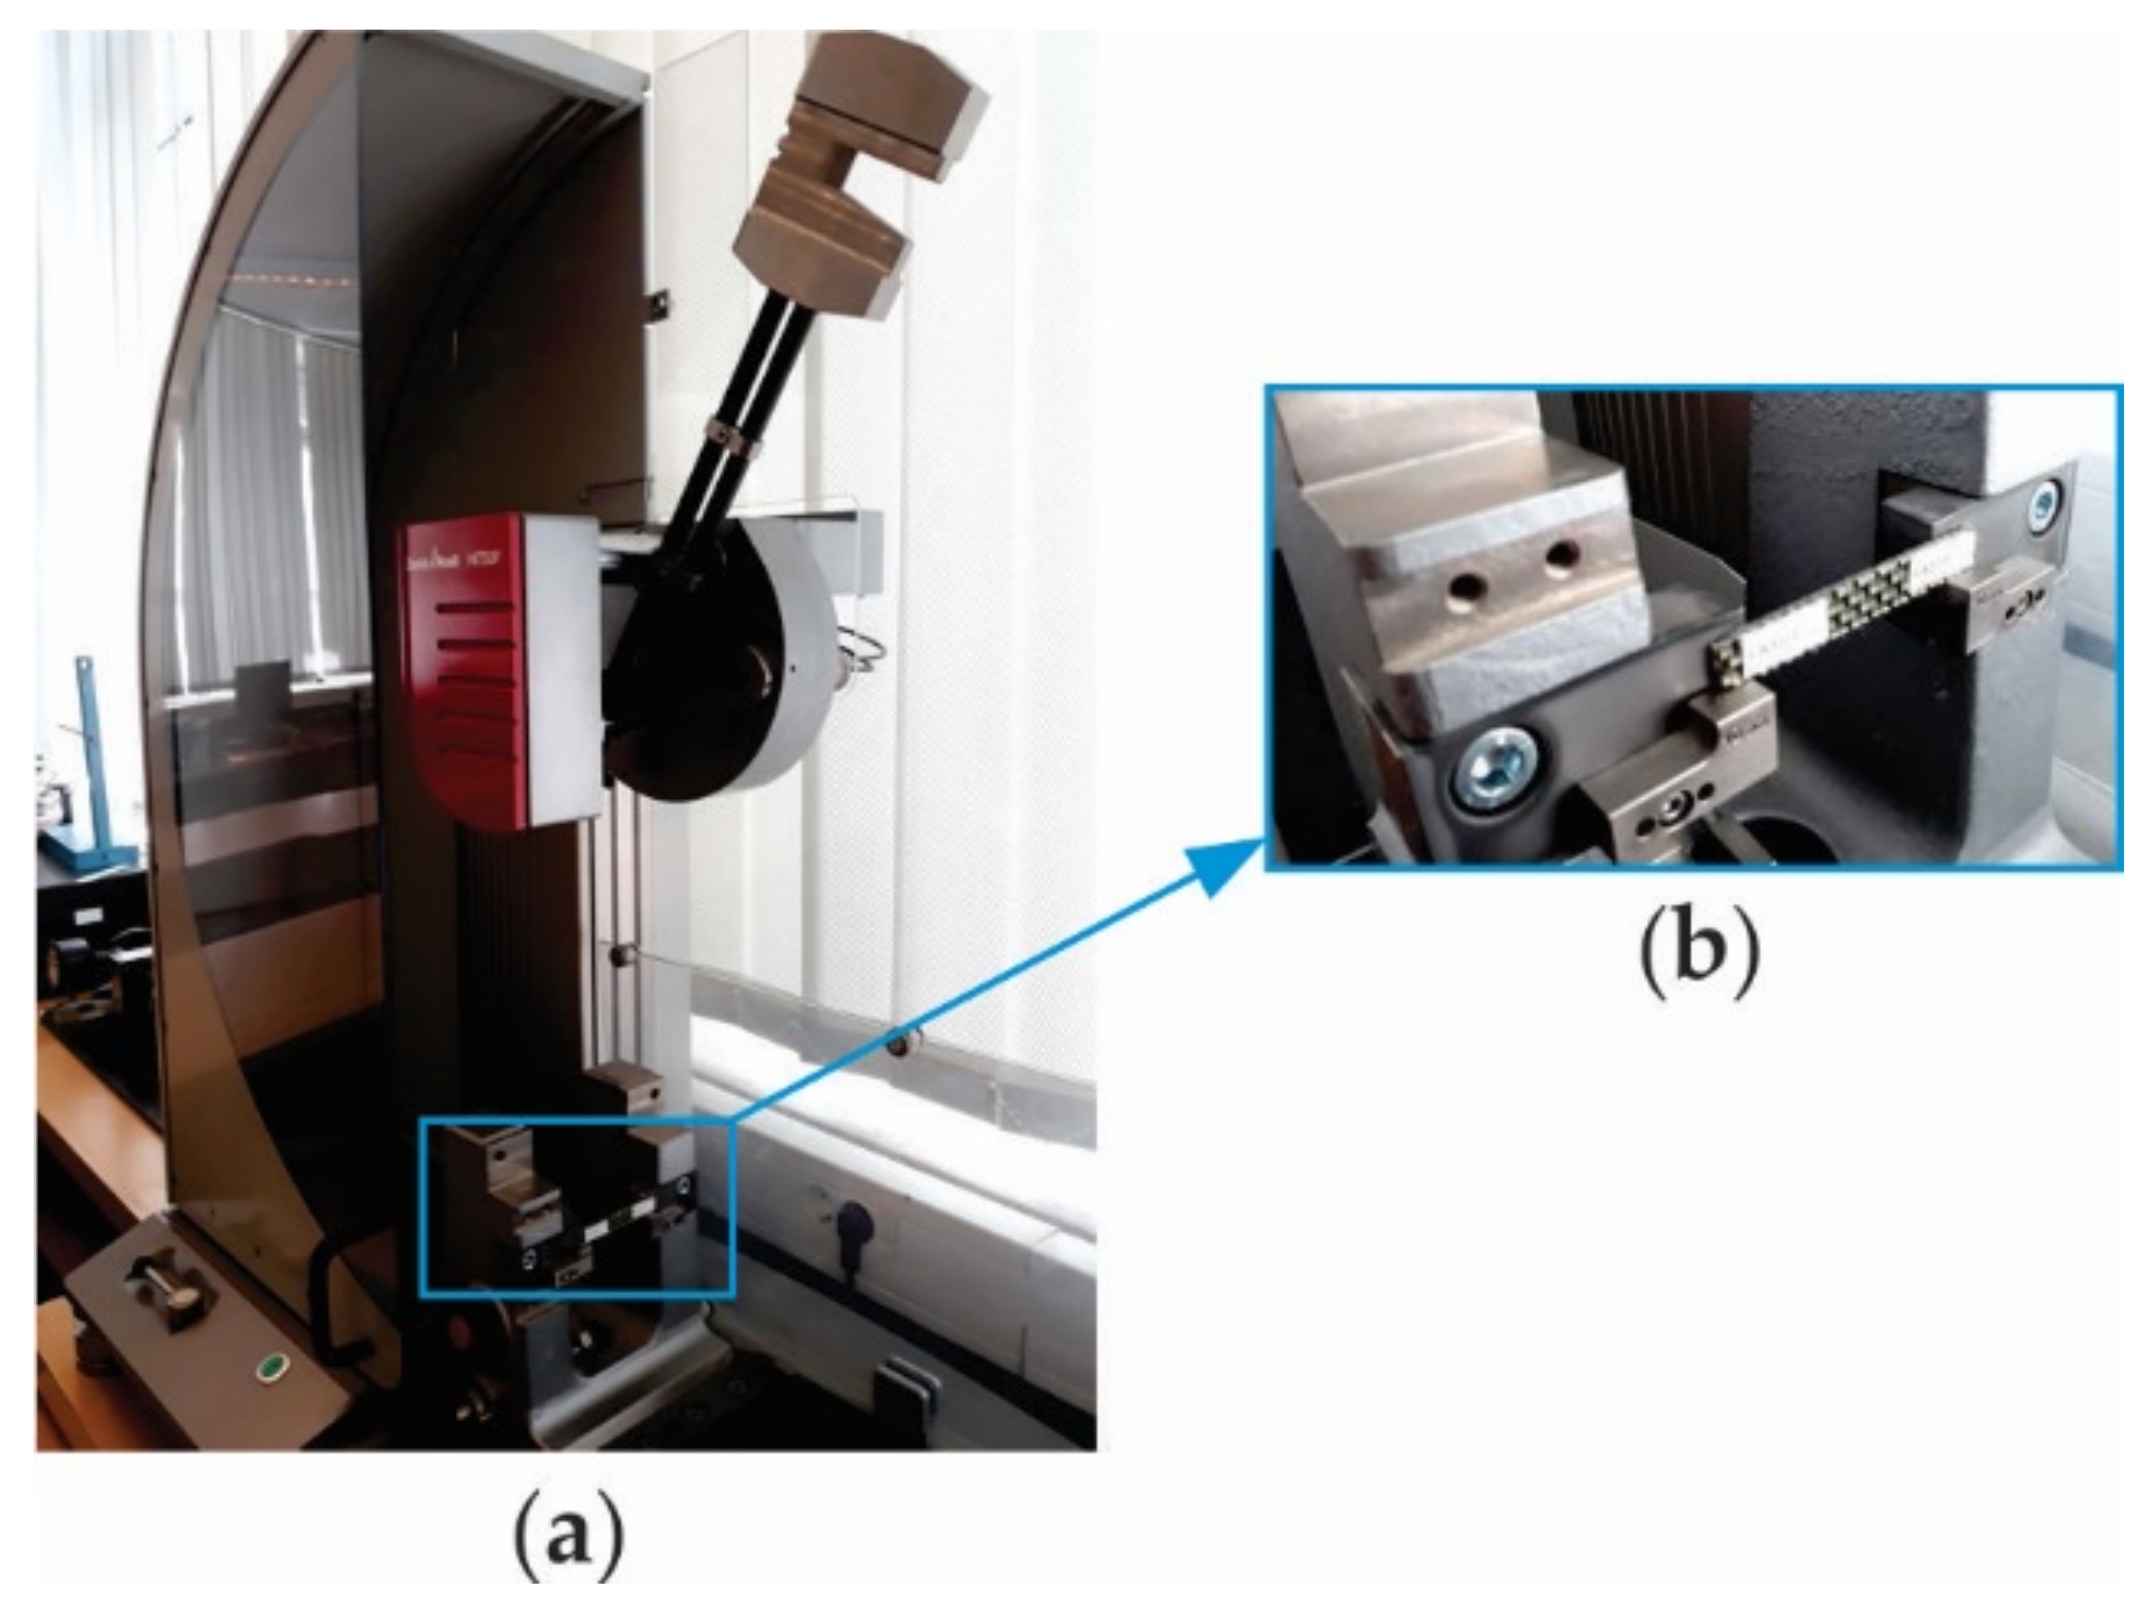
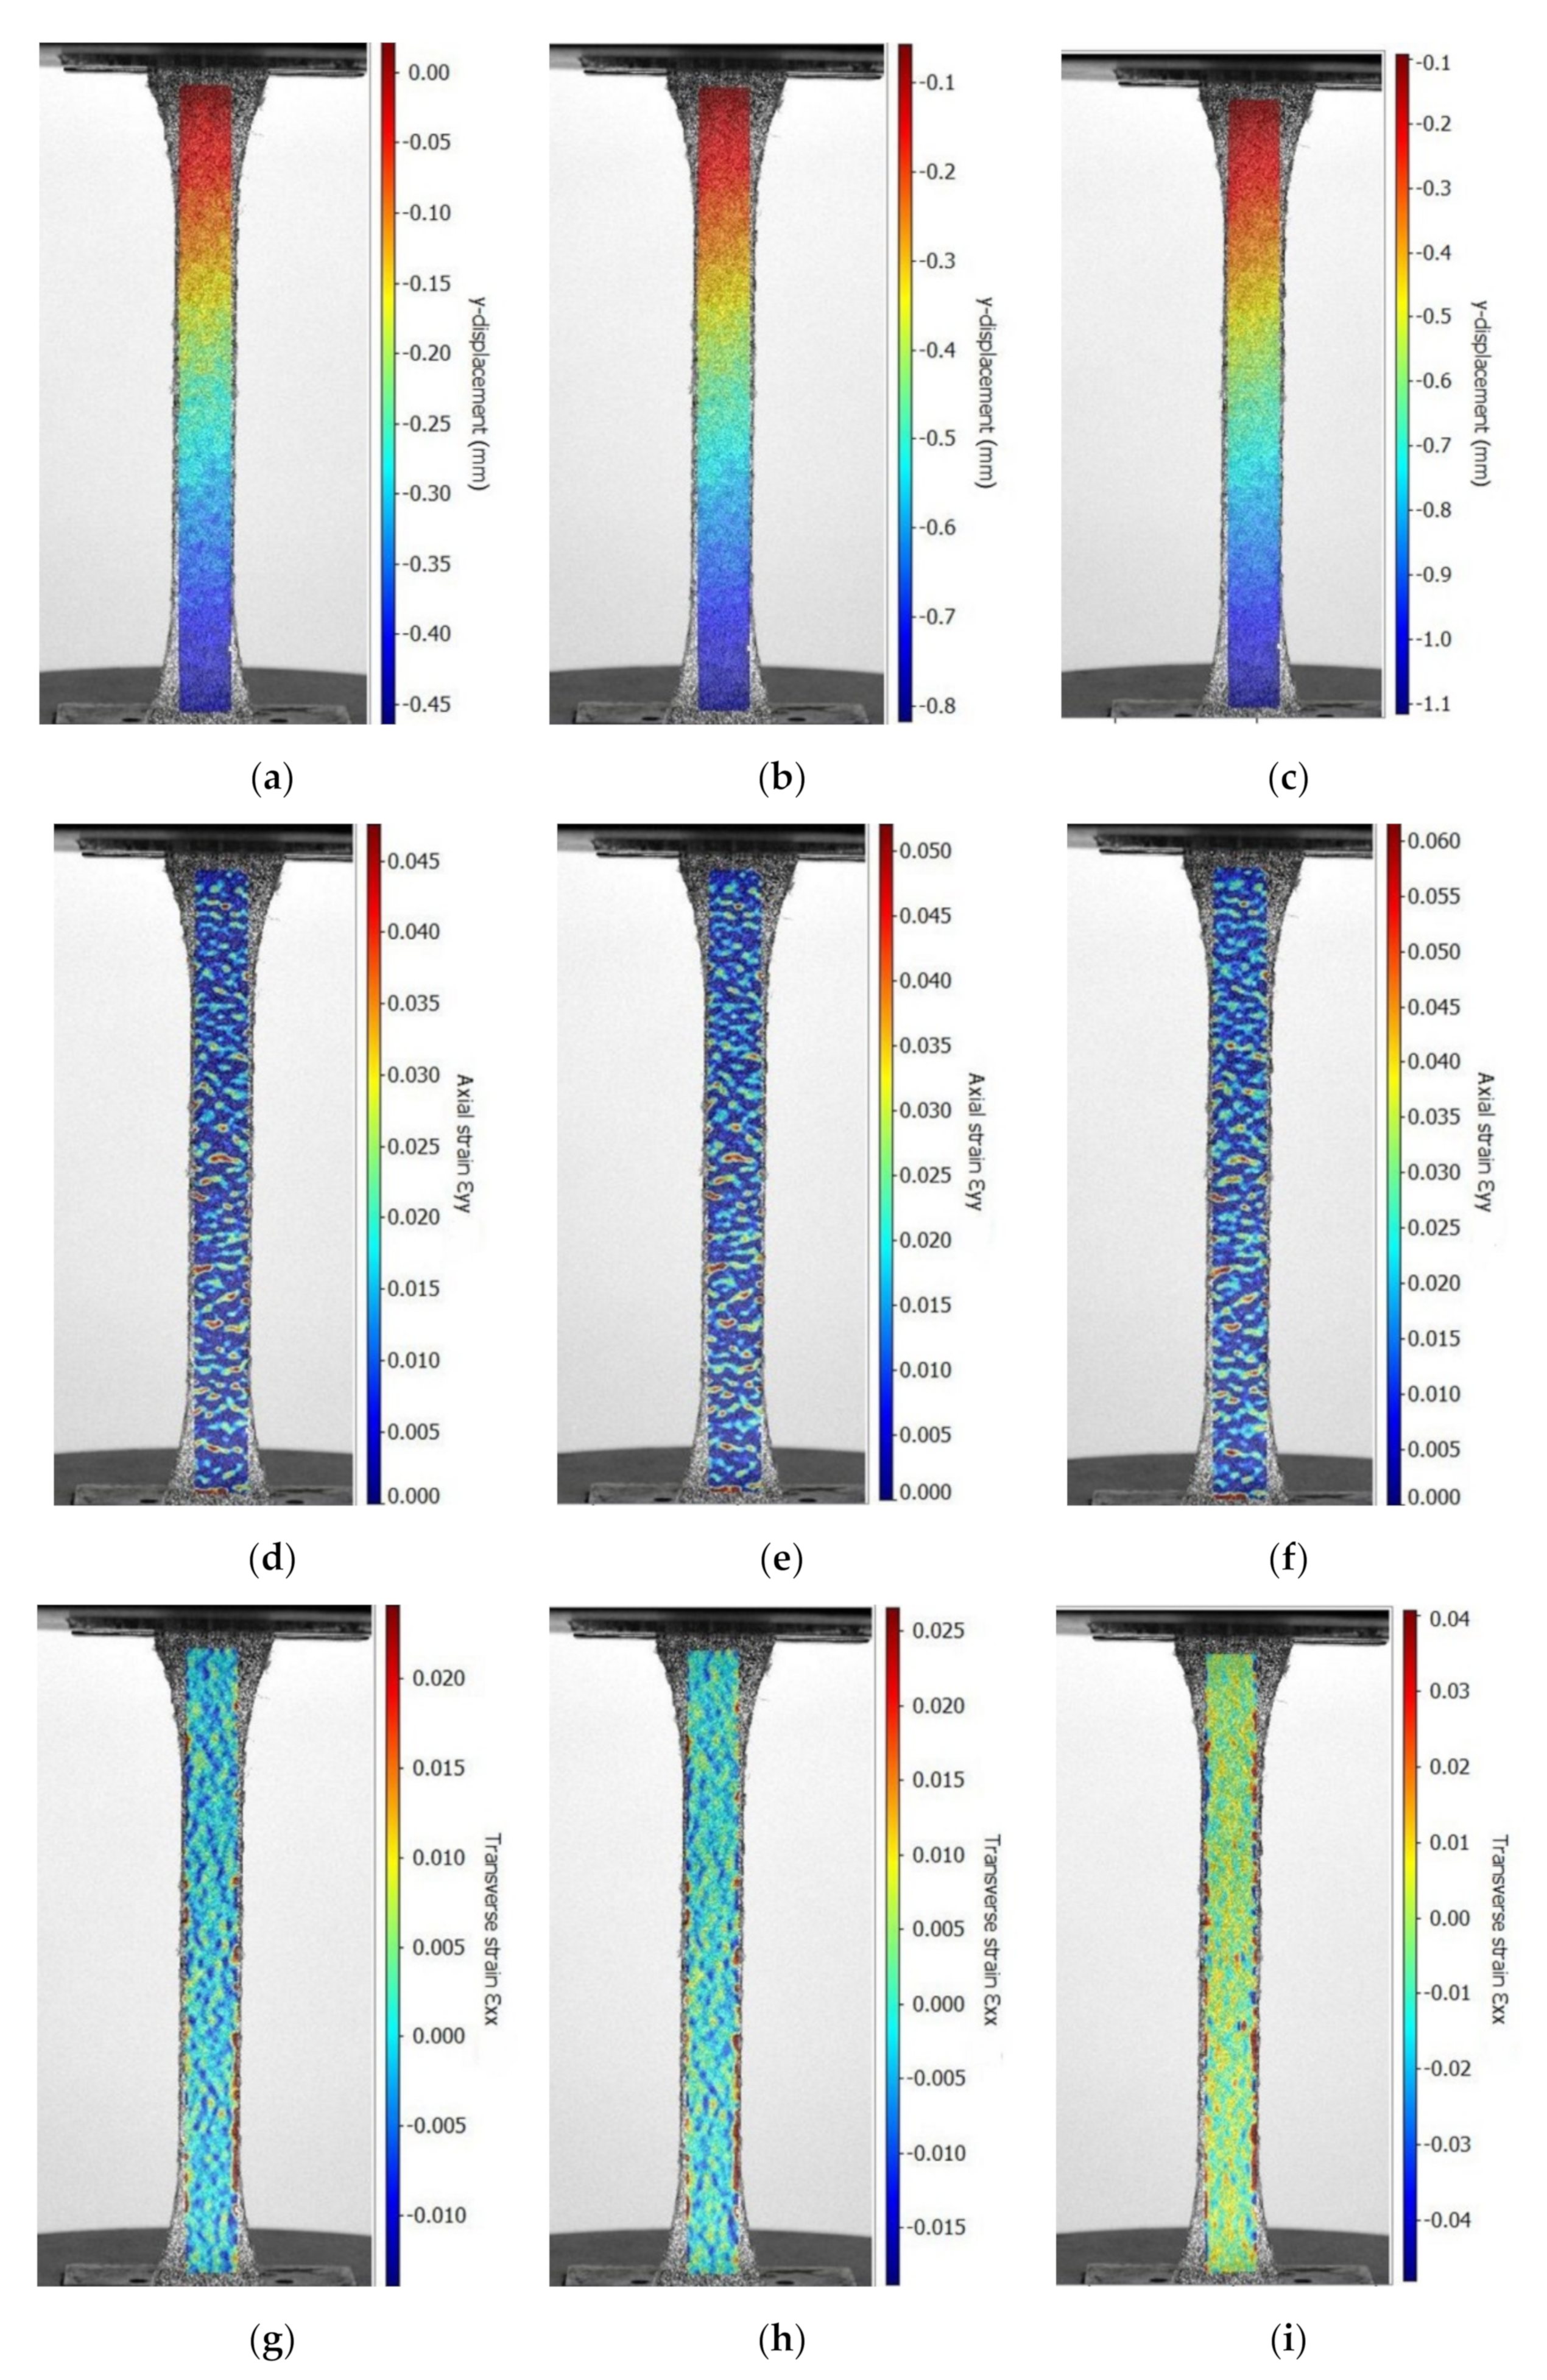
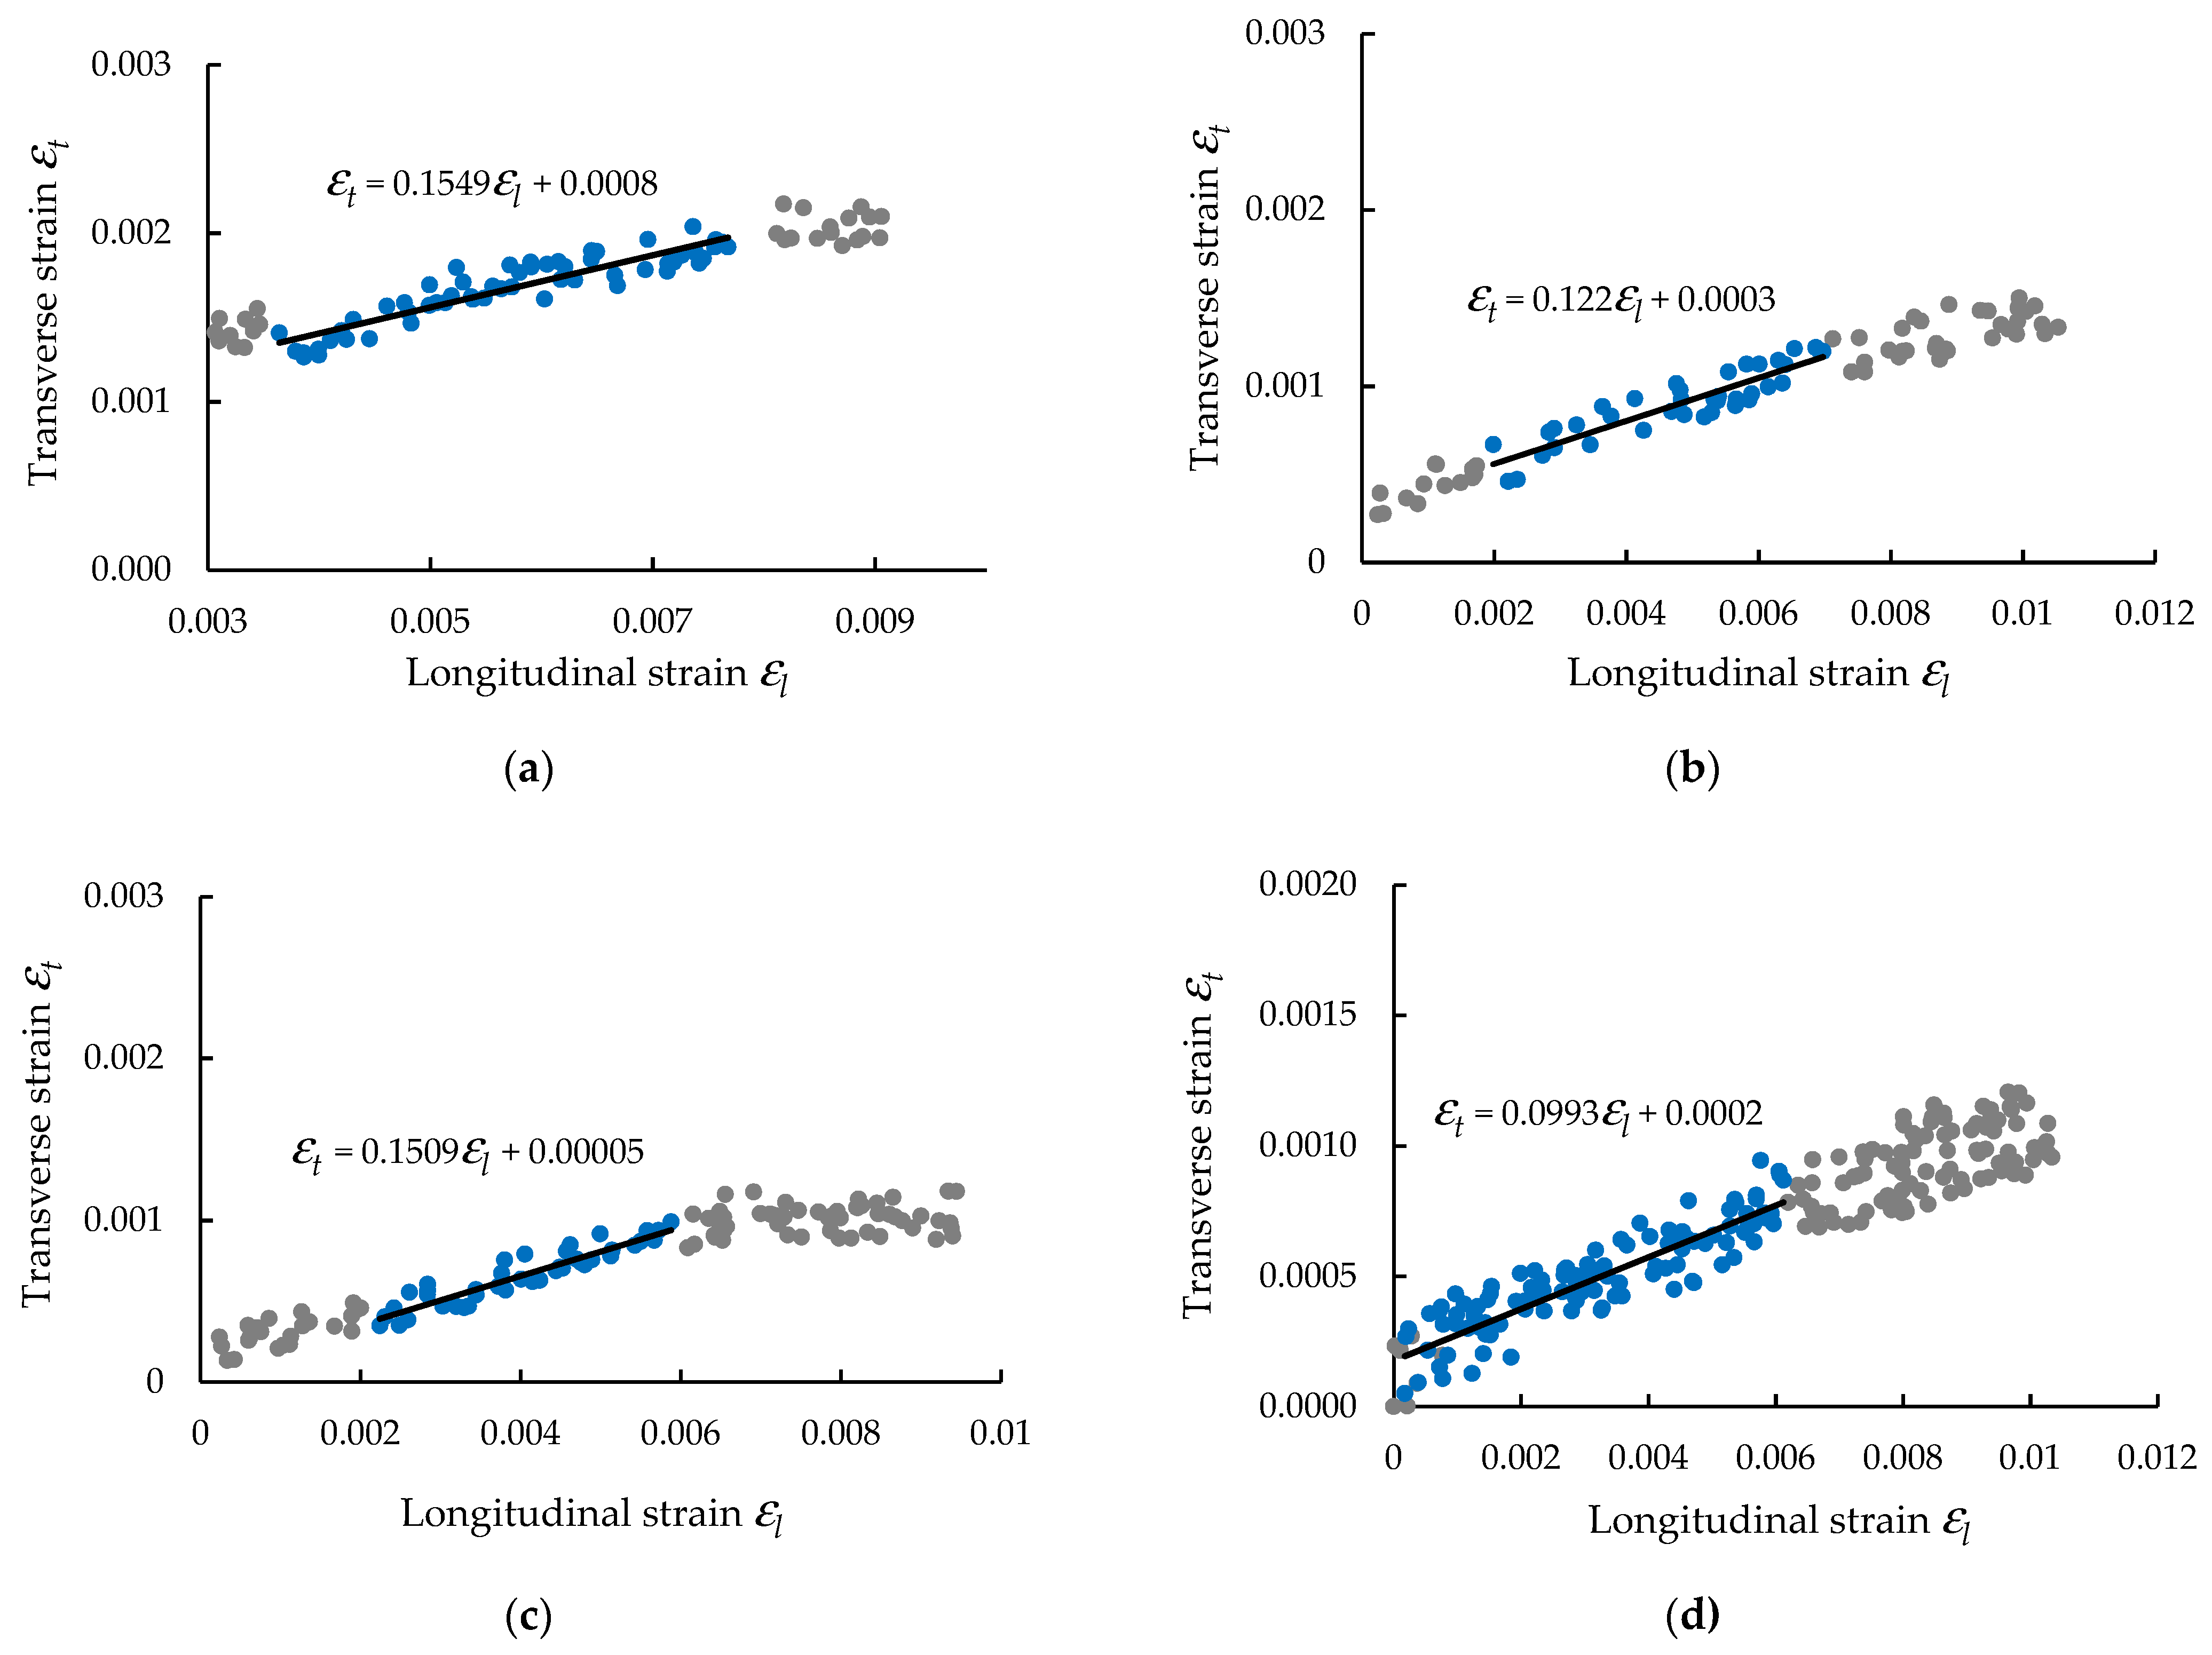
2.2.1. Experimental Program in Tensile Test Combined with DIC Method
2.2.2. Bending Test
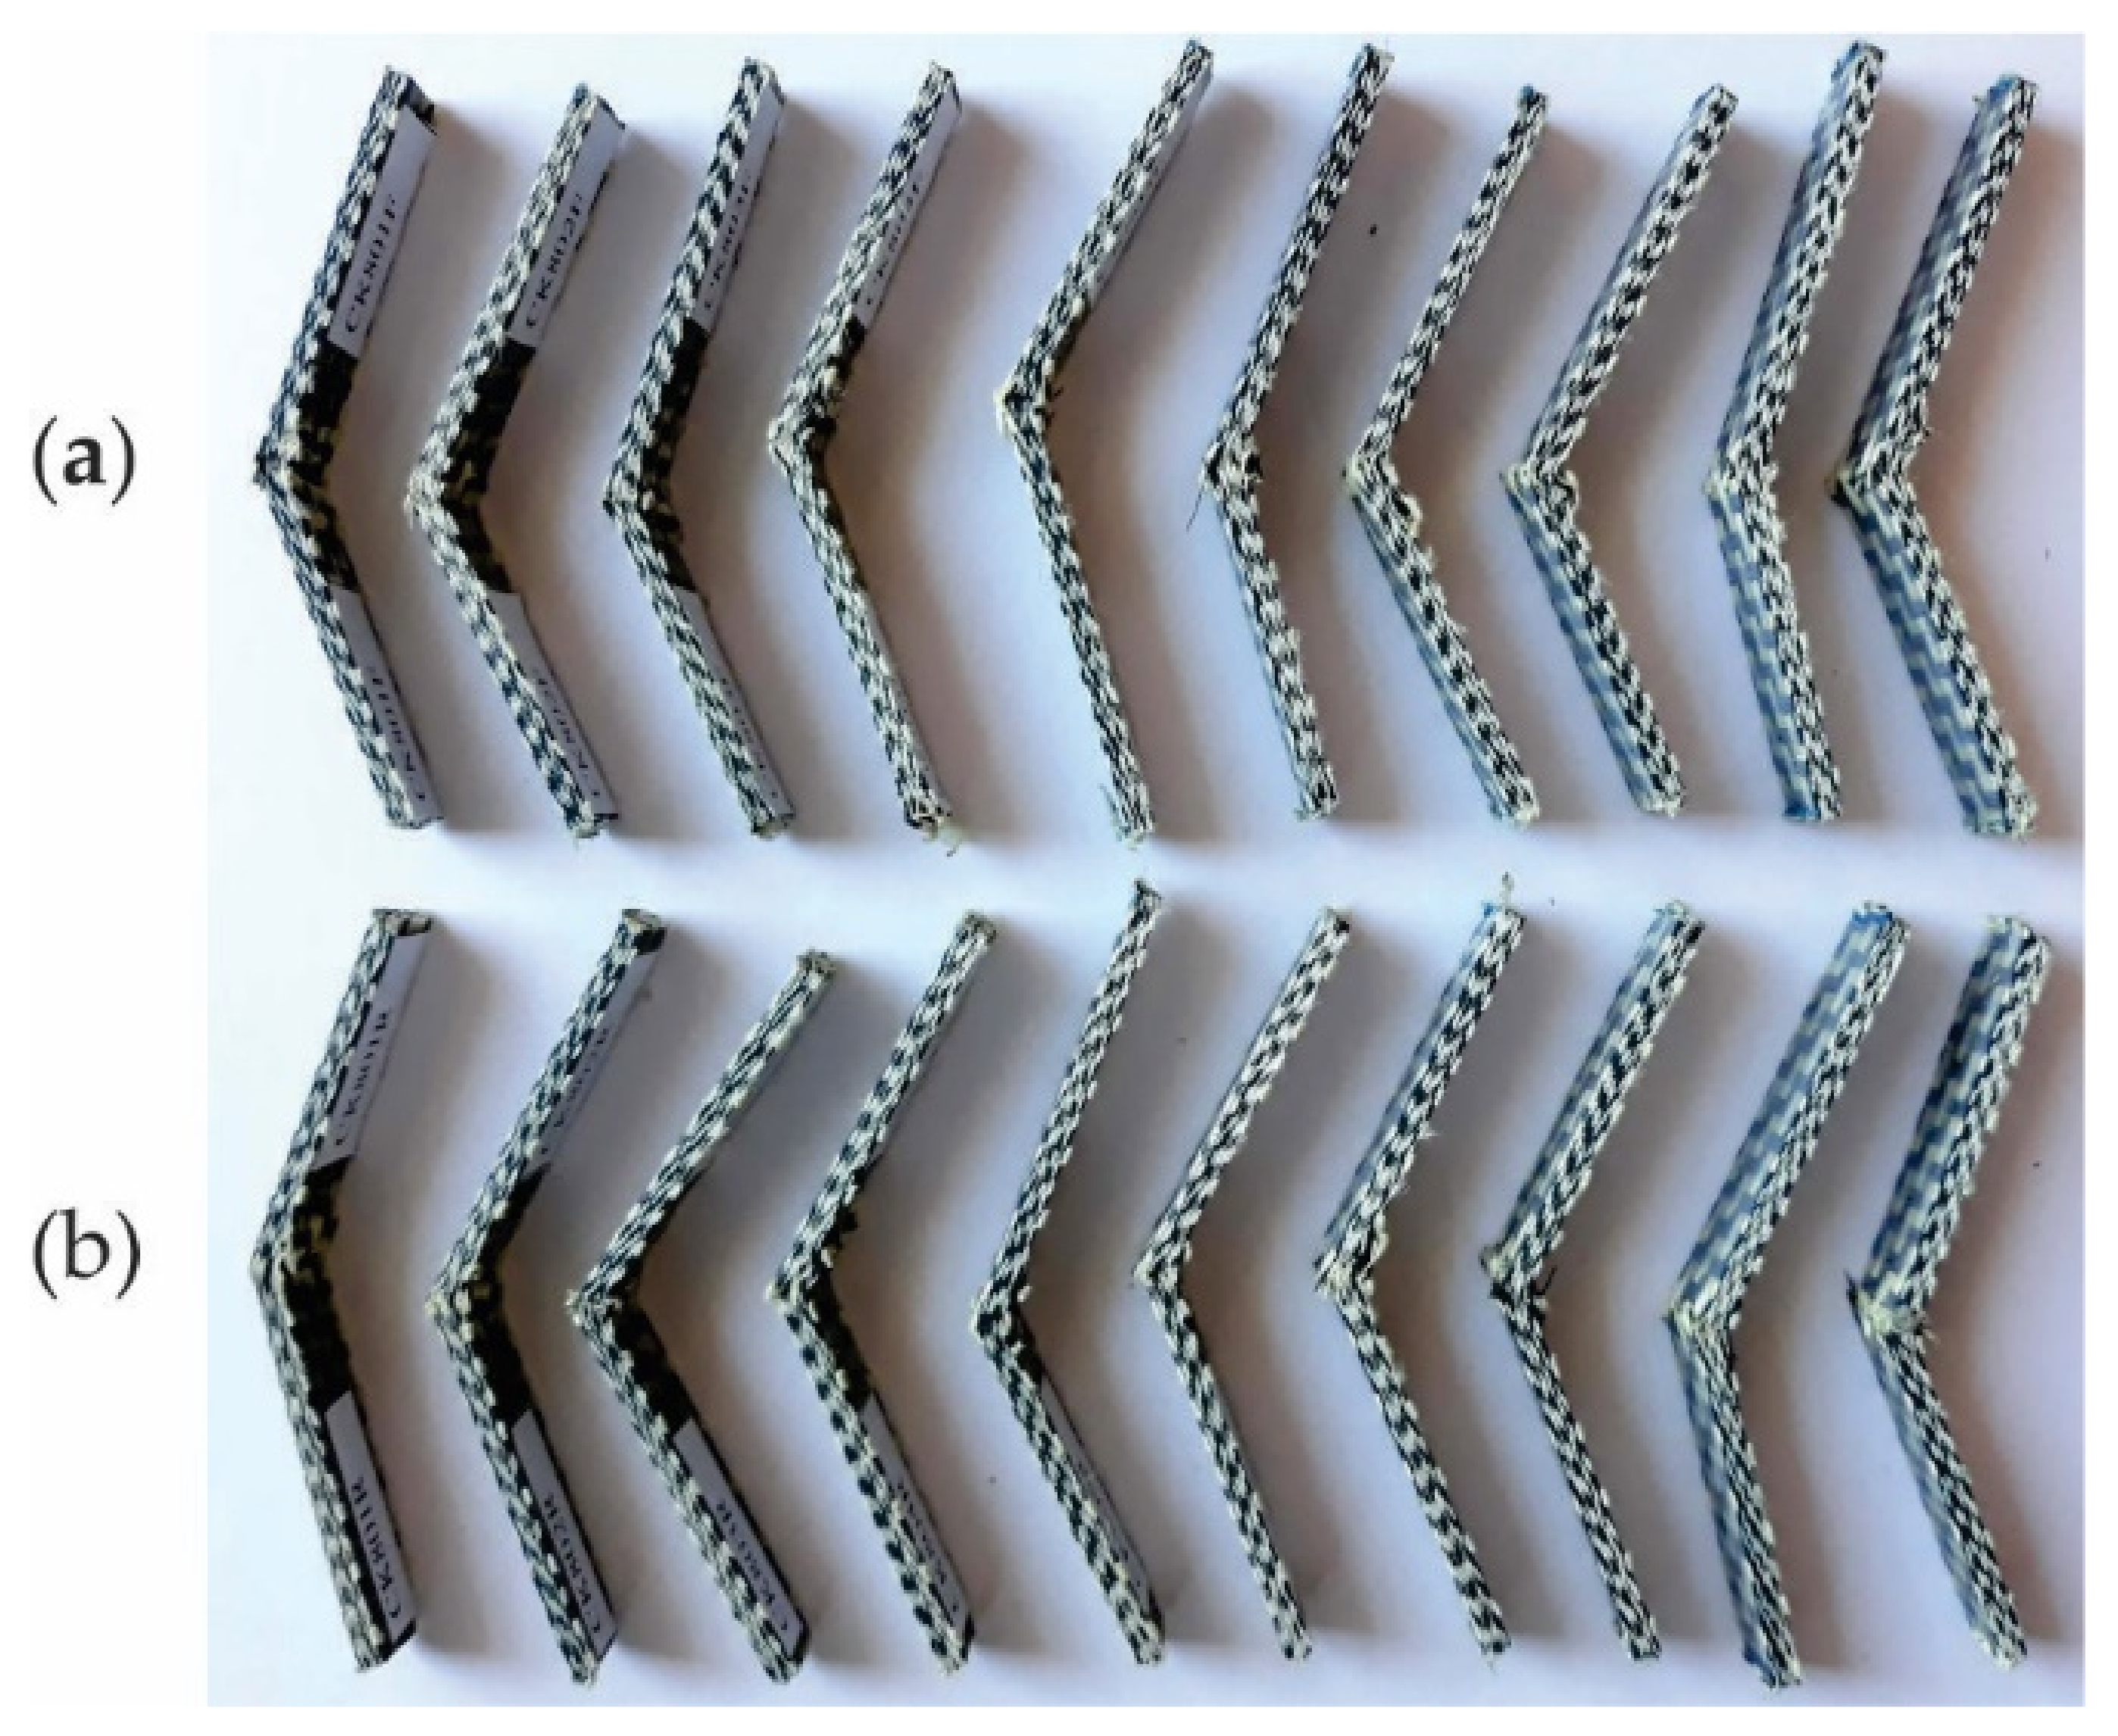
2.2.3. Impact Test
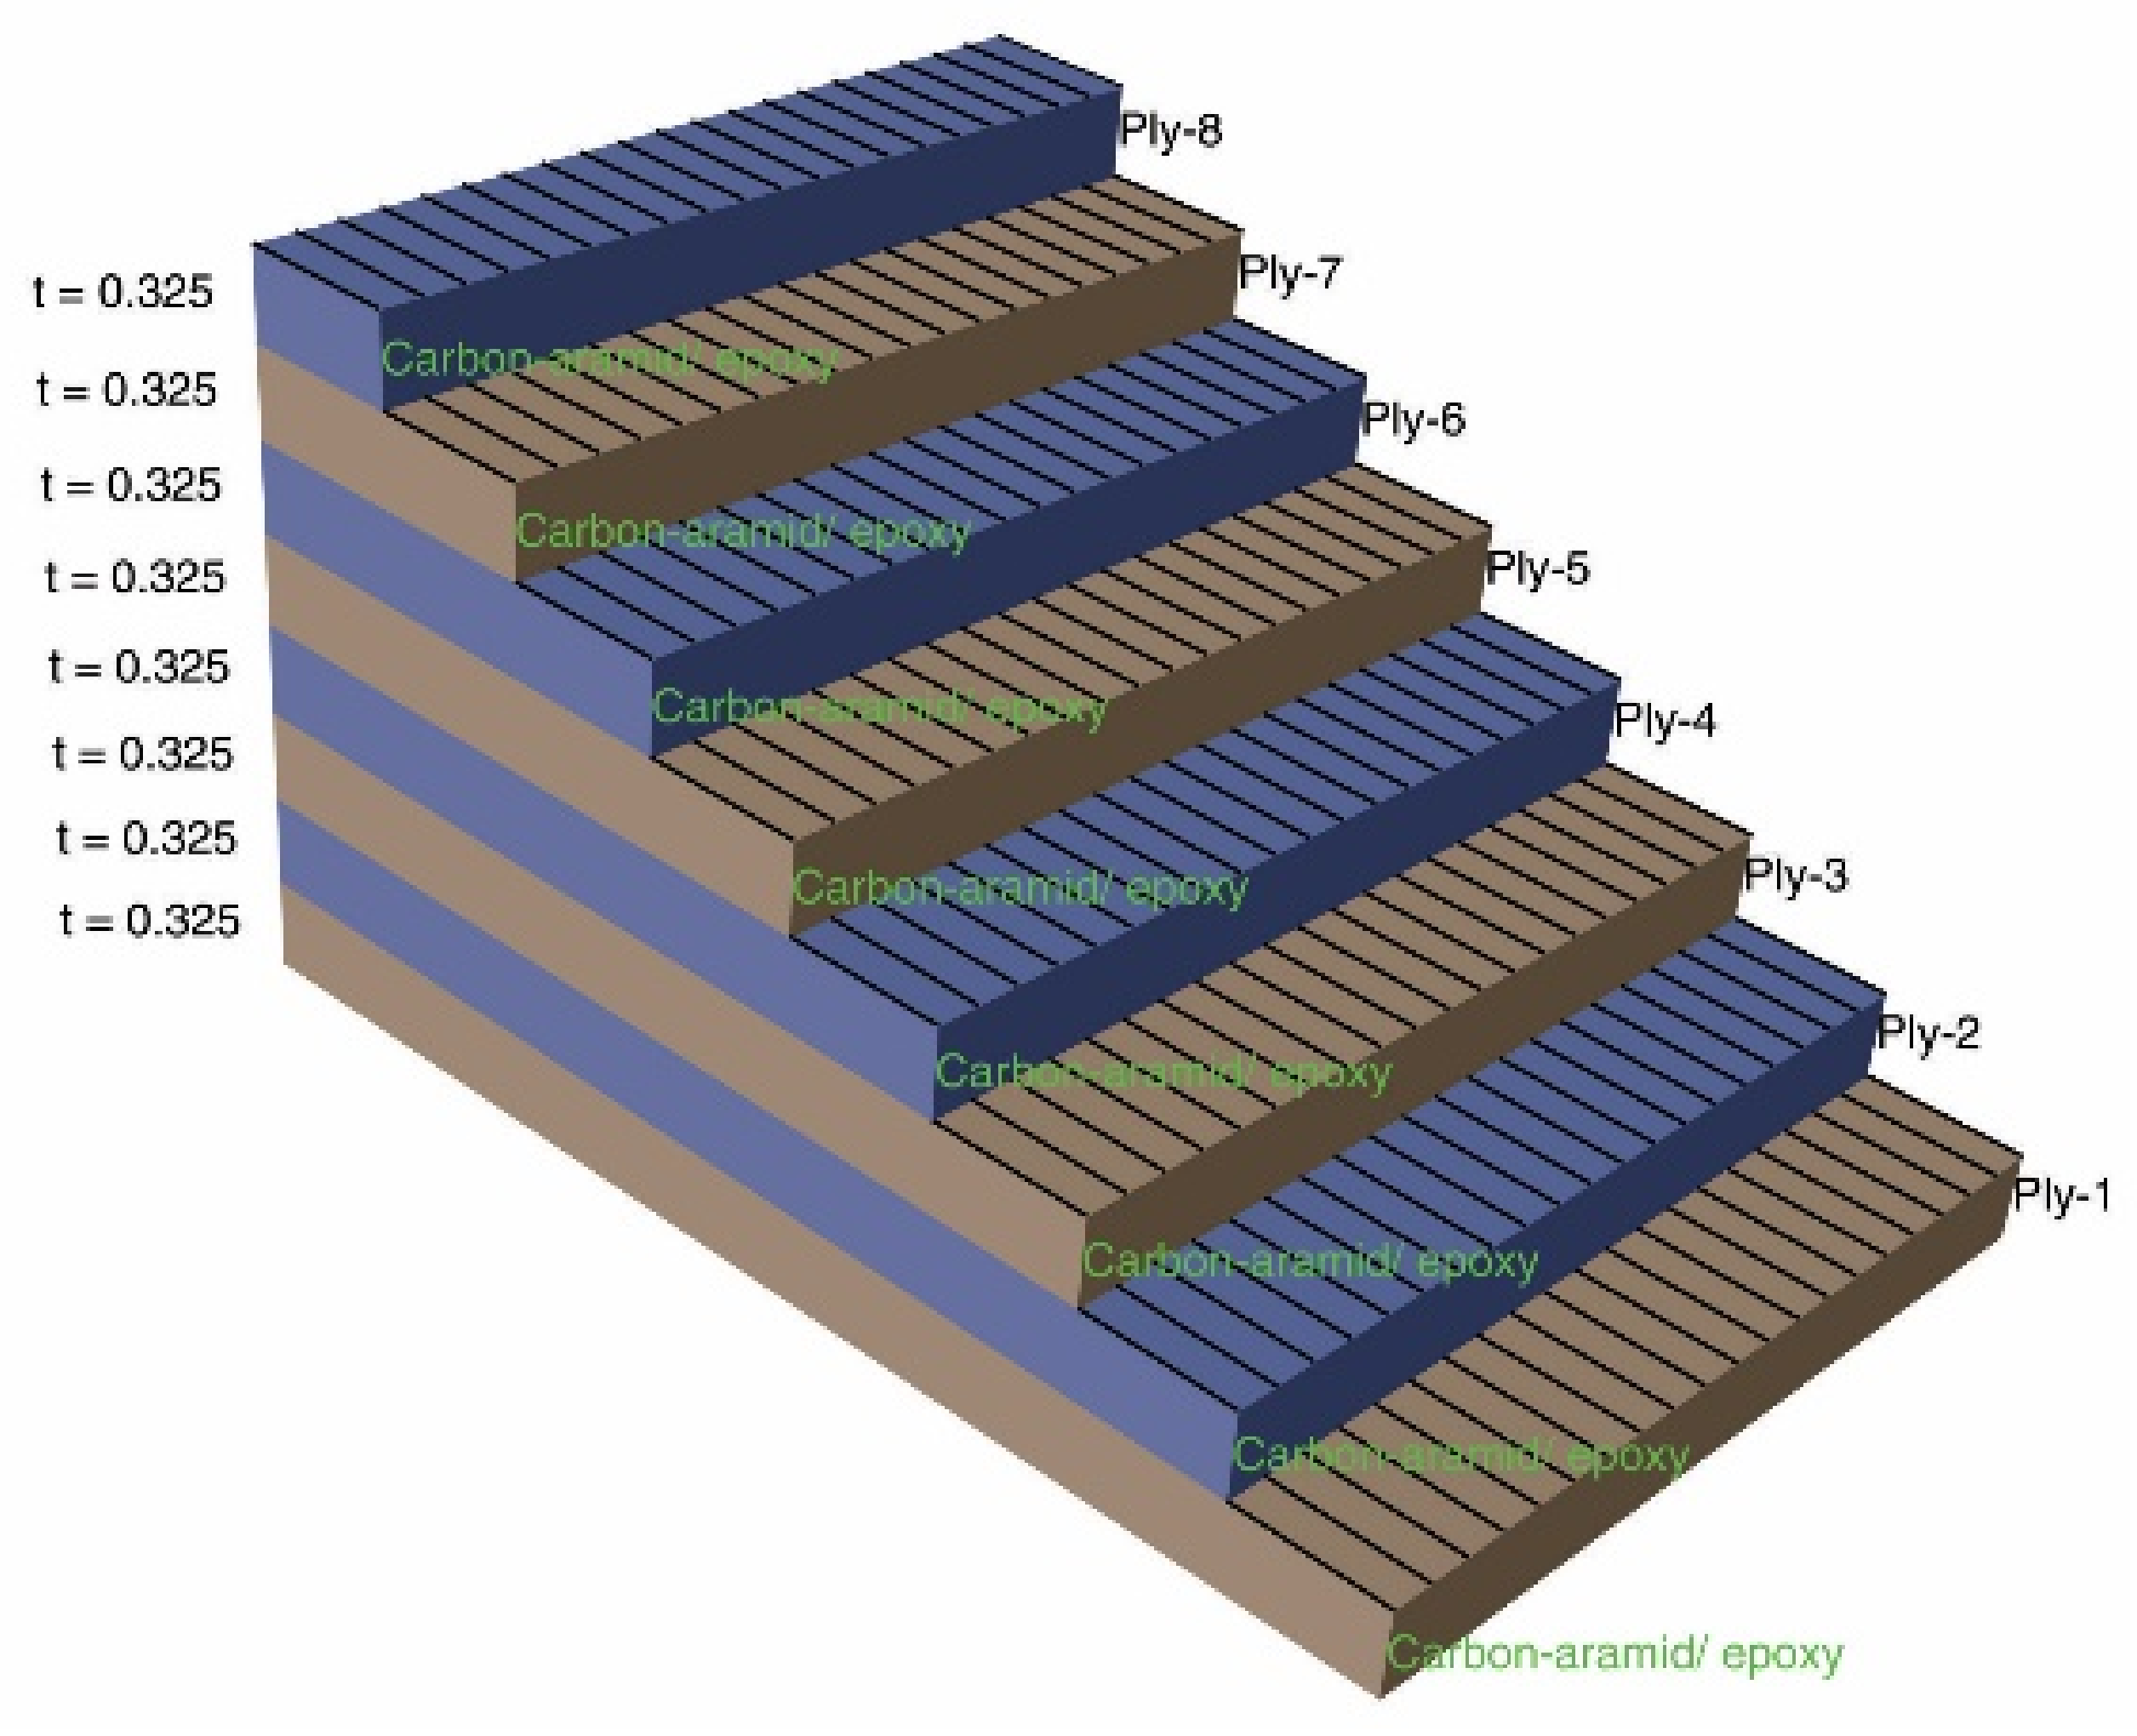
2.3. Aspects Concerning the Analytical Models for Laminated Composite
2.3.1. Analytical Model of the Laminated Composite Loaded in Plane
2.3.2. Analytical Model of the Laminated Composite Subjected to Bending
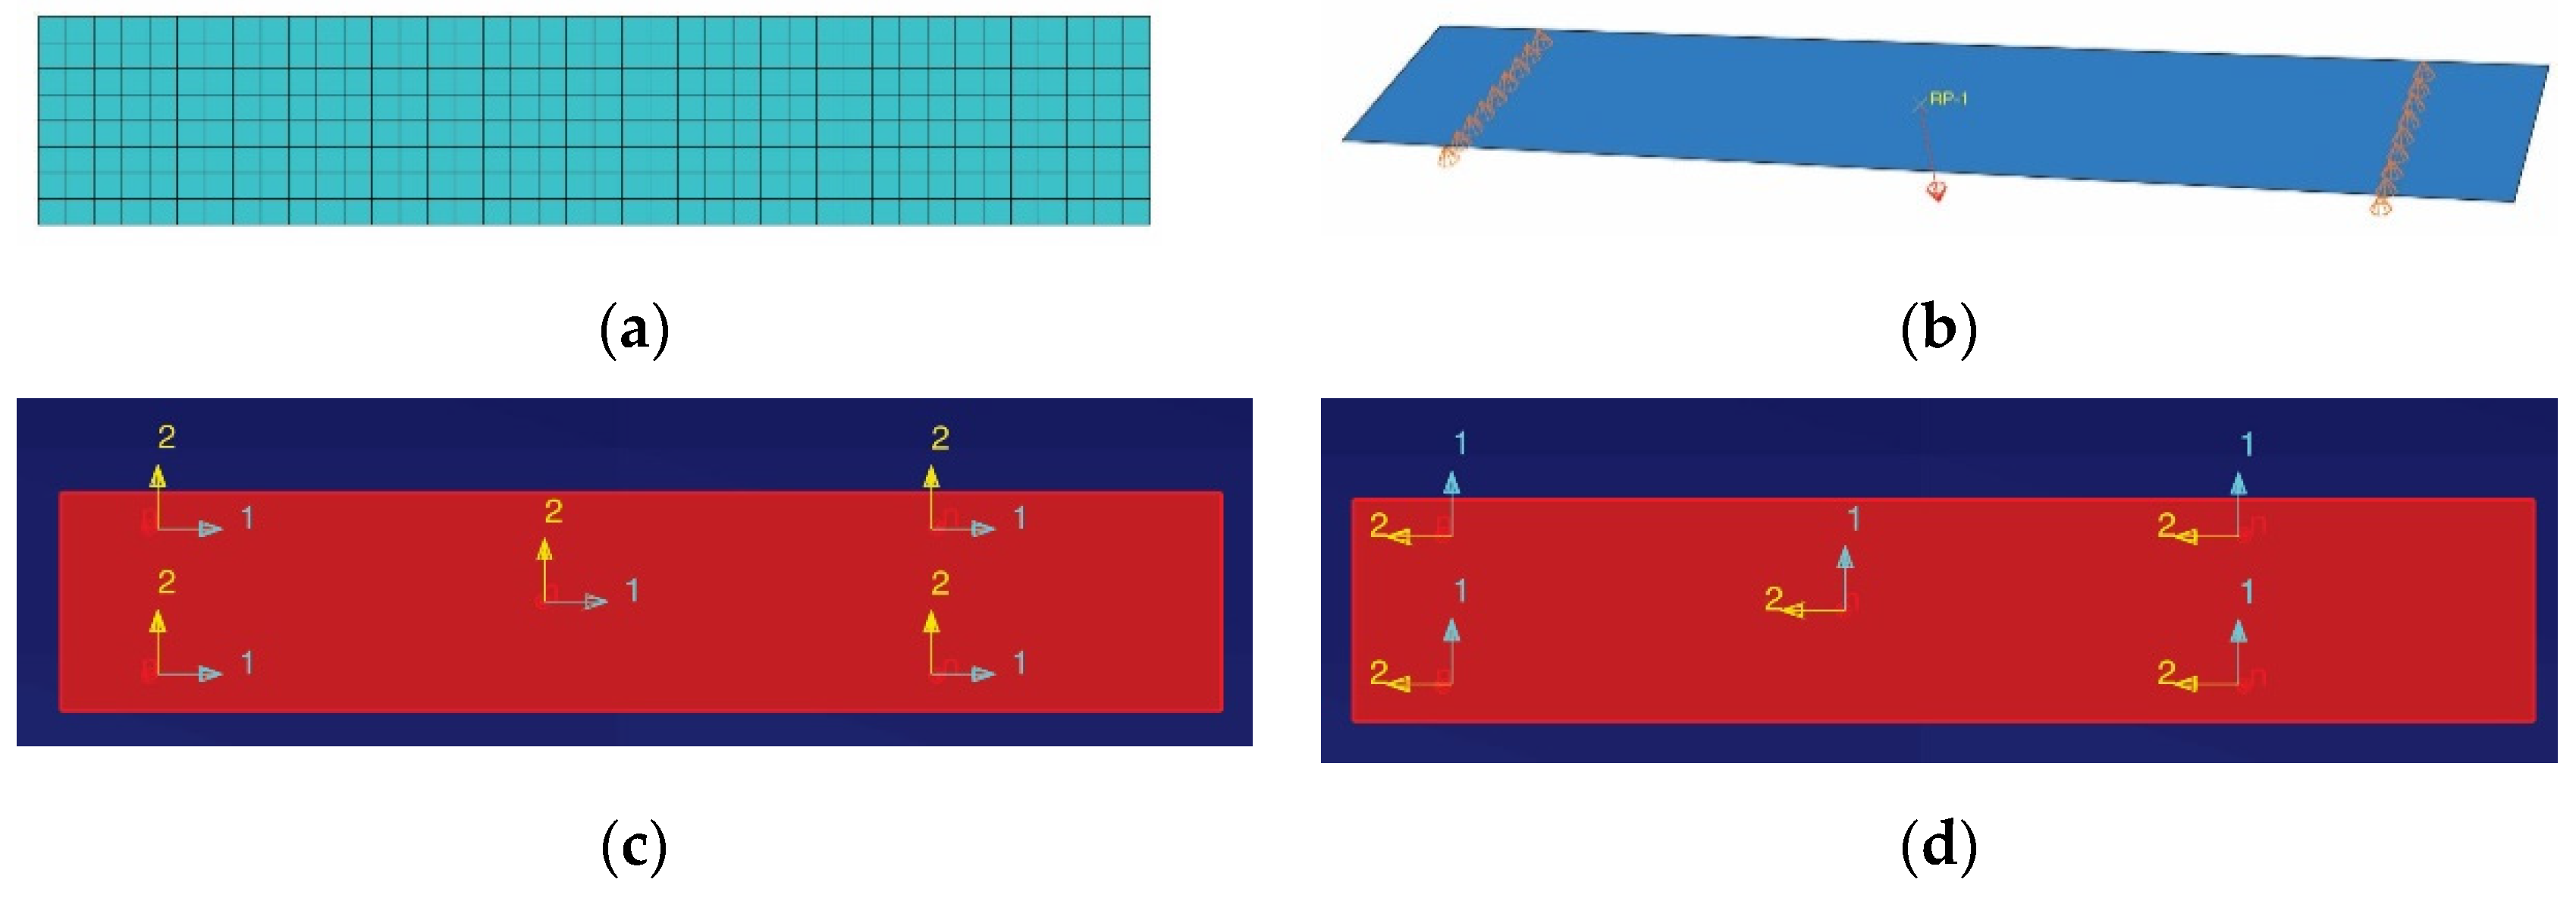
2.4. Simulation Method for Mechanical Tests
2.4.1. Simulation of the Tensile Test
2.4.2. Simulation of the Bending Test
3. Results
3.1. Experimental Results
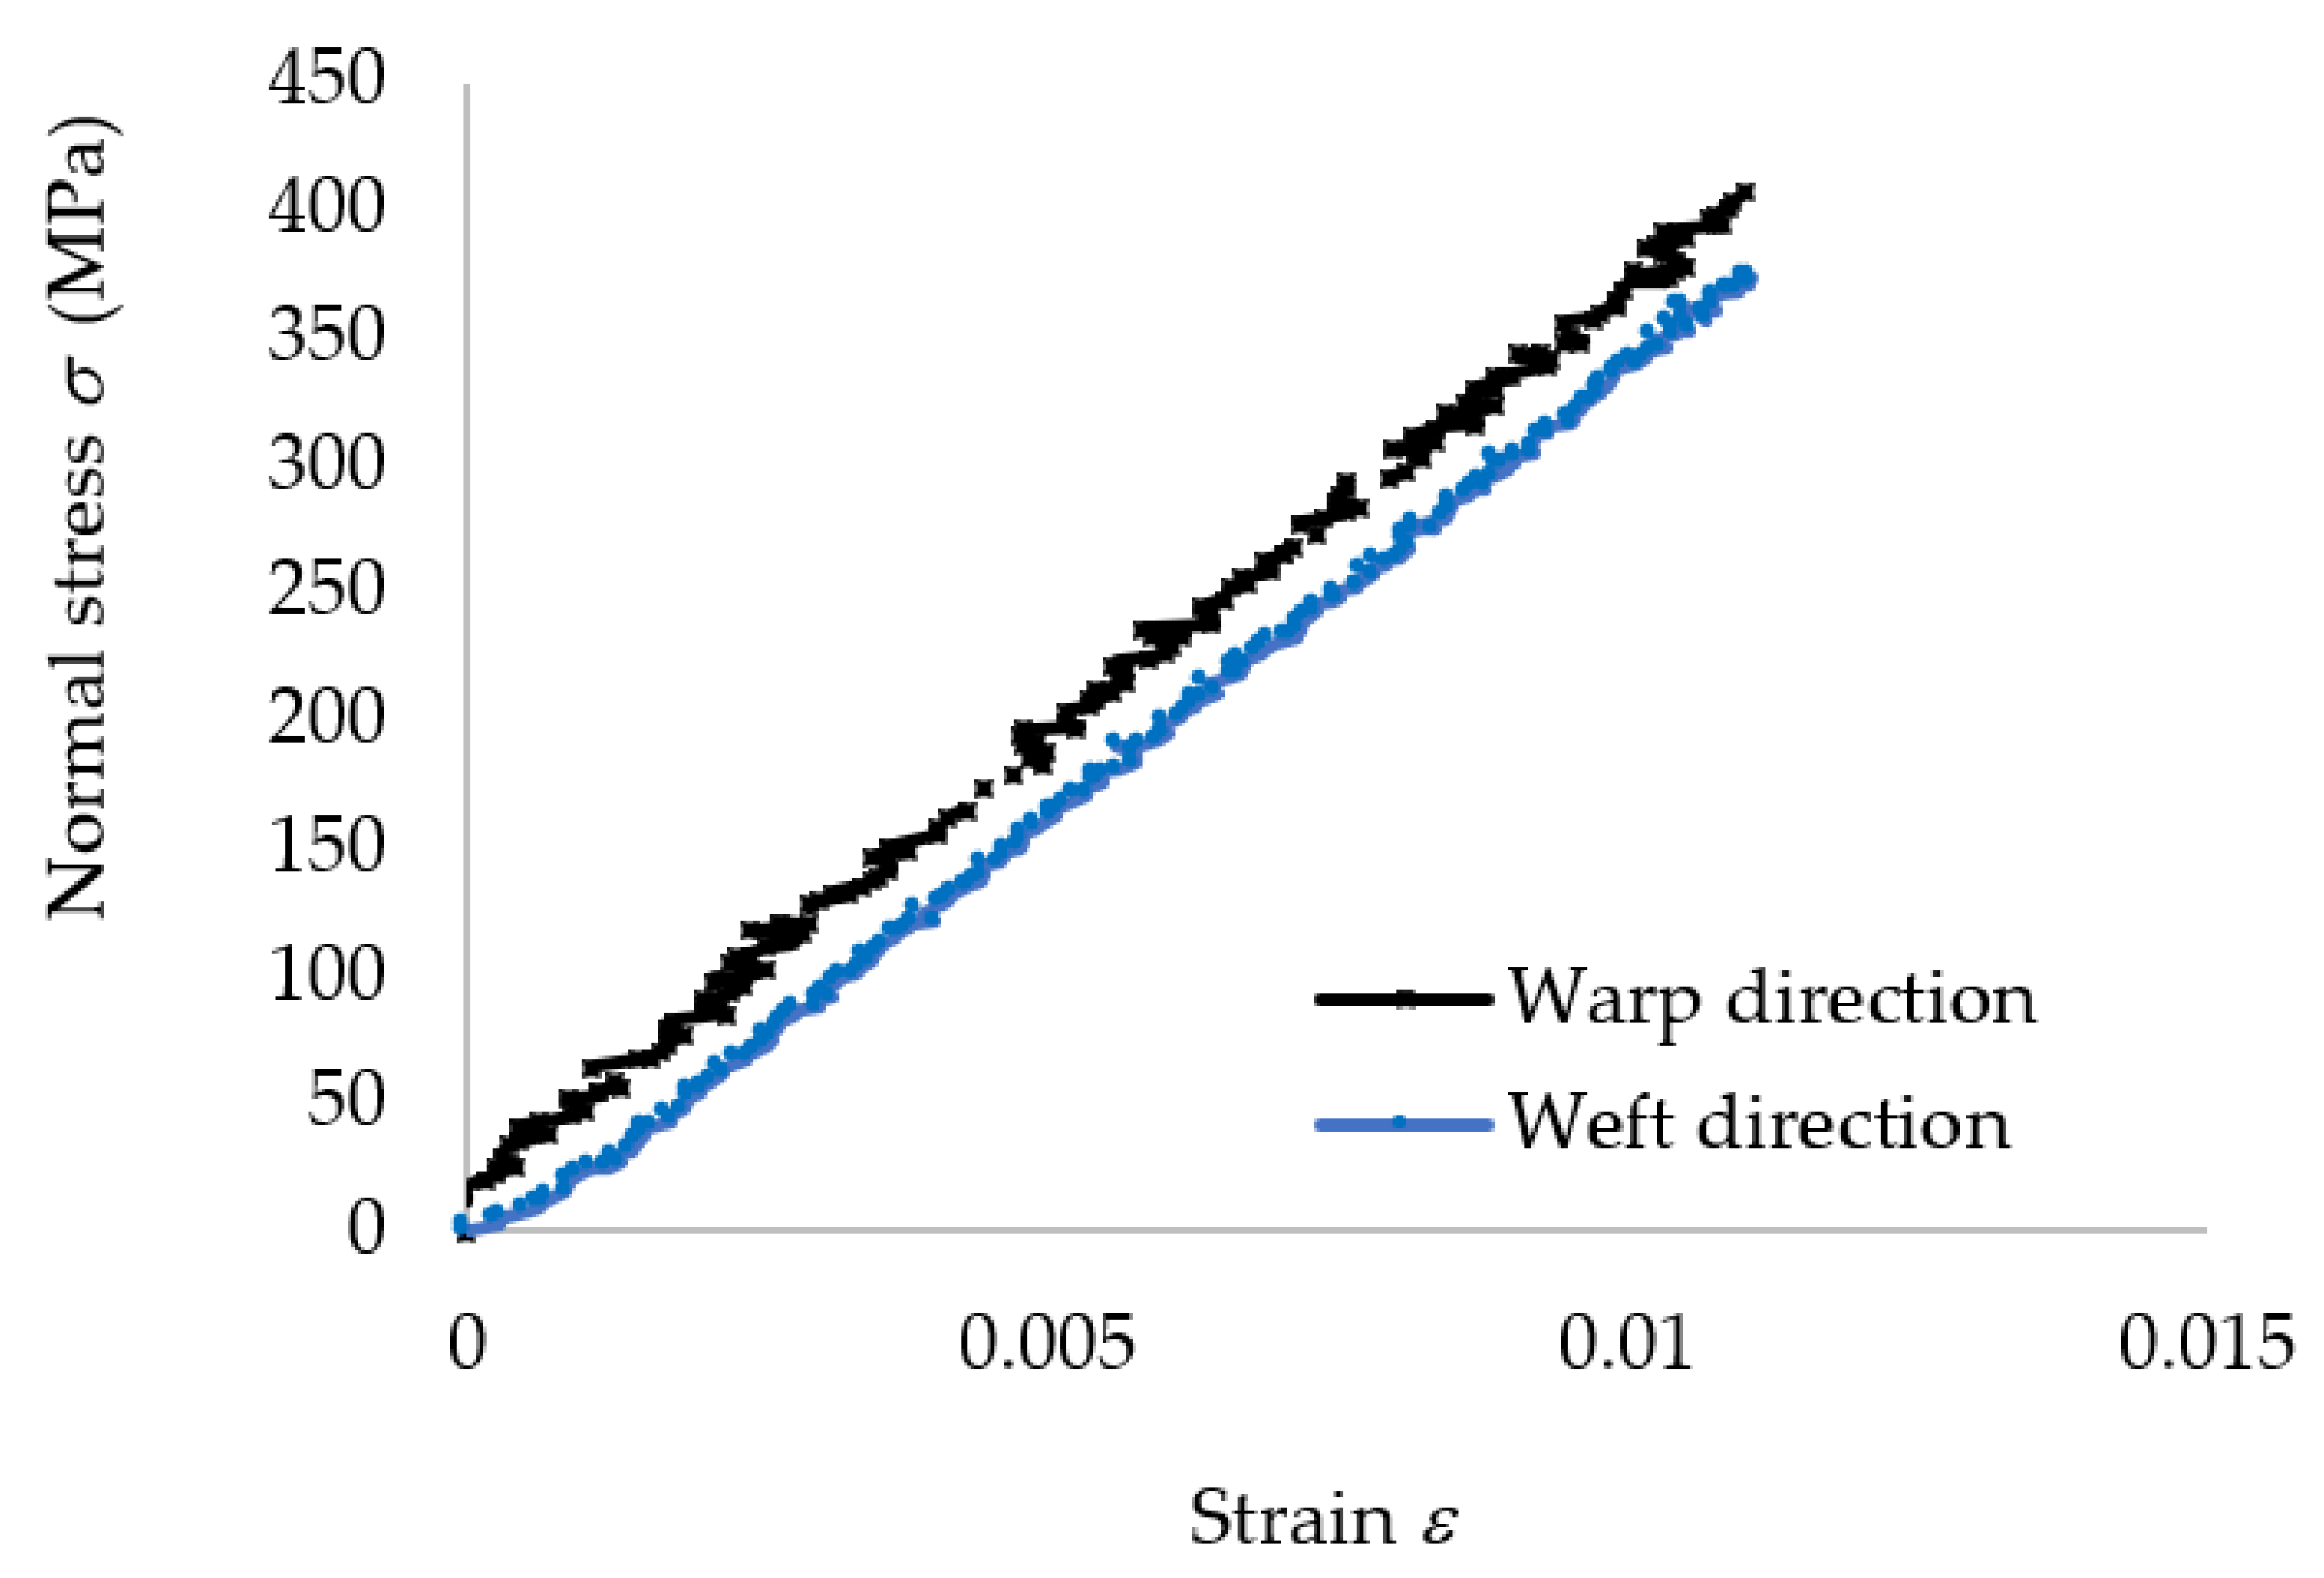
3.1.1. Tensile Properties
3.1.2. Bending Properties
3.1.3. Impact Properties
3.2. Results Obtained by Analytical Method
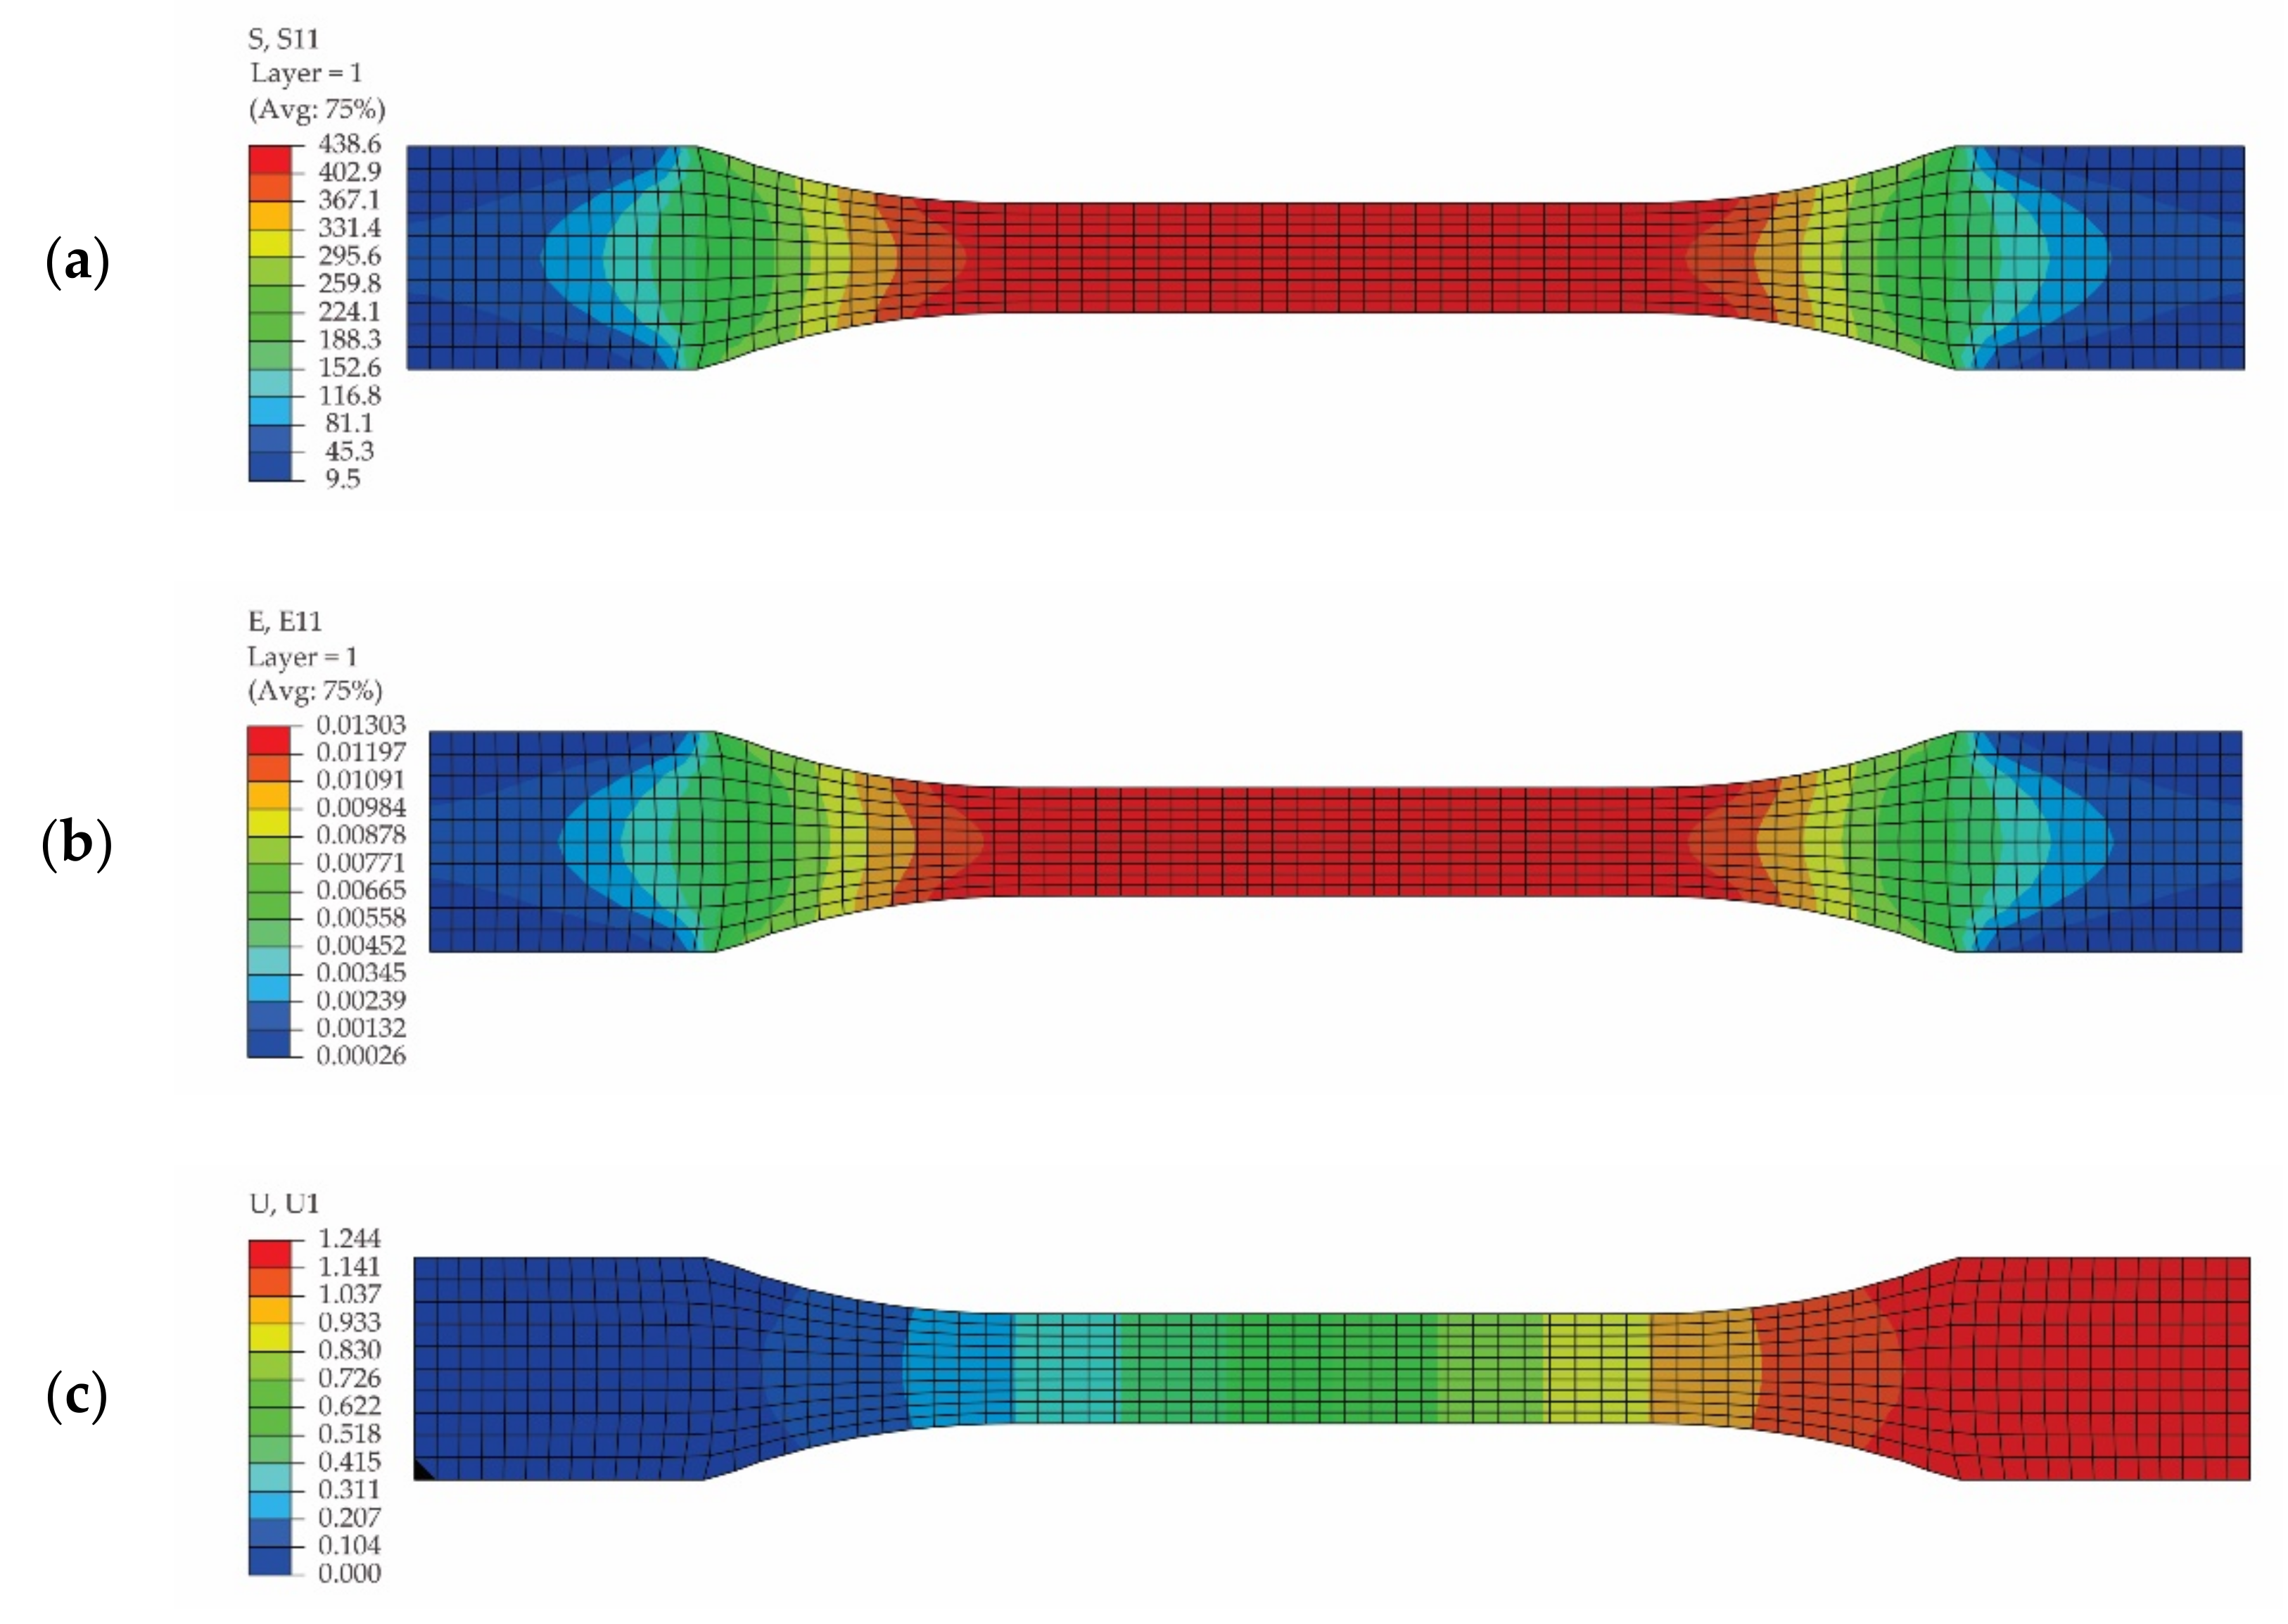
3.3. Results Obtained by Means of FEA
3.4. Experimental versus Theoretical Results
4. Conclusions
Author Contributions
Funding
Institutional Review Board Statement
Informed Consent Statement
Data Availability Statement
Acknowledgments
Conflicts of Interest
References
- Zagho, M.M.; Hussein, E.A.; Elzatahry, A.A. Recent Overviews in Functional Polymer Composites for Biomedical Applications. Polymers 2018, 10, 739. [Google Scholar] [CrossRef] [PubMed] [Green Version]
- Monteiro, S.N.; de Assis, F.S.; Ferreira, C.L.; Simonassi, N.T.; Weber, R.P.; Oliveira, M.S.; Colorado, H.A.; Pereira, A.C. Fique Fabric: A Promising Reinforcement for Polymer Composites. Polymers 2018, 10, 246. [Google Scholar] [CrossRef] [Green Version]
- Matabola, K.P.; De Vries, A.R.; Moolman, F.S.; Luyt, A.S. Single polymer composites: A review. J. Mater. Sci. 2009, 44, 6213–6222. [Google Scholar] [CrossRef]
- Stanciu, M.D.; Savin, A.; Nastac, S.M. Mechanical and Surface Properties of Lignocellulosic Fibres Reinforced Composites. Stroj. Vestn. 2018, 64, 698–705. [Google Scholar] [CrossRef]
- Simil, T.S.; Midhun, A.J.; James, V.J.; Lakshmidasan, S.K.; Usha, K.M.; Rakesh, S. Study on Mechanical Properties of Carbon-Carbon Composites Developed for Aerospace Applications. In Proceedings of the National Conference on Carbon Materials (CCM)–Carbon Materials for Energy Harvesting, Environment, Nanoscience and Technology (Carbon Materials), Mumbai, India, 1–3 November 2012; pp. 163–167. [Google Scholar]
- Ahmad, H.; Markina, A.A.; Porotnikov, M.V.; Ahmad, F.; Publishing, I.O.P. A review of carbon fiber materials in automotive industry. In Proceedings of the International Conference on Modern Trends in Manufacturing Technologies and Equipment (ICMTMTE), Sevastopol, Russia, 7–11 September 2020. [Google Scholar]
- Jawaid, M.; Thariq, M.; Saba, N. Mechanical and Physical Testing of Biocomposites, Fibre-Reinforced Composites and Hybrid Composites; Woodhead Publishing: Duxford, UK, 2019; pp. 1–457. [Google Scholar] [CrossRef]
- Singh, T.J.; Samanta, S. Characterization of Kevlar Fiber and Its Composites: A Review. Mater. Today Proc. 2015, 2, 1381–1387. [Google Scholar] [CrossRef]
- Abdellaoui, H.; Raji, M.; Essabir, H.; Bouhfid, R.; Qaiss, A.E. Mechanical behavior of carbon/natural fiber-based hybrid composites. In Mechanical and Physical Testing of Biocomposites, Fibre-Reinforced Composites and Hybrid Composites; Jawaid, M., Thariq, M., Saba, N., Eds.; Series in Composites Science and Engineering; Woodhead Publ. Ltd.: Cambridge, UK, 2019; pp. 103–122. [Google Scholar]
- Yashiro, S.; Ogi, K. Fracture behavior in CFRP cross-ply laminates with initially cut fibers. Compos. Part A Appl. Sci. Manuf. 2009, 40, 938–947. [Google Scholar] [CrossRef]
- Shokrieh, M.M.; Daneshvar, A.; Akbari, S.; Chitsazzadeh, M. The use of carbon nanofibers for thermal residual stress reduction in carbon fiber/epoxy laminated composites. Carbon 2013, 59, 255–263. [Google Scholar] [CrossRef]
- Wagih, A.; Sebaey, T.A.; Yudhanto, A.; Lubineau, G. Post-impact flexural behavior of carbon-aramid/epoxy hybrid composites. Compos. Struct. 2020, 239, 9. [Google Scholar] [CrossRef]
- Priyanka, P.; Mali, H.S.; Dixit, A. Dynamic mechanical behaviour of kevlar and carbon-kevlar hybrid fibre reinforced polymer composites. Proc. Inst. Mech. Eng. Part C J. Mech. Eng. Sci. 2020, 235, 4181–4193. [Google Scholar] [CrossRef]
- Ramana, M.V.; Ramprasad, S. Experimental Investigation on Jute/Carbon Fibre reinforced Epoxy based Hybrid Composites. Mater. Today Proc. 2017, 4, 8654–8664. [Google Scholar] [CrossRef]
- Rashid, A.H.A.; Ahmad, R.; Jaafar, M.; Roslan, M.N.; Ariffin, S. Mechanical Properties Evaluation of Woven Coir and Kevlar Reinforced Epoxy Composites. Adv. Mater. Res. 2011, 277, 36–42. [Google Scholar] [CrossRef]
- Chatzi, E.G.; Koenig, J.L. Morphology and structure of kevlar fibers—A review. Polym. Plast. Technol. Eng. 1987, 26, 229–270. [Google Scholar] [CrossRef]
- Grimberg, R.; Savin, A.; Steigmann, R.; Bruma, A. Eddy current examination of carbon fibres in carbon-epoxy composites and Kevlar. Int. J. Mater. Prod. Technol. 2006, 27, 221–228. [Google Scholar] [CrossRef] [Green Version]
- Nunna, S.; Chandra, P.R.; Shrivastava, S.; Jalan, A.K. A review on mechanical behavior of natural fiber based hybrid composites. J. Reinf. Plast. Compos. 2012, 31, 759–769. [Google Scholar] [CrossRef]
- Stanciu, M.D.; Draghicescu, H.T.; Rosca, I.C. Mechanical Properties of GFRPs Exposed to Tensile, Compression and Tensile-Tensile Cyclic Tests. Polymers 2021, 13, 898. [Google Scholar] [CrossRef] [PubMed]
- Xian, G.J.; Guo, R.; Li, C.G.; Hong, B. Effects of rod size and fiber hybrid mode on the interface shear strength of carbon/glass fiber composite rods exposed to freezing-thawing and outdoor environments. J. Mater. Res. Technol. JMRT 2021, 14, 2812–2831. [Google Scholar] [CrossRef]
- Guo, R.; Xian, G.J.; Li, C.G.; Huang, X.Y.; Xin, M.Y. Effect of fiber hybridization types on the mechanical properties of carbon/glass fiber reinforced polymer composite rod. Mech. Adv. Mater. Struct. 2021. [Google Scholar] [CrossRef]
- Li, C.G.; Yin, X.L.; Liu, Y.C.; Guo, R.; Xian, G.J. Long-term service evaluation of a pultruded carbon/glass hybrid rod exposed to elevated temperature, hydraulic pressure and fatigue load coupling. Int. J. Fatigue 2020, 134, 15. [Google Scholar] [CrossRef]
- Pincheira, G.; Canales, C.; Medina, C.; Fernandez, E.; Flores, P. Influence of aramid fibers on the mechanical behavior of a hybrid carbon-aramid-reinforced epoxy composite. Proc. Inst. Mech. Eng. Part L J. Mater. Des. Appl. 2018, 232, 58–66. [Google Scholar] [CrossRef]
- Orell, O.; Vuorinen, J.; Jokinen, J.; Kettunen, H.; Hytonen, P.; Turunen, J.; Kanerva, M. Characterization of elastic constants of anisotropic composites in compression using digital image correlation. Compos. Struct. 2018, 185, 176–185. [Google Scholar] [CrossRef]
- Cerbu, C.; Curtu, I.; Consntinescu, D.M.; Miron, M.C. Aspects Concerning the Transversal Contraction in the Case of Some Composite Materials Reinforced with Glass Fabric. Mater. Plast. 2011, 48, 341–345. [Google Scholar]
- Xu, D.H.; Cerbu, C.; Wang, H.W.; Rosca, I.C. Analysis of the hybrid composite materials reinforced with natural fibers considering digital image correlation (DIC) measurements. Mech. Mater. 2019, 135, 46–56. [Google Scholar] [CrossRef]
- Fathi, A.; Keller, J.H.; Altstaedt, V. Full-field shear analyses of sandwich core materials using Digital Image Correlation (DIC). Compos. Part B Eng. 2015, 70, 156–166. [Google Scholar] [CrossRef]
- Potluri, P.; Young, R.J.; Rashed, K.; Manan, A.; Shyng, Y.T. Meso-scale strain mapping in UD woven composites. Compos. Part A Appl. Sci. Manuf. 2009, 40, 1838–1845. [Google Scholar] [CrossRef]
- Ivanov, D.; Ivanov, S.; Lomov, S.; Verpoest, I. Strain mapping analysis of textile composites. Opt. Lasers Eng. 2009, 47, 360–370. [Google Scholar] [CrossRef]
- Pan, B.; Lu, Z.X.; Xie, H.M. Mean intensity gradient: An effective global parameter for quality assessment of the speckle patterns used in digital image correlation. Opt. Lasers Eng. 2010, 48, 469–477. [Google Scholar] [CrossRef]
- Liu, X.Y.; Li, R.L.; Zhao, H.W.; Cheng, T.H.; Cui, G.J.; Tan, Q.C.; Meng, G.W. Quality assessment of speckle patterns for digital image correlation by Shannon entropy. Optik 2015, 126, 4206–4211. [Google Scholar] [CrossRef]
- Wang, H. Marker Identification Technique for Deformation Measurement. Adv. Mech. Eng. 2013, 5, 246318. [Google Scholar] [CrossRef]
- Raunija, T.S.K.; Babu, S. Randomly Oriented Carbon/Carbon Composite. In Proceedings of the National Conference on Carbon Materials (CCM)—Carbon Materials for Energy Harvesting, Environment Nanoscience and Technology (Carbon Materials), Mumbai, India, 1–3 November 2012; pp. 168–171. [Google Scholar]
- Nurazzi, N.M.; Asyraf, M.R.M.; Khalina, A.; Abdullah, N.; Aisyah, H.A.; Rafiqah, S.A.; Sabaruddin, F.A.; Kamarudin, S.H.; Norrrahim, M.N.F.; Ilyas, R.A.; et al. A Review on Natural Fiber Reinforced Polymer Composite for Bullet Proof and Ballistic Applications. Polymers 2021, 13, 646. [Google Scholar] [CrossRef]
- Sun, L.; Deng, Z. The Carbon Fiber Composite Materials Application in Sports Equipment. Adv. Mater. Res. 2012, 341–342, 173–176. [Google Scholar] [CrossRef]
- De Medeiros, R.J.; Shimura da Nobrega, S.H.; Freire de Aquino, E.M. Failure Theories on Carbon/Kevlar Hybrid Fabric Based Composite Laminate: Notch and Anisotropy Effects. Mater. Res. 2019, 22, 1–11. [Google Scholar] [CrossRef]
- Cerbu, C. Practical solution for improving the mechanical behaviour of the composite materials reinforced with flax woven fabric. Adv. Mech. Eng. 2015, 7, 1687814015582084. [Google Scholar] [CrossRef]
- Technical Datasheet of SIGRATEX Woven Fabrics. Available online: https://www.sglcarbon.com/en/markets-solutions/material/sigratex-textile-materials/ (accessed on 15 September 2021).
- Pooja, B.; Alka, G. Carbon Fibres: Production, Properties and Potential Use. Mater. Sci. Res. India 2017, 14, 52–57. [Google Scholar] [CrossRef]
- Certificate of Epolam 2031 Epoxy Resin and EPOLAM 2031–2032 Hardeners. Available online: http://www.uni-trading.com/sub/support/tds.msds/resin/suji_Tooing/EPOXY%20LAMENATING%20RESINS/TOOLING/TDS/EPOLAB2031-2031-2032-TDS(EN).pdf (accessed on 15 September 2021).
- International Standards Organization. EN ISO 527-4: 1997: Plastics—Determination of Tensile Properties –Part 4: Test Conditions for Isotropic and Orthotropic Fibre-Reinforced Plastic Composites; International Standards Organization: Geneva, Switzerland, 1997. [Google Scholar]
- International Standards Organization. EN ISO 14125: 1998: Fibre-Reinforced Plastic Composites—Determination of Flexural Properties; International Standards Organization: Geneva, Switzerland, 1998. [Google Scholar]
- International Standards Organization. ISO 179-1: 2000: Plastics—Determination of Charpy Impact Properties: Part 1: Non-Instrumented Impact Test; International Standards Organization: Geneva, Switzerland, 2000. [Google Scholar]
- Barbero, E.J. Introduction to Composite Materials Design; CRC Press: Boca Raton, FL, USA, 1998. [Google Scholar]
- Gilles, M. Aramid Fibre. Available online: https://www.final-materials.com/gb/21-aramid-fibre (accessed on 12 September 2021).


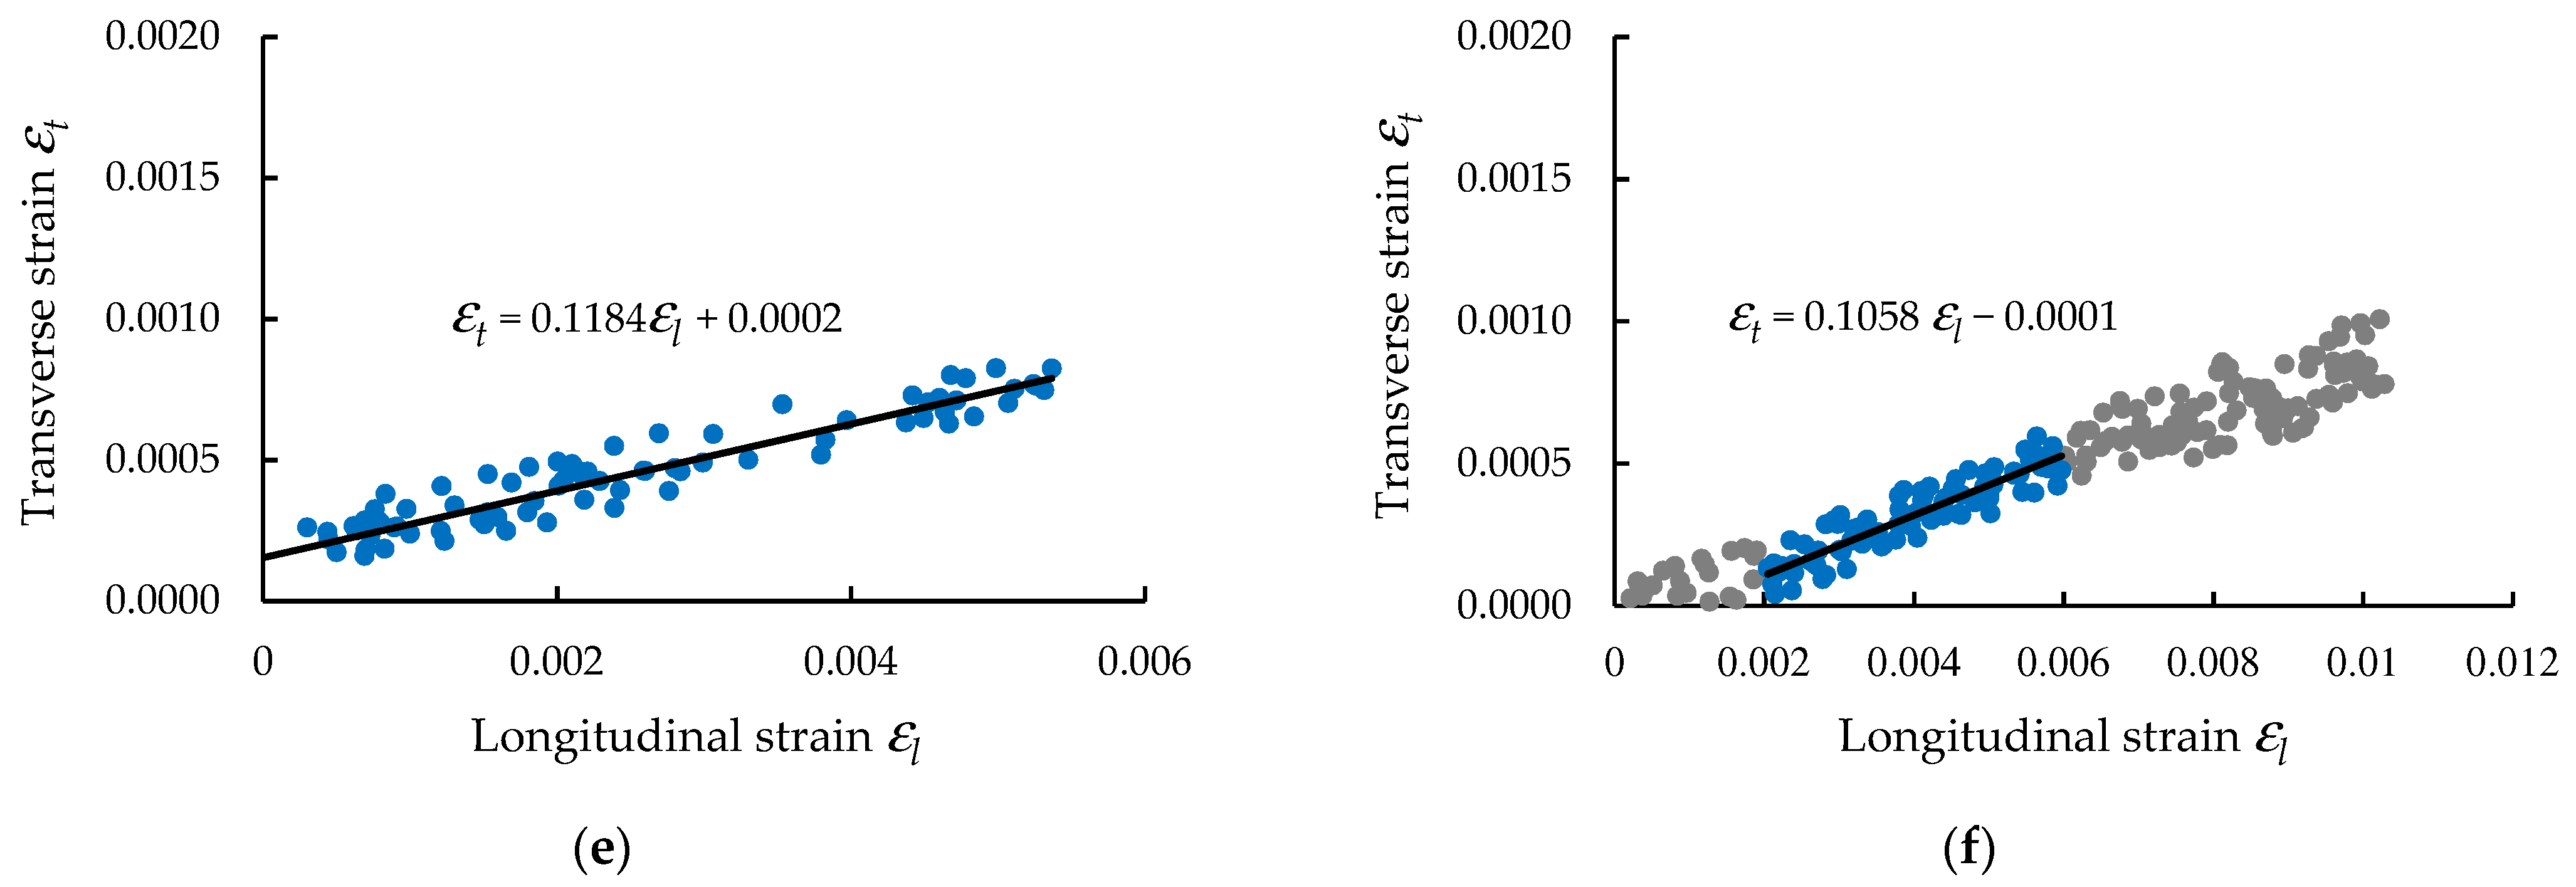
| Specimen Direction | Specimen Code * | Dimensions of Cross-Section | Young’s Modulus E (MPa) | Maximum Force Fmax (N) | Tensile Strength σmax (MPa) | Maximum Strain εmax at Fmax | Poisson’s Ratio ν | |
|---|---|---|---|---|---|---|---|---|
| b (mm) | h (mm) | |||||||
| Warp (R) | CK801R | 10.20 | 2.60 | 35,882 | 10,775 | 406 | 0.0136 | 0.155 |
| CK802R | 10.34 | 2.57 | 36,108 | 11,722 | 441 | 0.0117 | 0.119 | |
| CK803R | 10.33 | 2.66 | 36,574 | 10,434 | 380 | 0.0097 | 0.151 | |
| CK804R | 10.48 | 2.68 | 35,458 | 11,093 | 395 | 0.0108 | 0.122 | |
| CK805R | 10.46 | 2.78 | 32,205 | 12,013 | 413 | 0.0163 | 0.158 | |
| Average (stdev) | 35,245 (1747) | 11,207 (654) | 407 (23) | 0.0124 (0.0026) | 0.141 (0.019) | |||
| Weft (F) | CK801F | 10.60 | 2.74 | 33,721 | 11,127 | 383 | 0.0113 | 0.099 |
| CK802F | 10.5 | 2.65 | 33,627 | 10,379 | 373 | 0.0107 | 0.0106 | |
| CK803F | 10.61 | 2.82 | 35,107 | 11,760 | 393 | 0.0101 | 0.118 | |
| CK804F | 10.52 | 2.74 | 33,928 | 9741 | 338 | 0.0102 | 0.106 | |
| CK805F | 10.6 | 2.78 | 31,747 | 11,016 | 374 | 0.0111 | 0.102 | |
| Average (stdev) | 33,626 (1207) | 10,805 (770) | 372 (21) | 0.0107 (0.0005) | 0.106 (0.007) | |||
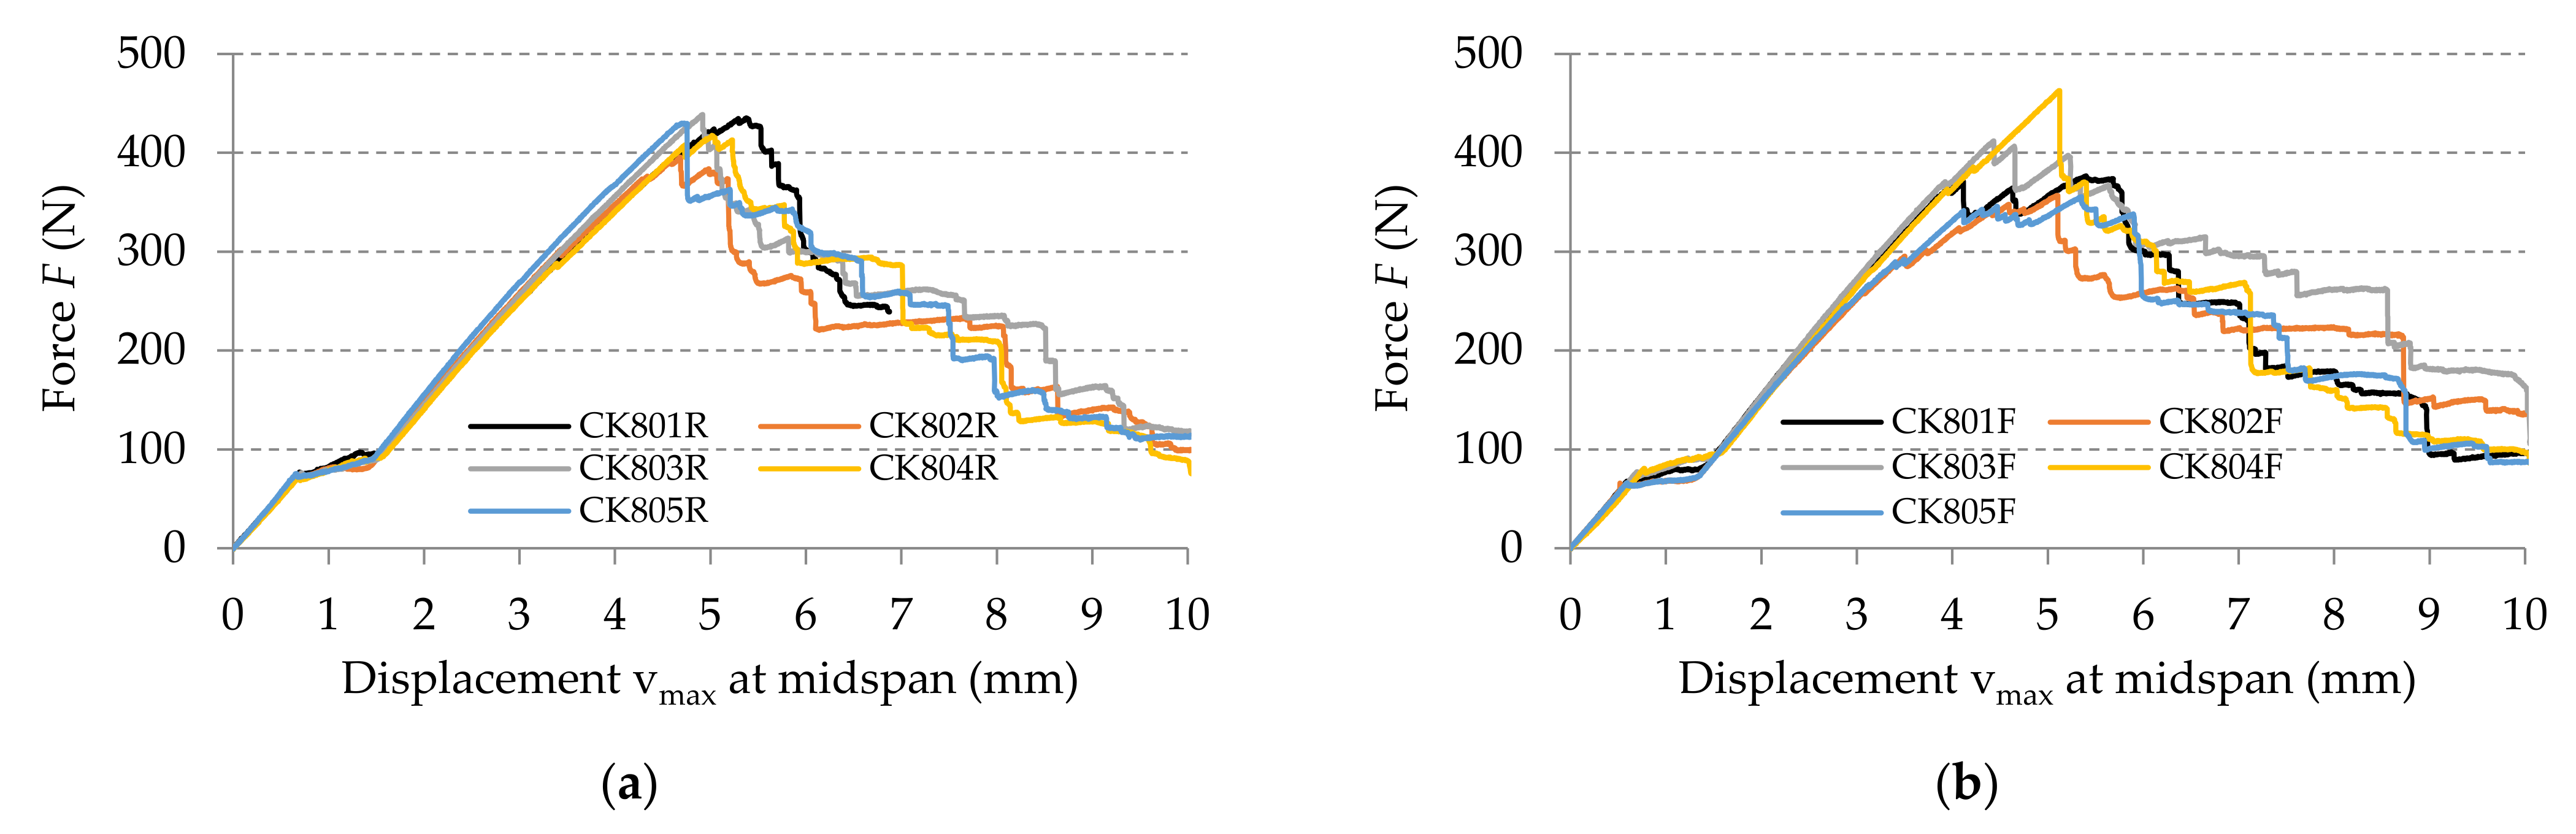
| Specimen Direction | Specimen Code * | Dimensions of Cross-Section | Flexural Modulus of Elasticity E (MPa) | Maximum Force Fmax (N) | Maximum Stress σmax (MPa) | Maximum Displacement vmax at Fmax (mm) | |
|---|---|---|---|---|---|---|---|
| b (mm) | h (mm) | ||||||
| Warp (R) | CK801R | 14.99 | 2.55 | 29,331 | 435 | 429 | 5.376 |
| CK802R | 14.92 | 2.58 | 28,846 | 396 | 382 | 4.686 | |
| CK803R | 14.96 | 2.52 | 29,088 | 439 | 443 | 4.916 | |
| CK804R | 14.96 | 2.52 | 29,409 | 418 | 422 | 5.016 | |
| CK805R | 14.98 | 2.58 | 30,042 | 430 | 414 | 4.701 | |
| Average (stdev) | 29,343 (449) | 424 (17) | 418 (23) | 4.939 (0.282) | |||
| Weft (F) | CK801F | 15.06 | 2.72 | 24,899 | 377 | 325 | 5.400 |
| CK802F | 14.88 | 2.56 | 29,557 | 357 | 351 | 5.106 | |
| CK803F | 14.98 | 2.7 | 24,767 | 412 | 362 | 4.435 | |
| CK804F | 14.93 | 2.61 | 27,456 | 356 | 336 | 5.354 | |
| CK805F | 14.85 | 2.61 | 27,741 | 413 | 392 | 5.222 | |
| Average (stdev) | 26,884 (2039) | 396 (28) | 363 (26) | 5.106 (0.391) | |||
| Direction of the Specimen | Impact Failure Energy W (J) | Impact Strength K (kJ/m2) |
|---|---|---|
| Warp direction (R) | 2.79 (0.23) * | 90.49 (5.88) * |
| Weft direction (F) | 2.43 (0.12) * | 80.36 (3.19) * |
| Direction | Thickness of the Layer (mm) | Elastic Characteristics of the Layer | Terms of the Stiffness Matrix of the Composite Layer | ||||
|---|---|---|---|---|---|---|---|
| (MPa) | (MPa) | (MPa) | (MPa) | (MPa) | |||
| Warp (R) | 0.325 | 35,245 | 33626 | 0.141 | 35,927.625 | 4833.095 | 34,277.268 |
| Weft (F) | 33,626 | 35245 | 0.106 | 34,027.525 | 3780.581 | 35,665.857 | |
| Direction | Thickness of the Layer (mm) | Elastic Characteristics of the Layer | Terms of the Stiffness Matrix of the Composite Layer | ||||
|---|---|---|---|---|---|---|---|
| (MPa) | (MPa) | (MPa) | (MPa) | (MPa) | |||
| Warp (R) | 0.325 | 29,343 | 26,884 | 0.141 | 29,886.942 | 3860.913 | 27,382.359 |
| Weft (F) | 26,884 | 29,343 | 0.106 | 27,218.791 | 3149.092 | 29,708.413 | |
| Direction | Stiffness Matrix Components | Equivalent Tensile Modulus of Elasticity E (MPa) | Equivalent Flexural Modulus of Elasticity E’ (MPa) | |||||
|---|---|---|---|---|---|---|---|---|
| (MPa) | (MPa) | (MPa) | (MPa) | (MPa) | (MPa) | |||
| Warp (R) | 93,411.83 | 12,566.05 | 89,120.90 | 43,774.41 | 5654.95 | 40,106.03 | 33,626.78 | 29,342.55 |
| Weft (F) | 88,471.57 | 9829.51 | 92,731.23 | 39,866.46 | 4612.37 | 43,512.92 | 35,246.16 | 26,884.99 |
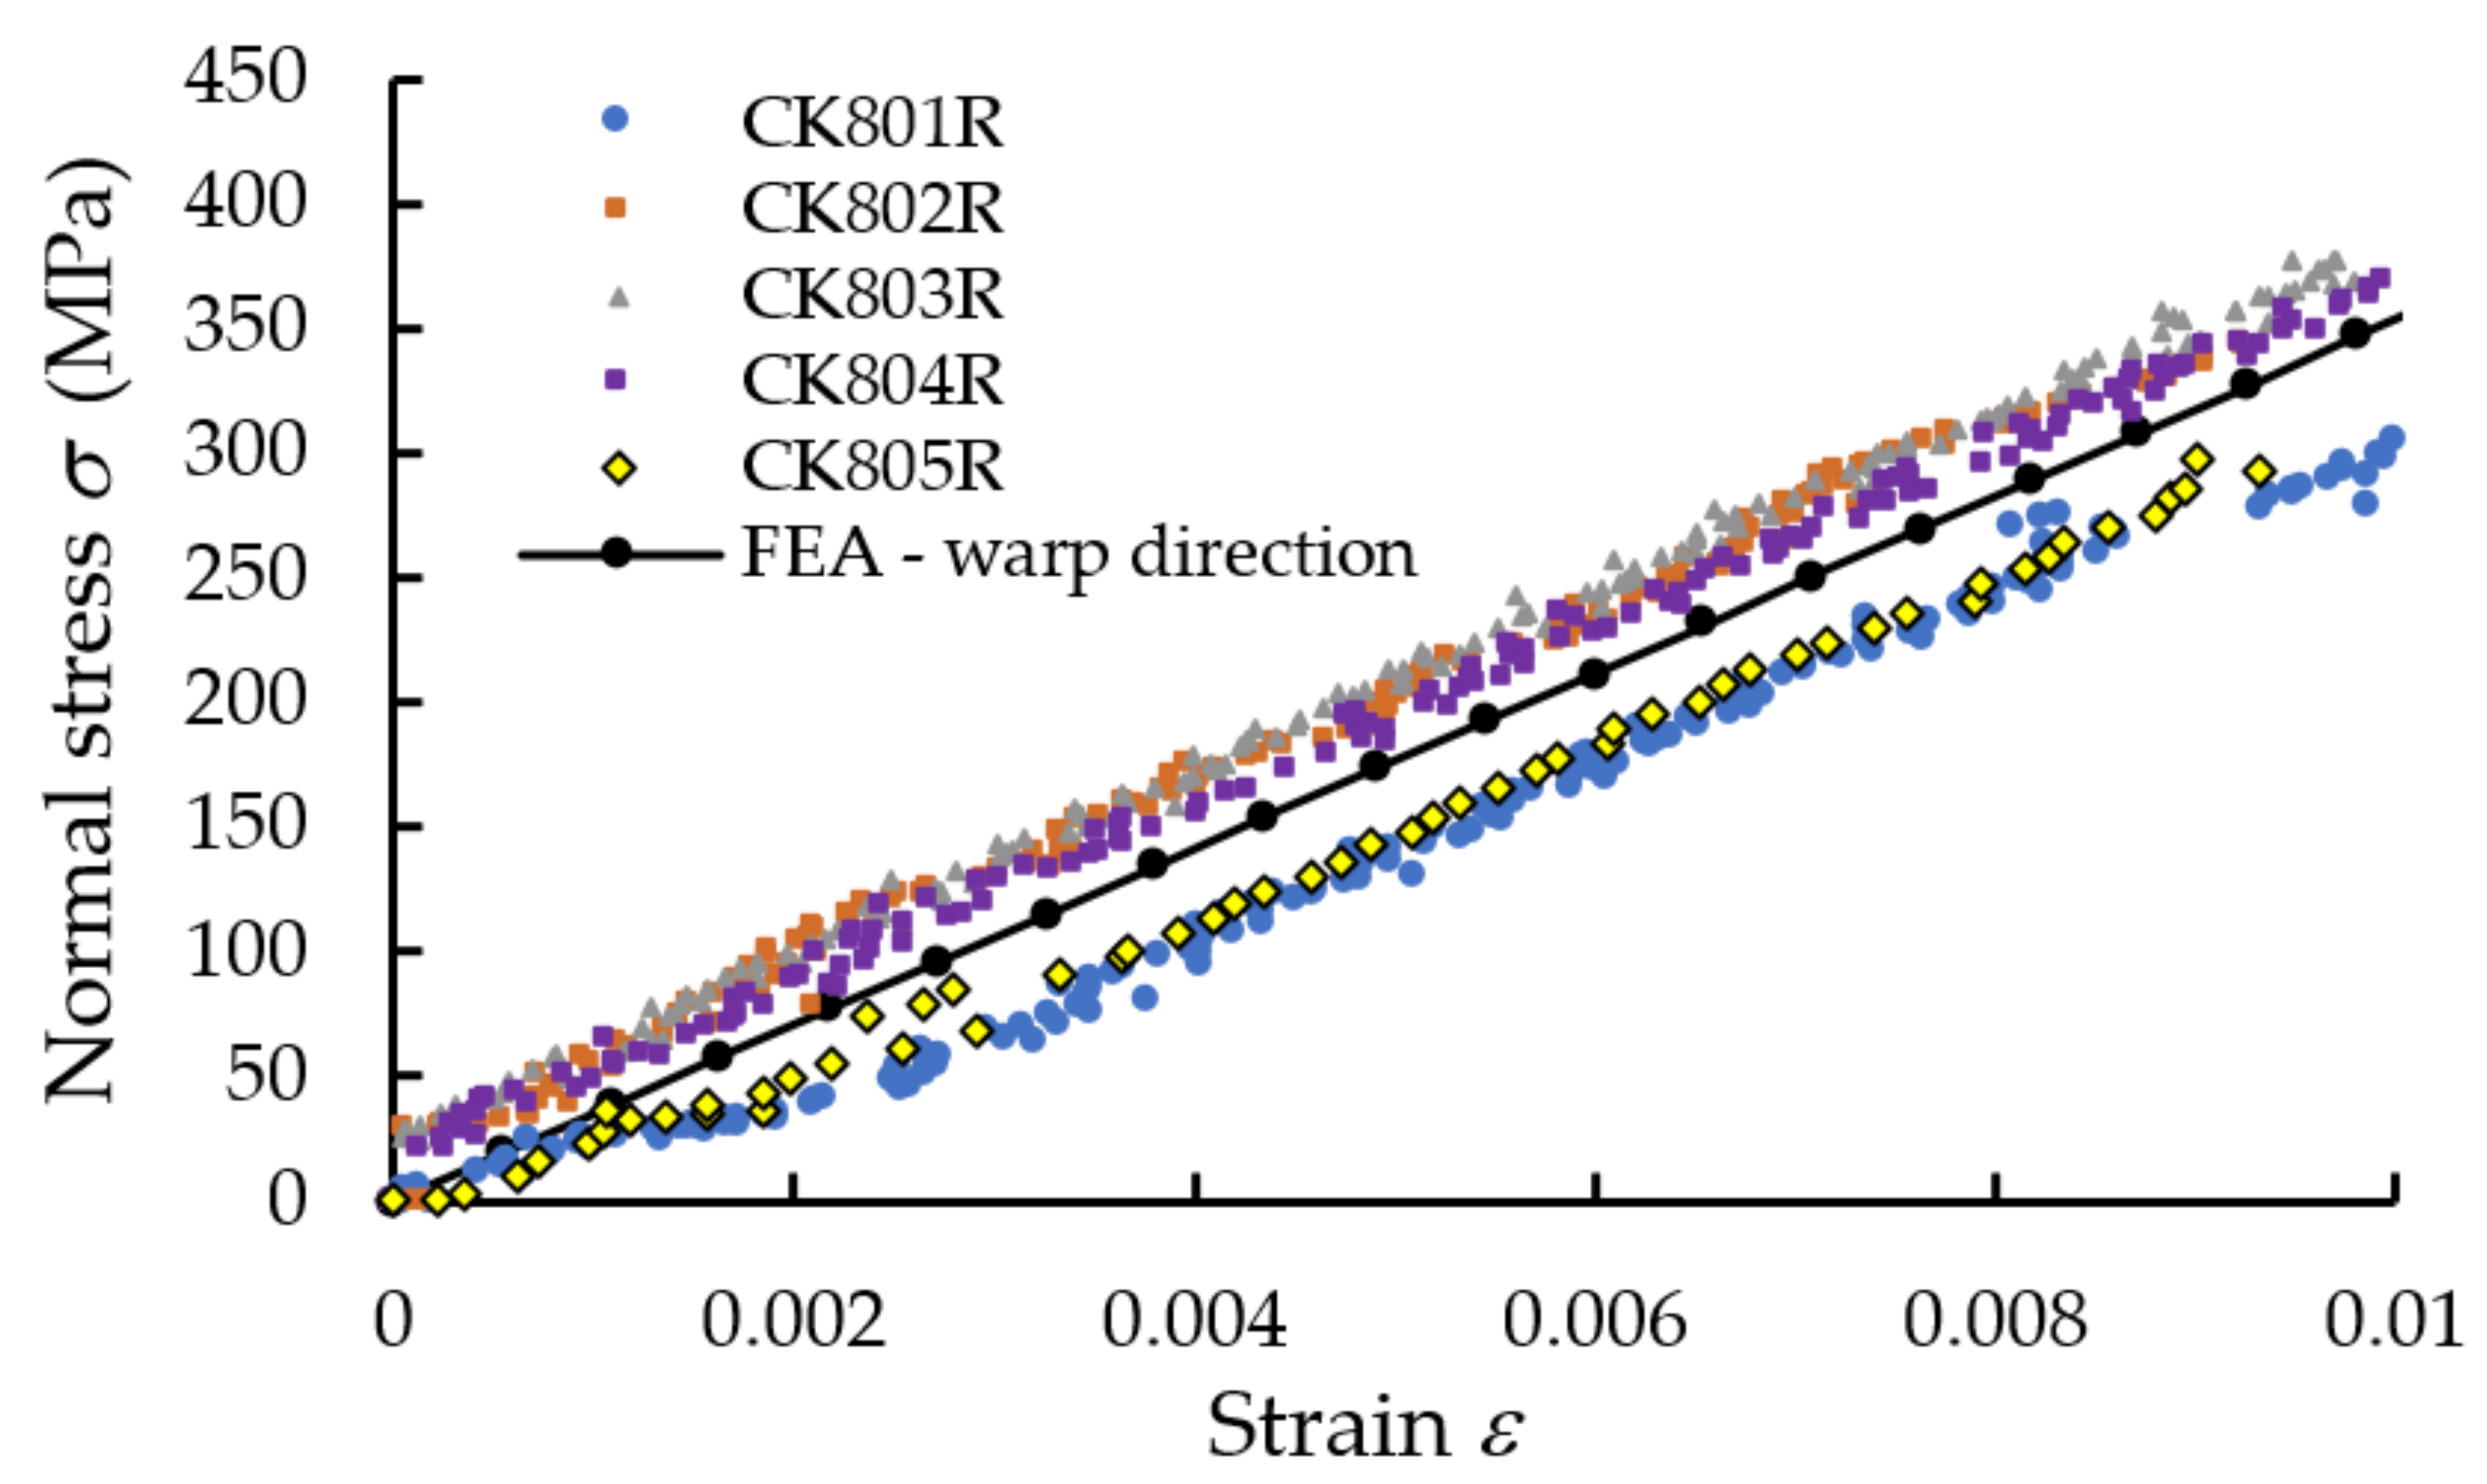
| No. | Normal Stress
(MPa) | Longitudinal Strain | Err for (%) | |
|---|---|---|---|---|
| DIC Method | FEA | |||
| 1 | 148.30 | 0.003801 | 0.004205 | 9.61 |
| 2 | 199.46 | 0.005276 | 0.005656 | 6.72 |
| 3 | 251.54 | 0.006568 | 0.007133 | 7.92 |
| 4 | 302.67 | 0.008245 | 0.008583 | 3.93 |
| 5 | 351.12 | 0.009486 | 0.009957 | 4.73 |
| 6 | 398.11 | 0.010752 | 0.011289 | 4.76 |
| Direction | Equivalent Tensile Modulus of Elasticity (MPa) | Error (%) | ||||
|---|---|---|---|---|---|---|
| AnM * | FEA | Exp * | FEA vs. AnM | Exp vs. AnM | Exp vs. FEA | |
| Warp (R) | 35,246.16 | 35,311 | 35,245 | 0.18 | 0.003 | 0.19 |
| Weft (F) | 33,626.78 | 33,684 | 33,626 | 0.17 | 0.002 | 0.17 |
| Direction | Equivalent Flexural Modulus (MPa) | Error (%) | ||||
|---|---|---|---|---|---|---|
| AnM * | FEA | Exp * | FEA vs. AnM | Exp vs. AnM | Exp vs. FEA | |
| Warp (R) | 29,342.55 | 29,387.40 | 29,343.00 | 0.15 | 0.002 | 0.15 |
| Weft (F) | 26,884.99 | 26,877.70 | 26,884.00 | 0.03 | 0.004 | 0.02 |
Publisher’s Note: MDPI stays neutral with regard to jurisdictional claims in published maps and institutional affiliations. |
© 2021 by the authors. Licensee MDPI, Basel, Switzerland. This article is an open access article distributed under the terms and conditions of the Creative Commons Attribution (CC BY) license (https://creativecommons.org/licenses/by/4.0/).
Share and Cite
Cerbu, C.; Ursache, S.; Botis, M.F.; Hadăr, A. Simulation of the Hybrid Carbon-Aramid Composite Materials Based on Mechanical Characterization by Digital Image Correlation Method. Polymers 2021, 13, 4184. https://doi.org/10.3390/polym13234184
Cerbu C, Ursache S, Botis MF, Hadăr A. Simulation of the Hybrid Carbon-Aramid Composite Materials Based on Mechanical Characterization by Digital Image Correlation Method. Polymers. 2021; 13(23):4184. https://doi.org/10.3390/polym13234184
Chicago/Turabian StyleCerbu, Camelia, Stefania Ursache, Marius Florin Botis, and Anton Hadăr. 2021. "Simulation of the Hybrid Carbon-Aramid Composite Materials Based on Mechanical Characterization by Digital Image Correlation Method" Polymers 13, no. 23: 4184. https://doi.org/10.3390/polym13234184
APA StyleCerbu, C., Ursache, S., Botis, M. F., & Hadăr, A. (2021). Simulation of the Hybrid Carbon-Aramid Composite Materials Based on Mechanical Characterization by Digital Image Correlation Method. Polymers, 13(23), 4184. https://doi.org/10.3390/polym13234184