
Experimental and Numerical Investigation of Flow and Alignment Behavior of Waste Tire-Derived Graphene Nanoplatelets in PA66 Matrix during Melt-Mixing and Injection

 ,
, 
Abstract
:
1. Introduction
2. Materials and Methods
2.1. Materials
2.2. Fabrication of GNP Reinforced PA66 Nanocomposites by Thermokinetic Mixer
2.3. Characterization
2.4. Modeling Tools
3. Results and Discussion
3.1. Mechanical Performance of GNP Reinforced PA66 Nanocomposites
3.2. Thermal and Crystallinity Properties of GNP Based PA66 Nanocomposites
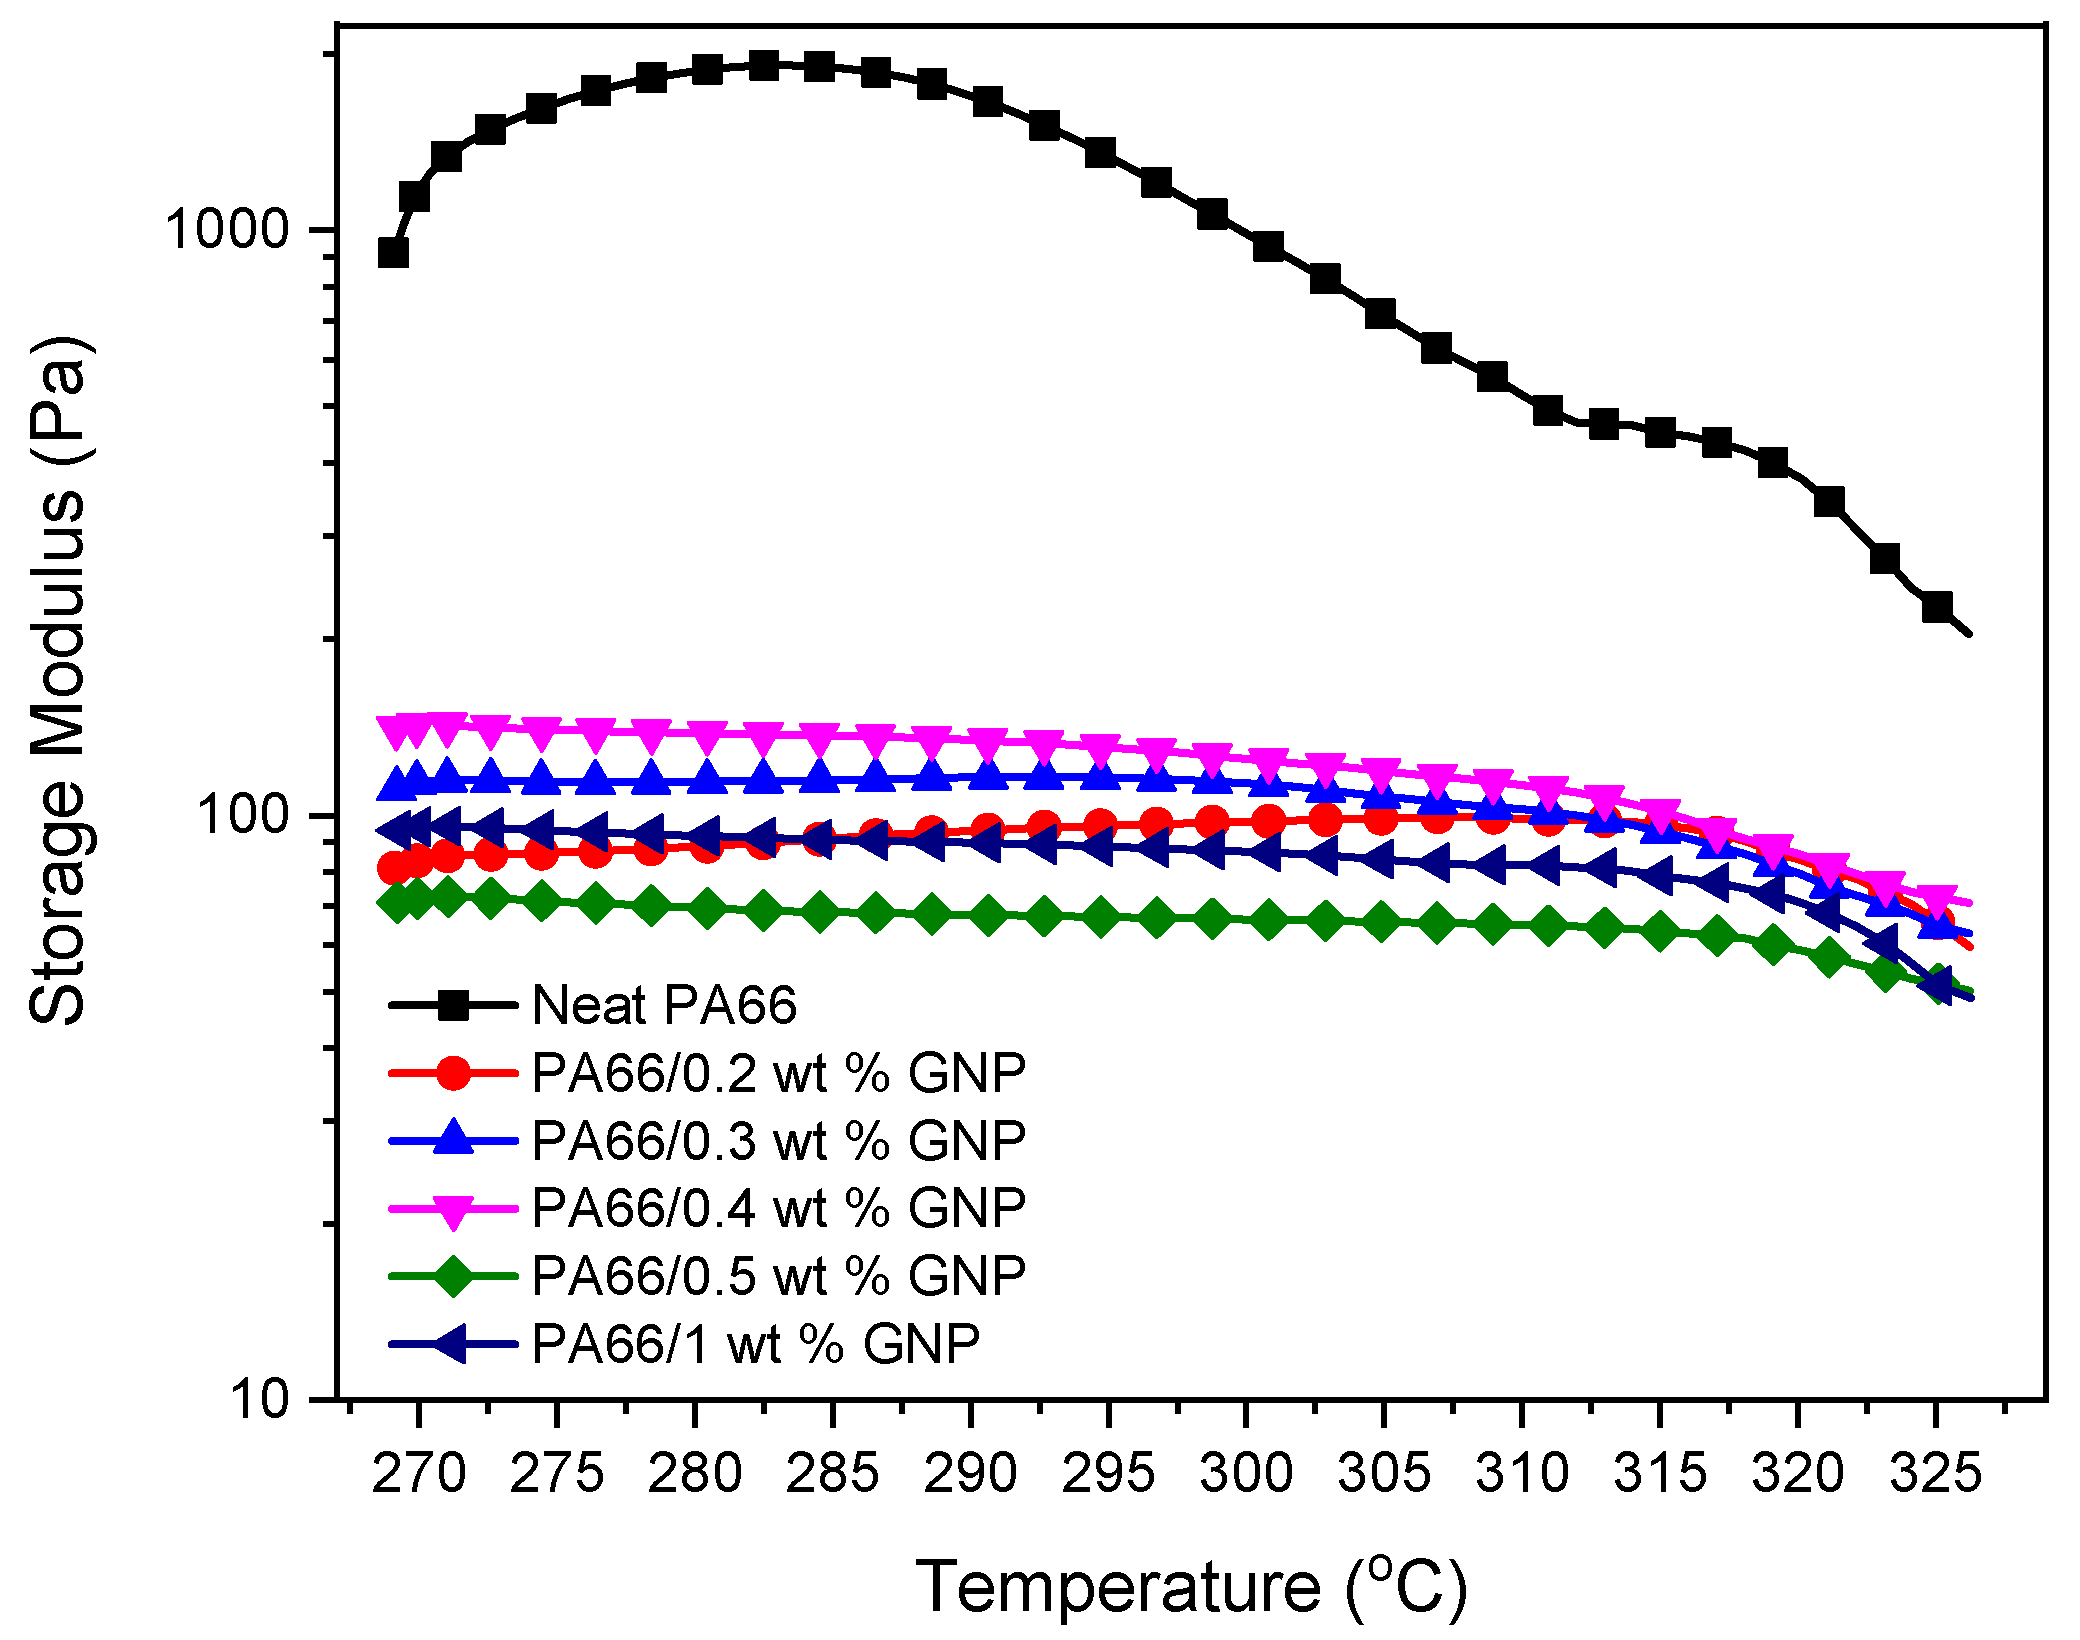
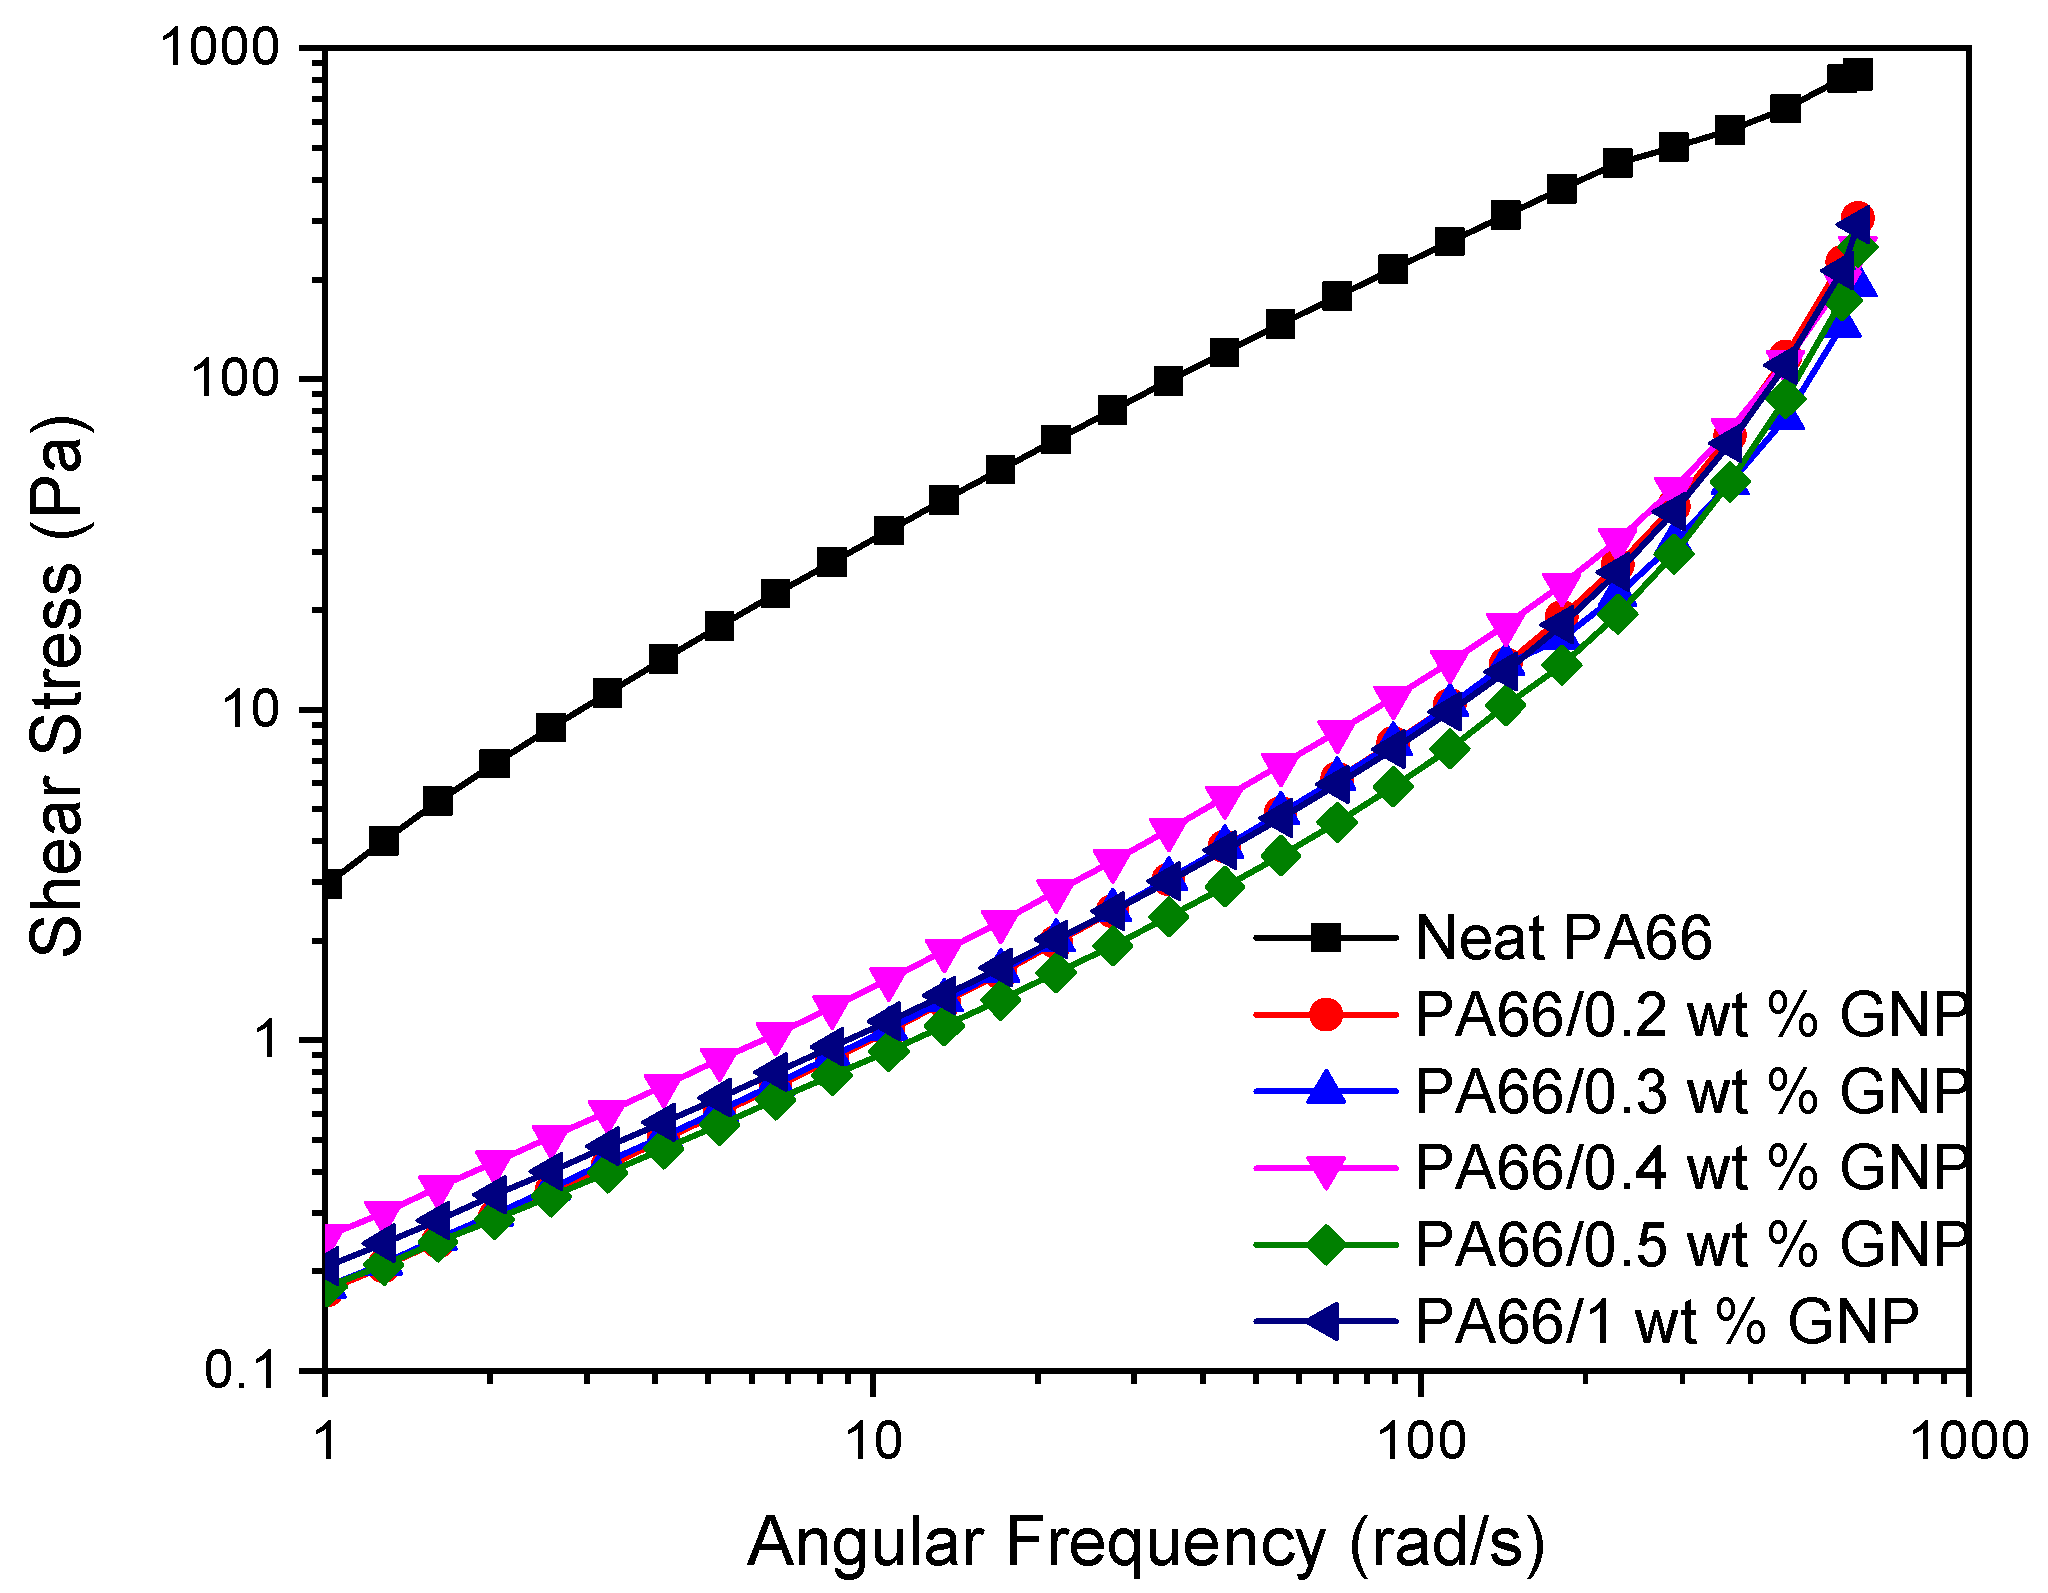
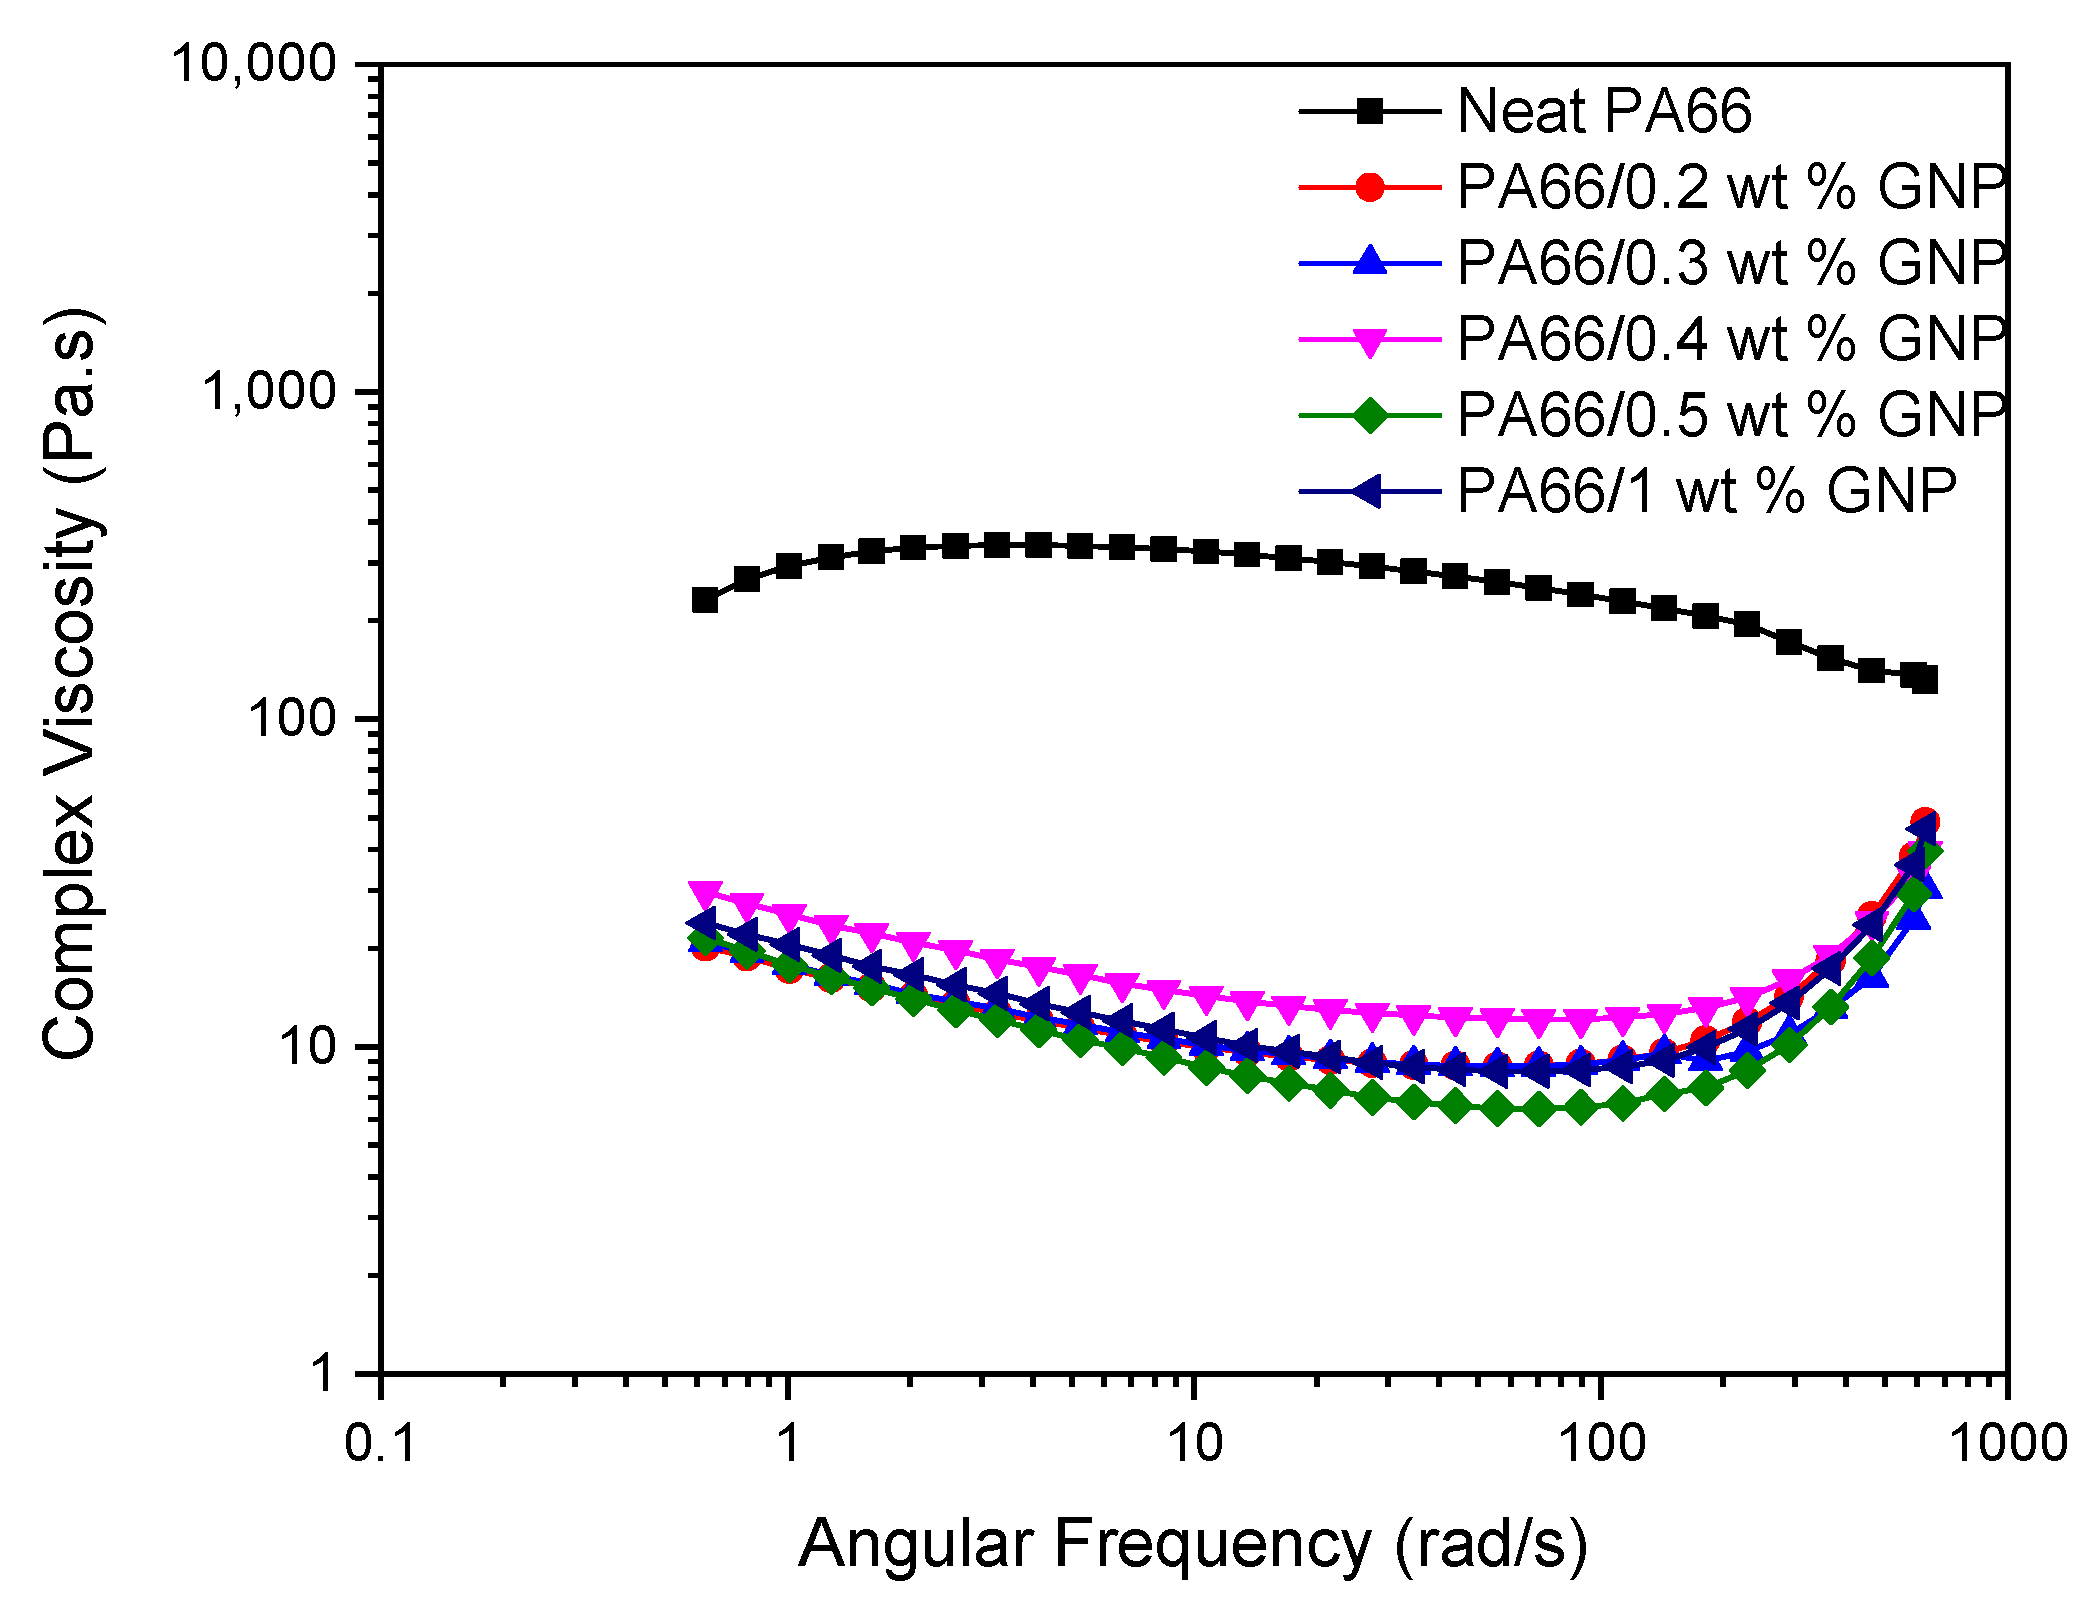
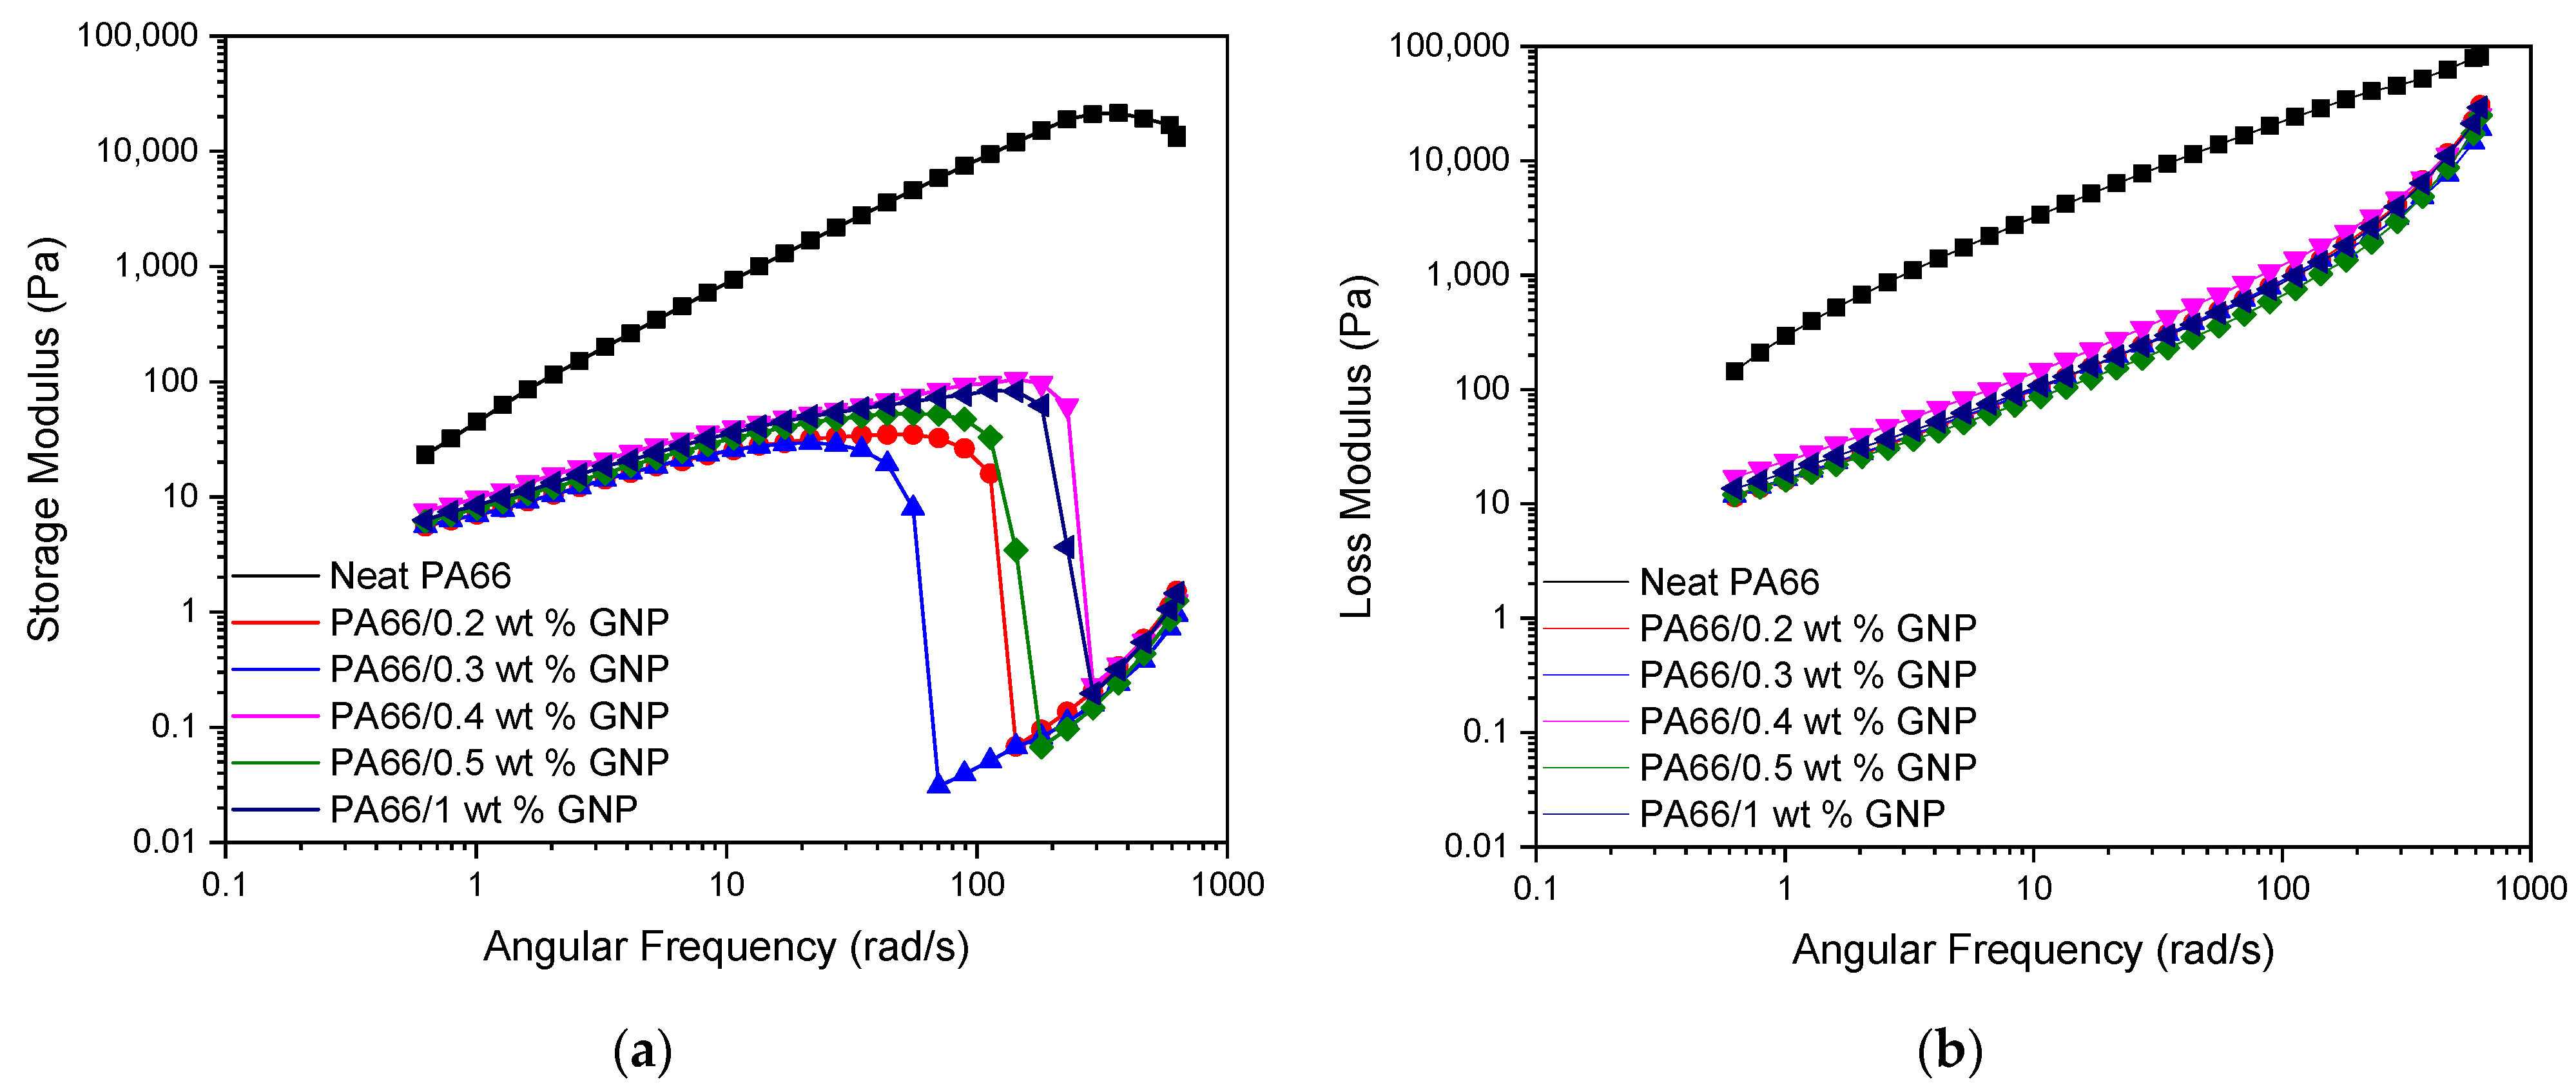
3.3. The Effect of GNP as a Reinforcement on the Rheological Behaviour of PA66 Nanocomposites
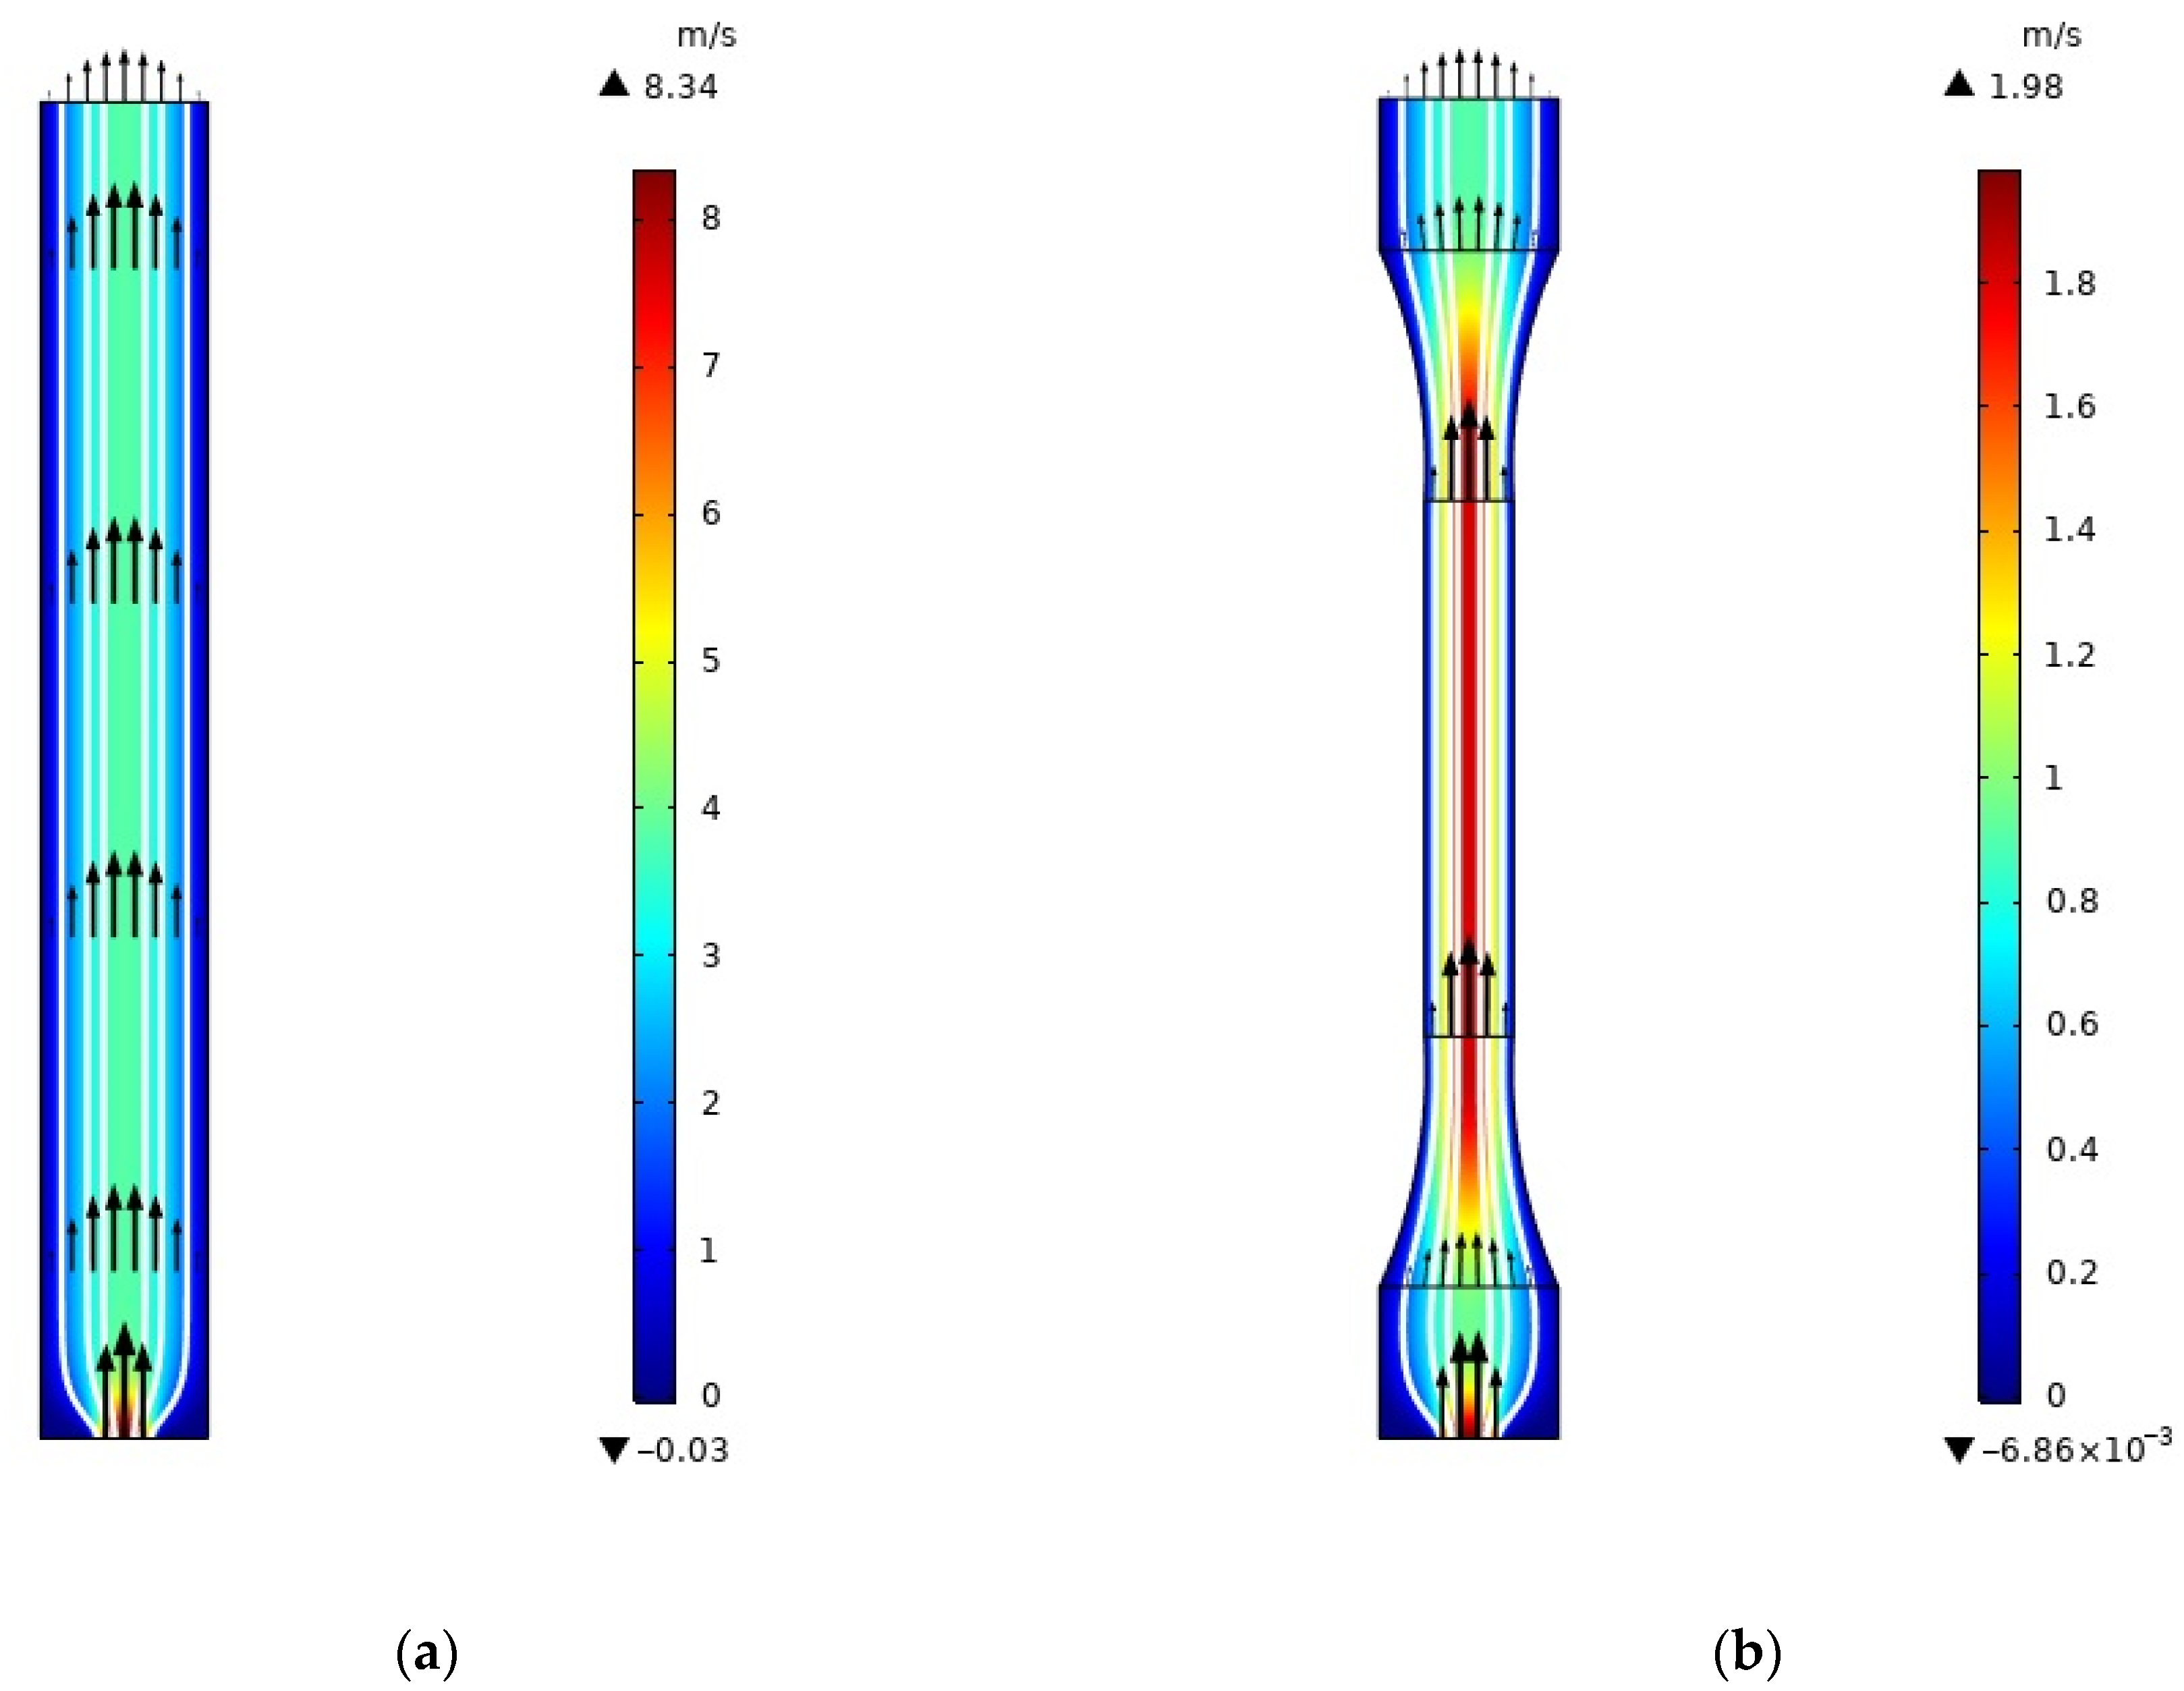
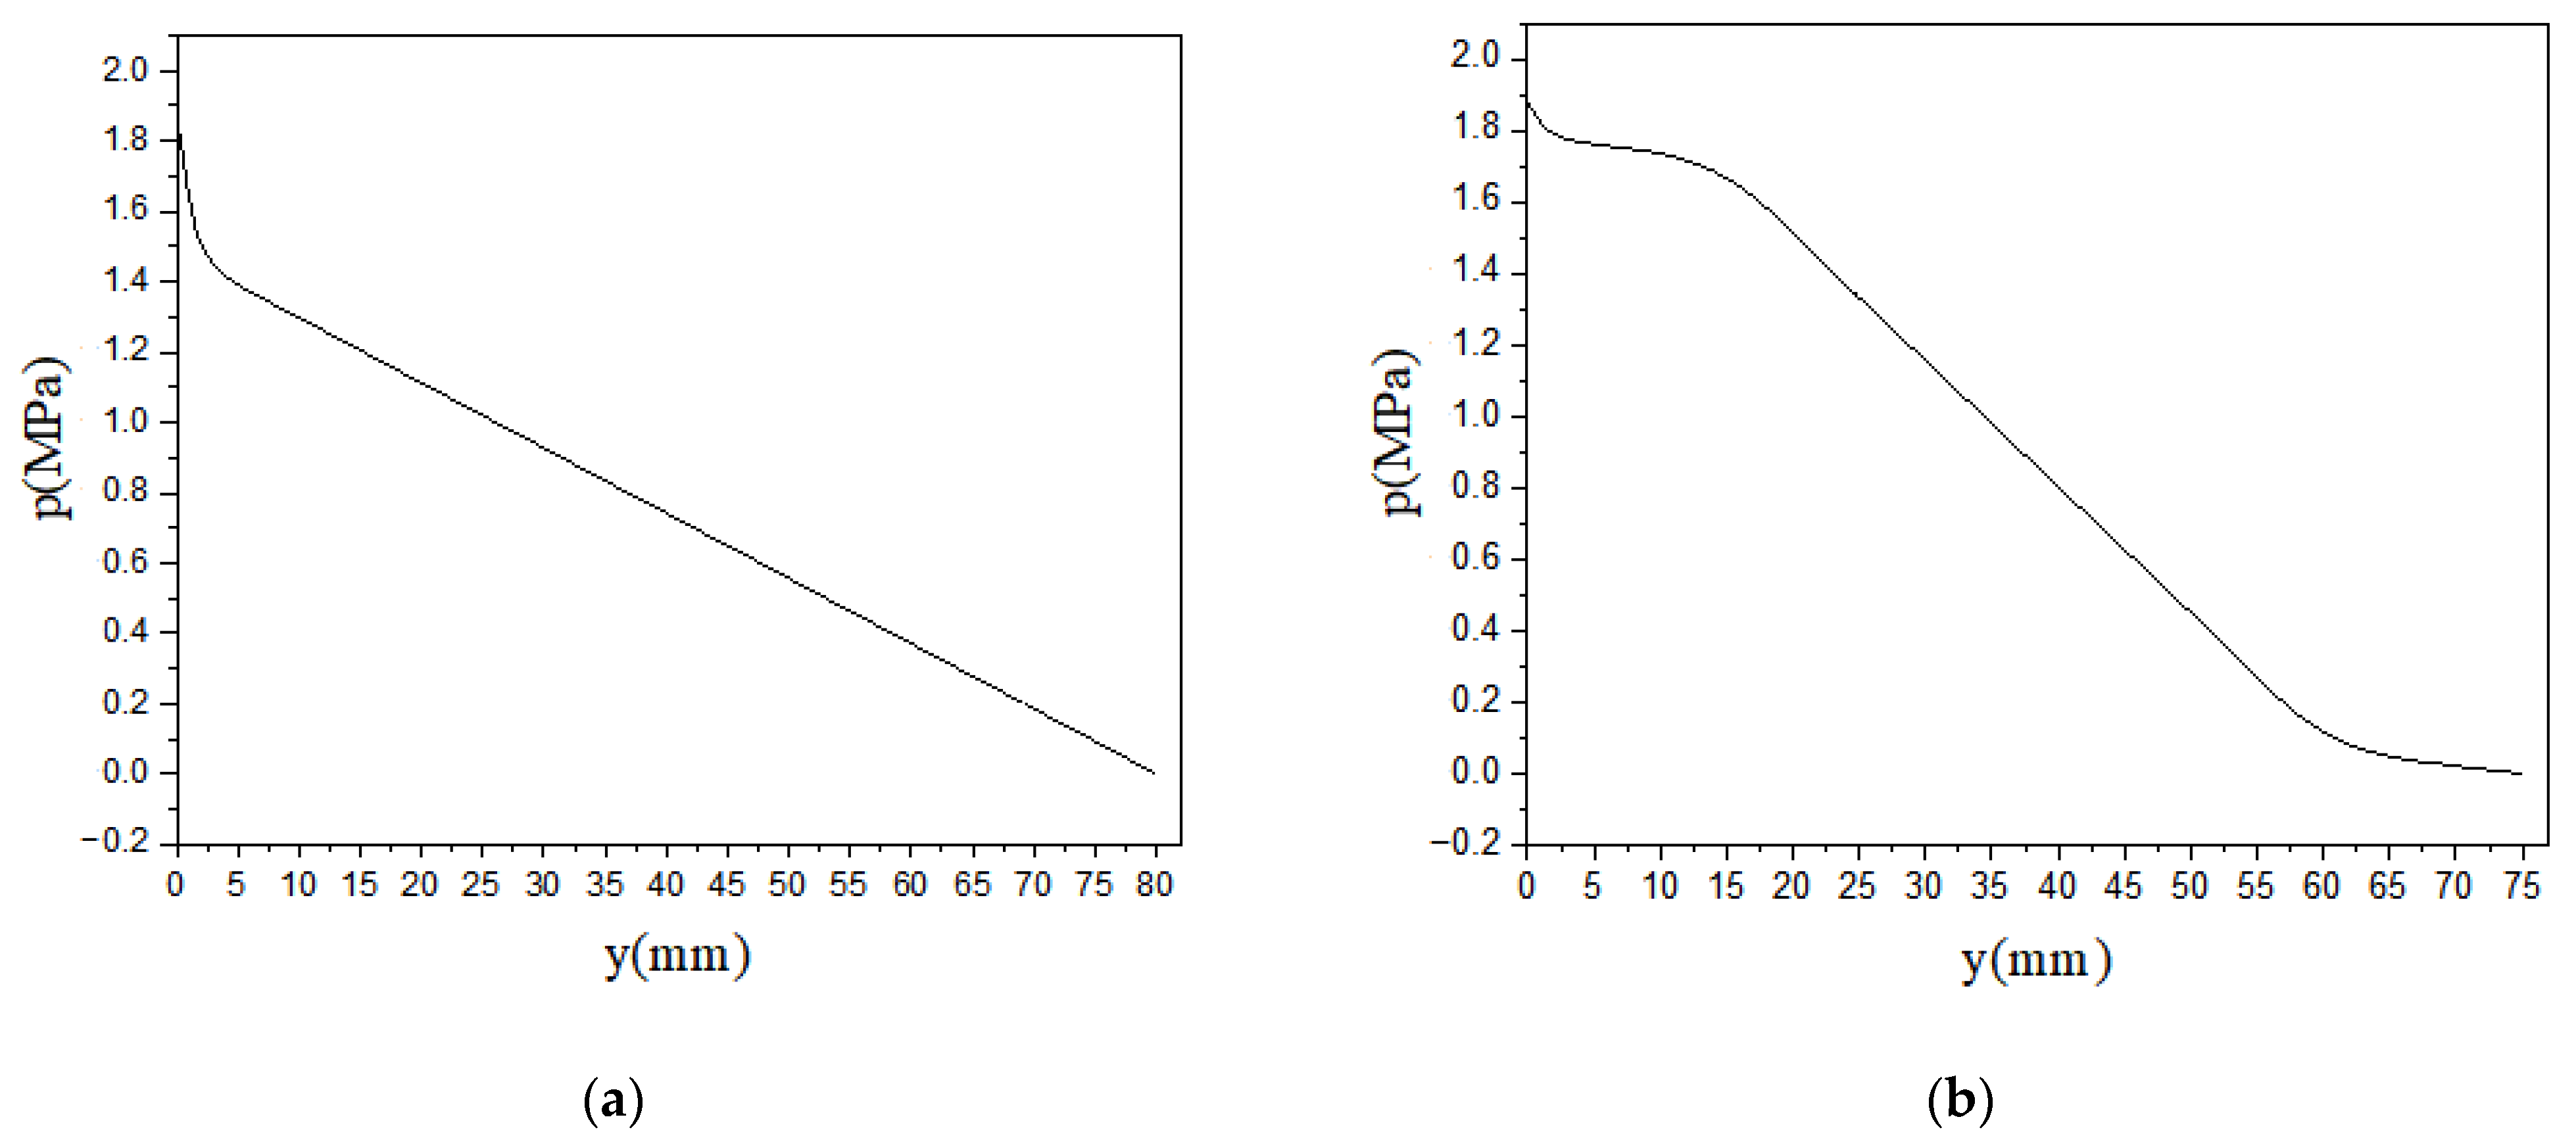
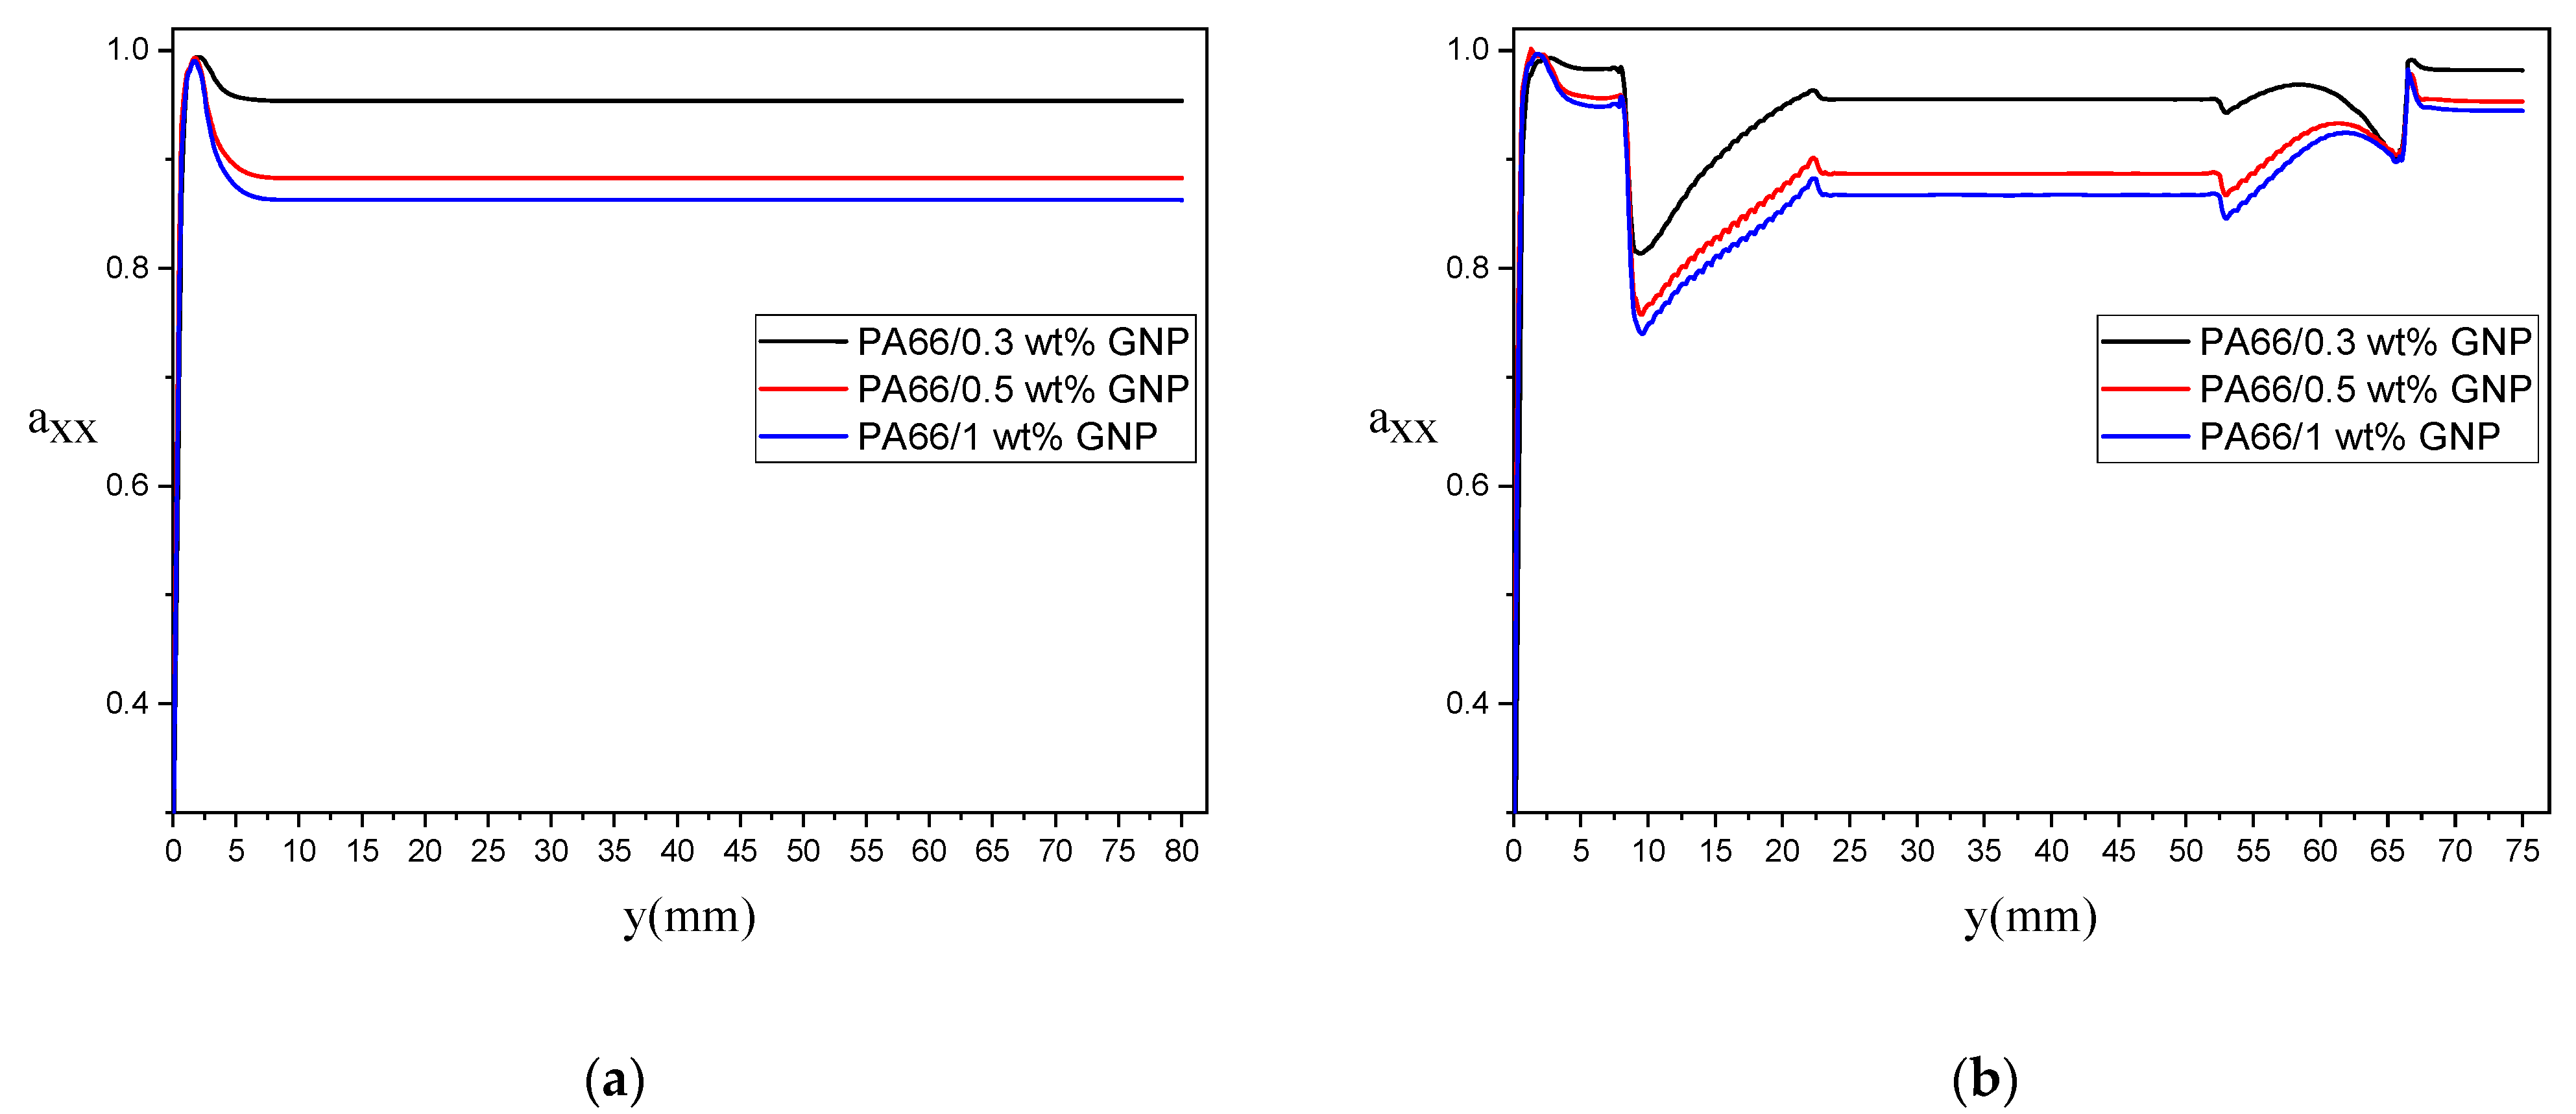
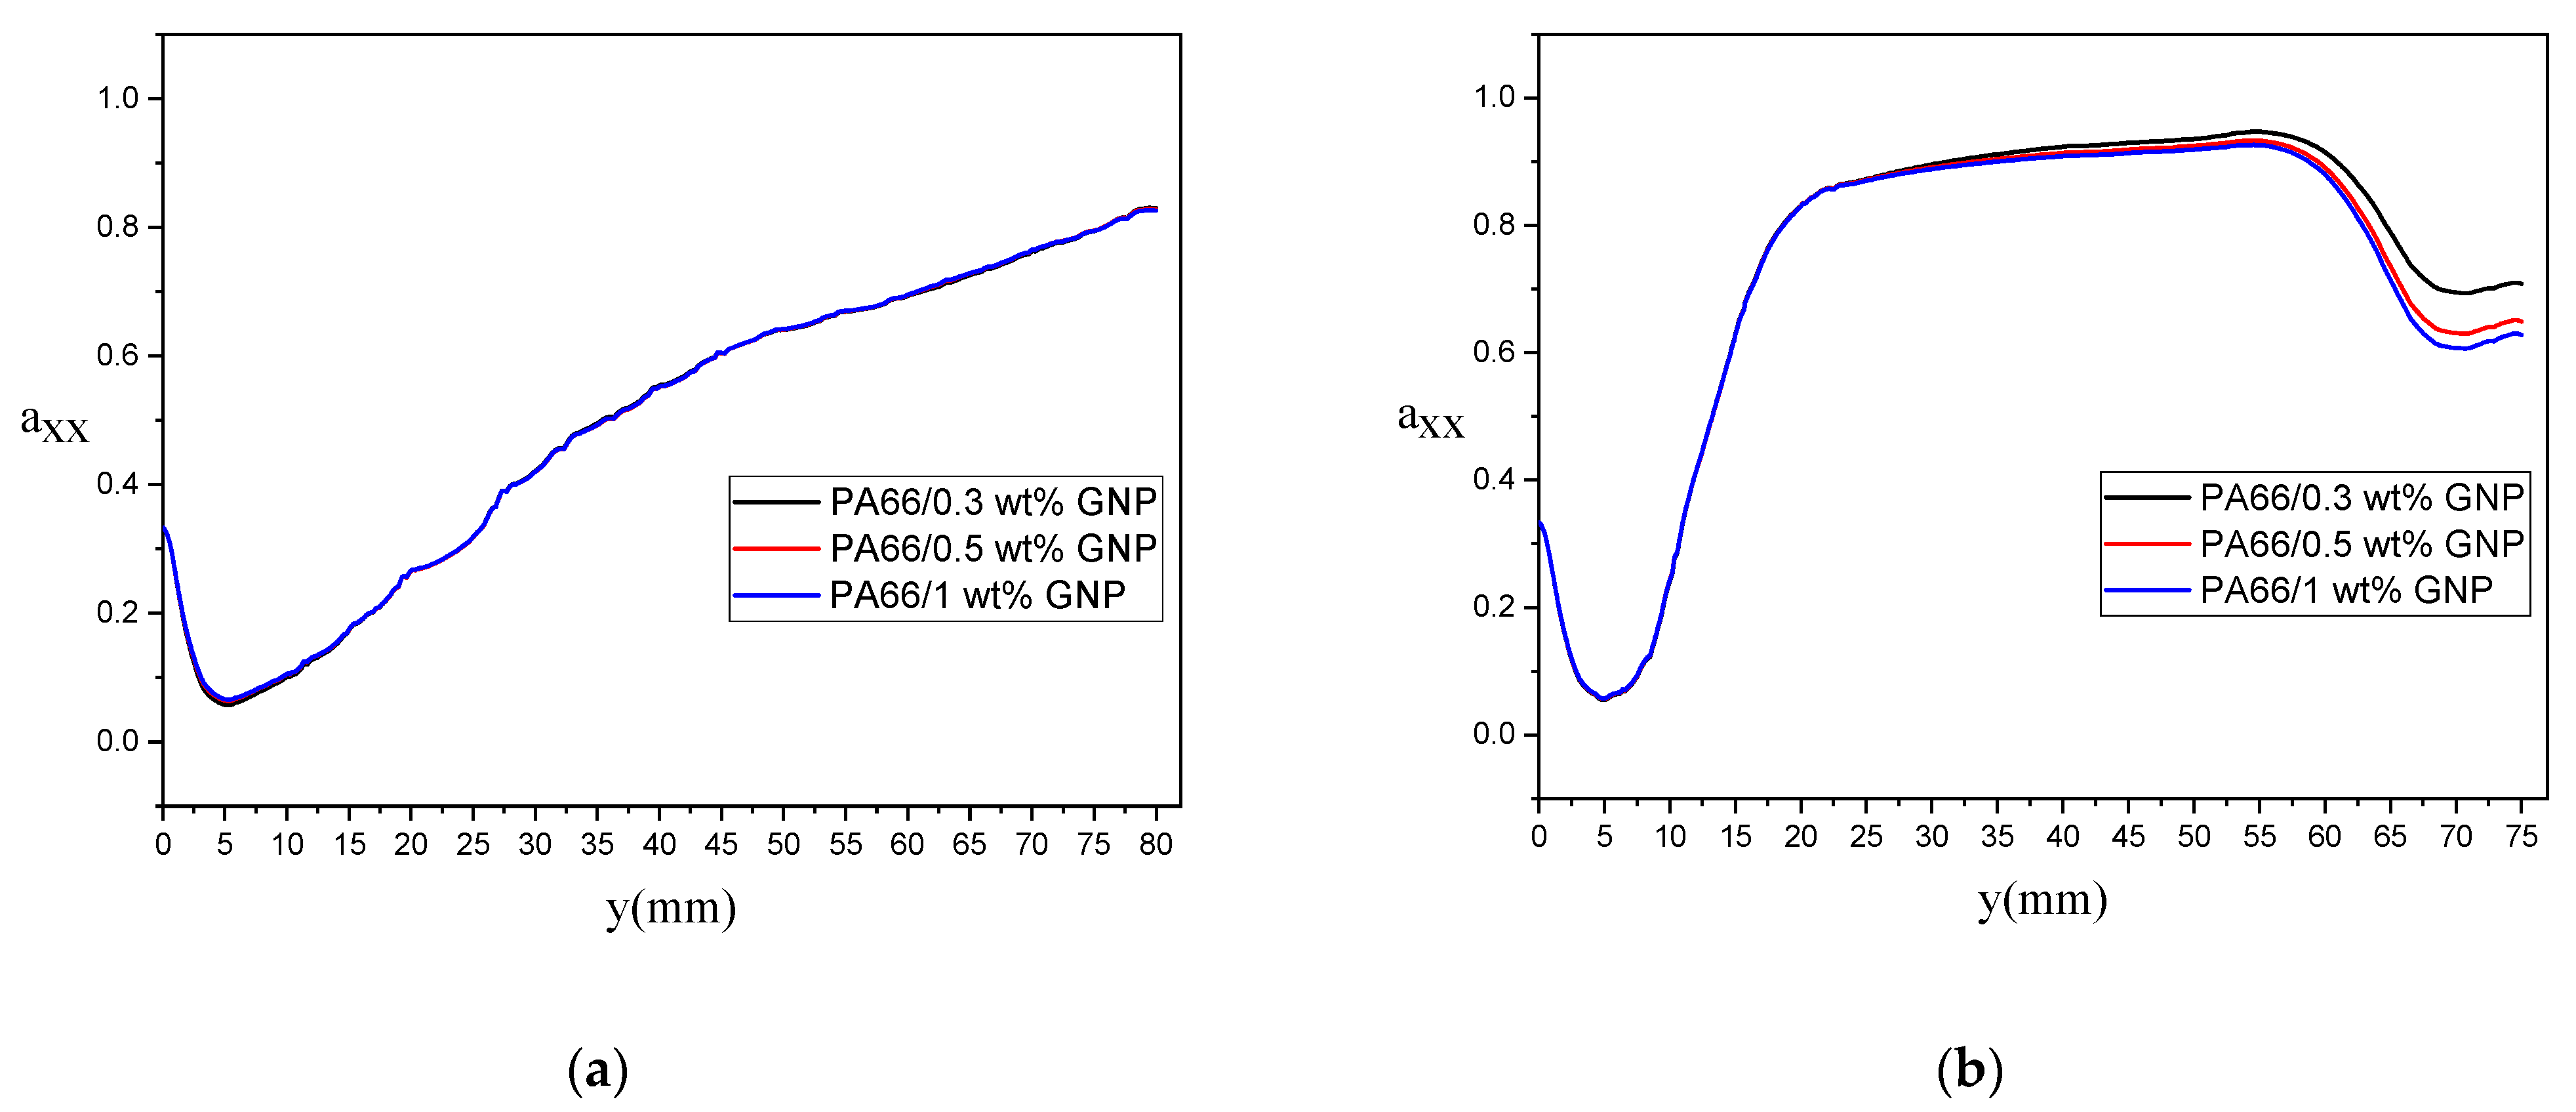
3.4. Numerical Simulation and Modeling of GNP Orientation State
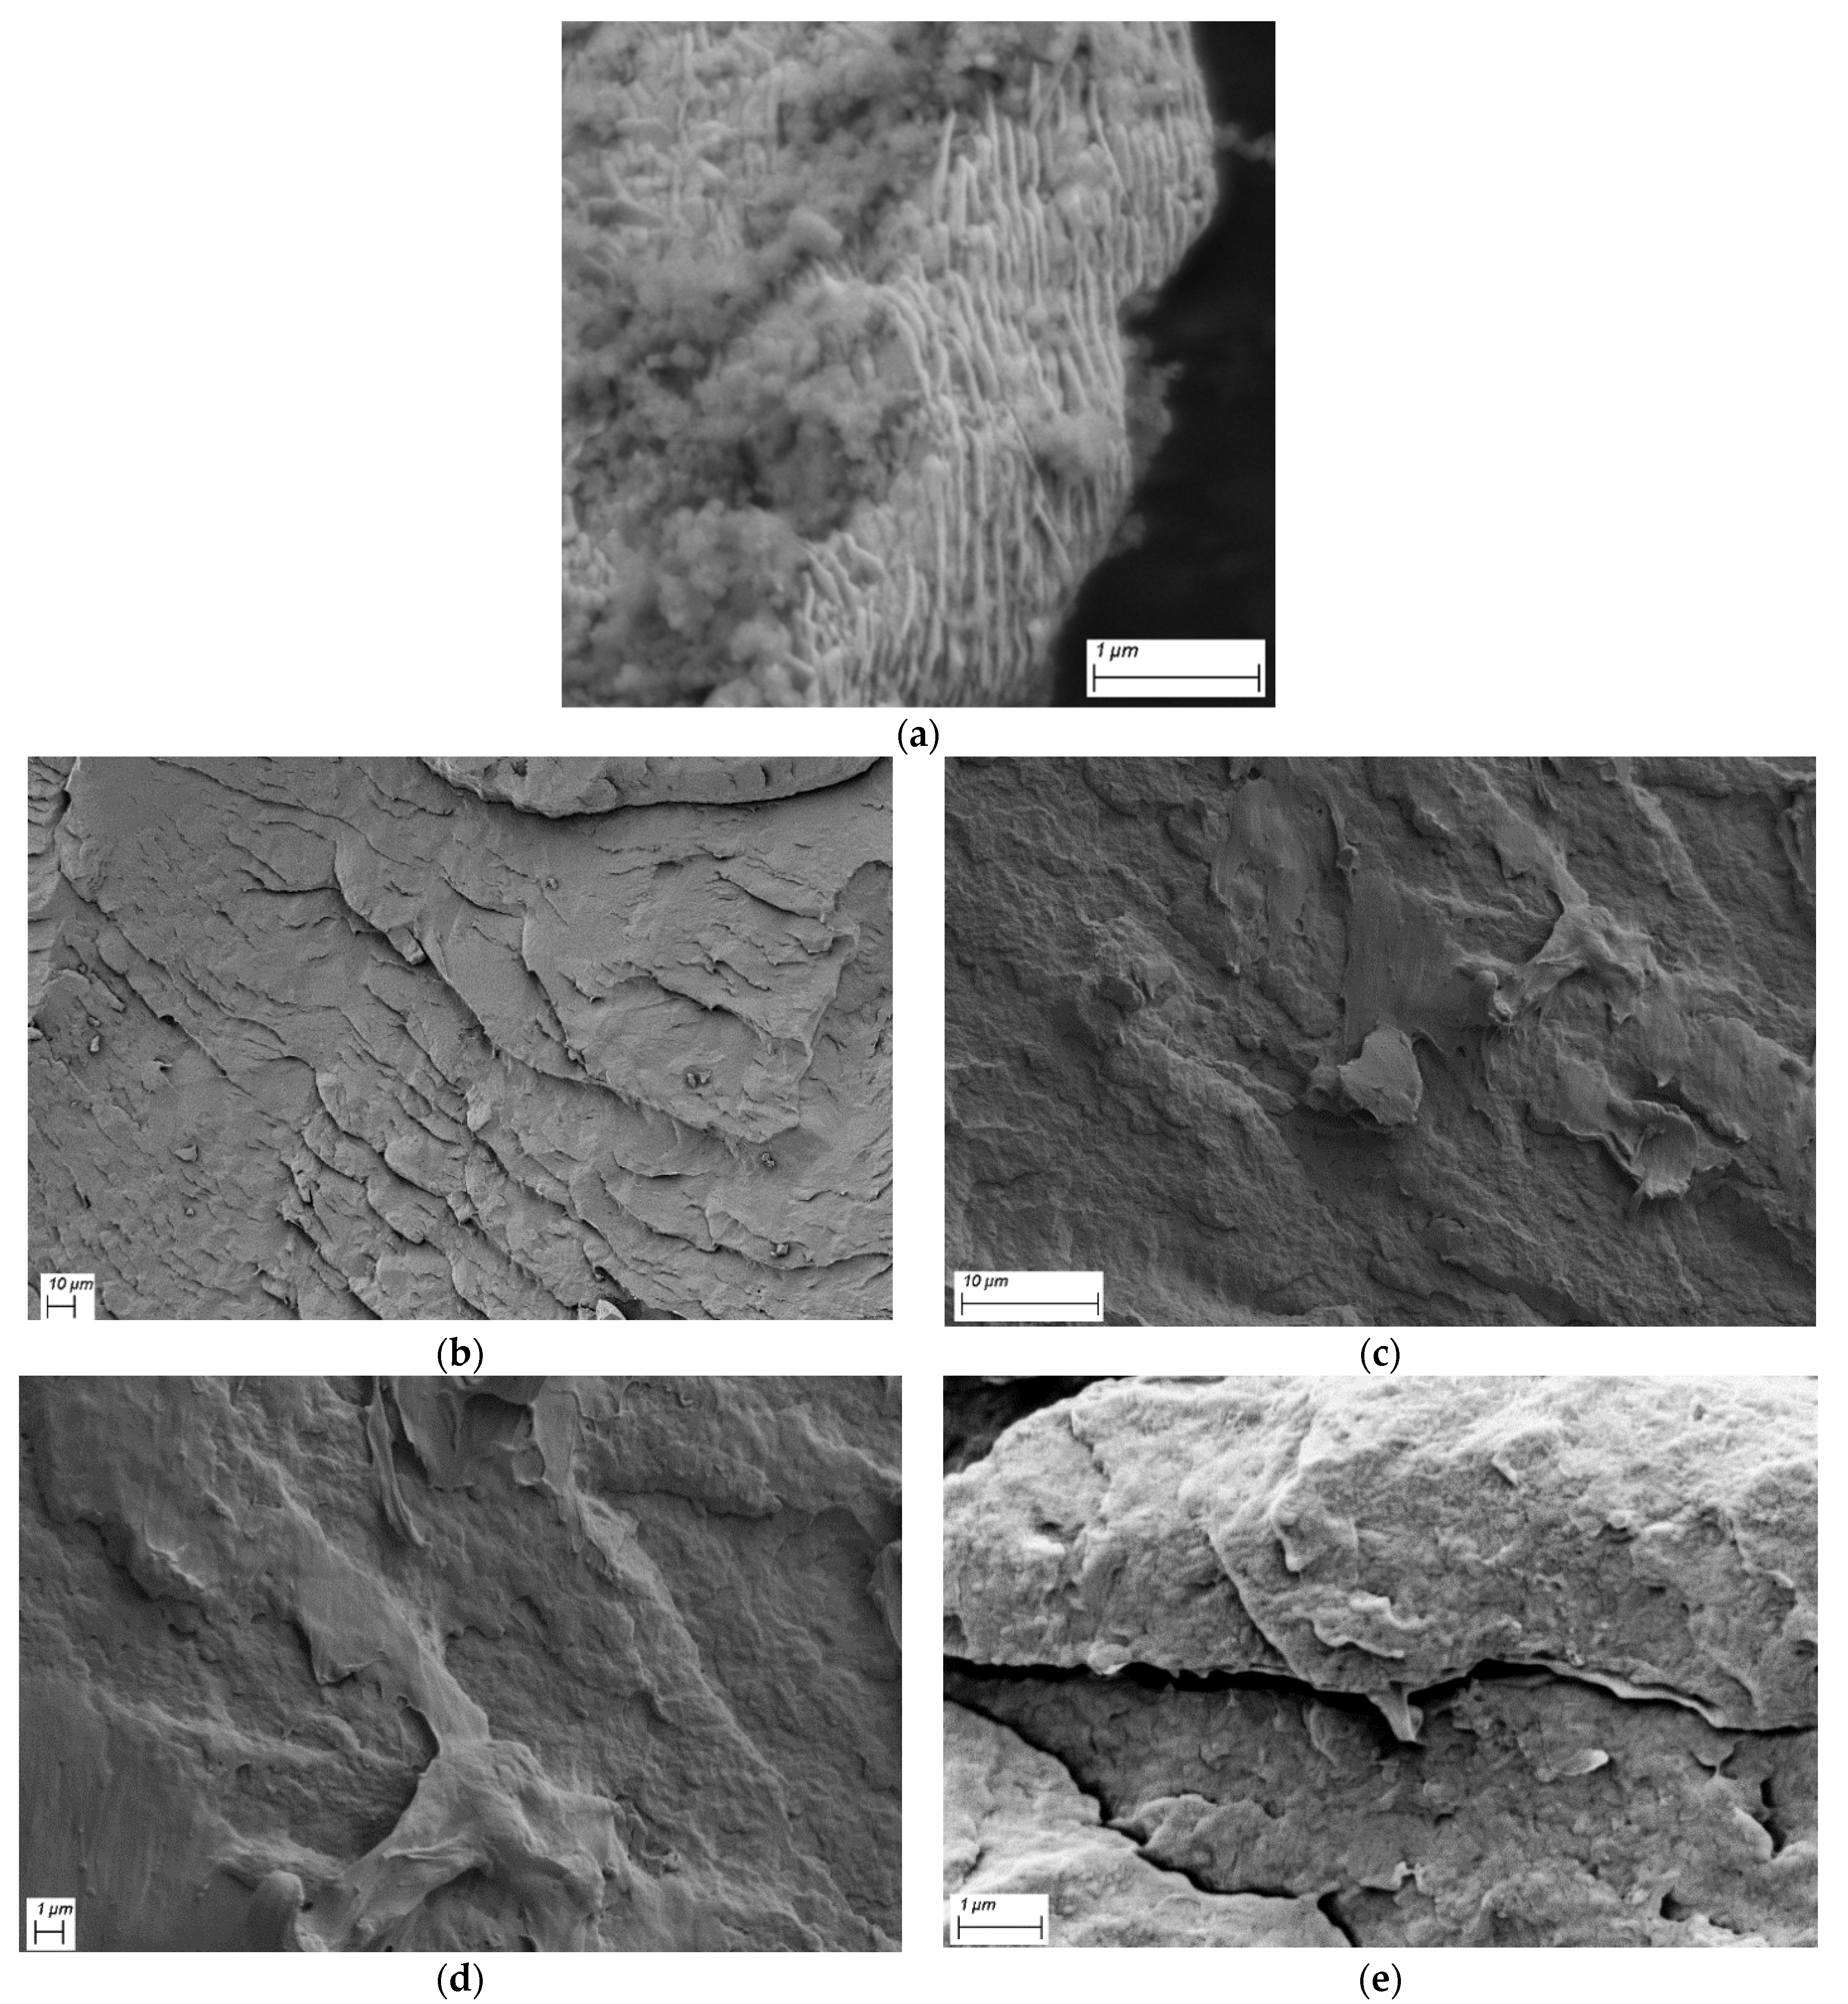
3.5. Cross-Sectional Analysis of GNP Reinforced PA66 Nanocomposites
4. Conclusions
Supplementary Materials
Author Contributions
Funding
Institutional Review Board Statement
Informed Consent Statement
Data Availability Statement
Conflicts of Interest
References
- Pietroluongo, M.; Padovano, E.; Frache, A.; Badini, C. Mechanical recycling of an end-of-life automotive composite component. Sustain. Mater. Technol. 2020, 23, e00143. [Google Scholar] [CrossRef]
- Mark, J.E. Polymer Data Handbook, 1st ed.; Mark, J.E., Ed.; Springer Oxford: New York, NY, USA, 1998; ISBN 0195107896. [Google Scholar]
- Li, Q.; Li, B.; Zhang, S.; Lin, M. Investigation on effects of aluminum and magnesium hypophosphites on flame retardancy and thermal degradation of polyamide 6. J. Appl. Polym. Sci. 2012, 125, 1782–1789. [Google Scholar] [CrossRef]
- Alexandrescu, L.; Sönmez, M.; Georgescu, M.; Niţuicǎ, M.; Ficai, A.; Trusca, R.; Gurǎu, D.; Tudoroiu, L. Polyamide/Polypropylene/graphene oxide nanocomposites with functional compatibilizers: Morpho-structural and physico-mechanical characterization. Procedia Struct. Integr. 2017, 5, 675–682. [Google Scholar] [CrossRef]
- Soulestin, J.; Rashmi, B.J.; Bourbigot, S.; Lacrampe, M.F.; Krawczak, P. Mechanical and optical properties of polyamide 6/clay nanocomposite cast films: Influence of the degree of exfoliation. Macromol. Mater. Eng. 2012, 297, 444–454. [Google Scholar] [CrossRef]
- Xu, Q.; Chen, F.; Li, X.; Zhang, Z. The effect of surface functional groups of nanosilica on the properties of polyamide 6/SiO2 nanocomposite. Pol. J. Chem. Technol. 2013, 15, 20–24. [Google Scholar] [CrossRef] [Green Version]
- Hu, J.; Zhang, H.B.; Hong, S.; Jiang, Z.G.; Gui, C.; Li, X.; Yu, Z.Z. Simultaneous improvement in both electrical conductivity and toughness of polyamide 6 nanocomposites filled with elastomer and carbon black particles. Ind. Eng. Chem. Res. 2014, 53, 2270–2276. [Google Scholar] [CrossRef]
- Li, L.; Li, C.Y.; Ni, C.; Rong, L.; Hsiao, B. Structure and crystallization behavior of Nylon 66/multi-walled carbon nanotube nanocomposites at low carbon nanotube contents. Polymer 2007, 48, 3452–3460. [Google Scholar] [CrossRef]
- Fukushima, H.; Drzal, L.T.; Rook, B.P.; Rich, M.J. Thermal conductivity of exfoliated graphite nanocomposites. J. Therm. Anal. Calorim. 2006, 85, 235–238. [Google Scholar] [CrossRef]
- Chen, Z.; Li, T.; Liu, X.; Lü, R. Friction and wear mechanisms of polyamide 66/high density polyethylene blends. J. Polym. Sci. Part B Polym. Phys. 2005, 43, 2514–2523. [Google Scholar] [CrossRef]
- Chen, Z.; Li, T.; Yang, Y.; Liu, X.; Lv, R. Mechanical and tribological properties of PA/PPS blends. Wear 2004, 257, 696–707. [Google Scholar] [CrossRef]
- Masood, M.T.; Papadopoulou, E.L.; Heredia-Guerrero, J.A.; Bayer, I.S.; Athanassiou, A.; Ceseracciu, L. Graphene and polytetrafluoroethylene synergistically improve the tribological properties and adhesion of nylon 66 coatings. Carbon N. Y. 2017, 123, 26–33. [Google Scholar] [CrossRef]
- Fu, X.; Dong, X.; Liu, Y.; Zhao, X.; Zhang, N.; Qi, S.; Wang, D.; Yang, G. Combined graphene and poly (butylene terephthalate)-block-poly (tetramethylene glycol) enhance the mechanical performance of polyamide-6. Eur. Polym. J. 2019, 110, 97–106. [Google Scholar] [CrossRef]
- Li, X.; Shao, L.; Song, N.; Shi, L.; Ding, P. Enhanced thermal-conductive and anti-dripping properties of polyamide composites by 3D graphene structures at low filler content. Compos. Part A Appl. Sci. Manuf. 2016, 88, 305–314. [Google Scholar] [CrossRef]
- Duan, X.; Yu, B.; Yang, T.; Wu, Y.; Yu, H.; Huang, T. In situ polymerization of nylon 66/reduced graphene oxide nanocomposites. J. Nanomater. 2018, 2018. [Google Scholar] [CrossRef] [Green Version]
- Sarno, M.; Baldino, L.; Scudieri, C.; Cardea, S.; Ciambelli, P.; Reverchon, E. SC-CO2-assisted process for a high energy density aerogel supercapacitor: The effect of GO loading. Nanotechnology 2017, 28, 204001. [Google Scholar] [CrossRef] [PubMed]
- Marcano, D.C.; Kosynkin, D.V.; Berlin, J.M.; Sinitskii, A.; Sun, Z.; Slesarev, A.; Alemany, L.B.; Lu, W.; Tour, J.M. Improved synthesis of graphene oxide. ACS Nano 2010, 4, 4806–4814. [Google Scholar] [CrossRef]
- Scaffaro, R.; Maio, A. A green method to prepare nanosilica modified graphene oxide to inhibit nanoparticles re-aggregation during melt processing. Chem. Eng. J. 2017, 308, 1034–1047. [Google Scholar] [CrossRef] [Green Version]
- Wang, Y.Z.; Gao, X.F.; Liu, H.H.; Zhang, J.; Zhang, X.X. Green fabrication of functionalized graphene via one-step method and its reinforcement for polyamide 66 fibers. Mater. Chem. Phys. 2020, 240, 122288. [Google Scholar] [CrossRef]
- Hummers, W.S.; Offeman, R.E. Preparation of Graphitic Oxide. J. Am. Chem. Soc. 1958, 80, 1339. [Google Scholar] [CrossRef]
- Cai, Z.; Meng, X.; Han, Y.; Ye, H.; Cui, L.; Zhou, Q. Reinforcing polyamide 1212 with graphene oxide via a two-step melt compounding process. Compos. Part A Appl. Sci. Manuf. 2015, 69, 115–123. [Google Scholar] [CrossRef]
- Gong, L.; Yin, B.; Li, L.P.; Yang, M.B. Nylon-6/Graphene composites modified through polymeric modification of graphene. Compos. Part B Eng. 2015, 73, 49–56. [Google Scholar] [CrossRef]
- Pan, Y.; Hong, N.; Zhan, J.; Wang, B.; Song, L.; Hu, Y. Effect of Graphene on the Fire and Mechanical Performances of Glass Fiber-Reinforced Polyamide 6 Composites Containing Aluminum Hypophosphite. Polym. Plast. Technol. Eng. 2014, 53, 1467–1475. [Google Scholar] [CrossRef]
- Cho, B.G.; Lee, J.E.; Hwang, S.H.; Han, J.H.; Chae, H.G.; Park, Y. Bin Enhancement in mechanical properties of polyamide 66-carbon fiber composites containing graphene oxide-carbon nanotube hybrid nanofillers synthesized through in situ interfacial polymerization. Compos. Part A Appl. Sci. Manuf. 2020, 135, 105938. [Google Scholar] [CrossRef]
- Karatas, E.; Gul, O.; Karsli, N.G.; Yilmaz, T. Synergetic effect of graphene nanoplatelet, carbon fiber and coupling agent addition on the tribological, mechanical and thermal properties of polyamide 6,6 composites. Compos. Part B Eng. 2019, 163, 730–739. [Google Scholar] [CrossRef]
- Saner Okan, B.; Menceloǧlu, Y.; Ozunlu, B.G.; Yagci, Y.E. Graphene from waste tire by recycling technique for cost-effective and light-weight automotive plastic part production. AIP Conf. Proc. 2020, 2205. [Google Scholar] [CrossRef]
- Yan, D.; Zhang, H.B.; Jia, Y.; Hu, J.; Qi, X.Y.; Zhang, Z.; Yu, Z.Z. Improved electrical conductivity of polyamide 12/graphene nanocomposites with maleated polyethylene-octene rubber prepared by melt compounding. ACS Appl. Mater. Interfaces 2012, 4, 4740–4745. [Google Scholar] [CrossRef] [PubMed]
- Thomas, S.; Sarathchandran, C.; Chandran, N. Rheology of Polymer Blends and Nanocomposites: Theory, Modelling and Applications; Elsevier: Amsterdam, The Netherlands, 2019; ISBN 9780128169575. [Google Scholar]
- Mayoral, B.; Harkin-Jones, E.; Khanam, P.N.; Almaadeed, M.A.; Ouederni, M.; Hamilton, A.R.; Sun, D. Melt processing and characterisation of polyamide 6/graphene nanoplatelet composites. RSC Adv. 2015, 5, 52395–52409. [Google Scholar] [CrossRef] [Green Version]
- Canales, J.; Fernández, M.; Peña, J.J.; Eugenia Muñoz, M.; Santamaría, A. Rheological methods to investigate graphene/amorphous polyamide nanocomposites: Aspect ratio, processing, and crystallization. Polym. Eng. Sci. 2015, 55, 1142–1151. [Google Scholar] [CrossRef]
- Kamal, M.R.; Mutel, A. Rheological properties of suspensions in Newtonian and non-Newtonian fluids. J. Polym. Eng. 1985, 5, 293–382. [Google Scholar] [CrossRef]
- Eberle, A.P.R.; Baird, D.G.; Wapperom, P. Rheology of non-Newtonian fluids containing glass fibers: A review of experimental literature. Ind. Eng. Chem. Res. 2008, 47, 3470–3488. [Google Scholar] [CrossRef]
- Zirnsak, M.A.; Hur, D.U.; Boger, D. V Normal stresses in fibre suspensions. J. Nonnewton. Fluid Mech. 1994, 54, 153–193. [Google Scholar] [CrossRef]
- Kumar, K.S.; Bhatnagar, N.; Ghosh, A.K. Development of long glass fiber reinforced polypropylene composites: Mechanical and morphological characteristics. J. Reinf. Plast. Compos. 2007, 26, 239–249. [Google Scholar] [CrossRef]
- Férec, J.; Ausias, G. Rheological modeling of non-dilute rod suspensions. In Rheology of Non-spherical Particle Suspensions; Elsevier: Amsterdam, The Netherlands, 2015; pp. 77–117. [Google Scholar]
- Cho, E.C.; Huang, J.H.; Li, C.P.; Chang-Jian, C.W.; Lee, K.C.; Hsiao, Y.S.; Huang, J.H. Graphene-based thermoplastic composites and their application for LED thermal management. Carbon N. Y. 2016, 102, 66–73. [Google Scholar] [CrossRef]
- Suchocki, C.; Molak, R. Rheological Properties of Polyamide: Experimental Studies and Constitutive Modeling. Chin. J. Polym. Sci. 2019, 37, 178–188. [Google Scholar] [CrossRef]
- Owlia, E.; Shaikhzadeh Najar, S.; Tavana, R. Experimental and macro finite element modeling studies on conformability behavior of woven nylon 66 composite reinforcement. J. Text. Inst. 2020, 111, 874–881. [Google Scholar] [CrossRef]
- Sathler, C.R.D.L.J.F.; Reis, Y.H.Q.J.M.L.; Costa, H.S. Thermal aging of a polyamide 66—experimental analysis and modeling. J. Braz. Soc. Mech. Sci. Eng. 2021, 2. [Google Scholar] [CrossRef]
- Zhou, Y.; Mallick, P.K. A non-linear damage model for the tensile behavior of an injection molded short E-glass fiber reinforced polyamide-6,6. Mater. Sci. Eng. A 2005, 393, 303–309. [Google Scholar] [CrossRef]
- Mars, J.; Chebbi, E.; Wali, M.; Dammak, F. Numerical and experimental investigations of low velocity impact on glass fiber-reinforced polyamide. Compos. Part B Eng. 2018, 146, 116–123. [Google Scholar] [CrossRef]
- Mezi, D.; Ausias, G.; Advani, S.G.; Férec, J. Fiber suspension in 2D nonhomogeneous flow: The effects of flow/fiber coupling for Newtonian and power-law suspending fluids. J. Rheol. 2019, 63, 405–418. [Google Scholar] [CrossRef]
- Heller, B.P.; Smith, D.E.; Jack, D.A. Effects of extrudate swell and nozzle geometry on fiber orientation in Fused Filament Fabrication nozzle flow. Addit. Manuf. 2016, 12, 252–264. [Google Scholar] [CrossRef]
- Park, J.M.; Park, S.J. Modeling and simulation of fiber orientation in injection molding of polymer composites. Math. Probl. Eng. 2011, 2011. [Google Scholar] [CrossRef]
- Gamstedt, E.K.; Berglund, L.A. Fibre Orientation Distribution (2003). Available online: https://www.sciencedirect.com/topics/engineering/fibre-orientation-distribution (accessed on 26 June 2020).
- Advani, S.G.; Tucker, C.L. The Use of Tensors to Describe and Predict Fiber Orientation in Short Fiber Composites. J. Rheol. 1987, 31, 751–784. [Google Scholar] [CrossRef]
- Mezi, D.; Ausias, G.; Grohens, Y.; Férec, J. Numerical simulation and modeling of the die swell for fiber suspension flows. J. Nonnewton. Fluid Mech. 2019, 274. [Google Scholar] [CrossRef]
- Russell, T.; Heller, B.; Jack, D.A.; Smith, D.E. Prediction of the fiber orientation state and the resulting structural and thermal properties of fiber reinforced additive manufactured composites fabricated using the big area additive manufacturing process. J. Compos. Sci. 2018, 2, 26. [Google Scholar] [CrossRef] [Green Version]
- Férec, J.; Mezi, D.; Advani, S.G.; Ausias, G. Axisymmetric flow simulations of fiber suspensions as described by 3D probability distribution function. J. Nonnewton. Fluid Mech. 2020, 284, 104367. [Google Scholar] [CrossRef]
- Heller, B.P. Effects of Nozzle Geometry and Extrudate Swell on Fiber Orientation in Fused Deposition Modeling Nozzle Flow; Baylor University: Waco, TX, USA, 2015. [Google Scholar]
- Cakal Sarac, E.; Haghighi Poudeh, L.; Seyyed Monfared Zanjani, J.; Pehlivan, Z.S.; Cebeci, F.Ç.; Aydin, I.; Menceloglu, Y.; Saner Okan, B. Nano-engineering of high-performance PA6.6 nanocomposites by the integration of CVD-grown carbon fiber on graphene as a bicomponent reinforcement by melt-compounding. J. Appl. Polym. Sci. 2019, 136. [Google Scholar] [CrossRef]
- Kim, J.; Oh, J.; Lee, K.Y.; Jung, I.; Park, M. Dispersion of graphene-based nanocarbon fillers in polyamide 66 by dry processing and its effect on mechanical properties. Compos. Part B Eng. 2017, 114, 445–456. [Google Scholar] [CrossRef]
- Balani, K.; Verma, V.; Agarwal, A.; Narayan, R. Physical, Thermal, and Mechanical Properties of Polymers. Biosurfaces 2015, 329–344. [Google Scholar] [CrossRef]
- Zanjani, J.S.M.; Poudeh, L.H.; Ozunlu, B.G.; Yagci, Y.E.; Menceloglu, Y.; Saner Okan, B. Development of waste tire-derived graphene reinforced polypropylene nanocomposites with controlled polymer grade, crystallization and mechanical characteristics via melt-mixing. Polym. Int. 2020. [Google Scholar] [CrossRef]
- Lim, L.T.; Britt, I.J.; Tung, M.A. Sorption and Transport of Water Vapor in Nylon 6,6 Film. J. Appl. Polym. Sci. 1999, 71, 197–206. [Google Scholar] [CrossRef]
- Zhang, J.; Gao, X.; Zhang, X.; Liu, H.; Zhang, H.; Zhang, X. Polyamide 66 and amino-functionalized multi-walled carbon nanotube composites and their melt-spun fibers. J. Mater. Sci. 2019, 54, 11056–11068. [Google Scholar] [CrossRef]
- Liu, X.; Wu, Q.; Berglund, L.A. Polymorphism in polyamide 66/clay nanocomposites. Polymer 2002, 43, 4967–4972. [Google Scholar] [CrossRef]
- Göransson, D.J.O.; Borgström, M.T.; Huang, Y.Q.; Messing, M.E.; Hessman, D.; Buyanova, I.A.; Chen, W.M.; Xu, H.Q. Measurements of strain and bandgap of coherently epitaxially grown wurtzite InAsP-InP core-shell nanowires. arXiv 2019. [Google Scholar] [CrossRef] [Green Version]
- Doumeng, M.; Makhlouf, L.; Berthet, F.; Marsan, O.; Delbé, K.; Denape, J.; Chabert, F. A comparative study of the crystallinity of polyetheretherketone by using density, DSC, XRD, and Raman spectroscopy techniques. Polym. Test. 2021, 93. [Google Scholar] [CrossRef]
- Xiao, K.Q.; Zhang, L.C.; Zarudi, I. Mechanical and rheological properties of carbon nanotube-reinforced polyethylene composites. Compos. Sci. Technol. 2007, 67, 177–182. [Google Scholar] [CrossRef]
- Du, F.; Scogna, R.C.; Zhou, W.; Brand, S.; Fischer, J.E.; Winey, K.I. Nanotube networks in polymer nanocomposites: Rheology and electrical conductivity. Macromolecules 2004, 37, 9048–9055. [Google Scholar] [CrossRef]
- Pötschke, P.; Fornes, T.D.; Paul, D.R. Rheological behavior of multiwalled carbon nanotube/polycarbonate composites. Polymer 2002, 43, 3247–3255. [Google Scholar] [CrossRef]
- Cho, J.W.; Paul, D.R. Nylon 6 nanocomposites by melt compounding. Polymer 2001, 42, 1083–1094. [Google Scholar] [CrossRef]
- Fang, C.; Zhang, J.; Chen, X.; Weng, G.J. Calculating the electrical conductivity of graphene nanoplatelet polymer composites by a Monte Carlo method. Nanomaterials 2020, 10, 1129. [Google Scholar] [CrossRef]
- Papanastasiou, T.C.; Alexandrou, A.N. Isothermal extrusion of non-dilute fiber suspensions. J. Nonnewton. Fluid Mech. 1987, 25, 313–328. [Google Scholar] [CrossRef] [Green Version]
- Chung, S.T.; Kwon, T.H. Numerical simulation of fiber orientation in injection molding of short-fiber-reinforced thermoplastics. Polym. Eng. Sci. 1995, 35, 604–618. [Google Scholar] [CrossRef]


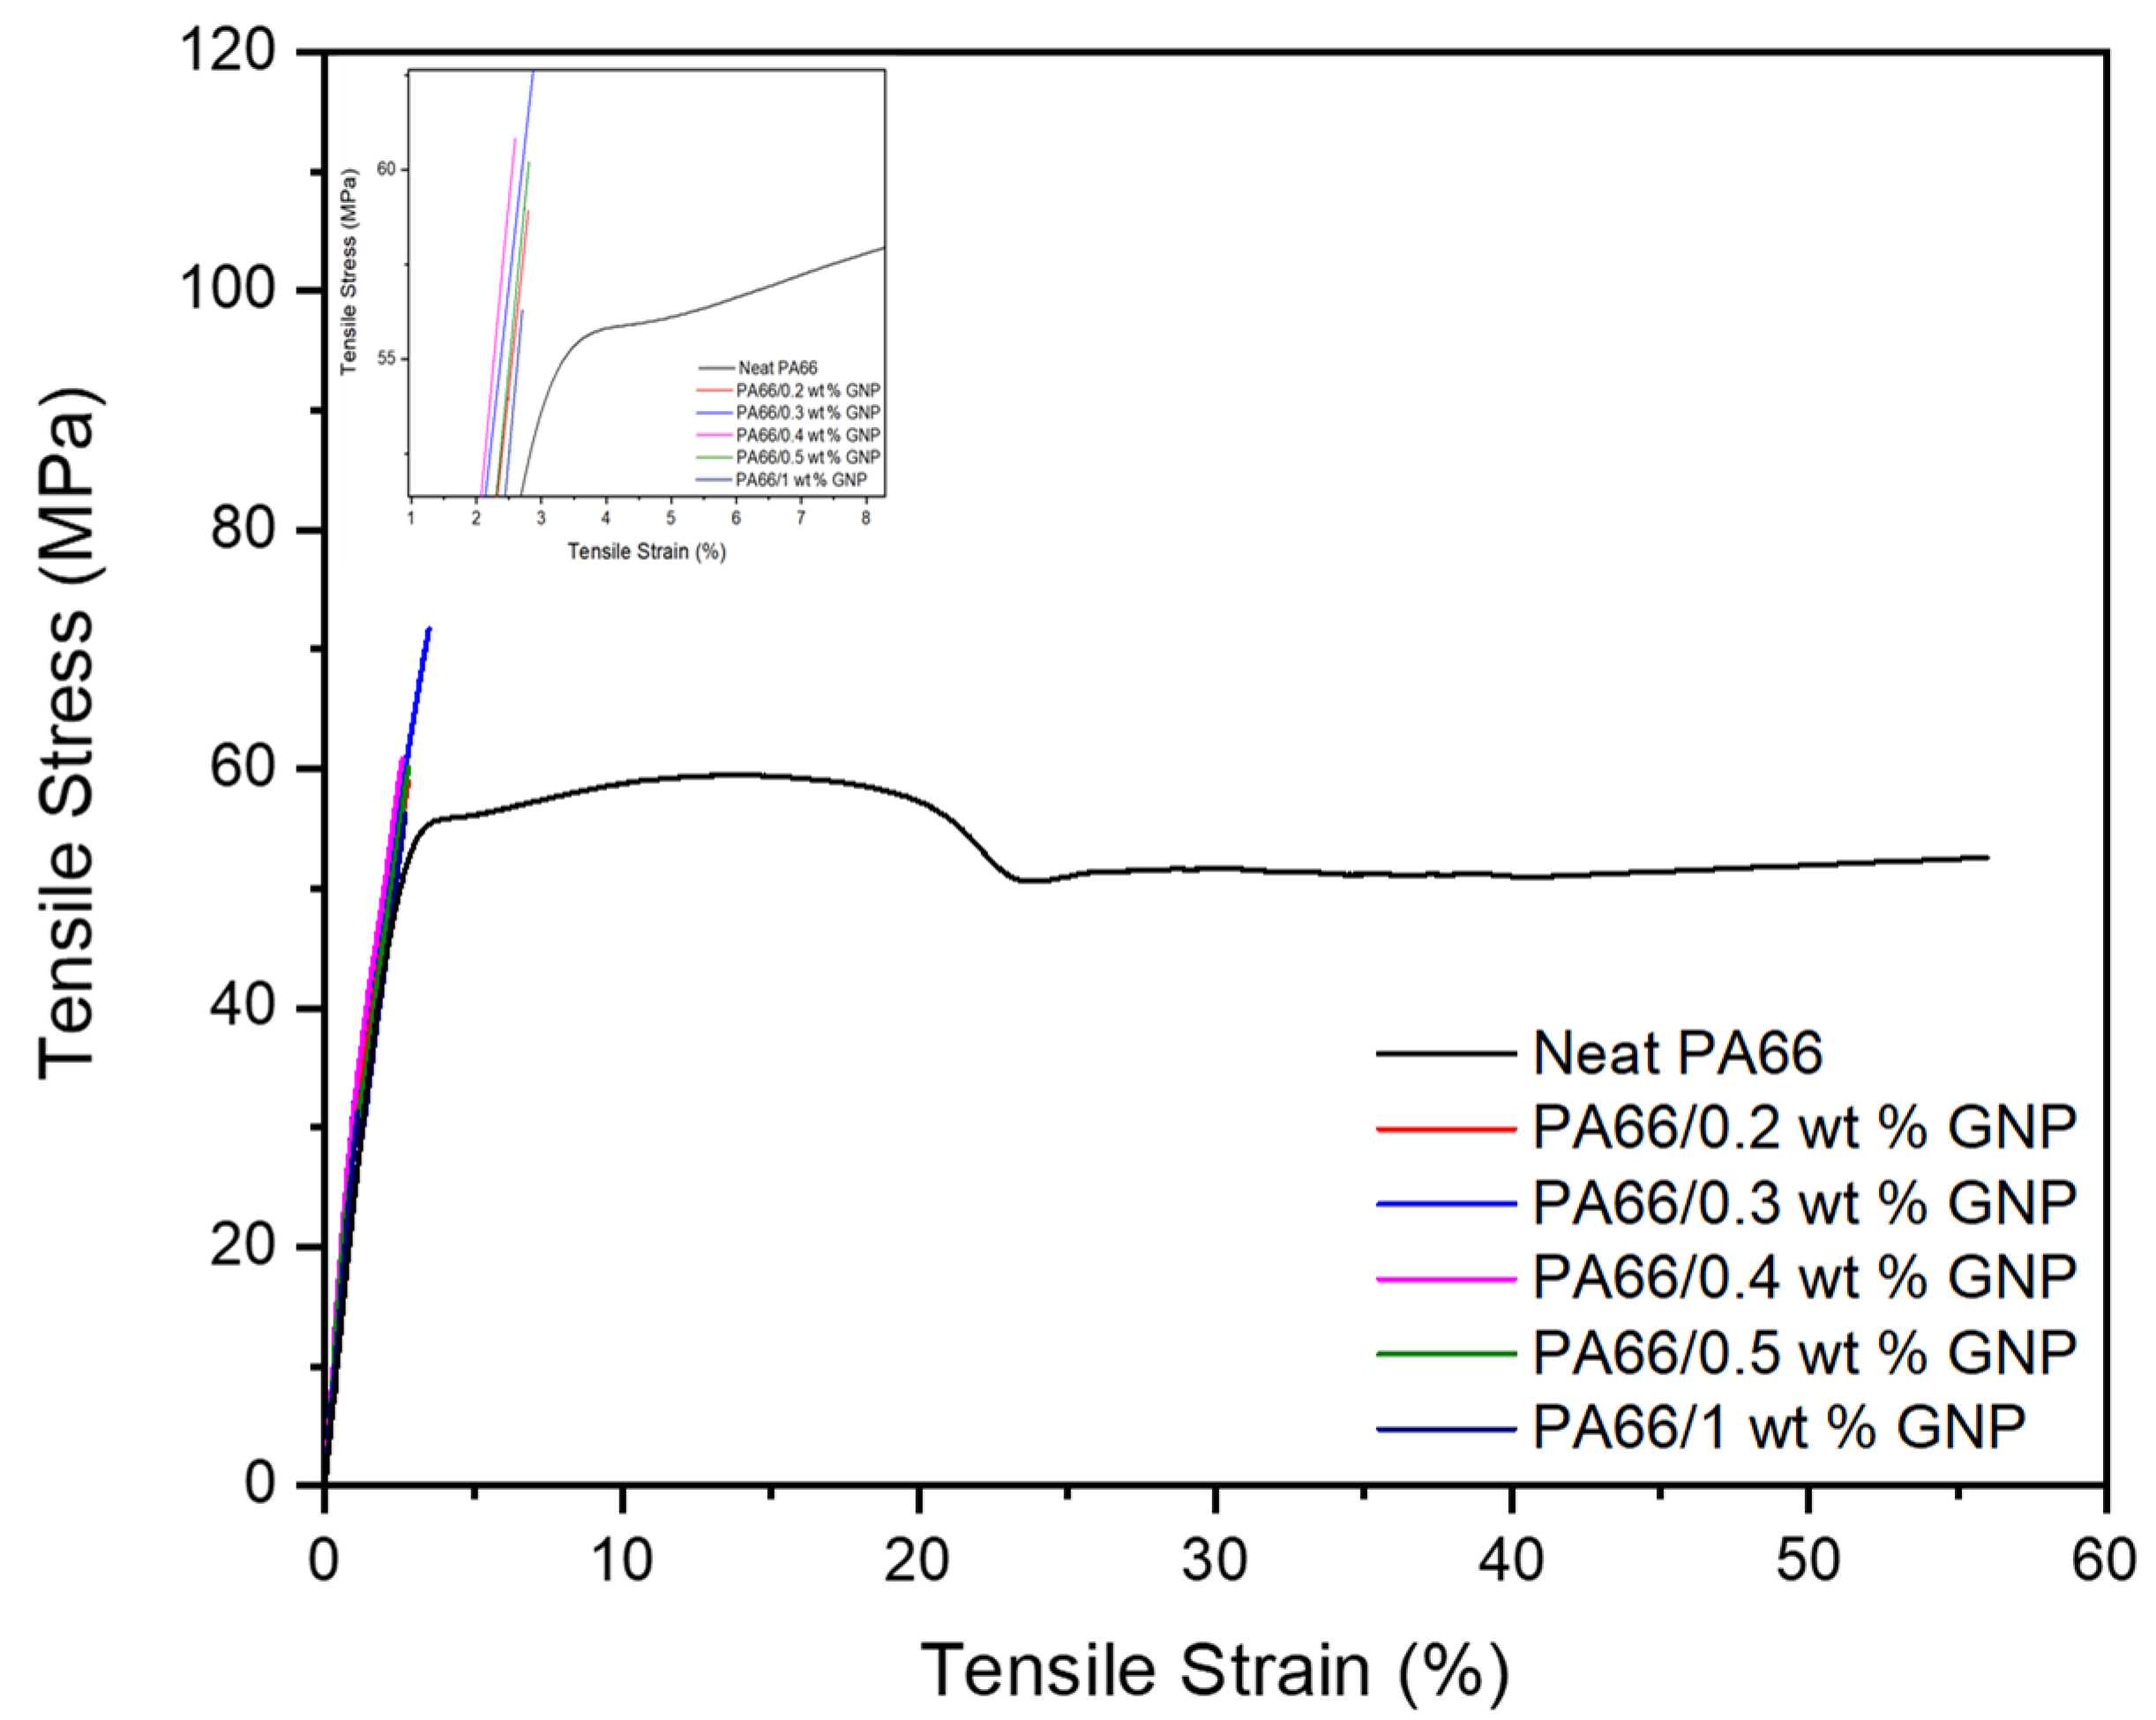
| Sample | Tensile Strength (MPa) | Improvement (%) | Tensile Modulus (MPa) | Improvement (%) | Tensile Strain at Break (%) |
|---|---|---|---|---|---|
| Neat PA66 | 54.9 ± 6 | - | 2334 ± 154 | - | 16.8 ± 21 |
| PA66/0.2 wt% GNP | 56.4 ± 10 | 2.7 | 3128 ± 150 | 34.0 | 2.8 ± 1.2 |
| PA66/0.3 wt% GNP | 71.6 ± 1 | 30.4 | 3306 ± 50 | 41.7 | 3.5 ± 0.2 |
| PA66/0.4 wt% GNP | 60.5 ± 1 | 10.2 | 3350 ± 143 | 43.5 | 2.6 ± 0.1 |
| PA66/0.5 wt% GNP | 60.2 ± 4 | 9.7 | 3080 ± 64 | 32.0 | 2.8 ± 0.1 |
| PA66/1.0 wt% GNP | 56.2 ± 12 | 2.4 | 3160 ± 513 | 35.4 | 2.7 ± 0.4 |
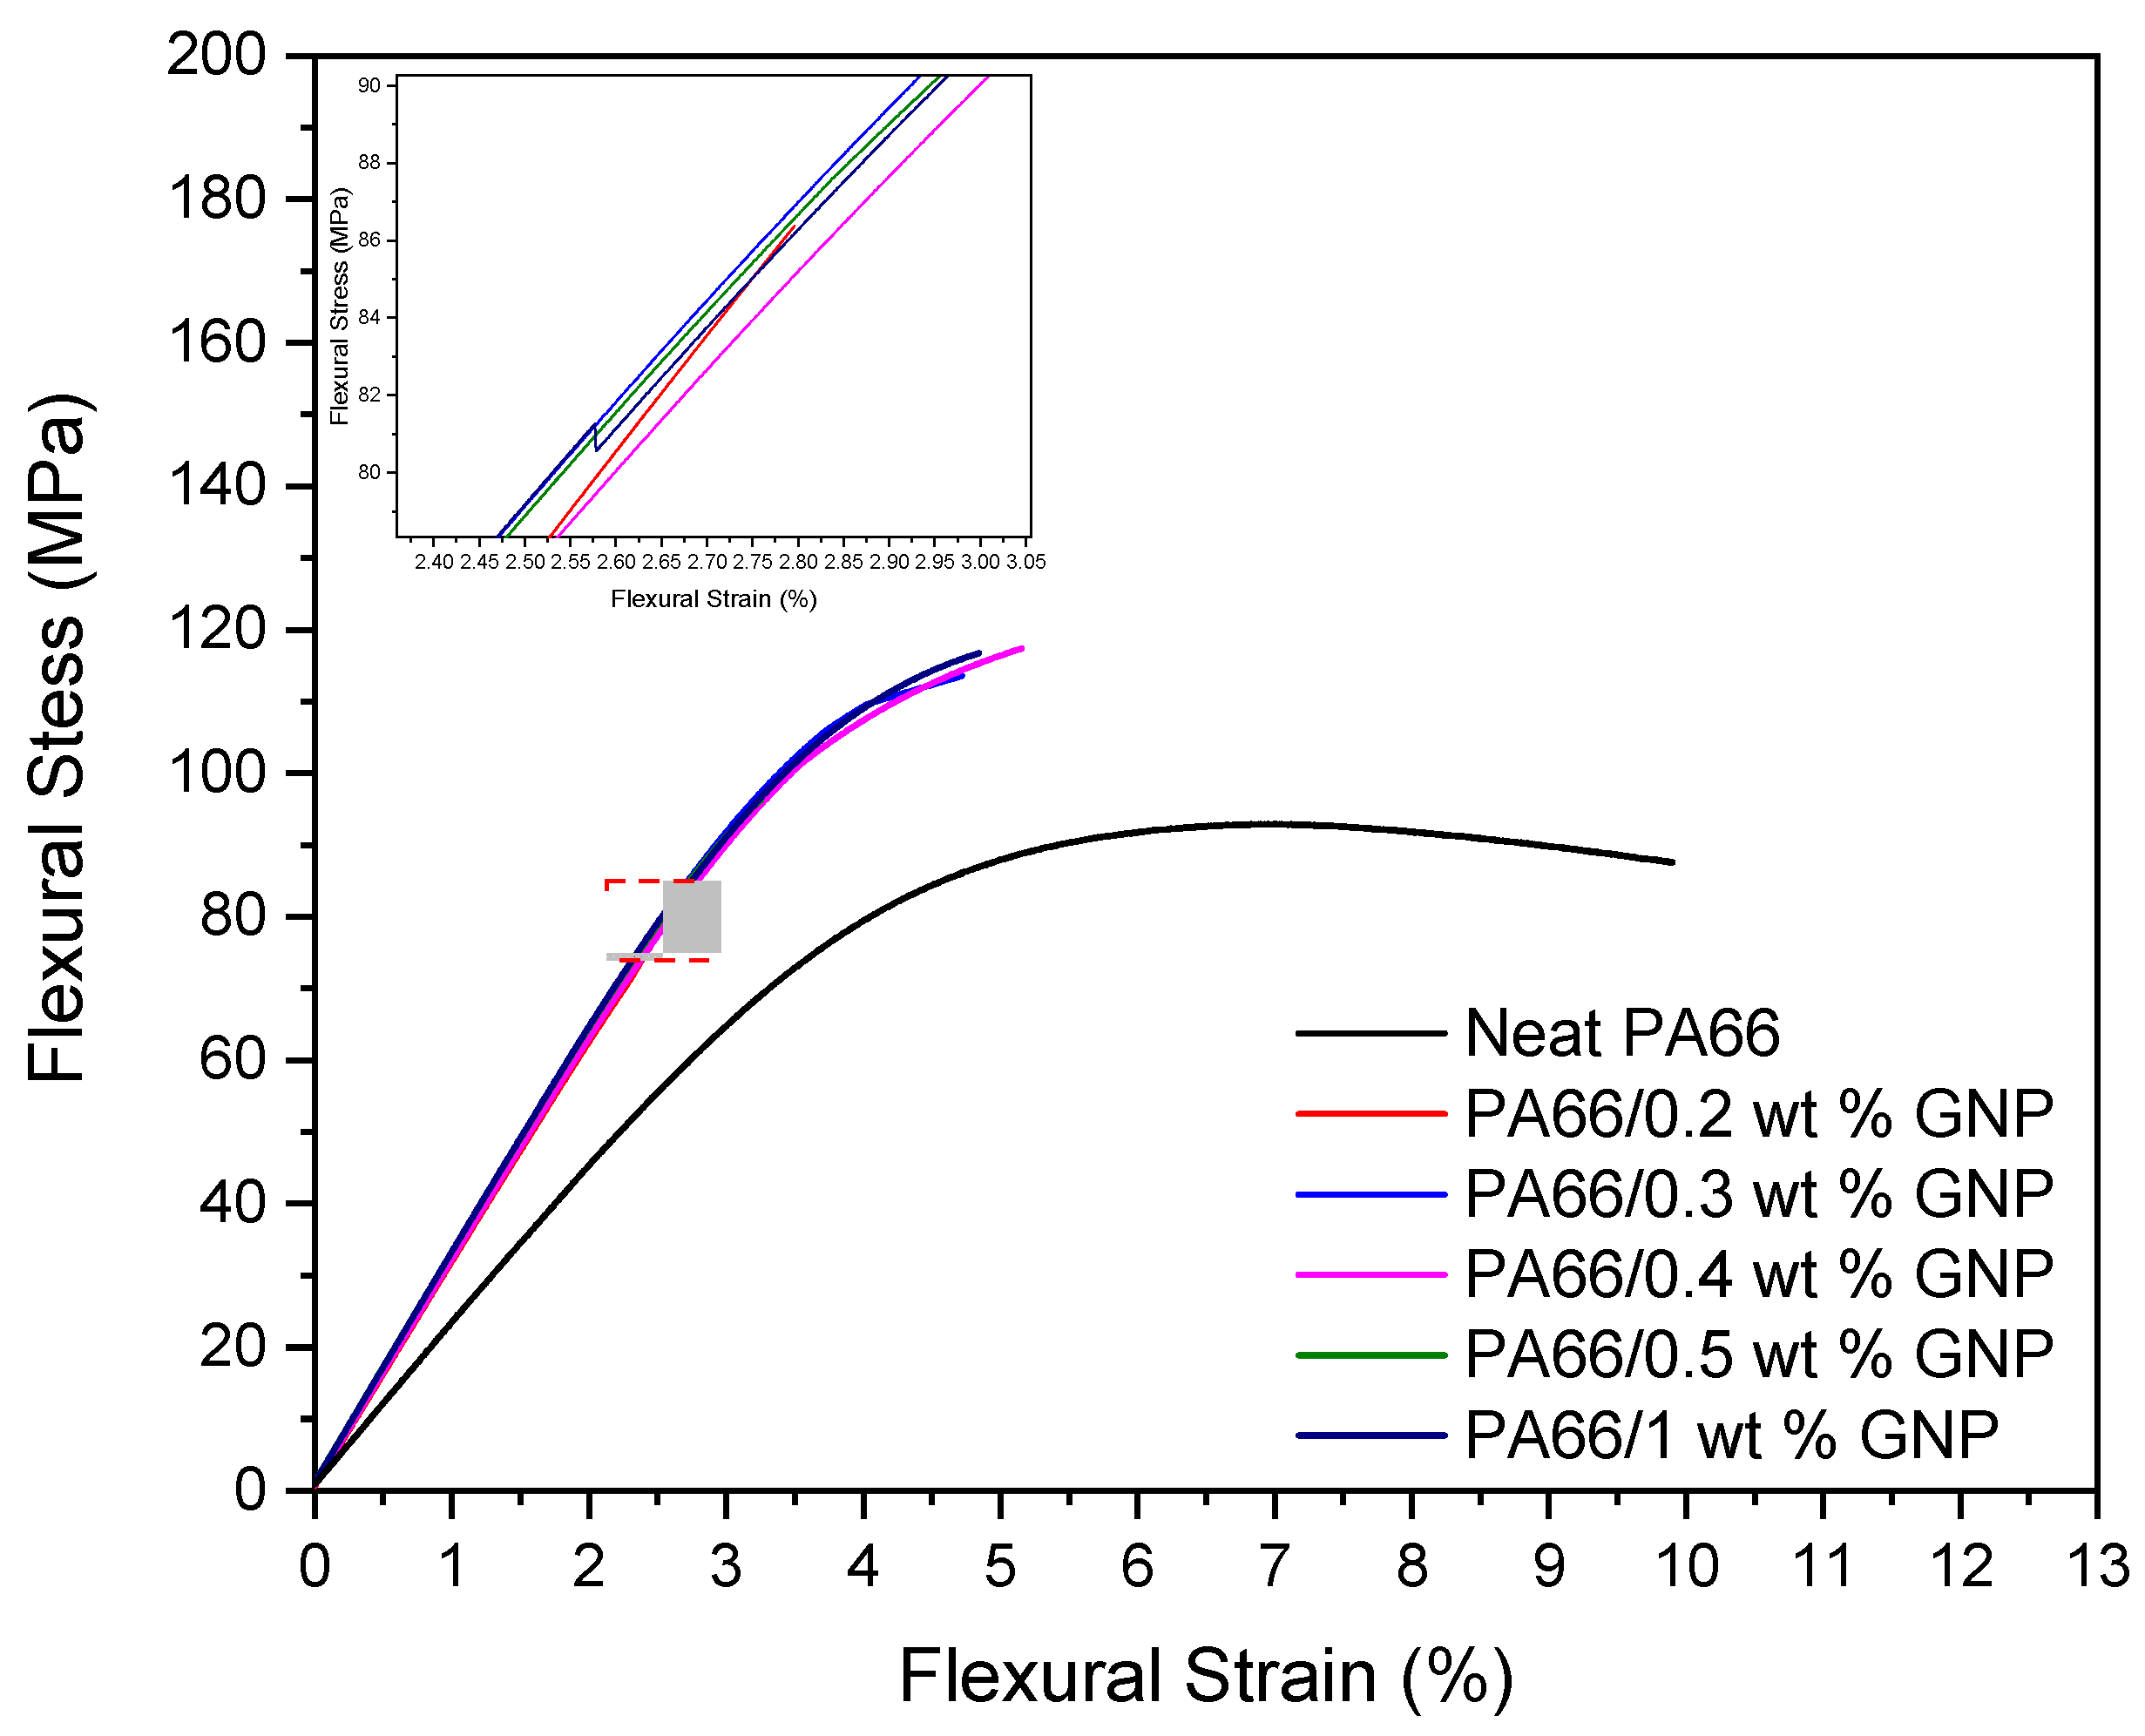
| Sample | Flexural Strength (MPa) | Improvement (%) | Flexural Modulus (MPa) | Improvement (%) | Flexural Strain (%) |
|---|---|---|---|---|---|
| Neat PA66 | 93.1 ± 2 | - | 2250.0 ± 68 | - | 7.05 ± 0.3 |
| PA66/0.2 wt% GNP | 83.8 ± 9 | −9.9 | 3170.0 ± 167 | 40.8 | 2.79 ± 0.4 |
| PA66/0.3 wt% GNP | 113.0 ± 6 | 21.3 | 3210.0 ± 100 | 42.6 | 4.72 ± 1.4 |
| PA66/0.4 wt% GNP | 114.0 ± 10 | 22.4 | 3160.0 ± 40 | 40.4 | 5.15 ± 1.5 |
| PA66/0.5 wt% GNP | 96.30 ± 7 | 3.4 | 3220.0 ± 41 | 43.1 | 3.25 ± 0.4 |
| PA66/1.0 wt% GNP | 108.0 ± 21 | 16.0 | 3230.0 ± 54 | 43.5 | 4.84 ± 2.0 |
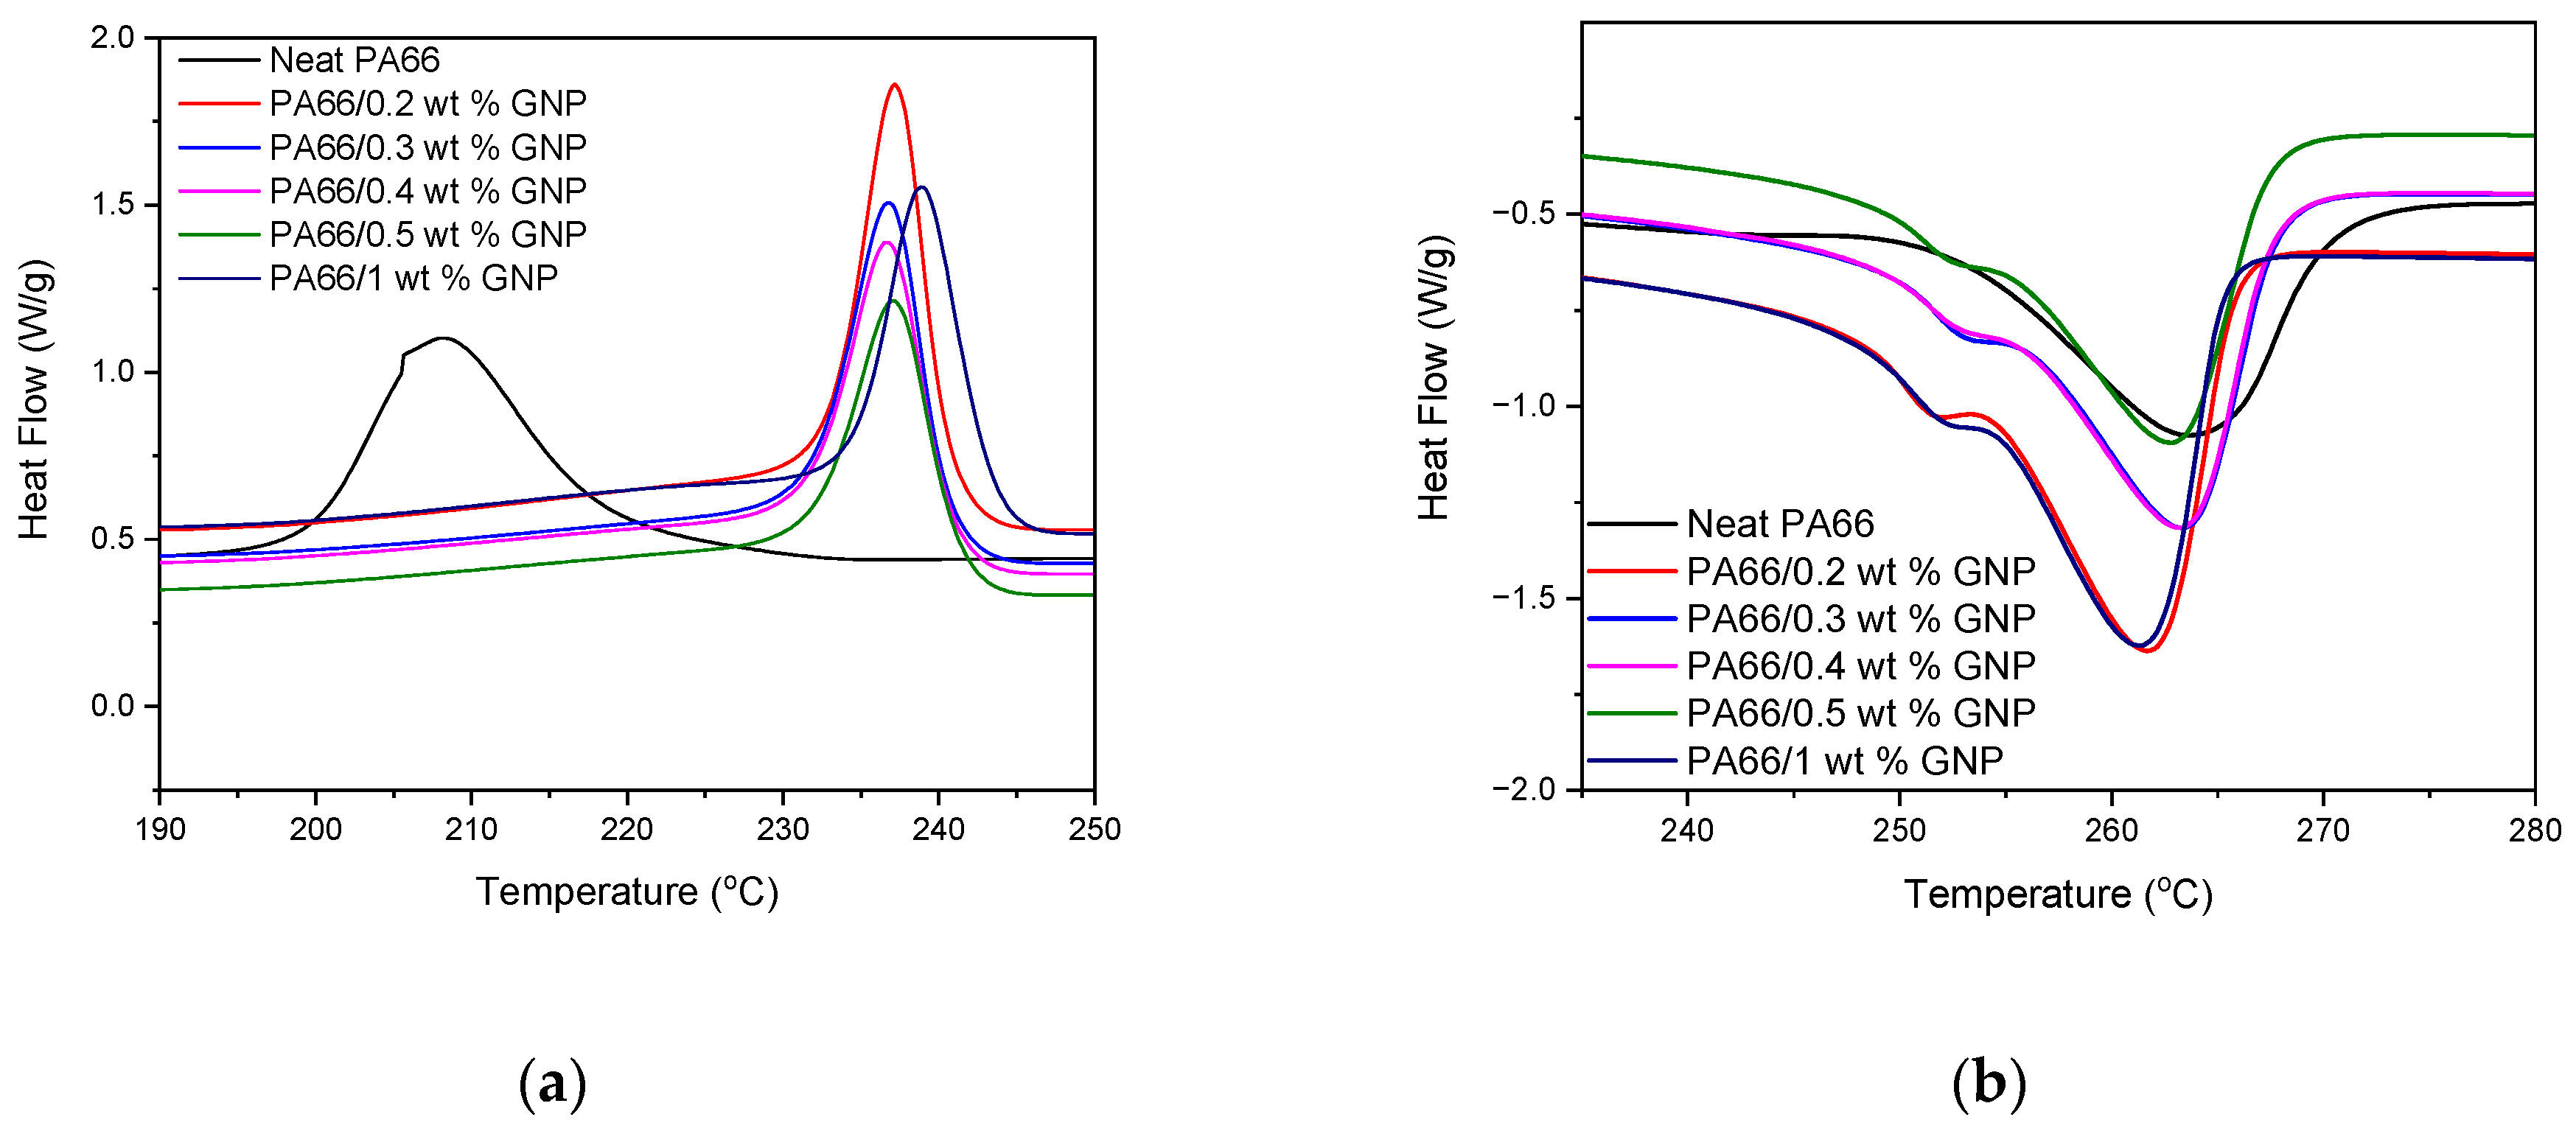
| Sample | Melting Onset Temperature (°C) | Melting Peak Temperature (°C) | Melting Integral, ΔHm (J/g) | Crystallization Onset Temperature (°C) | Crystallization Peak Temperature (°C) | Crystallization Integral, ΔHc (J/g) |
|---|---|---|---|---|---|---|
| Neat PA66 | 250 | 262 | −64.18 | 219 | 209 | 56.56 |
| PA66 + 0.2 wt% GNP | 250 | 260 | −83.17 | 241 | 238 | 63.33 |
| PA66 + 0.3 wt% GNP | 251 | 262 | −75.25 | 241 | 237 | 57.15 |
| PA66 + 0.4 wt% GNP | 250 | 262 | −74.62 | 241 | 237 | 56.56 |
| PA66 + 0.5 wt% GNP | 250 | 262 | −68.66 | 241 | 237 | 51.57 |
| PA66 + 1.0 wt% GNP | 250 | 260 | −78.21 | 243 | 239 | 59.09 |
| Sample | Crystallinity (%) | Amorphous (%) |
|---|---|---|
| Neat PA66 | 34.06 | 65.94 |
| PA66 + 0.2 wt% GNP | 44.14 | 55.86 |
| PA66 + 0.3 wt% GNP | 39.94 | 60.06 |
| PA66 + 0.4 wt% GNP | 39.60 | 60.40 |
| PA66 + 0.5 wt% GNP | 36.44 | 63.56 |
| PA66 + 1.0 wt% GNP | 41.51 | 58.49 |
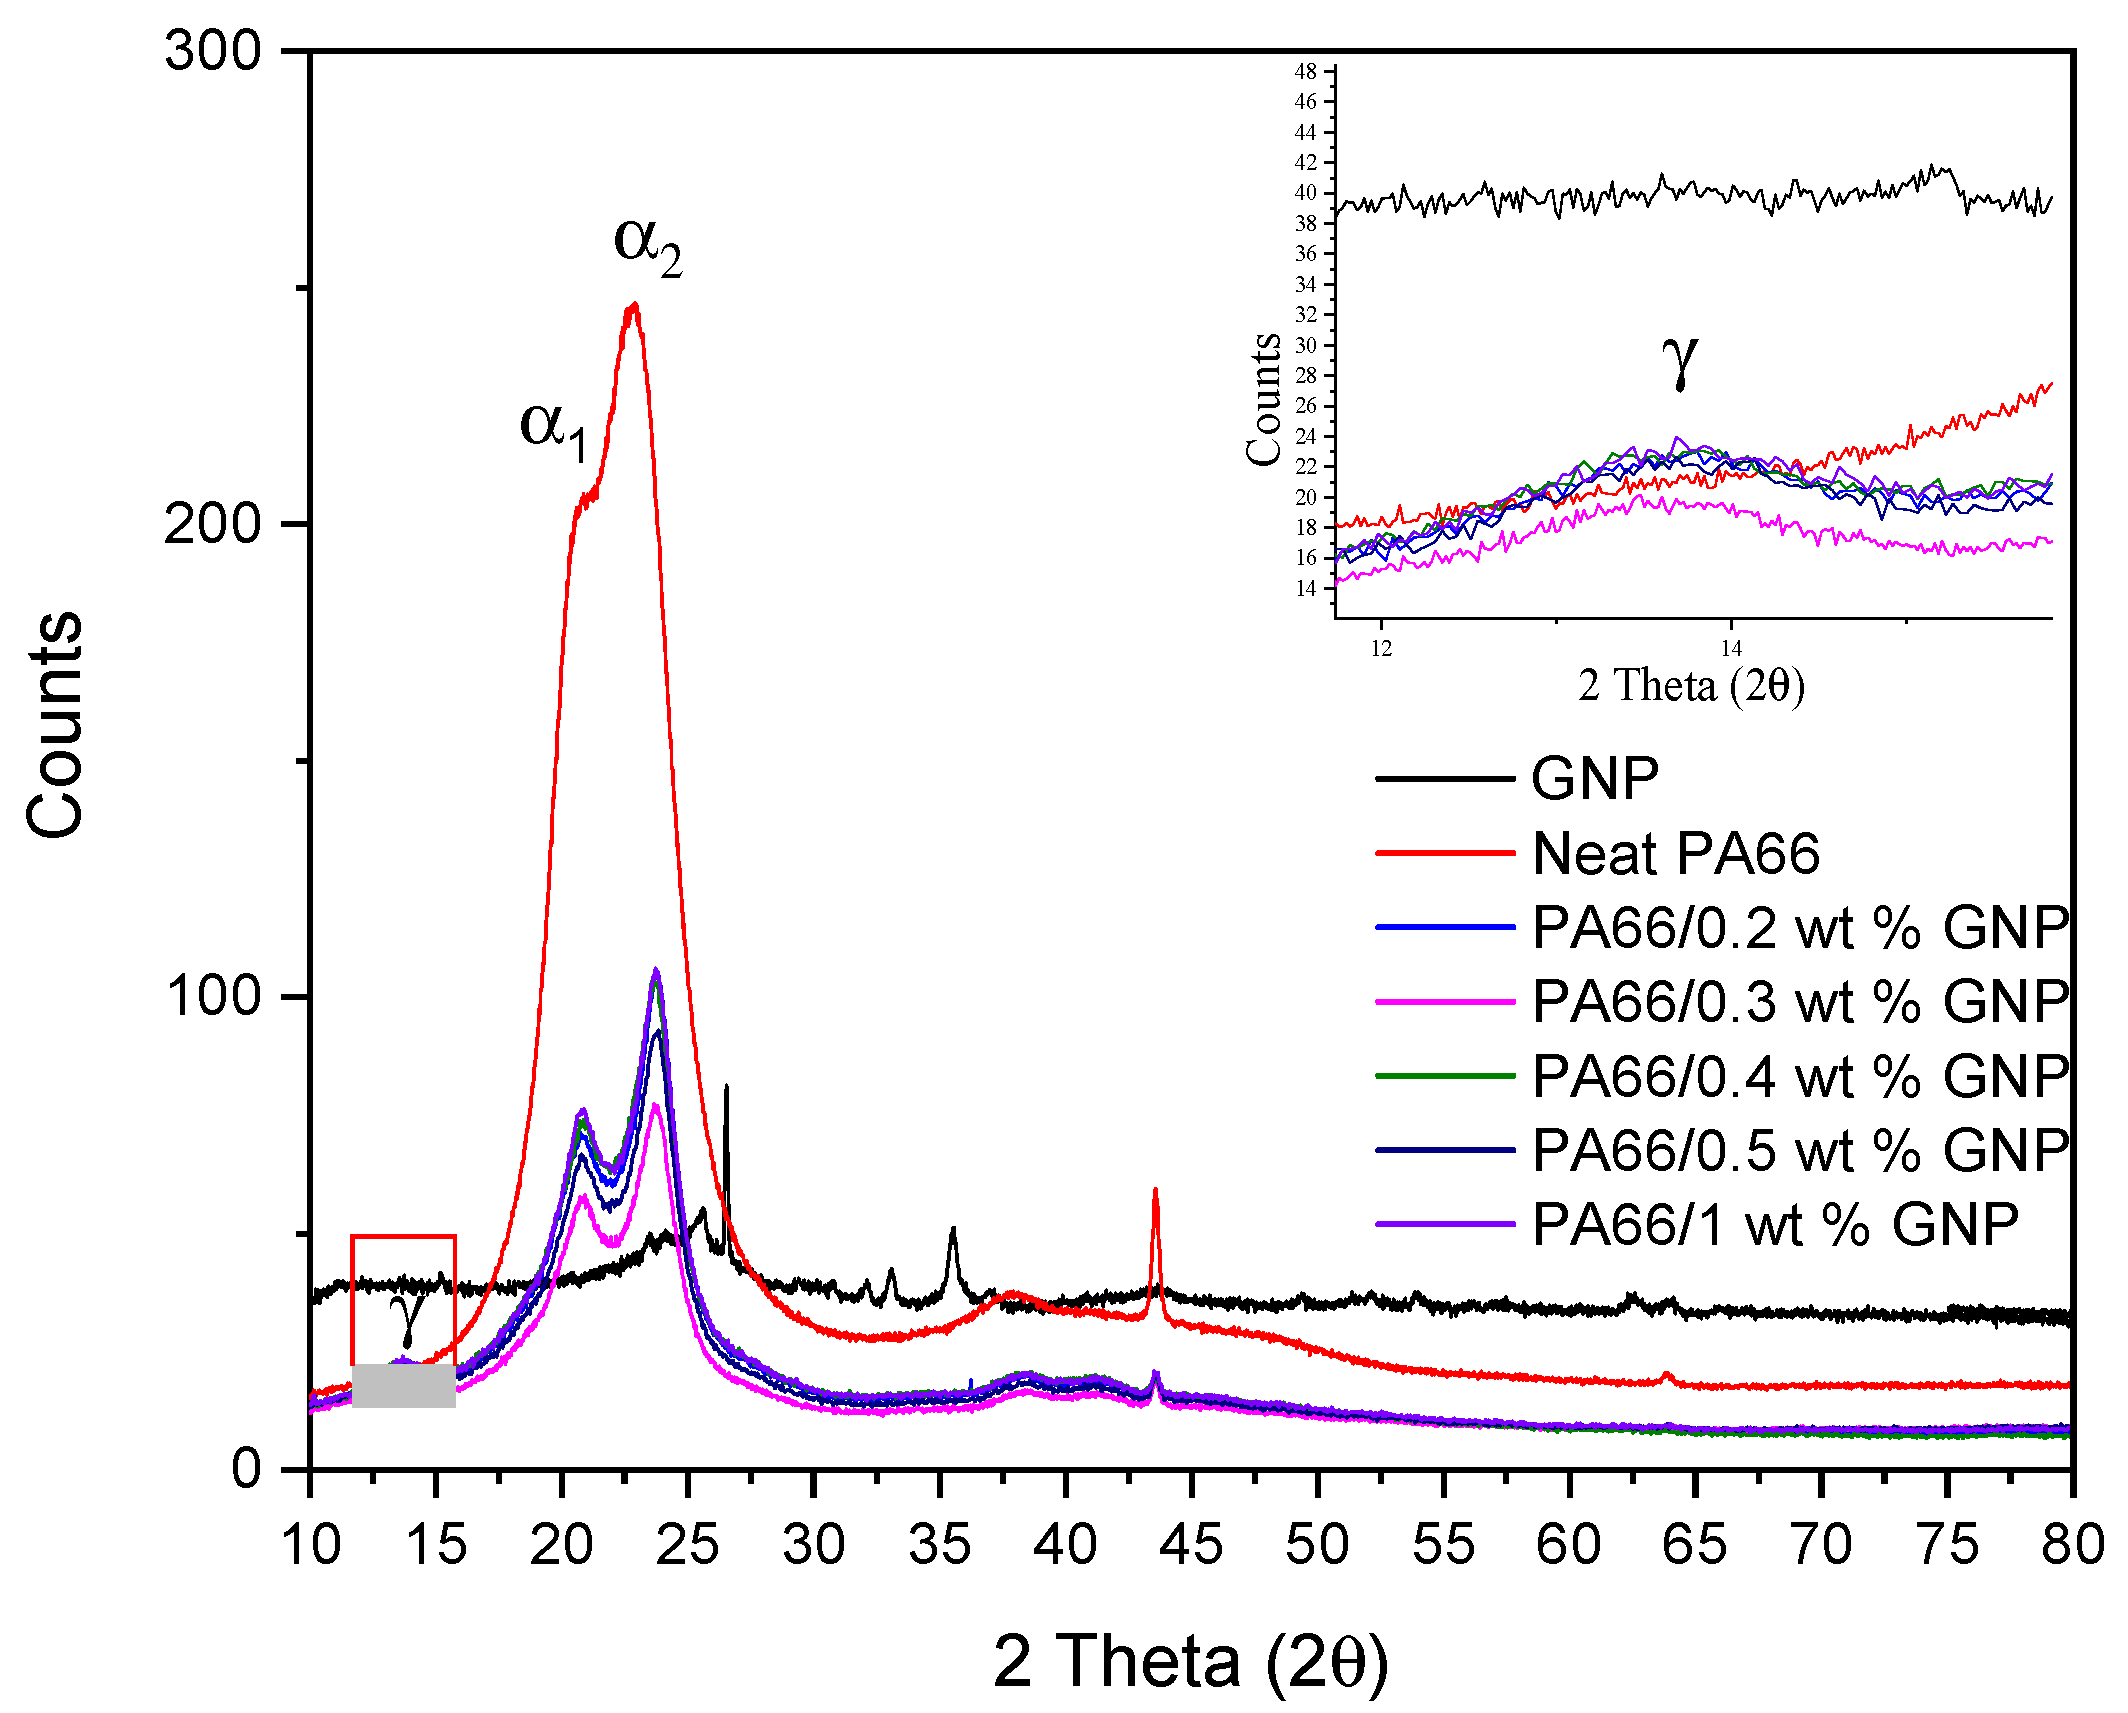
| Sample | α1 Position | α2 Position | α1 / α2 Ratio |
|---|---|---|---|
| Neat PA66 | 20.86 | 22.93 | 0.90 |
| PA66 + 0.2 wt% GNP | 20.72 | 23.84 | 0.86 |
| PA66 + 0.3 wt% GNP | 20.90 | 23.66 | 0.88 |
| PA66 + 0.4 wt% GNP | 20.84 | 23.56 | 0.88 |
| PA66 + 0.5 wt% GNP | 20.76 | 23.84 | 0.86 |
| PA66 + 1.0 wt% GNP | 20.88 | 23.72 | 0.88 |
| Sample | Crystallinity (%) | Amorphous (%) |
|---|---|---|
| Neat PA66 | 51.0 | 49.0 |
| PA66 + 0.2 wt% GNP | 35.4 | 64.6 |
| PA66 + 0.3 wt% GNP | 34.8 | 65.2 |
| PA66 + 0.4 wt% GNP | 35.0 | 65.0 |
| PA66 + 0.5 wt% GNP | 35.9 | 64.1 |
| PA66 + 1.0 wt% GNP | 35.9 | 64.1 |
Publisher’s Note: MDPI stays neutral with regard to jurisdictional claims in published maps and institutional affiliations. |
© 2021 by the authors. Licensee MDPI, Basel, Switzerland. This article is an open access article distributed under the terms and conditions of the Creative Commons Attribution (CC BY) license (http://creativecommons.org/licenses/by/4.0/).
Share and Cite
Dericiler, K.; Sadeghi, H.M.; Yagci, Y.E.; Sas, H.S.; Saner Okan, B. Experimental and Numerical Investigation of Flow and Alignment Behavior of Waste Tire-Derived Graphene Nanoplatelets in PA66 Matrix during Melt-Mixing and Injection. Polymers 2021, 13, 949. https://doi.org/10.3390/polym13060949
Dericiler K, Sadeghi HM, Yagci YE, Sas HS, Saner Okan B. Experimental and Numerical Investigation of Flow and Alignment Behavior of Waste Tire-Derived Graphene Nanoplatelets in PA66 Matrix during Melt-Mixing and Injection. Polymers. 2021; 13(6):949. https://doi.org/10.3390/polym13060949
Chicago/Turabian StyleDericiler, Kuray, Hadi Mohammadjafari Sadeghi, Yavuz Emre Yagci, Hatice S. Sas, and Burcu Saner Okan. 2021. "Experimental and Numerical Investigation of Flow and Alignment Behavior of Waste Tire-Derived Graphene Nanoplatelets in PA66 Matrix during Melt-Mixing and Injection" Polymers 13, no. 6: 949. https://doi.org/10.3390/polym13060949