
Revealing Nanodomain Structures of Bottom-Up-Fabricated Graphene-Embedded Silicon Oxycarbide Ceramics


Abstract
:1. Introduction
2. Materials and Methods
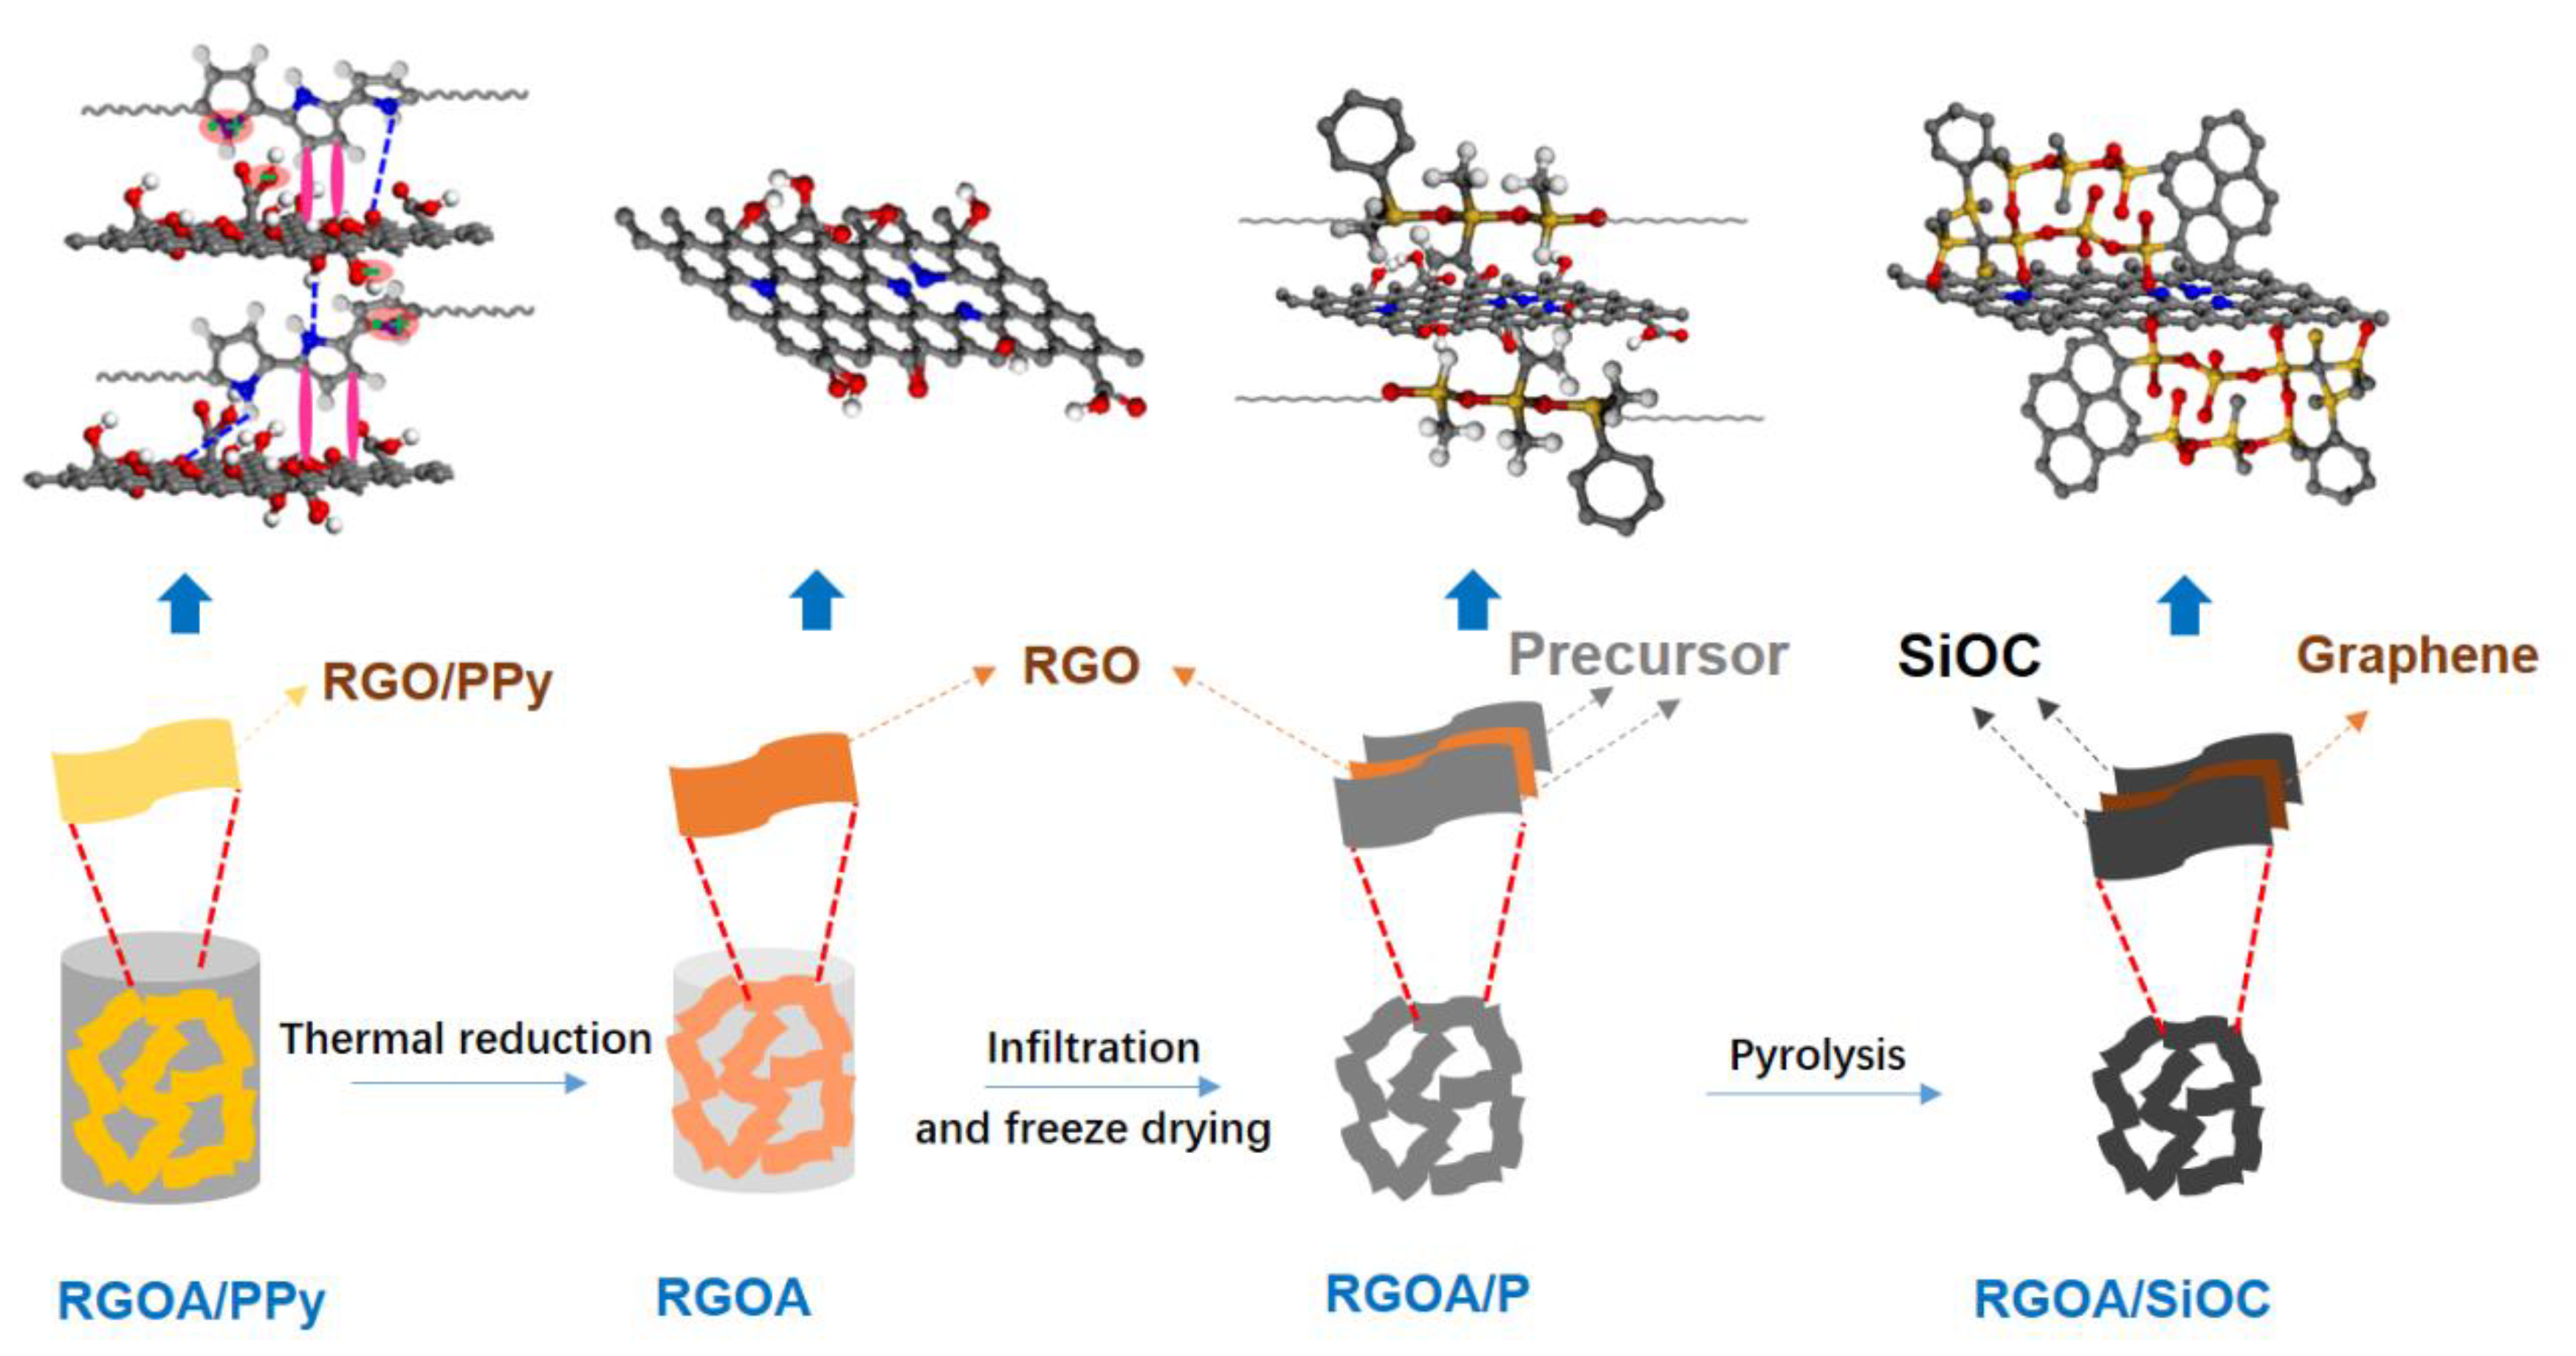
2.1. Preparation of 3D Porous Reduced Graphene Oxide Aerogel Skeleton
2.2. Preparation of Reduced Graphene Oxide Embedded Silicon Oxycarbide Nanocomposites
2.3. Characterization
3. Results and Discussion
4. Conclusions
Author Contributions
Funding
Institutional Review Board Statement
Informed Consent Statement
Data Availability Statement
Acknowledgments
Conflicts of Interest
References
- Luo, C.; Jiao, T.; Gu, J.; Tang, Y.; Kong, J. Graphene Shield by SiBCN Ceramic: A Promising High-Temperature Electromagnetic Wave-Absorbing Material with Oxidation Resistance. ACS Appl. Mater. Interfaces 2018, 10, 39307–39318. [Google Scholar] [CrossRef] [PubMed]
- Román-Manso, B.; Moyano, J.J.; Pérez-Coll, D.; Belmonte, M.; Miranzo, P.; Osendi, M.I. Polymer-derived ceramic/graphene oxide architected composite with high electrical conductivity and enhanced thermal resistance. J. Eur. Ceram. Soc. 2018, 38, 2265–2271. [Google Scholar] [CrossRef]
- David, L.; Bhandavat, R.; Barrera, U.; Singh, G. Silicon oxycarbide glass-graphene composite paper electrode for long-cycle lithium-ion batteries. Nat. Commun. 2016, 7, 10998. [Google Scholar] [CrossRef]
- Picot, O.T.; Rocha, V.G.; Ferraro, C.; Ni, N.; D’Elia, E.; Meille, S.; Chevalier, J.; Saunders, T.; Peijs, T.; Reece, M.J.; et al. Using graphene networks to build bioinspired self-monitoring ceramics. Nat. Commun. 2017, 8, 14425. [Google Scholar] [CrossRef] [PubMed]
- Shen, C.; Barrios, E.; Zhai, L. Bulk Polymer-Derived Ceramic Composites of Graphene Oxide. ACS Omega 2018, 3, 4006–4016. [Google Scholar] [CrossRef]
- Yu, M.; Picot, O.T.; Saunders, T.G.; Dlouhý, I.; Feng, J.; Titirici, M.-M.; Mahajan, A.; Reece, M.J. Graphene-reinforced silicon oxycarbide composites prepared by phase transfer. Carbon 2018, 139, 813–823. [Google Scholar] [CrossRef]
- Sang, Z.; Yan, X.; Wen, L.; Su, D.; Zhao, Z.; Liu, Y.; Ji, H.; Liang, J.; Dou, S.X. A graphene-modified flexible SiOC ceramic cloth for high-performance lithium storage. Energy Storage Mater. 2020, 25, 876–884. [Google Scholar] [CrossRef]
- Sujith, R.; Chauhan, P.K.; Gangadhar, J.; Maheshwari, A. Graphene nanoplatelets as nanofillers in mesoporous silicon oxycarbide polymer derived ceramics. Sci. Rep. 2018, 8, 17633. [Google Scholar] [CrossRef] [PubMed]
- Sang, Z.; Zhao, Z.; Su, D.; Miao, P.; Zhang, F.; Ji, H.; Yan, X. SiOC nanolayer wrapped 3D interconnected graphene sponge as a high-performance anode for lithium ion batteries. J. Mater. Chem. A 2018, 6, 9064–9073. [Google Scholar] [CrossRef]
- Han, M.; Yin, X.; Duan, W.; Ren, S.; Zhang, L.; Cheng, L. Hierarchical graphene/SiC nanowire networks in polymer-derived ceramics with enhanced electromagnetic wave absorbing capability. J. Eur. Ceram. Soc. 2016, 36, 2695–2703. [Google Scholar] [CrossRef]
- Liu, X.; Yu, Z.; Ishikawa, R.; Chen, L.; Liu, X.; Yin, X.; Ikuhara, Y.; Riedel, R. Single-source-precursor derived RGO/CNTs-SiCN ceramic nanocomposite with ultra-high electromagnetic shielding effectiveness. Acta Mater. 2017, 130, 83–93. [Google Scholar] [CrossRef]
- Shen, C.; Calderon, J.E.; Barrios, E.; Soliman, M.; Khater, A.; Jeyaranjan, A.; Tetard, L.; Gordon, A.; Seal, S.; Zhai, L. Anisotropic electrical conductivity in polymer derived ceramics induced by graphene aerogels. J. Mater. Chem. C 2017, 5, 11708–11716. [Google Scholar] [CrossRef]
- Yu, Y.; Xia, F.; Huang, Q.; Fang, J.; An, L. Electrical conductivity of silicon carbonitride-reduced graphene oxide composites. J. Am. Ceram. Soc. 2017, 100, 5113–5119. [Google Scholar] [CrossRef]
- Wei, Y.; Yongsheng, L.; Mingxi, Z.; Fang, Y.; Laifei, C. Effect of heat treatment temperature on microstructure and electromagnetic shielding properties of graphene/SiBCN composites. J. Mater. Sci. Technol. 2019, 35, 2897–2905. [Google Scholar] [CrossRef]
- Oh, H.; Kim, Y.; Wie, J.; Kim, K.; Kim, J. Tailoring of Si–C–N–O ceramic-coated reduced graphene oxide by oil/water-solution process for high thermal conductive epoxy composite with electrical insulation. Compos. Sci. Technol. 2020, 197, 108257. [Google Scholar] [CrossRef]
- Yu, Y.; Huang, Q.; Rhodes, S.; Fang, J.; An, L. SiCNO–GO composites with the negative temperature coefficient of resistance for high-temperature sensor applications. J. Am. Ceram. Soc. 2017, 100, 592–601. [Google Scholar] [CrossRef]
- Wang, X.; Mera, G.; Morita, K.; Ionescu, E. Synthesis of polymer-derived graphene/silicon nitride-based nanocomposites with tunable dielectric properties. J. Ceram. Soc. Jpn. 2016, 124, 981–988. [Google Scholar] [CrossRef]
- Cheng, Y.; Hu, P.; Zhou, S.; Zhang, X.; Han, W. Using macroporous graphene networks to toughen ZrC–SiC ceramic. J. Eur. Ceram. Soc. 2018, 38, 3752–3758. [Google Scholar] [CrossRef]
- Shao, G.; Hanaor, D.A.H.; Wang, J.; Kober, D.; Li, S.; Wang, X.; Shen, X.; Bekheet, M.F.; Gurlo, A. Polymer-Derived SiOC Integrated with a Graphene Aerogel As a Highly Stable Li-Ion Battery Anode. ACS Appl. Mater. Interfaces 2020, 12, 46045–46056. [Google Scholar] [CrossRef]
- Mera, G.; Navrotsky, A.; Sen, S.; Kleebe, H.-J.; Riedel, R. Polymer-derived SiCN and SiOC ceramics—Structure and energetics at the nanoscale. J. Mater. Chem. A 2013, 1, 3826–3836. [Google Scholar] [CrossRef]
- Colombo, P.; Mera, G.; Riedel, R.; Sorarù, G.D. Polymer-Derived Ceramics: 40 Years of Research and Innovation in Advanced Ceramics. J. Am. Ceram. Soc. 2010, 93, 1805–1837. [Google Scholar] [CrossRef]
- Stabler, C.; Ionescu, E.; Graczyk-Zajac, M.; Gonzalo-Juan, I.; Riedel, R. Silicon oxycarbide glasses and glass-ceramics: “All-Rounder” materials for advanced structural and functional applications. J. Am. Ceram. Soc. 2018, 101, 4817–4856. [Google Scholar] [CrossRef]
- Wen, Q.; Yu, Z.; Riedel, R. The fate and role of in situ formed carbon in polymer-derived ceramics. Prog. Mater. Sci. 2020, 109, 100623. [Google Scholar] [CrossRef]
- Shao, G.; Ovsianytskyi, O.; Bekheet, M.F.; Gurlo, A. On-chip assembly of 3D graphene-based aerogels for chemiresistive gas sensing. Chem. Commun. 2020, 56, 450–453. [Google Scholar] [CrossRef] [PubMed]
- Ma, Z.-Y.; Yu, Z.-L.; Xu, Z.-L.; Bu, L.-F.; Liu, H.-R.; Zhu, Y.-B.; Qin, B.; Ma, T.; Zhan, H.-J.; Xu, L.; et al. Origin of Batch Hydrothermal Fluid Behavior and Its Influence on Nanomaterial Synthesis. Matter 2020, 2, 1270–1282. [Google Scholar] [CrossRef]
- Sadezky, A.; Muckenhuber, H.; Grothe, H.; Niessner, R.; Pöschl, U. Raman microspectroscopy of soot and related carbonaceous materials: Spectral analysis and structural information. Carbon 2005, 43, 1731–1742. [Google Scholar] [CrossRef]
- Wilamowska-Zawlocka, M.; Puczkarski, P.; Grabowska, Z.; Kaspar, J.; Graczyk-Zajac, M.; Riedel, R.; Sorarù, G.D. Silicon oxycarbide ceramics as anodes for lithium ion batteries: Influence of carbon content on lithium storage capacity. RSC Adv. 2016, 6, 104597–104607. [Google Scholar] [CrossRef]
- Chandra, C.; Cahyadi, H.S.; Alvin, S.; Devina, W.; Park, J.-H.; Chang, W.; Chung, K.Y.; Kwak, S.K.; Kim, J. Revealing the Sodium Storage Mechanism in High-Temperature-Synthesized Silicon Oxycarbides. Chem. Mater. 2020, 32, 410–423. [Google Scholar] [CrossRef]
- Stankovich, S.; Dikin, D.A.; Piner, R.D.; Kohlhaas, K.A.; Kleinhammes, A.; Jia, Y.; Wu, Y.; Nguyen, S.T.; Ruoff, R.S. Synthesis of graphene-based nanosheets via chemical reduction of exfoliated graphite oxide. Carbon 2007, 45, 1558–1565. [Google Scholar] [CrossRef]
- Roualdes, S.; Berjoan, R.; Durand, J. 29Si NMR and Si2p XPS correlation in polysiloxane membranes prepared by plasma enhanced chemical vapor deposition. Sep. Purif. Technol. 2001, 25, 391–397. [Google Scholar] [CrossRef]
- Widgeon, S.J.; Sen, S.; Mera, G.; Ionescu, E.; Riedel, R.; Navrotsky, A. 29Si and 13C Solid-State NMR Spectroscopic Study of Nanometer-Scale Structure and Mass Fractal Characteristics of Amorphous Polymer Derived Silicon Oxycarbide Ceramics. Chem. Mater. 2010, 22, 6221–6228. [Google Scholar] [CrossRef]
- Nimmo, J.P.; Kroll, P. First-Principles Calculations and Analysis of 29Si Nuclear Magnetic Resonance Chemical Shifts in Silicon Oxycarbide Ceramics. J. Phys. Chem. C 2014, 118, 29952–29961. [Google Scholar] [CrossRef]
- Tavakoli, A.H.; Armentrout, M.M.; Narisawa, M.; Sen, S.; Navrotsky, A. White Si–O–C Ceramic: Structure and Thermodynamic Stability. J. Am. Ceram. Soc. 2015, 98, 242–246. [Google Scholar] [CrossRef]
- Dubey, R.J.C.; Sasikumar, P.V.W.; Cerboni, N.; Aebli, M.; Krumeich, F.; Blugan, G.; Kravchyk, K.V.; Graule, T.; Kovalenko, M.V. Silicon oxycarbide-antimony nanocomposites for high-performance Li-ion battery anodes. Nanoscale 2020, 12, 13540–13547. [Google Scholar] [CrossRef]
- Sen, S.; Widgeon, S.J.; Navrotsky, A.; Mera, G.; Tavakoli, A.; Ionescu, E.; Riedel, R. Carbon substitution for oxygen in silicates in planetary interiors. Proc. Natl. Acad. Sci. USA 2013, 110, 15904–15907. [Google Scholar] [CrossRef]
- Wang, M.; Xia, Y.; Wang, X.; Xiao, Y.; Liu, R.; Wu, Q.; Qiu, B.; Metwalli, E.; Xia, S.; Yao, Y.; et al. Silicon Oxycarbide/Carbon Nanohybrids with Tiny Silicon Oxycarbide Particles Embedded in Free Carbon Matrix Based on Photoactive Dental Methacrylates. ACS Appl. Mater. Interfaces 2016, 8, 13982–13992. [Google Scholar] [CrossRef]
- Wang, J.; Kober, D.; Shao, G.; Epping, J.D.; Görke, O.; Li, S.; Gurlo, A.; Bekheet, M.F. Stable anodes for lithium-ion batteries based on tin-containing silicon oxycarbonitride ceramic nanocomposites. Mater. Today Energy 2022, 26, 100989. [Google Scholar] [CrossRef]
- Wen, Q.; Qu, F.; Yu, Z.; Graczyk-Zajac, M.; Xiong, X.; Riedel, R. Si-based polymer-derived ceramics for energy conversion and storage. J. Adv. Ceram. 2022, 11, 197–246. [Google Scholar] [CrossRef]
- Wang, J.; Gili, A.; Grünbacher, M.; Praetz, S.; Epping, J.D.; Görke, O.; Schuck, G.; Penner, S.; Schlesiger, C.; Schomäcker, R.; et al. Silicon oxycarbonitride ceramic containing nickel nanoparticles: From design to catalytic application. Mater. Adv. 2021, 2, 1715–1730. [Google Scholar] [CrossRef]
- Wang, J.; Grünbacher, M.; Penner, S.; Bekheet, M.F.; Gurlo, A. Porous silicon oxycarbonitride ceramics with palladium nanoparticles for dry reforming of methane. Polymers 2022, 14, 3470. [Google Scholar] [CrossRef]
- Shao, G.; Shen, X.; Huang, X. Multilevel Structural Design and Heterointerface Engineering of a Host–Guest Binary Aerogel toward Multifunctional Broadband Microwave Absorption. ACS Mater. Lett. 2022, 4, 1787–1797. [Google Scholar] [CrossRef]


| D4, cm−1 | D1, cm−1 | D3, cm−1 | G cm−1 | I(D1)/I(G) | La1, nm | La2, nm | |
|---|---|---|---|---|---|---|---|
| SiOC | 1189 | 1321 | 1500 | 1597 | 1.27 | 3.90 | 1.48 |
| RGOA-600 | 1190 | 1348 | 1509 | 1587 | 1.14 | 4.35 | 1.44 |
| RGOA-1000 | 1190 | 1348 | 1509 | 1587 | 1.08 | 4.59 | 1.40 |
| RGOA-600/SiOC | 1191 | 1334 | 1507 | 1597 | 1.07 | 4.63 | 1.36 |
| RGOA-1000/SiOC | 1191 | 1331 | 1509 | 1594 | 1.03 | 4.81 | 1.33 |
| C (a. %) | O (at %) | N (at. %) | Si (at. %) | |
|---|---|---|---|---|
| GO | 65.6 | 34.4 | - | - |
| RGOA-600 | 86.1 | 8.7 | 5.2 | - |
| RGOA-1000 | 93.2 | 3.6 | 3.2 | - |
| RGOA-600/SiOC | 62.5 | 25.0 | 1.8 | 10.7 |
| RGOA-1000/SiOC | 69.0 | 20.6 | 1.8 | 8.6 |
| SiOC | 46.8 | 34.6 | - | 18.6 |
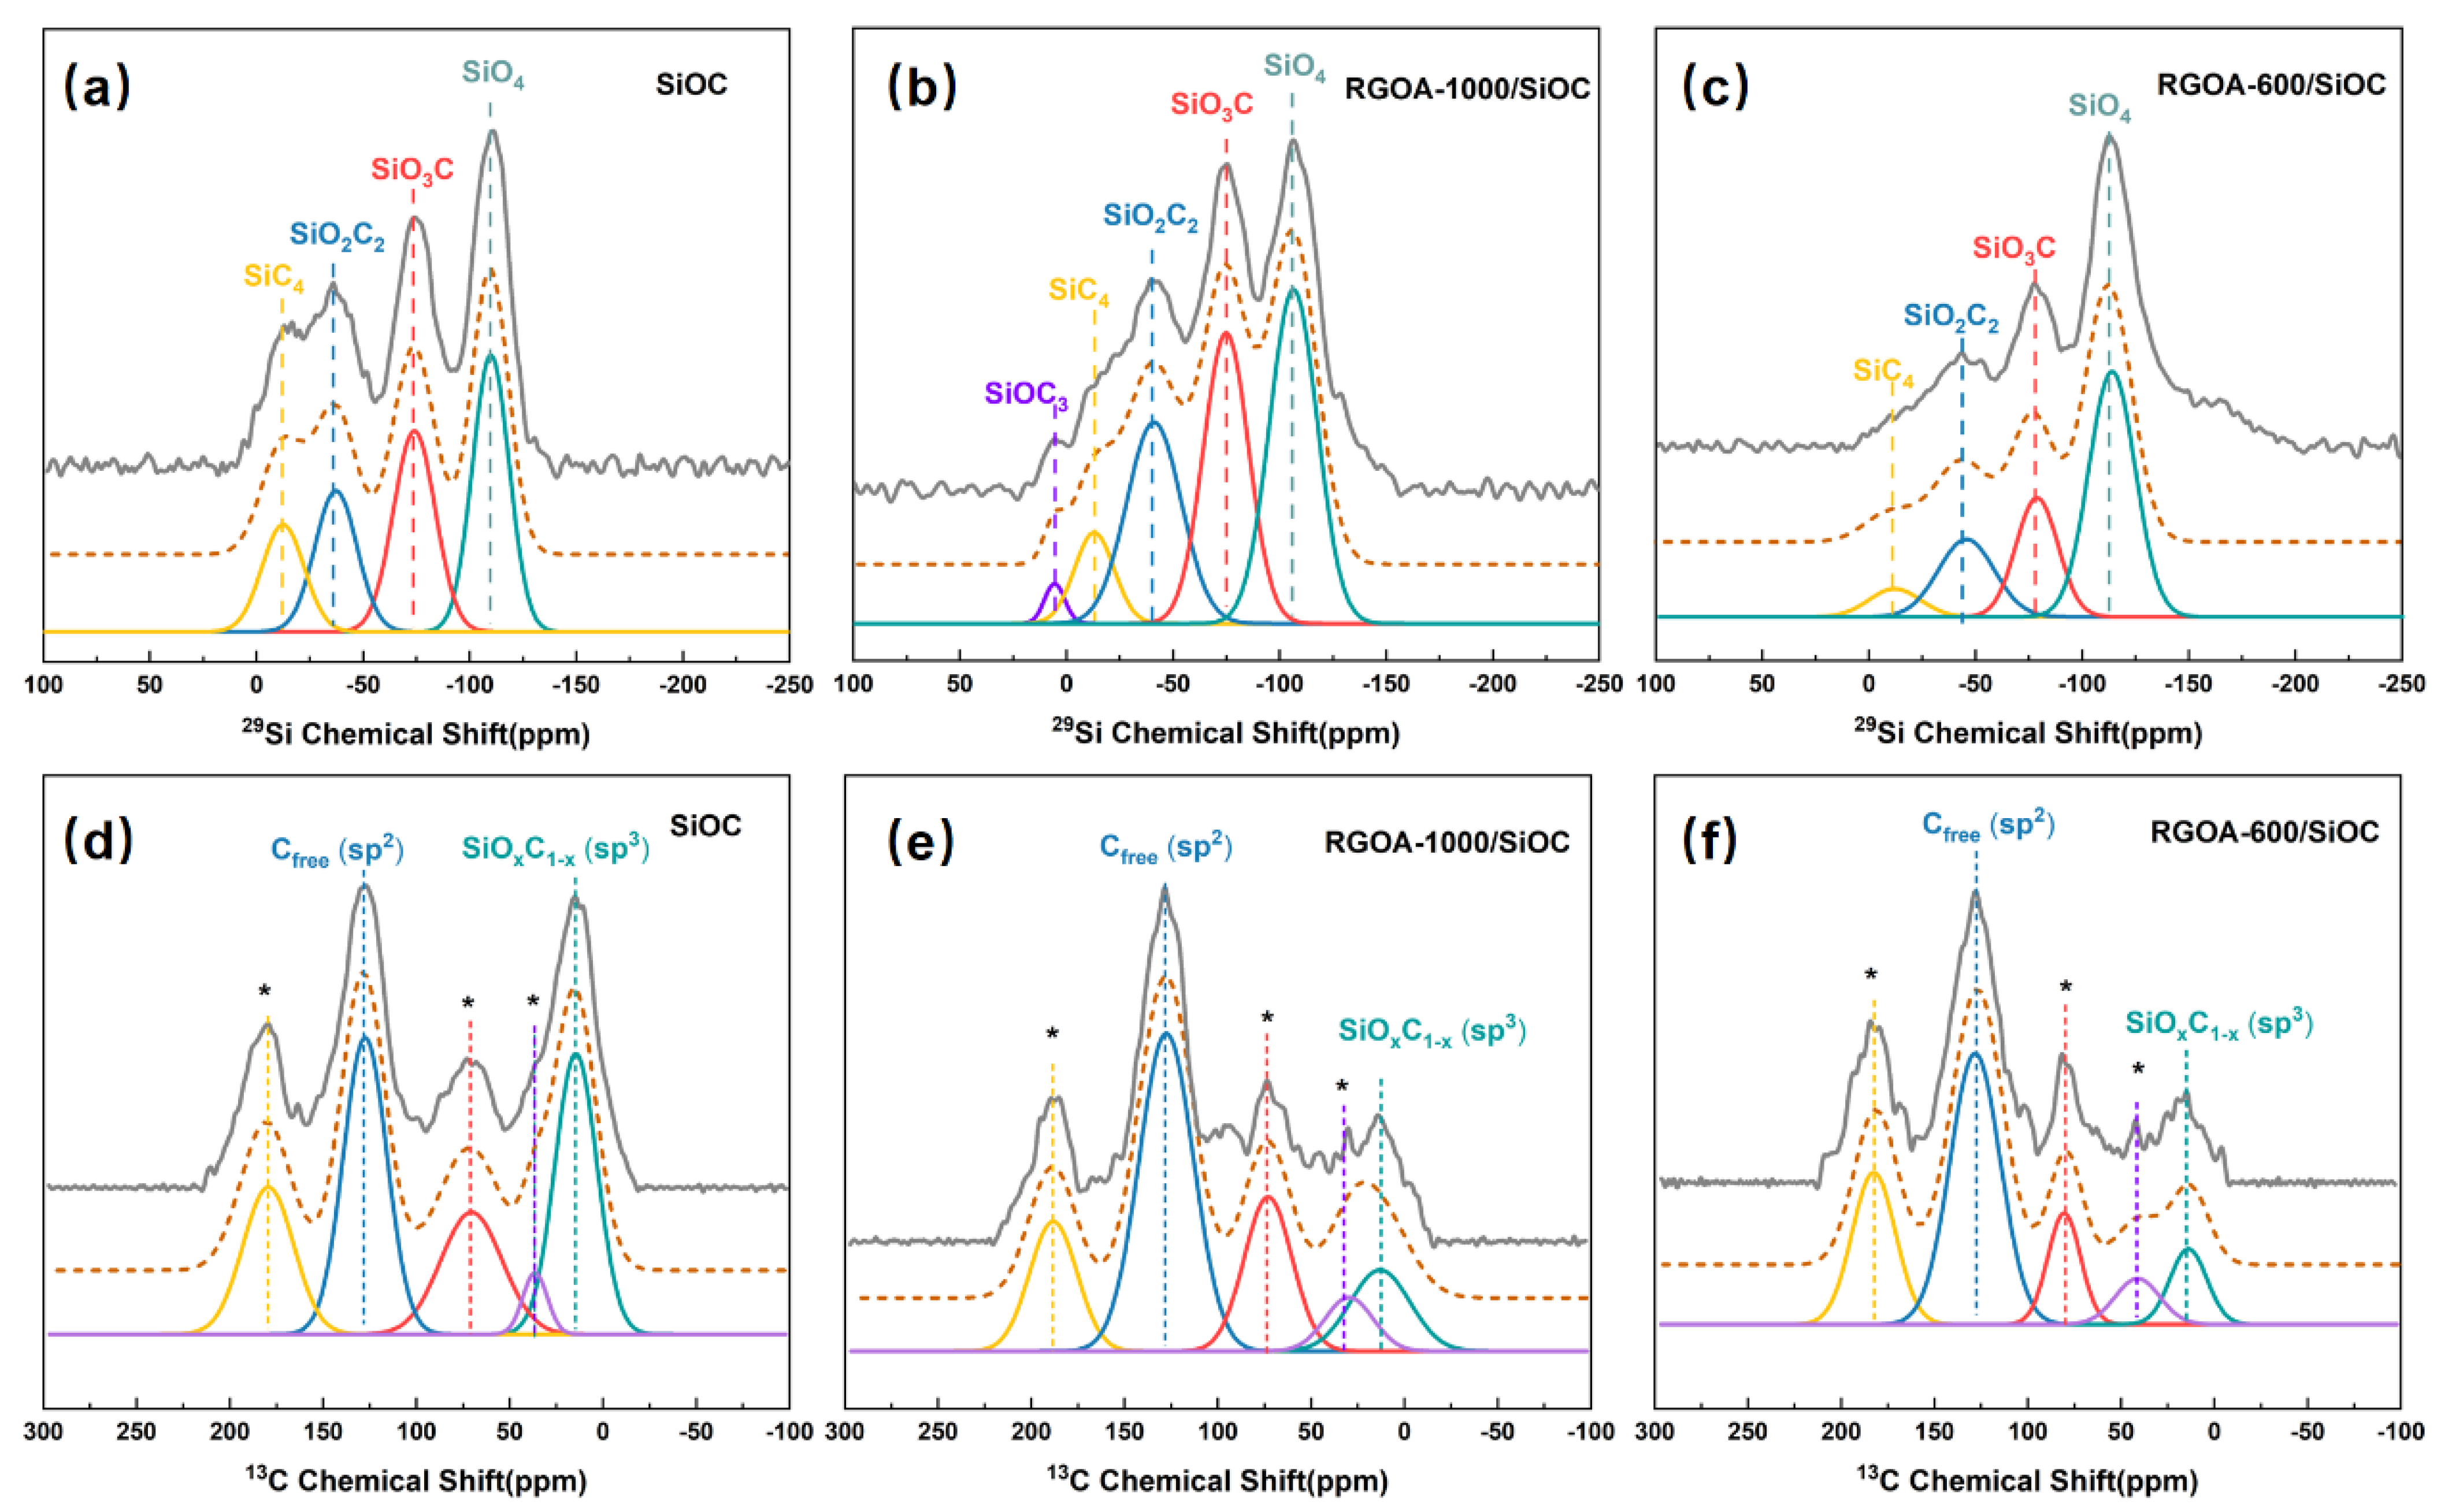
| Samples | SiO4 | SiO3C | SiO2C2 | SiOC3 | SiC4 | |
|---|---|---|---|---|---|---|
| SiOC | Chemical shift (ppm) | −110 | −74 | −37 | - | −12 |
| Fraction (%) of the specific unit | 34.9 | 29.1 | 20.4 | - | 15.6 | |
| RGOA-1000/SiOC | Chemical shift (ppm) | −107 | −75 | −41 | 7 | −13 |
| Fraction (%) of the specific unit | 35.8 | 29.6 | 24.7 | 1.8 | 8.1 | |
| RGOA-600/SiOC | Chemical shift (ppm) | −113 | −78 | −45 | - | −11 |
| Fraction (%) of the specific unit | 57.7 | 19.6 | 17 | - | 5.7 |
Publisher’s Note: MDPI stays neutral with regard to jurisdictional claims in published maps and institutional affiliations. |
© 2022 by the authors. Licensee MDPI, Basel, Switzerland. This article is an open access article distributed under the terms and conditions of the Creative Commons Attribution (CC BY) license (https://creativecommons.org/licenses/by/4.0/).
Share and Cite
Hu, D.; Shao, G.; Wang, J.; Gurlo, A.; Bekheet, M.F. Revealing Nanodomain Structures of Bottom-Up-Fabricated Graphene-Embedded Silicon Oxycarbide Ceramics. Polymers 2022, 14, 3675. https://doi.org/10.3390/polym14173675
Hu D, Shao G, Wang J, Gurlo A, Bekheet MF. Revealing Nanodomain Structures of Bottom-Up-Fabricated Graphene-Embedded Silicon Oxycarbide Ceramics. Polymers. 2022; 14(17):3675. https://doi.org/10.3390/polym14173675
Chicago/Turabian StyleHu, Dongxiao, Gaofeng Shao, Jun Wang, Aleksander Gurlo, and Maged F. Bekheet. 2022. "Revealing Nanodomain Structures of Bottom-Up-Fabricated Graphene-Embedded Silicon Oxycarbide Ceramics" Polymers 14, no. 17: 3675. https://doi.org/10.3390/polym14173675
APA StyleHu, D., Shao, G., Wang, J., Gurlo, A., & Bekheet, M. F. (2022). Revealing Nanodomain Structures of Bottom-Up-Fabricated Graphene-Embedded Silicon Oxycarbide Ceramics. Polymers, 14(17), 3675. https://doi.org/10.3390/polym14173675