
Void Content Determination of Carbon Fiber Reinforced Polymers: A Comparison between Destructive and Non-Destructive Methods


Abstract
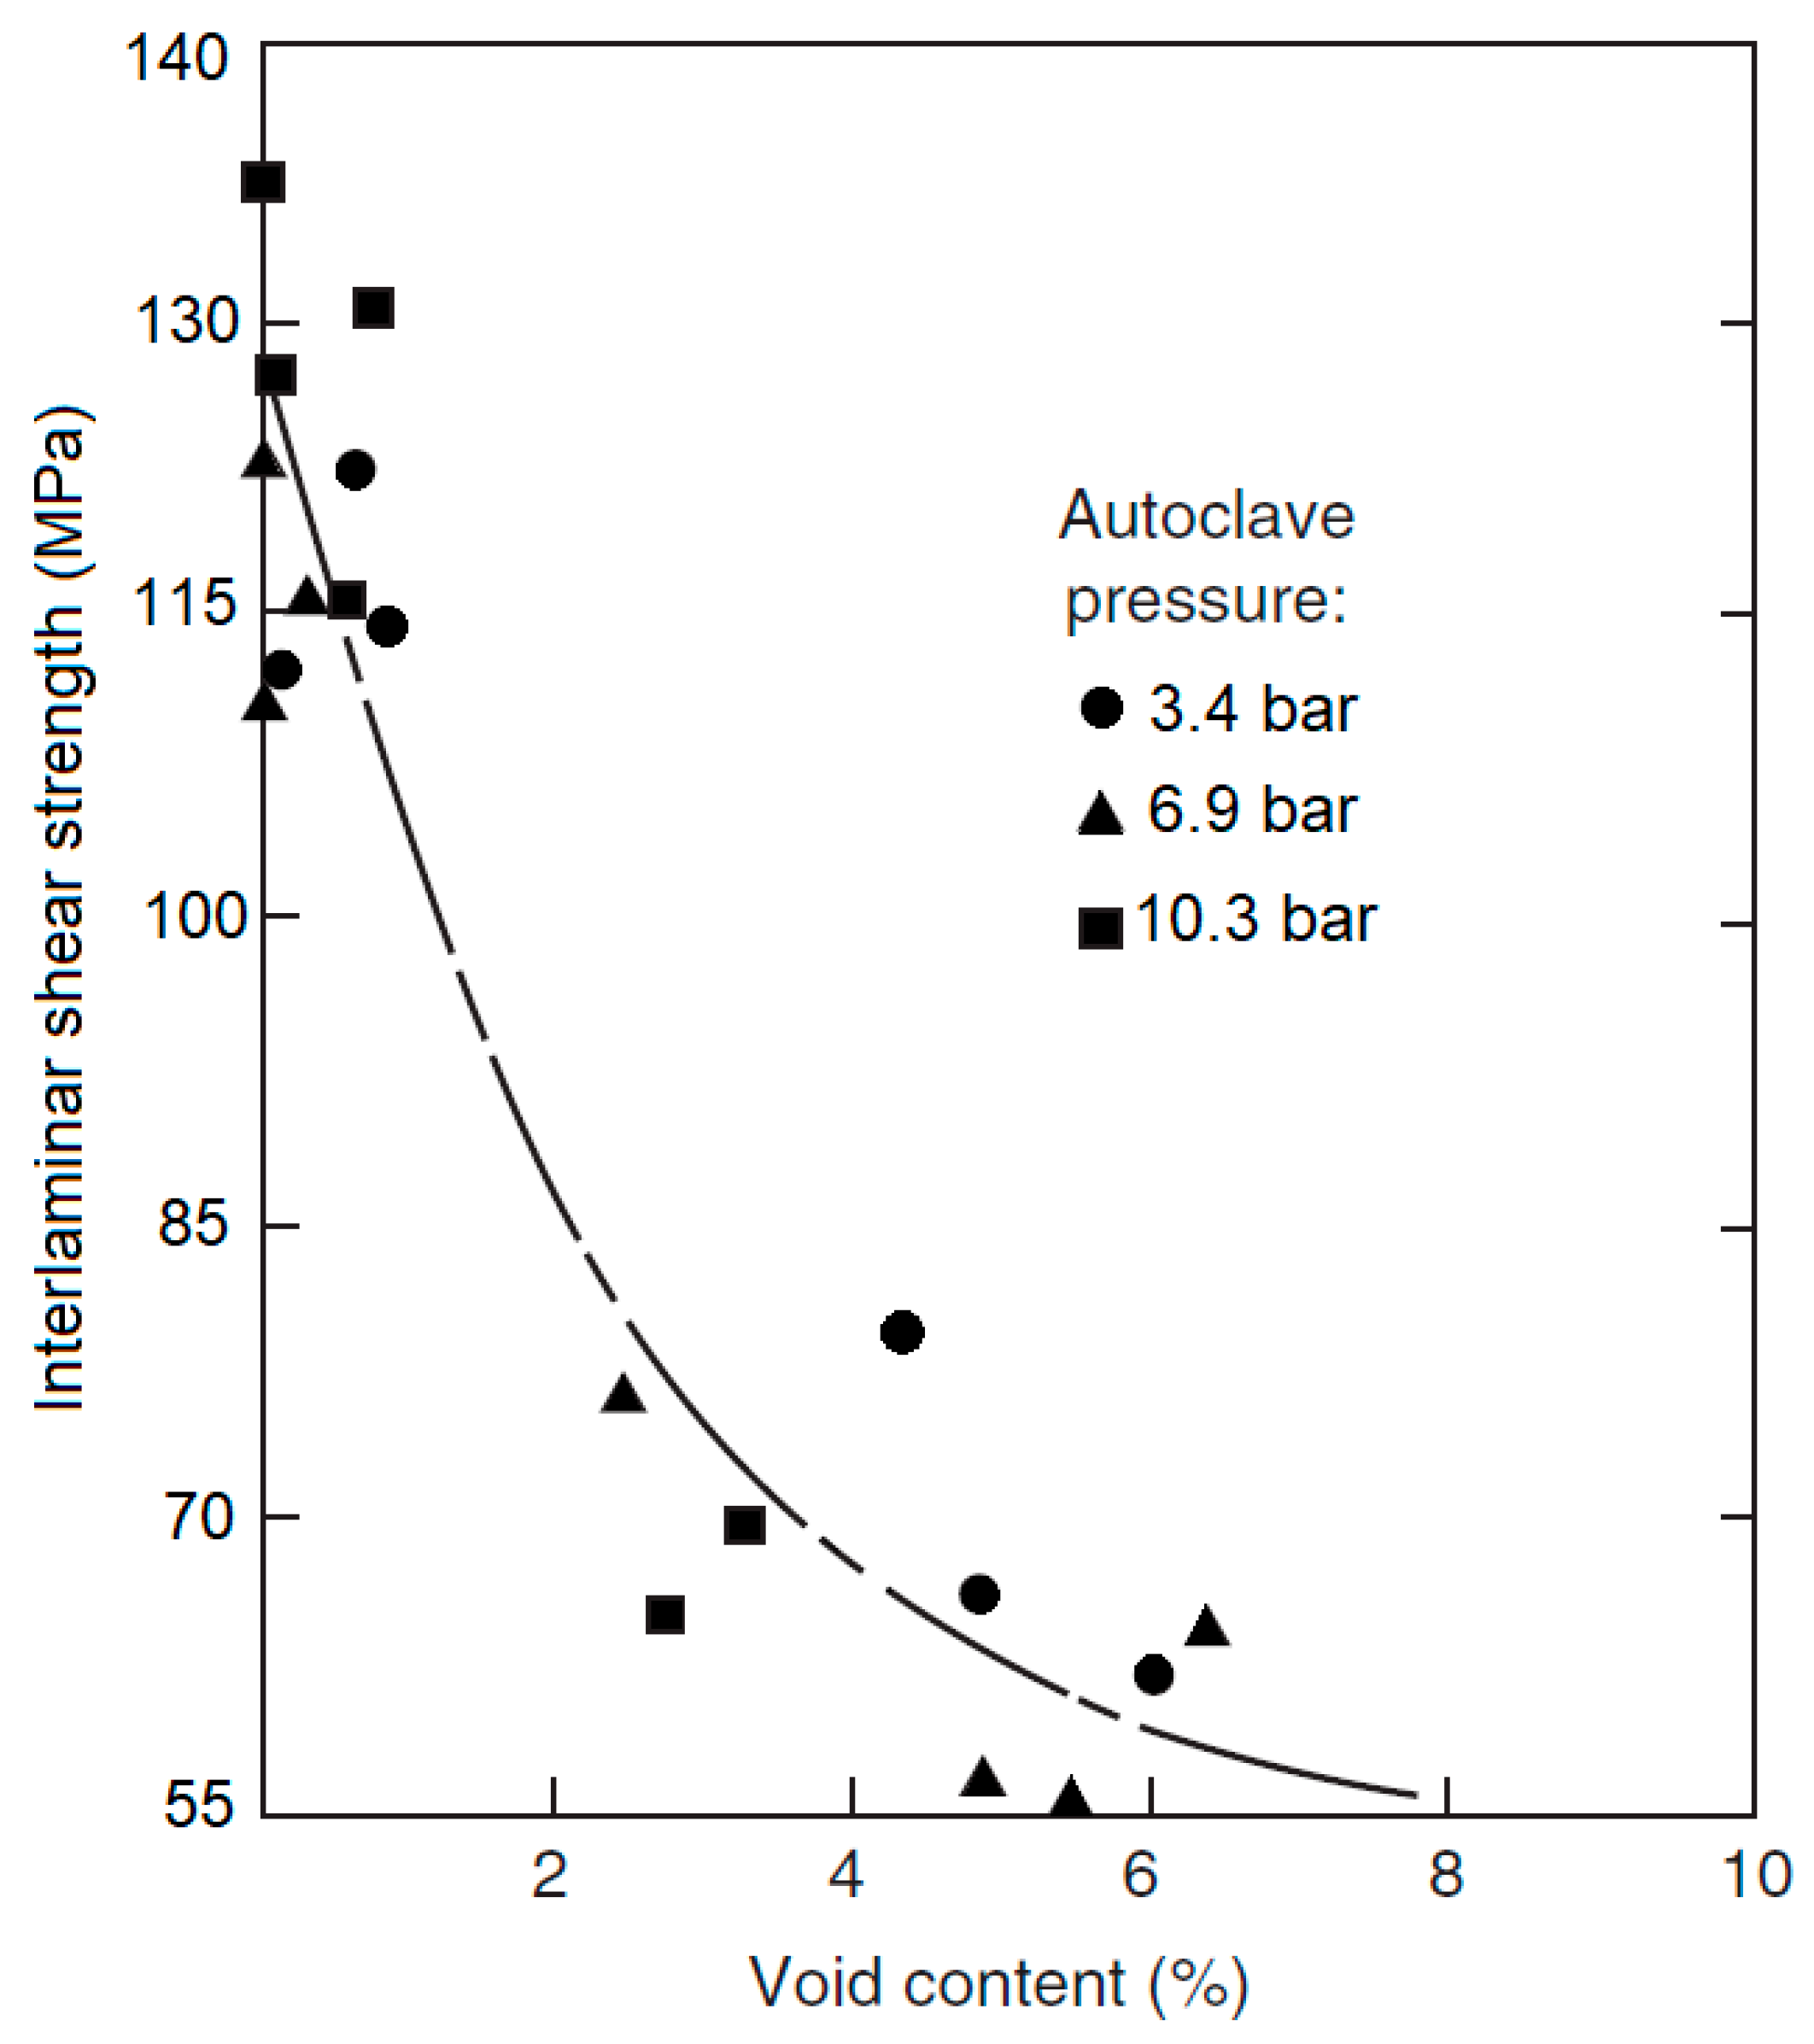
:1. Introduction
2. Methodology
2.1. Destructive Testing
2.1.1. Procedures
Specimen Preparation
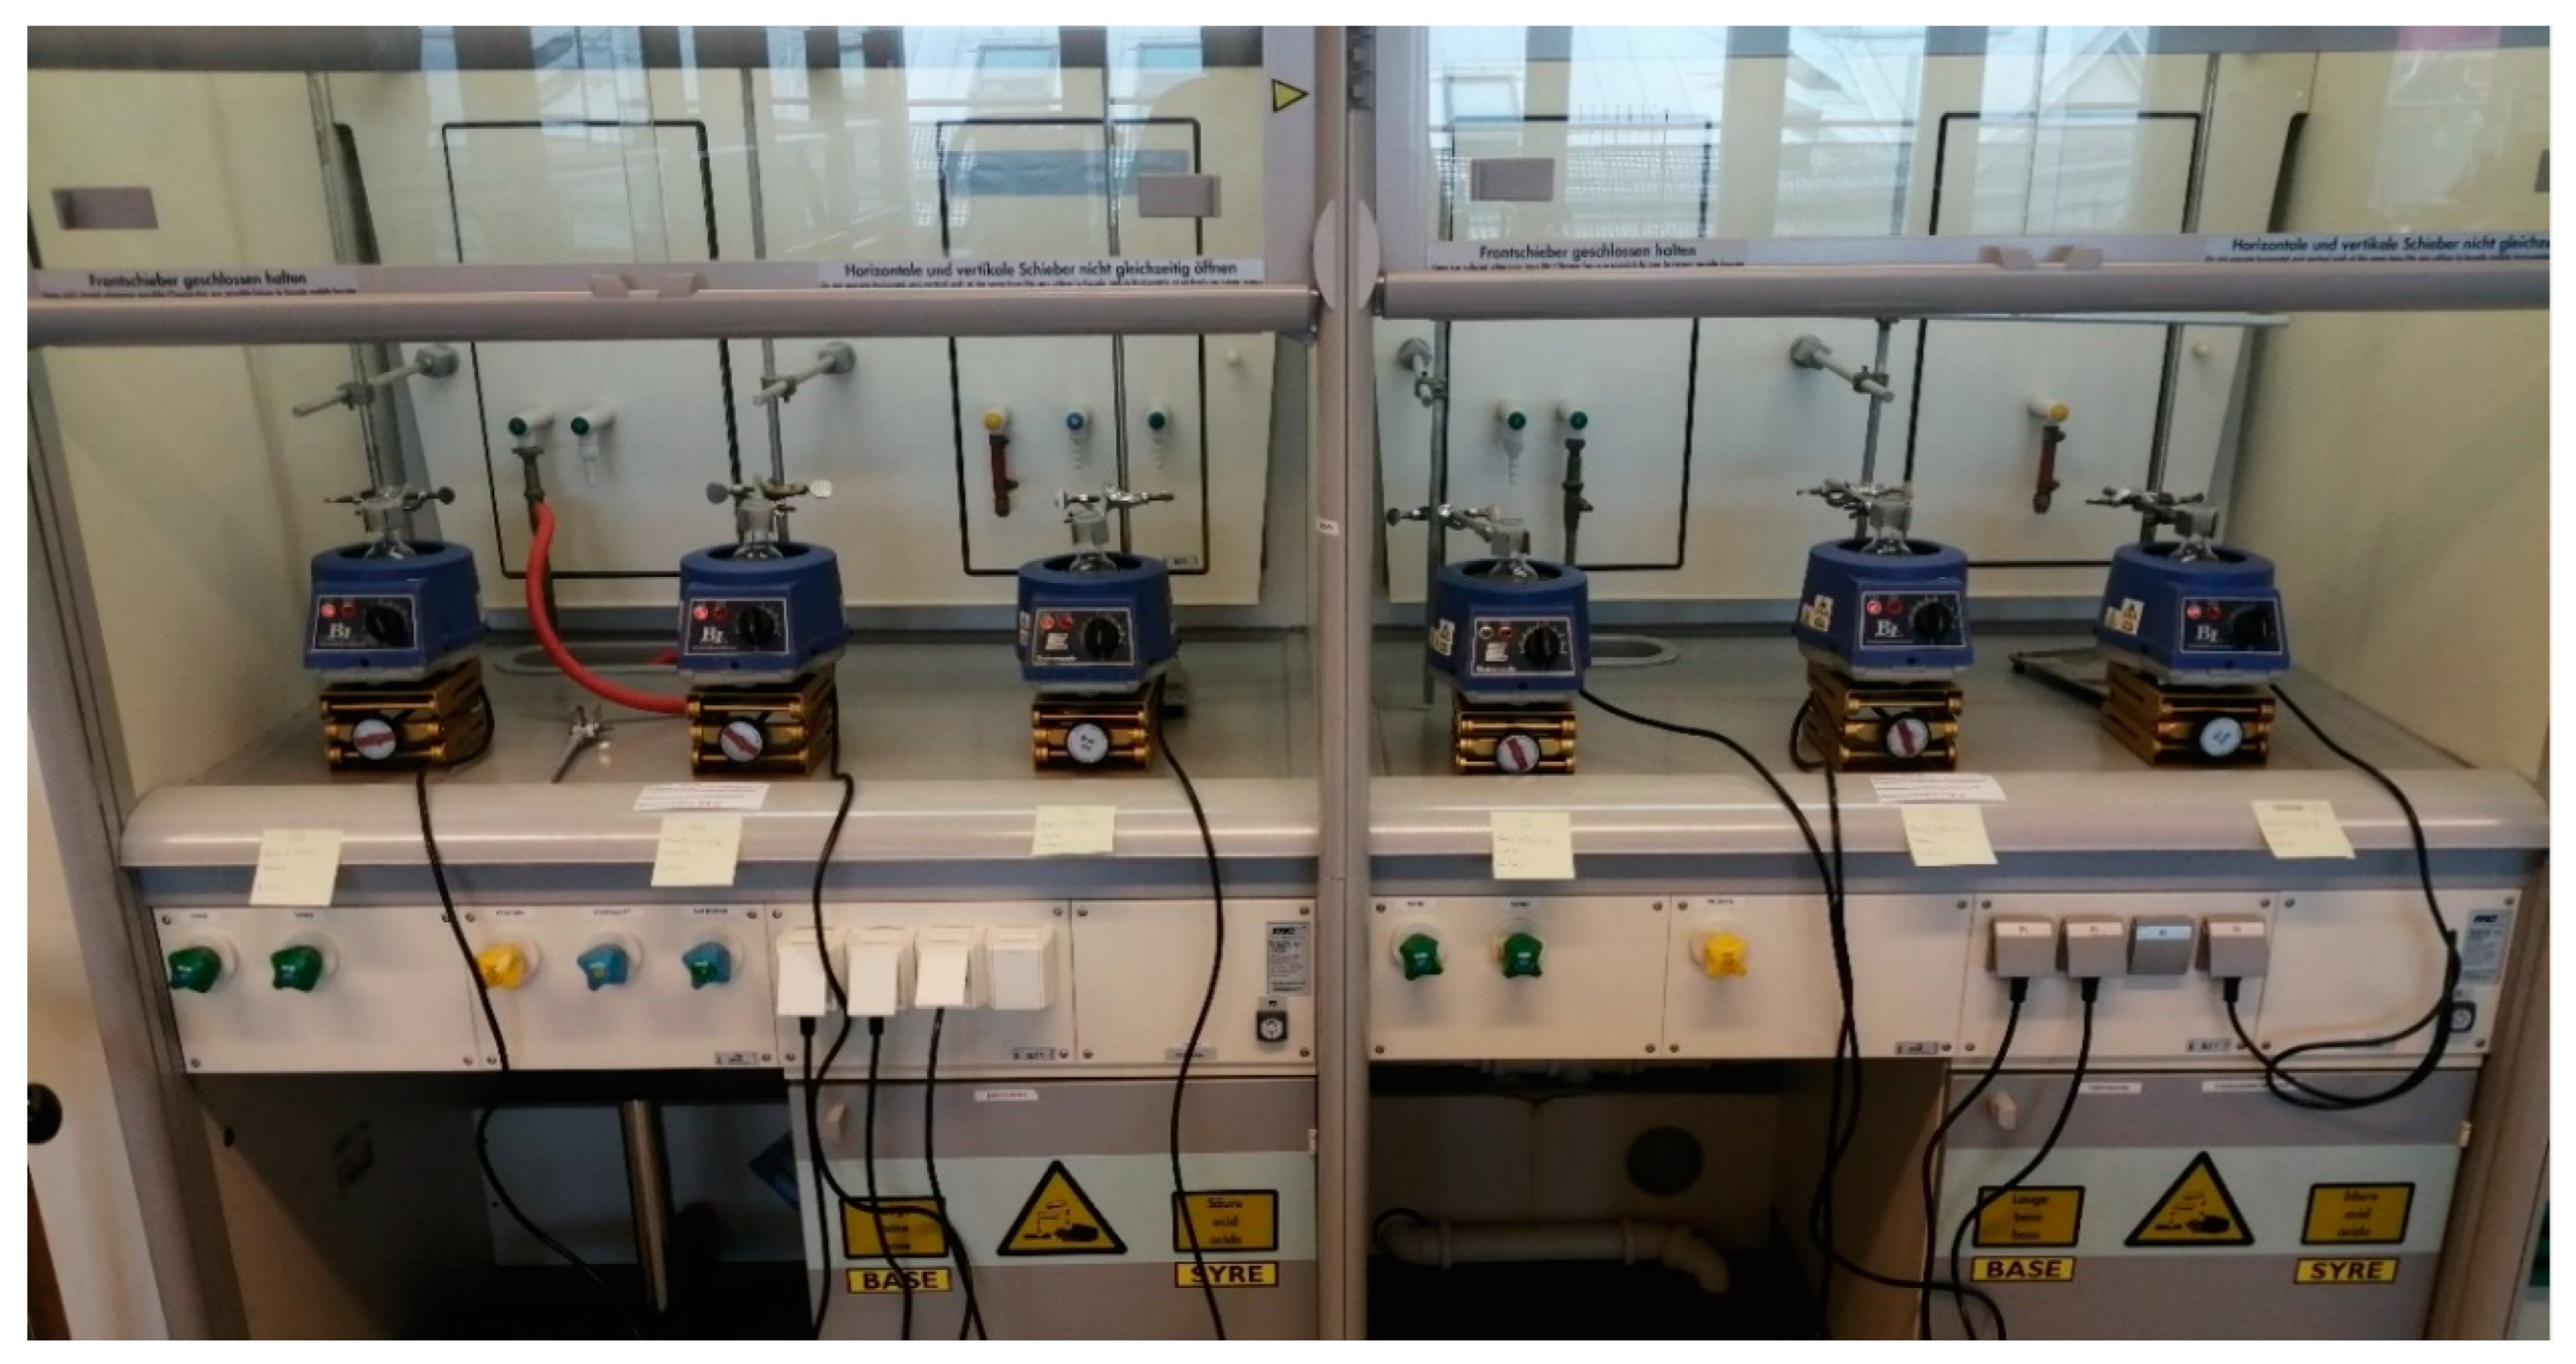
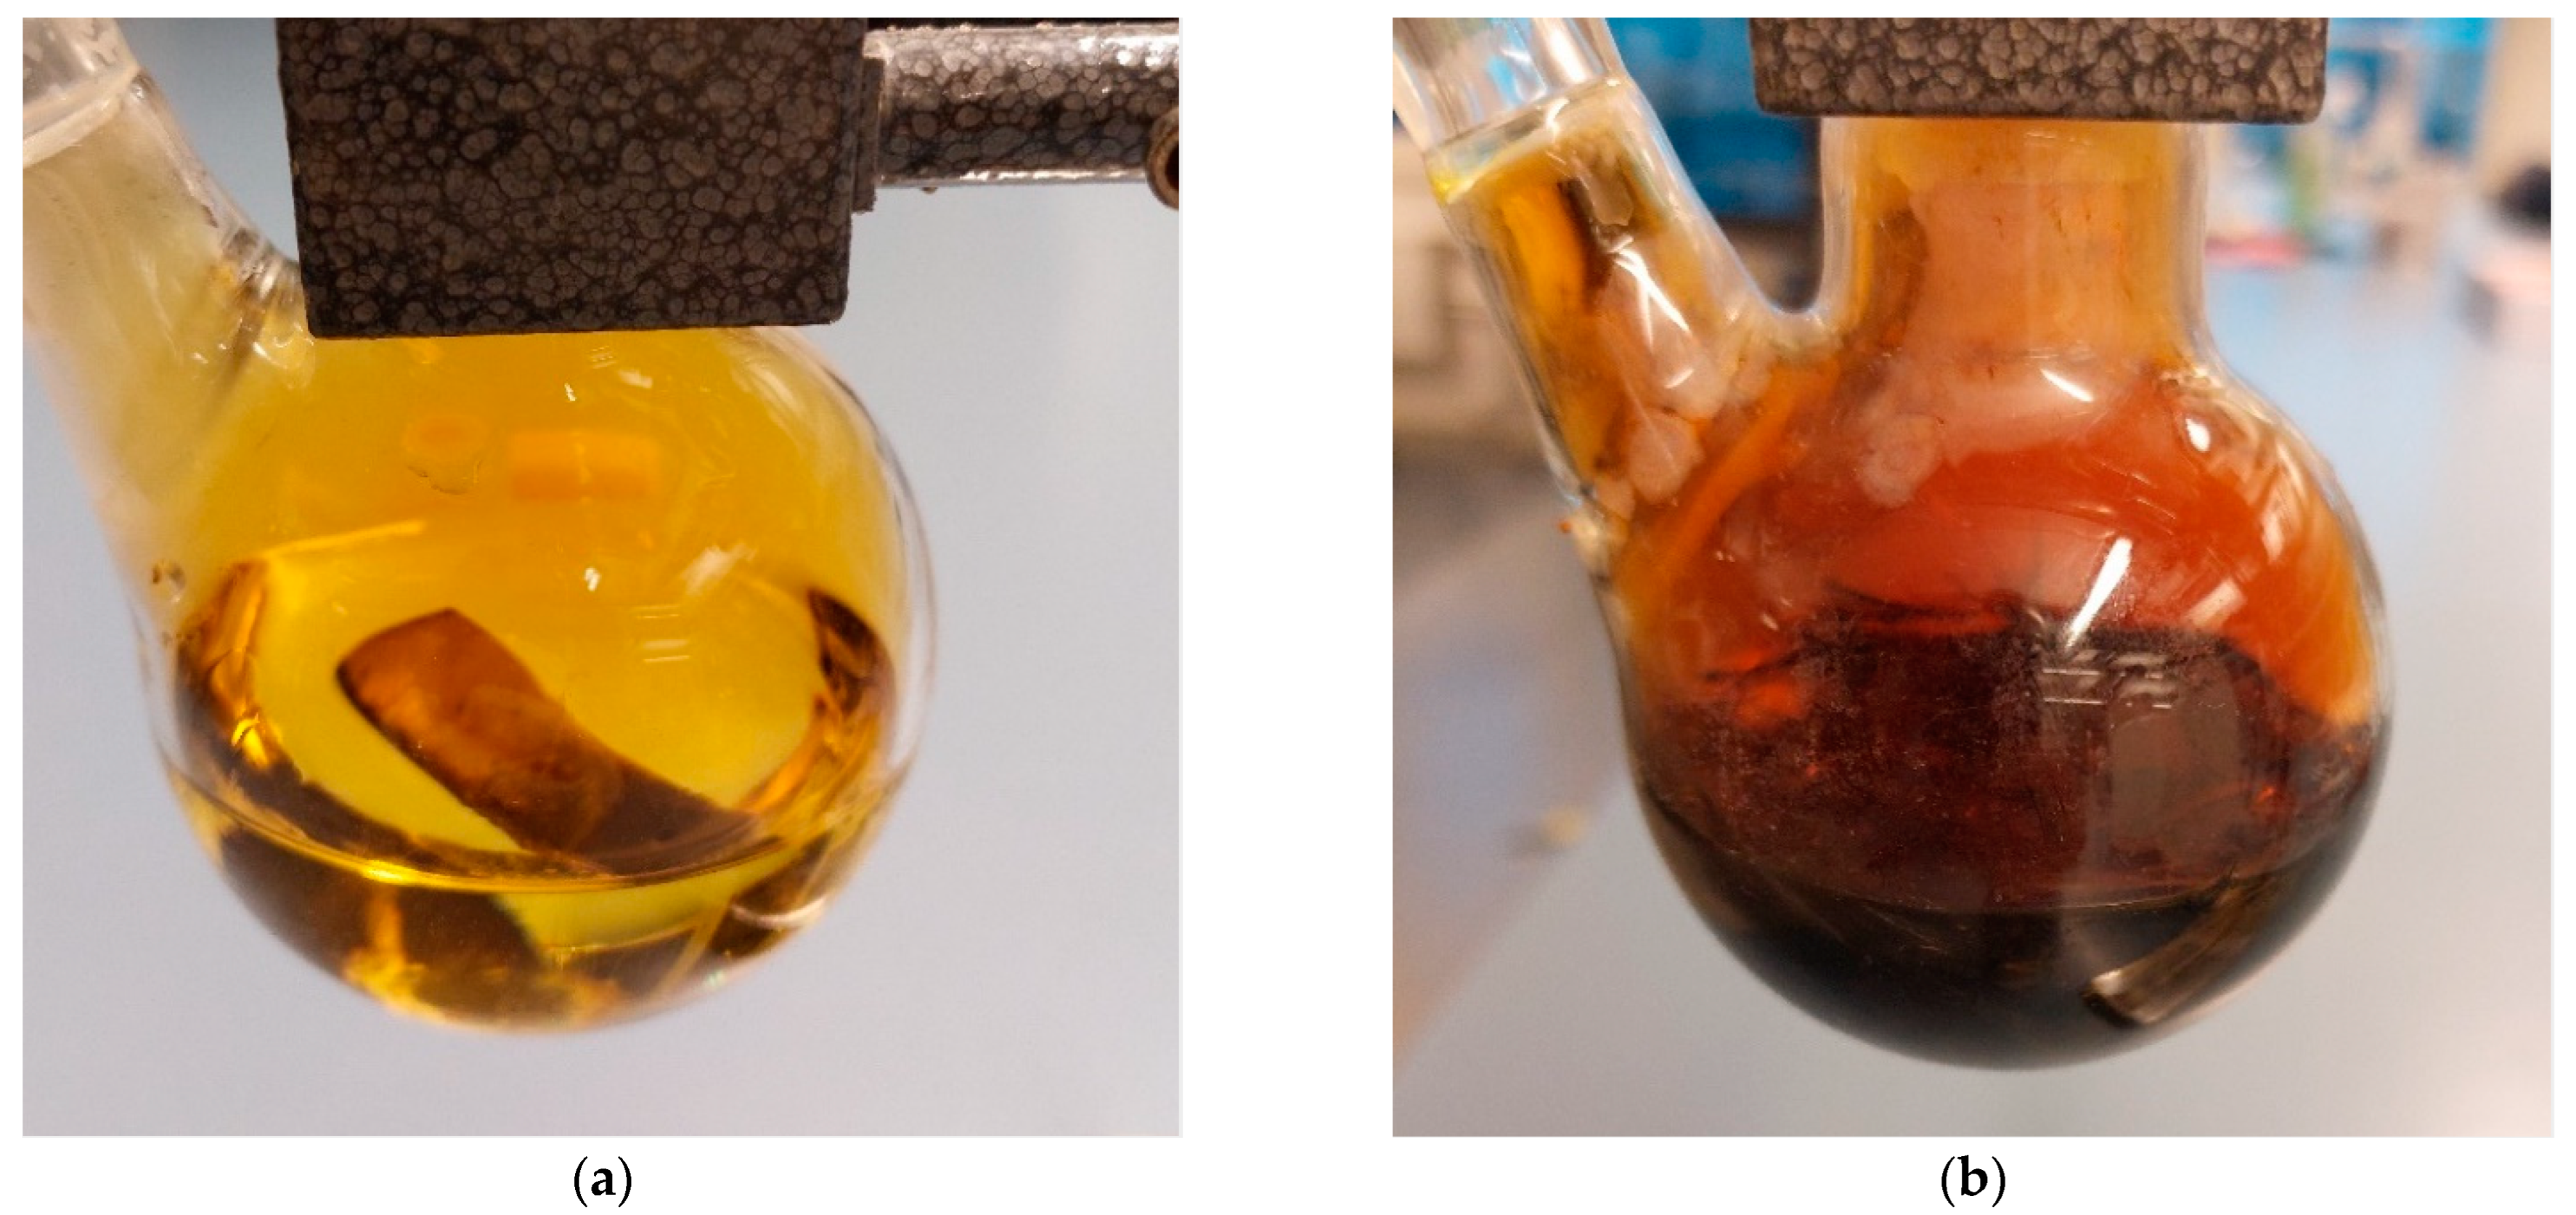
Acid Digestion Tests Using Sulfuric Acid
Acid Digestion Tests Using Nitric Acid
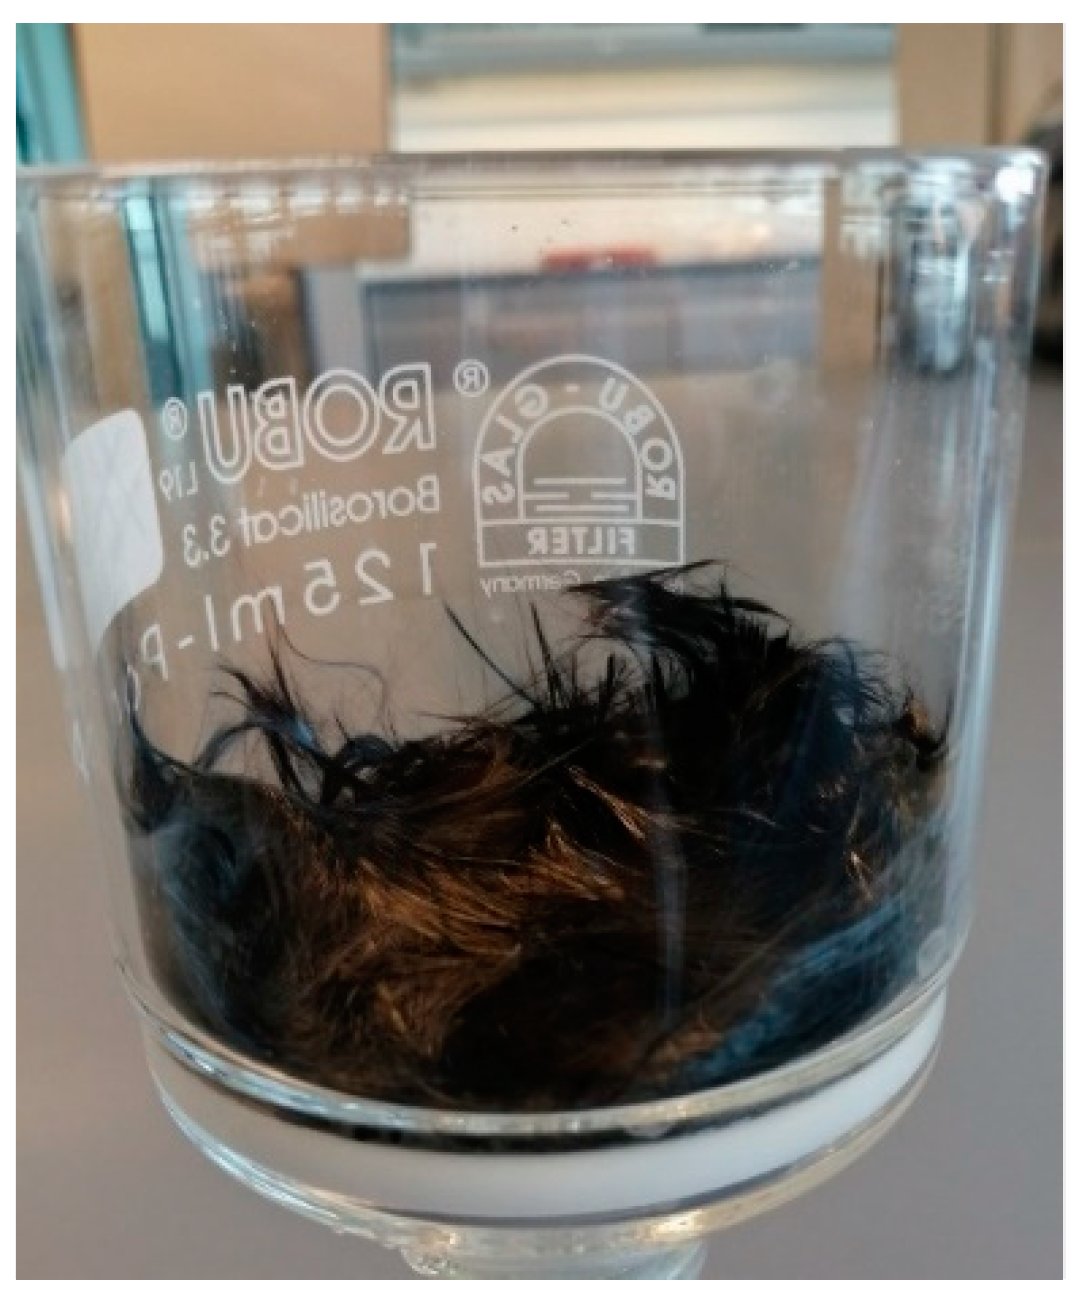
Calculations
2.1.2. Results of Destructive Testing
2.2. Non-Destructive Testing
2.2.1. Approach and Methodology
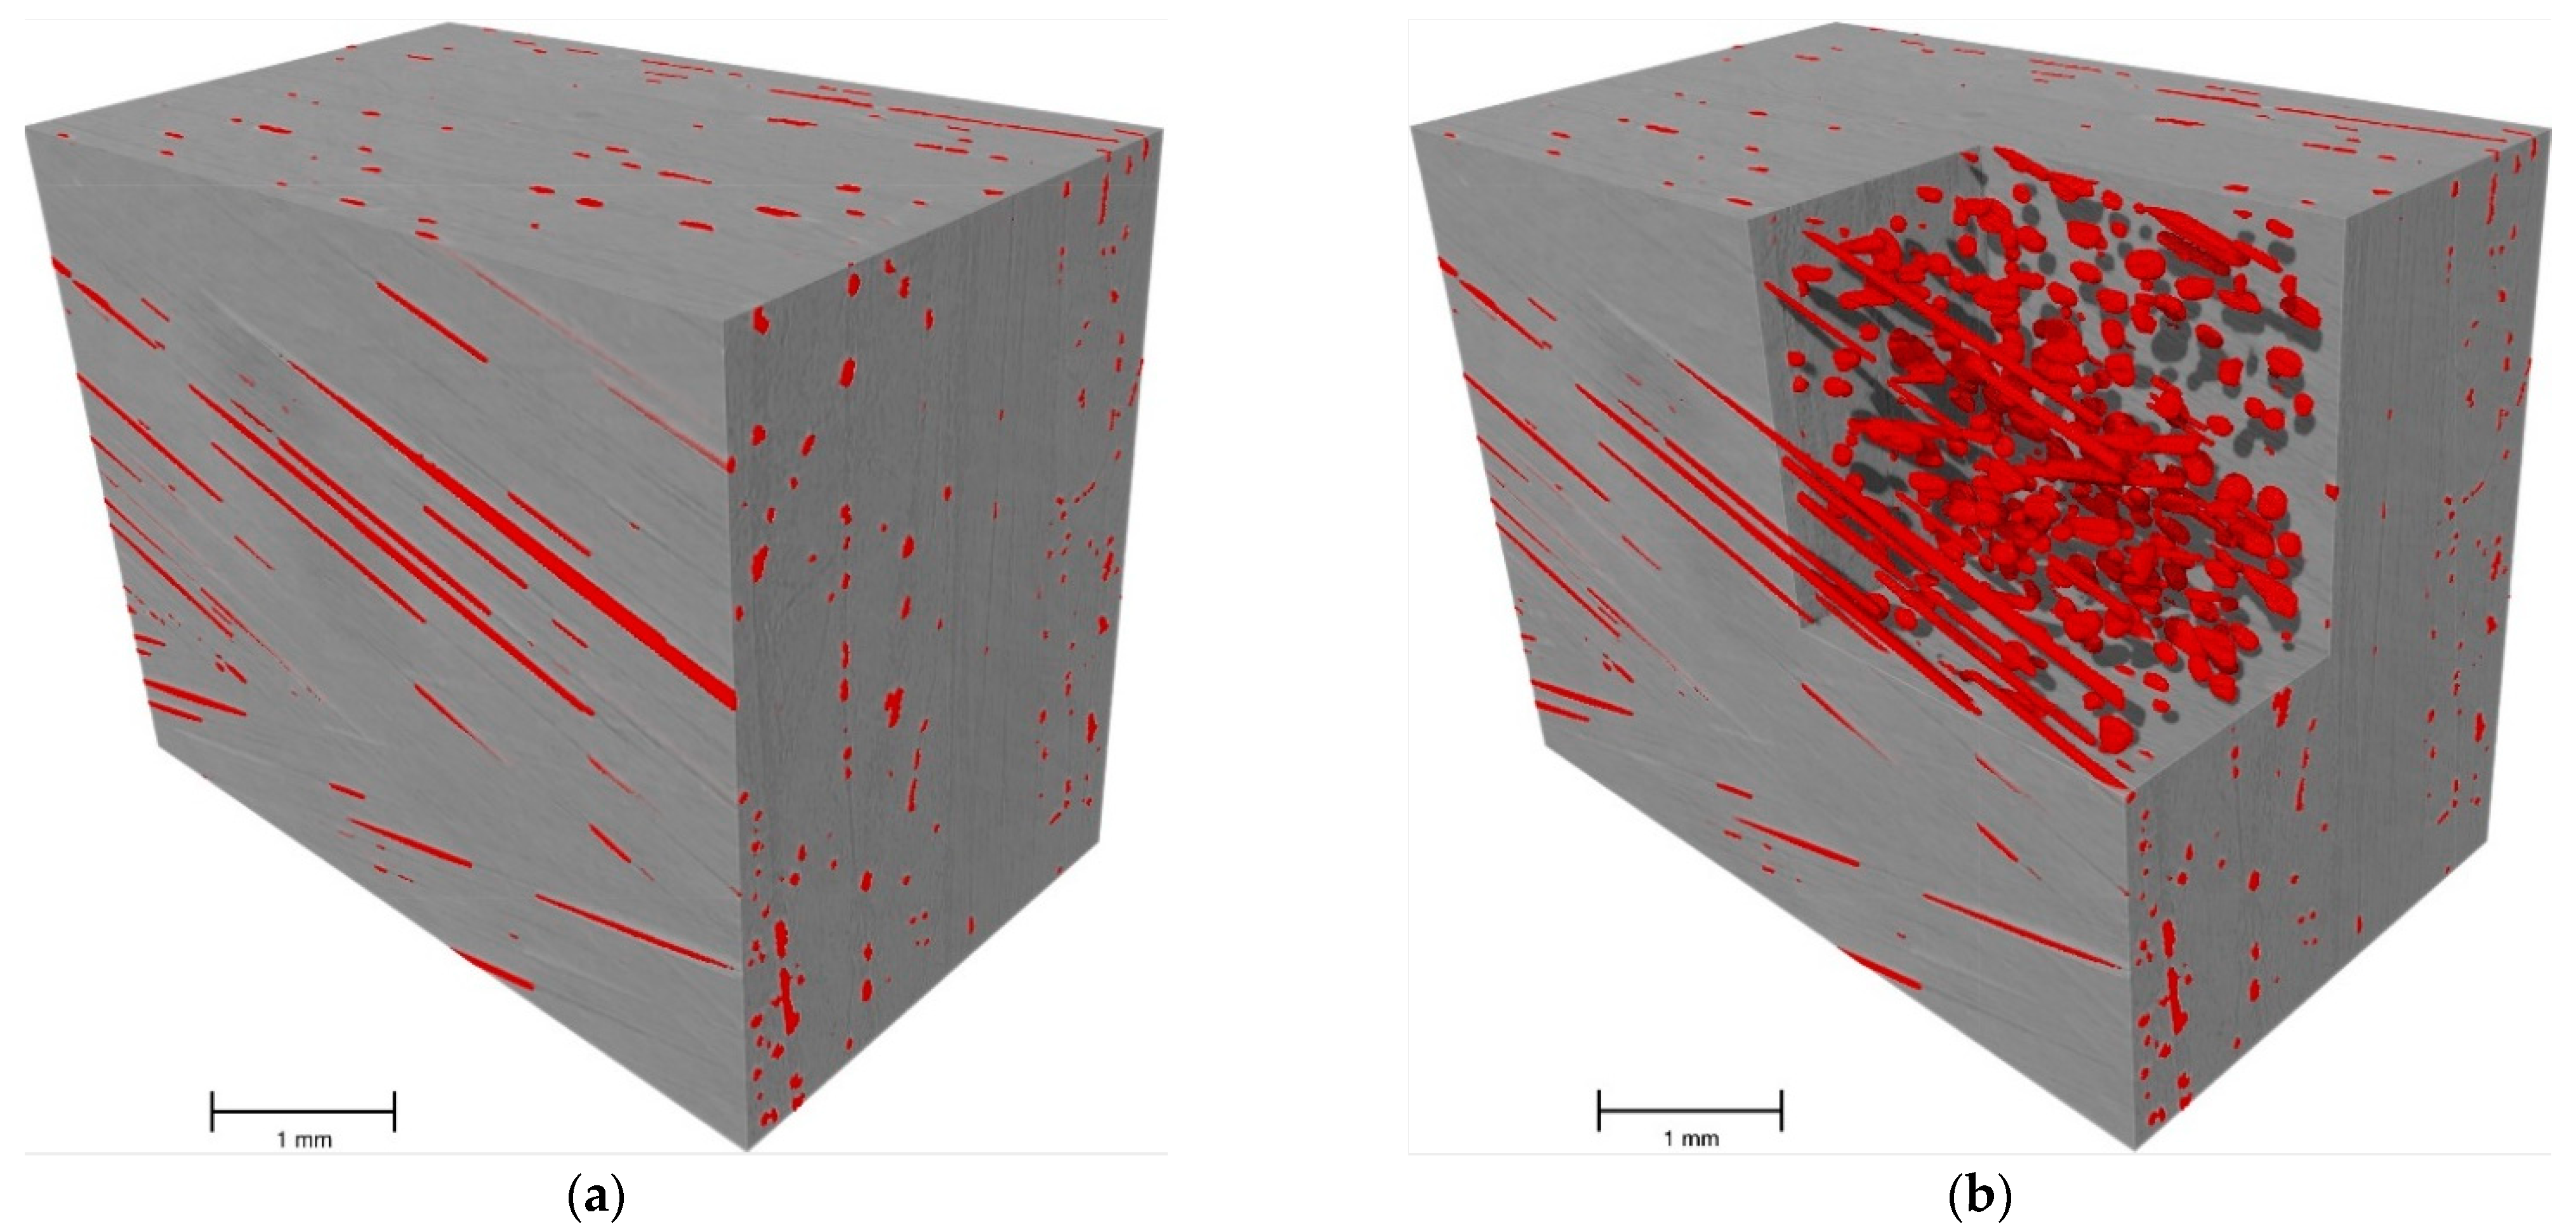
2.2.2. Results of Non-Destructive Testing
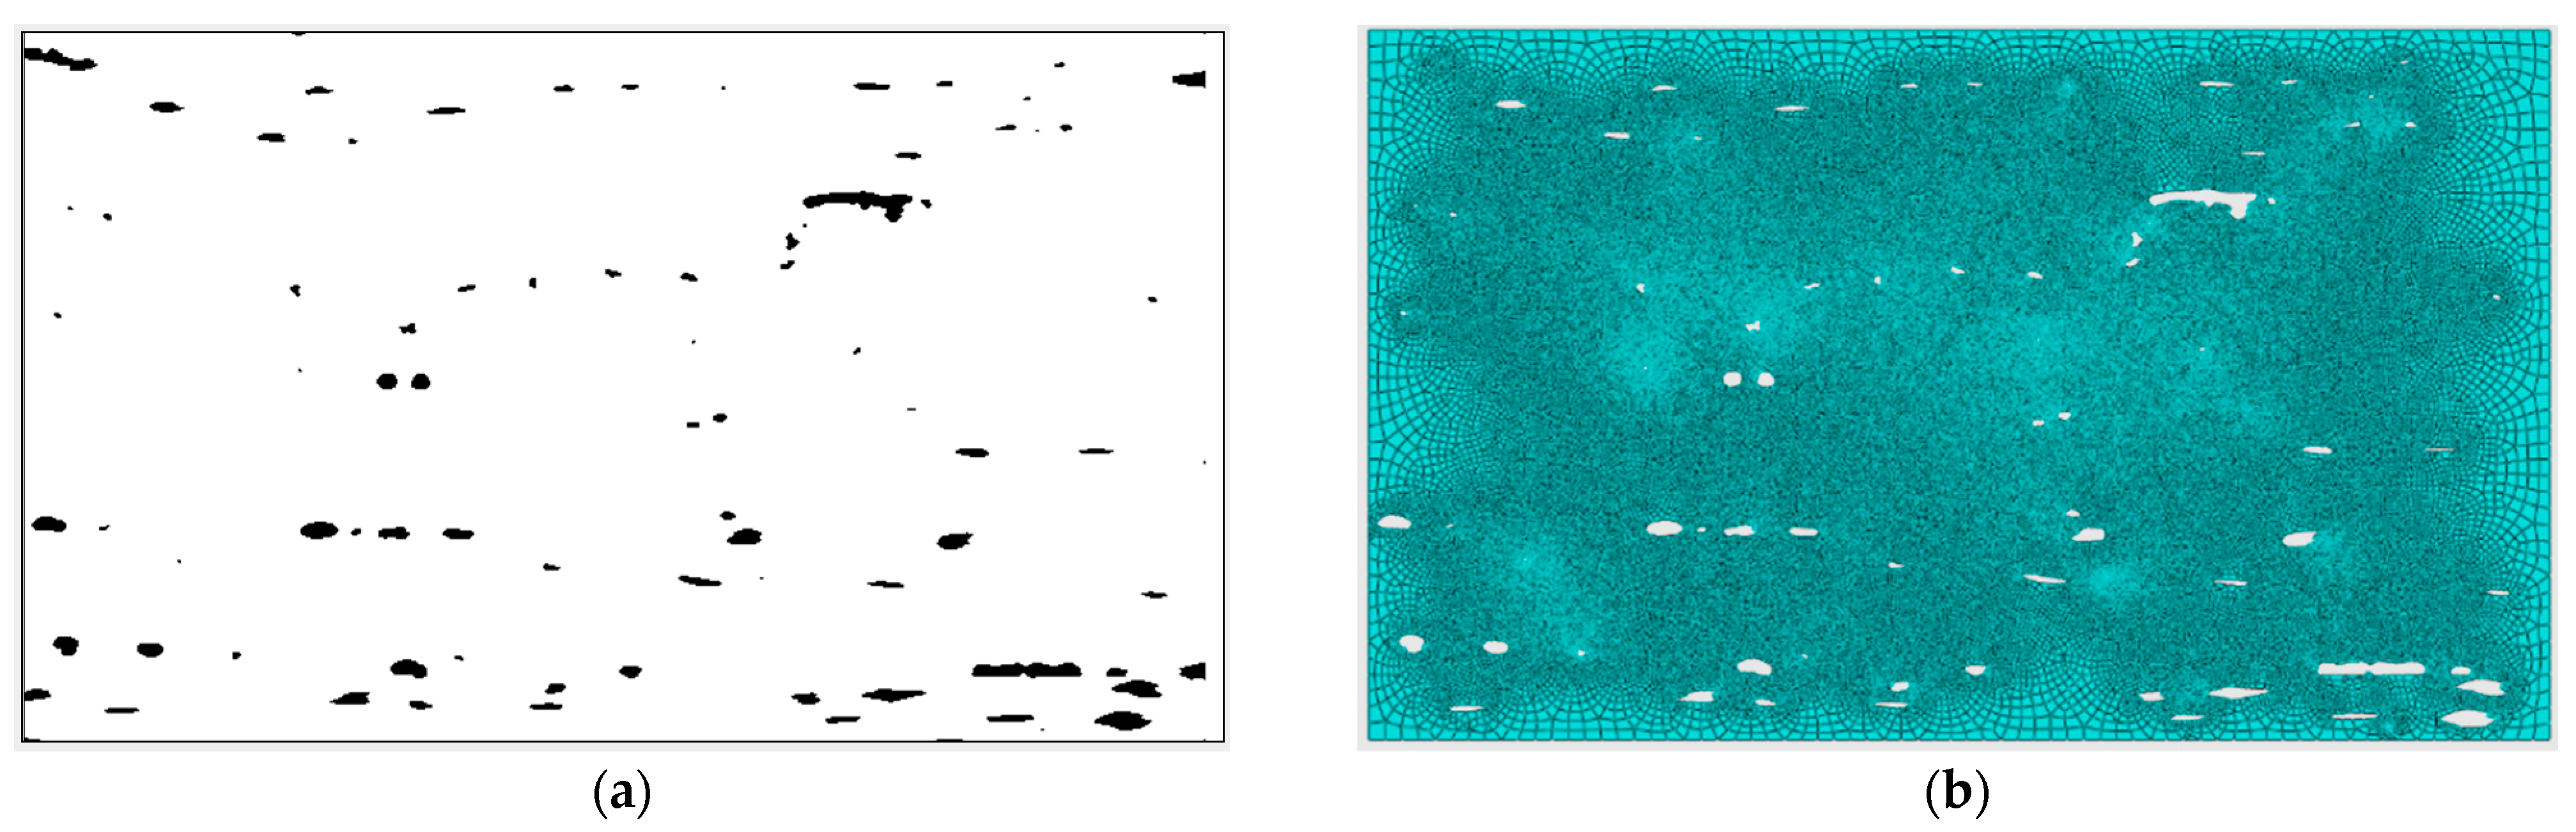
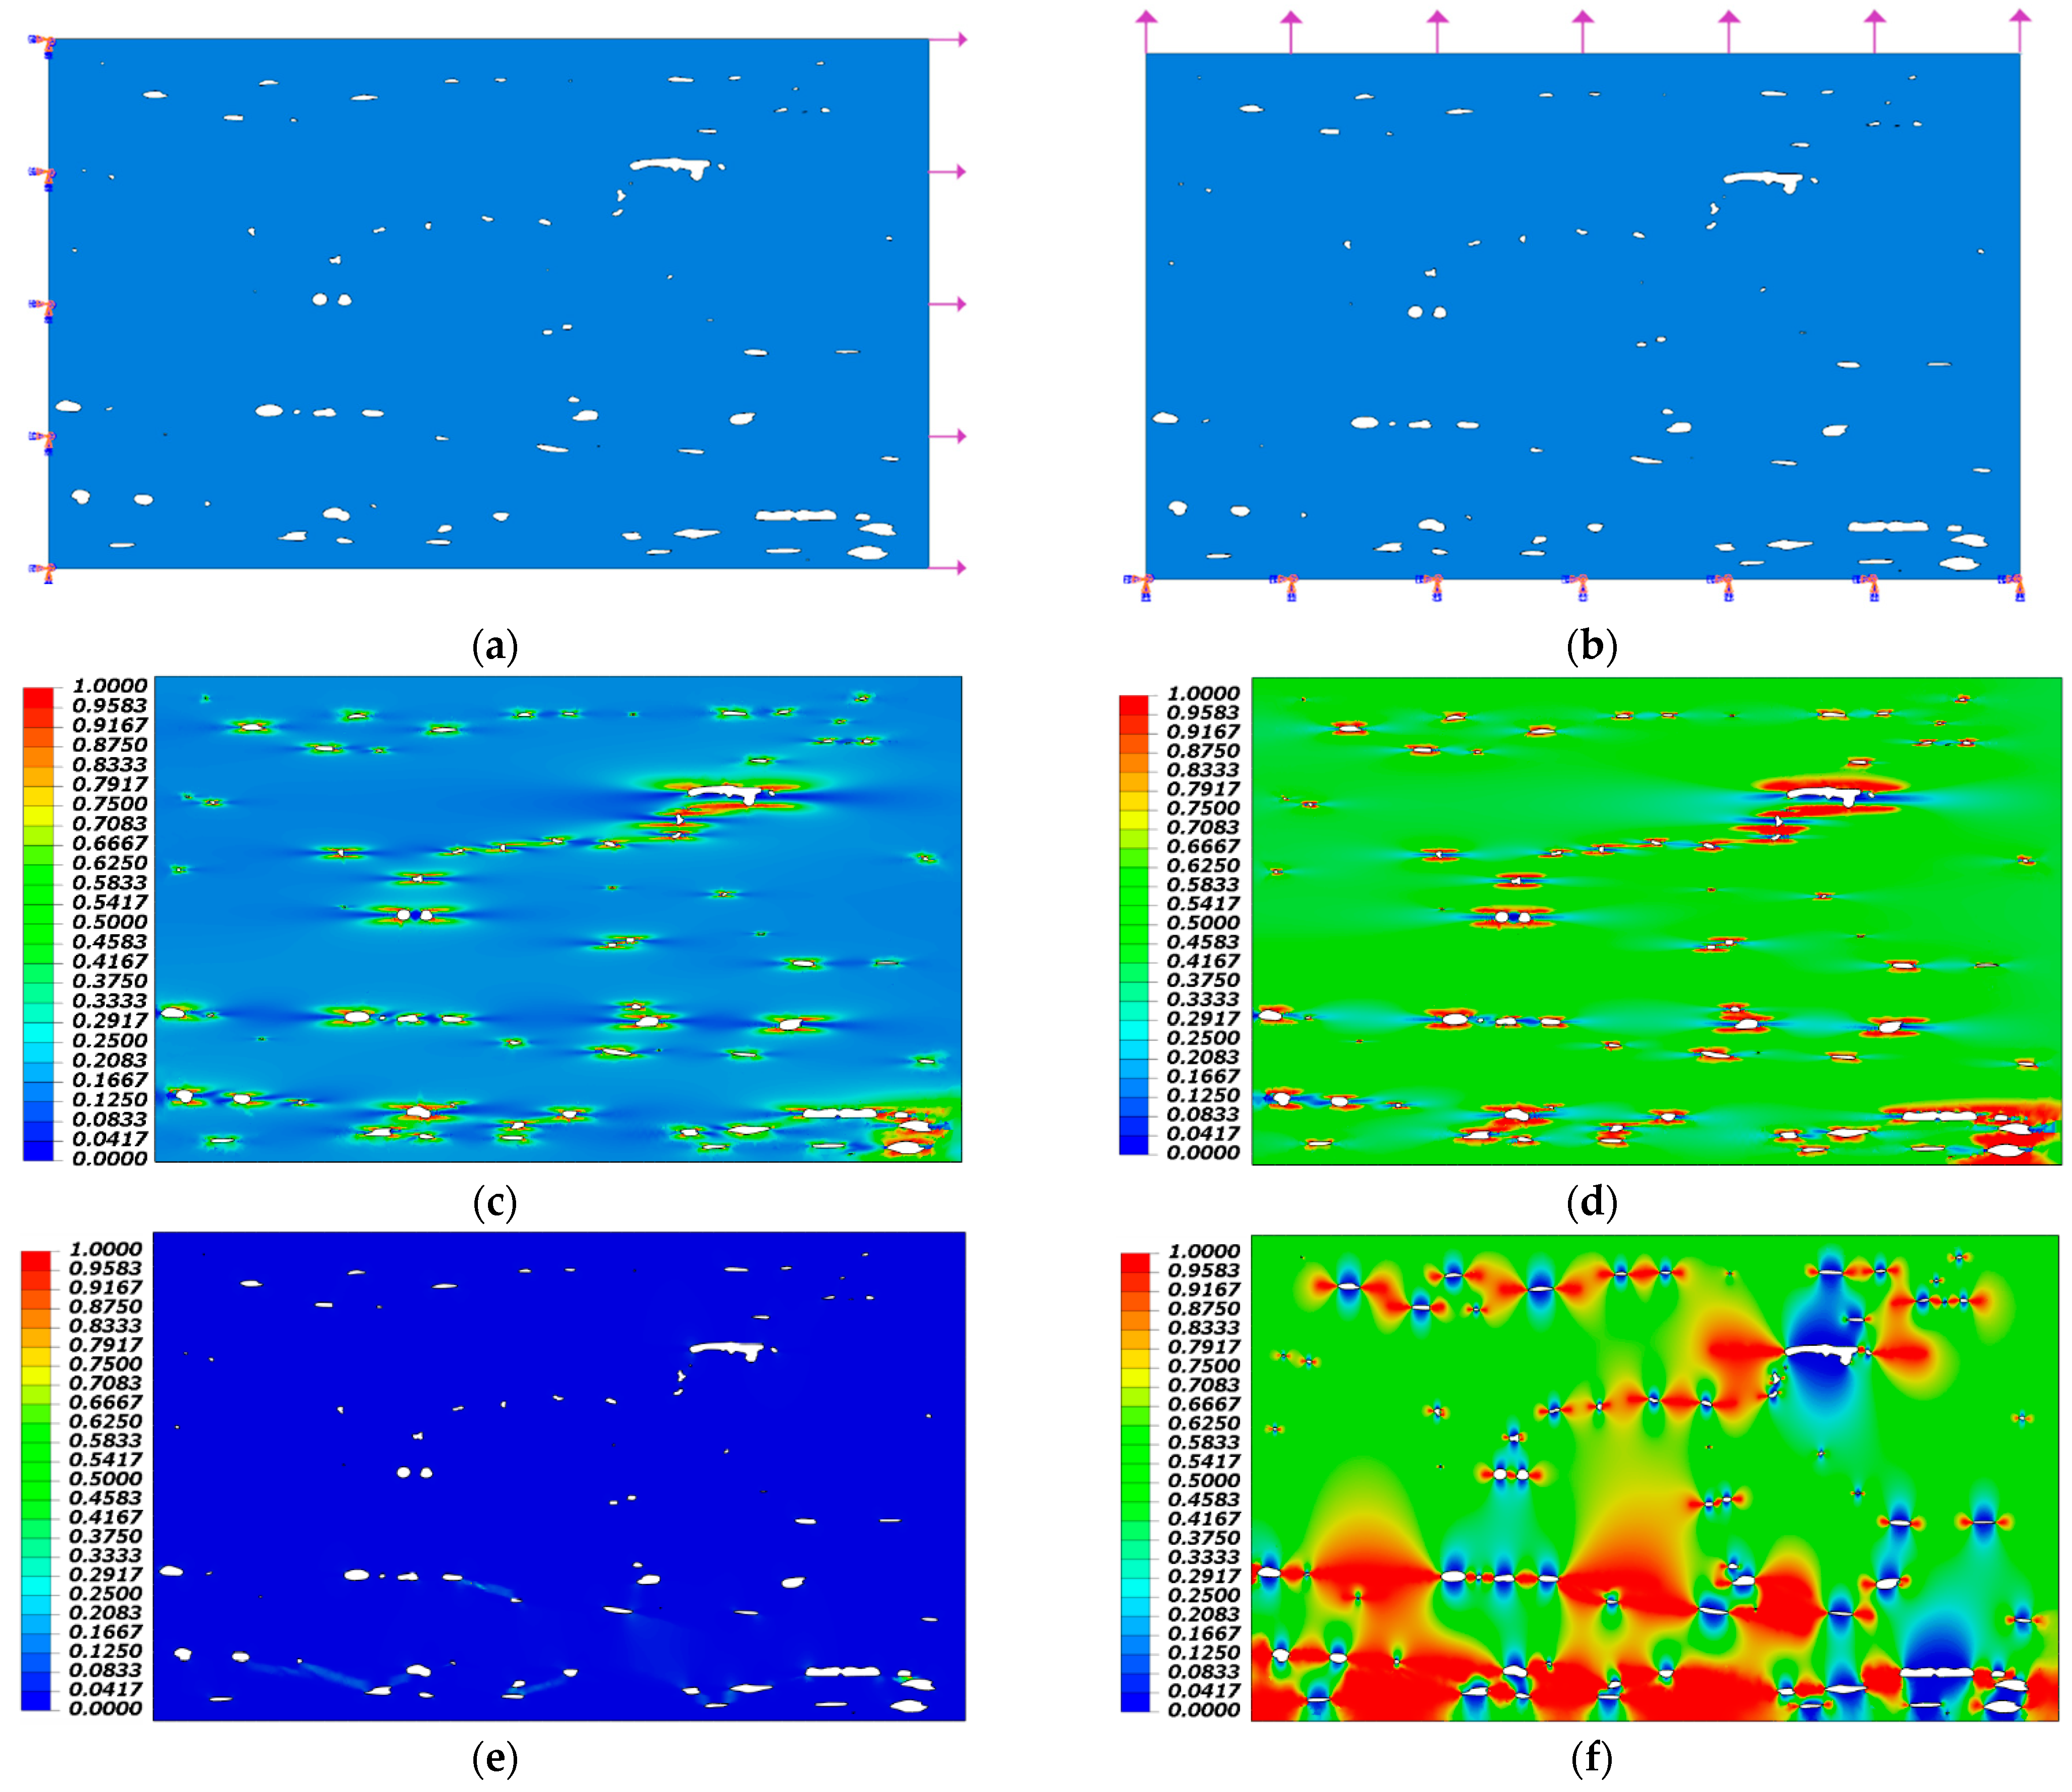
2.2.3. Numerical Modelling
3. Discussion and Conclusions
Author Contributions
Funding
Data Availability Statement
Conflicts of Interest
References
- Rubino, F.; Nisticò, A.; Tucci, F.; Carlone, P. Marine application of fiber reinforced composites: A review. J. Mar. Sci. Eng. 2020, 8, 26. [Google Scholar] [CrossRef] [Green Version]
- Sebaey, T.A.; Bouhrara, M.; O’Dowd, N. Fibre Alignment and Void Assessment in Thermoplastic Carbon Fibre Reinforced Polymers Manufactured by Automated Tape Placement. Polymers 2021, 13, 473. [Google Scholar] [CrossRef]
- Liu, L.; Zhang, B.M.; Wang, D.F.; Wu, Z.J. Effects of cure cycles on void content and mechanical properties of composite laminates. Compos. Struct. 2006, 73, 303–309. [Google Scholar] [CrossRef]
- Hamidi, Y.K.; Aktas, L.; Altan, M.C. Effect of packing on void morphology in resin transfer molded E-glass/epoxy composites. Polym. Compos. 2005, 26, 614–627. [Google Scholar] [CrossRef]
- Eom, Y.; Boogh, L.; Michaud, V.; Sunderland, P.; Månson, J.A. Stress-initiated void formation during cure of a three-dimensionally constrained thermoset resin. Polym. Eng. Sci. 2001, 41, 492–503. [Google Scholar] [CrossRef]
- Elruby, A.; Handrigan, S.M.; Nakhla, S. Fracture Behavior of Heavily Cross-Linked Epoxy: Testing, Fractography, and Numerical Modeling. J. Eng. Mater. Technol. 2021, 143, 011004. [Google Scholar] [CrossRef]
- Dill, C.W.; Tipton, S.M.; Glaessgen, E.H.; Branscum, K.D. Fatigue strength reduction imposed by porosity in a fiberglass composite. In Damage Detection in Composite Materials; ASTM International: West Conshohocken, PA, USA, 1992. [Google Scholar]
- Birt, E.A.; Smith, R.A. A review of NDE methods for porosity measurement in fibre-reinforced polymer composites. Insight-Non-Destr. Test. Cond. Monit. 2004, 46, 681–686. [Google Scholar] [CrossRef]
- Mallick, P.K. Fiber-Reinforced Composites: Materials, Manufacturing, and Design; CRC Press: Boca Raton, FL, USA, 2007. [Google Scholar]
- Saidpour, H.; Tehranchi, H. Determination of Void Distribution and Fiber Volume Fraction in Filament Winding Composites; University of East London: London, UK, 2001. [Google Scholar]
- Standard, A. D2734-16: Standard Test Methods for Void Content of Reinforced Plastics; ASTM International, West Conshohocken: West Conshohocken, PA, USA, 2016. [Google Scholar]
- Stone, D.; Clarke, B. Ultrasonic attenuation as a measure of void content in carbon-fibre reinforced plastics. Non-Destr. Test. 1975, 8, 137–145. [Google Scholar] [CrossRef]
- Bücheler, D.; Kaiser, A.; Henning, F. Using thermogravimetric analysis to determine carbon fiber weight percentage of fiber-reinforced plastics. Compos. Part B Eng. 2016, 106, 218–223. [Google Scholar] [CrossRef]
- Mehdikhani, M.; Gorbatikh, L.; Verpoest, I.; Lomov, S.V. Voids in fiber-reinforced polymer composites: A review on their formation, characteristics, and effects on mechanical performance. J. Compos. Mater. 2019, 53, 1579–1669. [Google Scholar] [CrossRef]
- Thomason, J. The interface region in glass fibre-reinforced epoxy resin composites: 1. Sample preparation, void content and interfacial strength. Composites 1995, 7, 467–475. [Google Scholar] [CrossRef]
- Nikishkov, Y.; Airoldi, L.; Makeev, A. Measurement of voids in composites by X-ray Computed Tomography. Compos. Sci. Technol. 2013, 89, 89–97. [Google Scholar] [CrossRef]
- Lambert, J.; Chambers, A.; Sinclair, I.; Spearing, S. 3D damage characterisation and the role of voids in the fatigue of wind turbine blade materials. Compos. Sci. Technol. 2012, 72, 337–343. [Google Scholar] [CrossRef]
- Seon, G.; Makeev, A.; Nikishkov, Y.; Lee, E. Effects of defects on interlaminar tensile fatigue behavior of carbon/epoxy composites. Compos. Sci. Technol. 2013, 89, 194–201. [Google Scholar] [CrossRef]
- Carraro, P.; Maragoni, L.; Quaresimin, M. Influence of manufacturing induced defects on damage initiation and propagation in carbon/epoxy NCF laminates. Adv. Manuf. Polym. Compos. Sci. 2015, 1, 44–53. [Google Scholar] [CrossRef]
- Choudhry, R.S.; Khan, K.A.; Khan, S.Z.; Khan, M.A.; Hassan, A. Micromechanical modeling of 8-harness satin weave glass fiber-reinforced composites. J. Compos. Mater. 2017, 51, 705–720. [Google Scholar] [CrossRef]
- Nikishkov, Y.; Seon, G.; Makeev, A. Structural analysis of composites with porosity defects based on X-ray computed tomography. J. Compos. Mater. 2014, 48, 2131–2144. [Google Scholar] [CrossRef]
- Pinho, S.T.; Dávila, C.G.; Camanho, P.P.; Iannucci, L.; Robinson, P. Failure Models and Criteria for FRP Under-In-Plane or Three-Dimensional Stress States Including Shear Non-Linearity; No. NASA/TM-2005-213530; 2005. Available online: https://ntrs.nasa.gov/api/citations/20050110223/downloads/20050110223.pdf (accessed on 17 February 2022).
- International, A. ASTM D3171-15-Standard Test Methods for Constituent Content of Composite Materials; ASTM International: West Conshohocken, PA, USA, 2015. [Google Scholar]
- Judd, N.C.; NCW, J. Voids and their effects on the mechanical properties of composites. an approvisal. Sampe J. 1978, 14, 10–14. [Google Scholar]
- ASTM. “Standard Test Method for Density of Plastics by the Density-Gradient Technique”; D15.5-10; ASTM International: West Conshohocken, PA, USA, 2010. [Google Scholar]
- Madra, A.; El Hajj, N.; Benzeggagh, M. X-ray microtomography applications for quantitative and qualitative analysis of porosity in woven glass fiber reinforced thermoplastic. Compos. Sci. Technol. 2014, 95, 50–58. [Google Scholar] [CrossRef]
- Neuenschwander, J.; Furrer, R.; Roemmeler, A. Application of air-coupled ultrasonics for the characterization of polymer and polymer-matrix composite samples. Polym. Test. 2016, 56, 379–386. [Google Scholar] [CrossRef]
- Chimenti, D. Review of air-coupled ultrasonic materials characterization. Ultrasonics 2014, 54, 1804–1816. [Google Scholar] [CrossRef] [PubMed]
- Hanke, R.; Fuchs, T.; Salamon, M.; Zabler, S. X-ray microtomography for materials characterization. In Materials Characterization Using Nondestructive Evaluation (NDE) Methods; Elsevier: Amsterdam, The Netherlands, 2016; pp. 45–79. [Google Scholar]
- Corporation, B. Bruker Micro-CT N.V. Available online: https://www.bruker.com/en/products-and-solutions/preclinical-imaging/micro-ct.html (accessed on 17 February 2022).
- NRecon, 1.7.5.9; Bruker MicroCT: Kontich, Belgium, 2022; Available online: https://www.bruker.com/en/products-and-solutions/preclinical-imaging/micro-ct.html?gclid=EAIaIQobChMIserZ8LTM9gIVB7qWCh0p2AZTEAAYASAAEgLz8_D_BwE (accessed on 17 February 2022).
- CTAn, 1.20.3; Bruker MicroCT: Kontich, Belgium, 2022; Available online: https://www.bruker.com/en/products-and-solutions/preclinical-imaging/micro-ct.html?gclid=EAIaIQobChMIserZ8LTM9gIVB7qWCh0p2AZTEAAYASAAEgLz8_D_BwE (accessed on 17 February 2022).
- Dragonfly, 2020.2; Object Research Systems (ORS) Inc.: Montreal, QC, Canada, 2020.
- Otsu, N. A threshold selection method from gray-level histograms. IEEE Trans. Syst. Man Cybern. 1979, 9, 62–66. [Google Scholar] [CrossRef] [Green Version]
- Hildebrand, T.; Rüegsegger, P. A new method for the model-independent assessment of thickness in three-dimensional images. J. Microsc. 1997, 185, 67–75. [Google Scholar] [CrossRef]
- Schell, J.; Renggli, M.; van Lenthe, G.H.; Müller, R.; Ermanni, P. Micro-computed tomography determination of glass fibre reinforced polymer meso-structure. Compos. Sci. Technol. 2006, 66, 2016–2022. [Google Scholar] [CrossRef]
- Scott, A.; Sinclair, I.; Spearing, S.M.; Mavrogordato, M.N.; Hepples, W. Influence of voids on damage mechanisms in carbon/epoxy composites determined via high resolution computed tomography. Compos. Sci. Technol. 2014, 90, 147–153. [Google Scholar] [CrossRef]
- ABAQUS, 2020; Dassault Systèmes SE: Vélizy-Villacoublay, France, 2020.
- Hashin, Z. Failure criteria for unidirectional fiber composites. J. Appl. Mech. 1980, 47, 329–334. [Google Scholar] [CrossRef]
- Zhang, A.; Lu, H.; Zhang, D. Research on the mechanical properties prediction of carbon/epoxy composite laminates with different void contents. Polym. Compos. 2016, 37, 14–20. [Google Scholar] [CrossRef]


| Approach A1 (Sulfuric Acid) | Approach A2 (Nitric Acid) | ||||
|---|---|---|---|---|---|
| Sample Number | Sample Mass | Sample Volume | Sample Number | Sample Mass | Sample Volume |
| mg | mm3 | mg | mm3 | ||
| S1 | 3239.7 | 2170.686 | N1 | 2827.0 | 1891.270 |
| S2 | 2226.3 | 1490.700 | N2 | 2775.8 | 1836.209 |
| S3 | 2755.0 | 1836.711 | N3 | 2518.5 | 1682.254 |
| S4 | 2554.4 | 1699.109 | N4 | 2474.5 | 1644.850 |
| S5 | 2846.4 | 1895.783 | N5 | 2564.3 | 1696.501 |
| S6 | 2355.8 | 1568.333 | N6 | 2179.9 | 1453.987 |
| Volume Content | ||||
|---|---|---|---|---|
| Average (%) | SD (%) | CoV | ||
| Sulfuric | Fiber | 57.60% | 0.602 | 1.044 |
| Matrix | 41.11 | 0.526 | 1.280 | |
| Void | 1.30 | 0.134 | 10.295 | |
| Nitric | Fiber | 57.46 | 0.836 | 1.455 |
| Matrix | 41.66 | 0.660 | 1.582 | |
| Void | 0.87 | 0.238 | 27.231 | |
| Sample | Sample Volume (mm3) | Number of Closed Pores | Volume of Closed Pores (mm3) | Closed Porosity Percentage (%) |
|---|---|---|---|---|
| µCT 1 | 60.054 | 3040 | 0.930 | 1.550 |
| µCT 2 | 60.054 | 3413 | 0.904 | 1.506 |
| µCT 3 | 60.054 | 2965 | 0.914 | 1.522 |
| µCT 4 | 60.054 | 1997 | 0.923 | 1.537 |
| µCT 5 | 60.054 | 1818 | 0.889 | 1.480 |
| µCT 6 | 60.054 | 6457 | 0.955 | 1.591 |
| Average (%) | 1.531 | |||
| Standard deviation (%) | 0.038 | |||
| Coefficient of variation (%) | 2.478 | |||
| Property | Explanation | Value | Unit | |
|---|---|---|---|---|
| Elastic properties | Longitudinal modulus of elasticity. | 135 | GPa | |
| Transverse modulus of elasticity. | 10 | GPa | ||
| Poisson’s ratio. | 0.3 | GPa | ||
| In-plane shear modulus. | 5.0 | GPa | ||
| Out-of-plan shear modulus. | 5.0 | GPa | ||
| 2.5 | GPa | |||
| Damage properties | Ultimate longitudinal tensile strength. | 1760 | MPa | |
| Ultimate longitudinal compressive strength. | 1570 | MPa | ||
| Ultimate transverse tensile strength. | 80 | MPa | ||
| Ultimate transverse compressive strength. | 250 | MPa | ||
| Ultimate longitudinal shear strength. | 98 | MPa | ||
| Ultimate transverse shear strength. | 50 | MPa | ||
| Factor ranging from 0 to 1 representing the input of the shear strength to the fiber tensile damage. | 1 | - | ||
| Hashin factors | Hashin fiber factor in tension. | - | ||
| Hashin matrix factor in tension. | - | |||
| Hashin fiber factor in compression. | - | |||
| Hashin matrix factor in compression. | - | |||
Publisher’s Note: MDPI stays neutral with regard to jurisdictional claims in published maps and institutional affiliations. |
© 2022 by the authors. Licensee MDPI, Basel, Switzerland. This article is an open access article distributed under the terms and conditions of the Creative Commons Attribution (CC BY) license (https://creativecommons.org/licenses/by/4.0/).
Share and Cite
Elkolali, M.; Nogueira, L.P.; Rønning, P.O.; Alcocer, A. Void Content Determination of Carbon Fiber Reinforced Polymers: A Comparison between Destructive and Non-Destructive Methods. Polymers 2022, 14, 1212. https://doi.org/10.3390/polym14061212
Elkolali M, Nogueira LP, Rønning PO, Alcocer A. Void Content Determination of Carbon Fiber Reinforced Polymers: A Comparison between Destructive and Non-Destructive Methods. Polymers. 2022; 14(6):1212. https://doi.org/10.3390/polym14061212
Chicago/Turabian StyleElkolali, Moustafa, Liebert Parreiras Nogueira, Per Ola Rønning, and Alex Alcocer. 2022. "Void Content Determination of Carbon Fiber Reinforced Polymers: A Comparison between Destructive and Non-Destructive Methods" Polymers 14, no. 6: 1212. https://doi.org/10.3390/polym14061212
APA StyleElkolali, M., Nogueira, L. P., Rønning, P. O., & Alcocer, A. (2022). Void Content Determination of Carbon Fiber Reinforced Polymers: A Comparison between Destructive and Non-Destructive Methods. Polymers, 14(6), 1212. https://doi.org/10.3390/polym14061212