
Cyclic Compression Testing of Three Elastomer Types—A Thermoplastic Vulcanizate Elastomer, a Liquid Silicone Rubber and Two Ethylene-Propylene-Diene Rubbers


Abstract
:
1. Introduction
- The polymer chain network: The properties of the network depend on the distribution of chain segment lengths between crosslinks, and the type of crosslink (which affects flexibility and strength). Shorter segments between crosslinks give smaller hysteresis loss and lower compression set. The properties of the network are also affected by its chain entanglements, dangling chains (with one end free), chain loops (with both ends connected to the same crosslink) and unconnected free chains. Note that the network properties, such as crosslink density, may vary within a thick part, which calls for special attention to the curing agents and processing parameters [14,15].
- The interaction between the polymer matrix and the filler particles (e.g., carbon black particles in rubber or rubber particles in TPVs): The interphase between matrix and particles affects the elastomer performance [16,17]. Adding carbon black to a rubber will increase the stiffness, hardness and strength, but it will generally also give a stronger Mullins effect and larger hysteresis [5,17,18]. The interaction between rubber and carbon black particles is partly physical (adsorption) so that an increased surface area of the particles will reduce the Mullins effect and the hysteresis loss [5,17]. Filler particles act as an additional type of crosslink in the network, as they offer connections between polymer chains [17]. Compatibilization between the TPV phases improves the tensile properties, and also reduces the size of the rubber particles [19].
- The filler properties and filler-filler interactions, i.e., surface area, size distribution, dispersion, volume fraction, etc.: Filler particles may agglomerate, and need to be broken up to achieve good dispersion. Silica particles are harder to disperse than carbon black particles, due to the stronger interaction between silica particles (hydrogen bonds) than between carbon black particles (van der Waals) [5,6,20].
2. Materials and Methods
2.1. Materials and Specimen Preparation
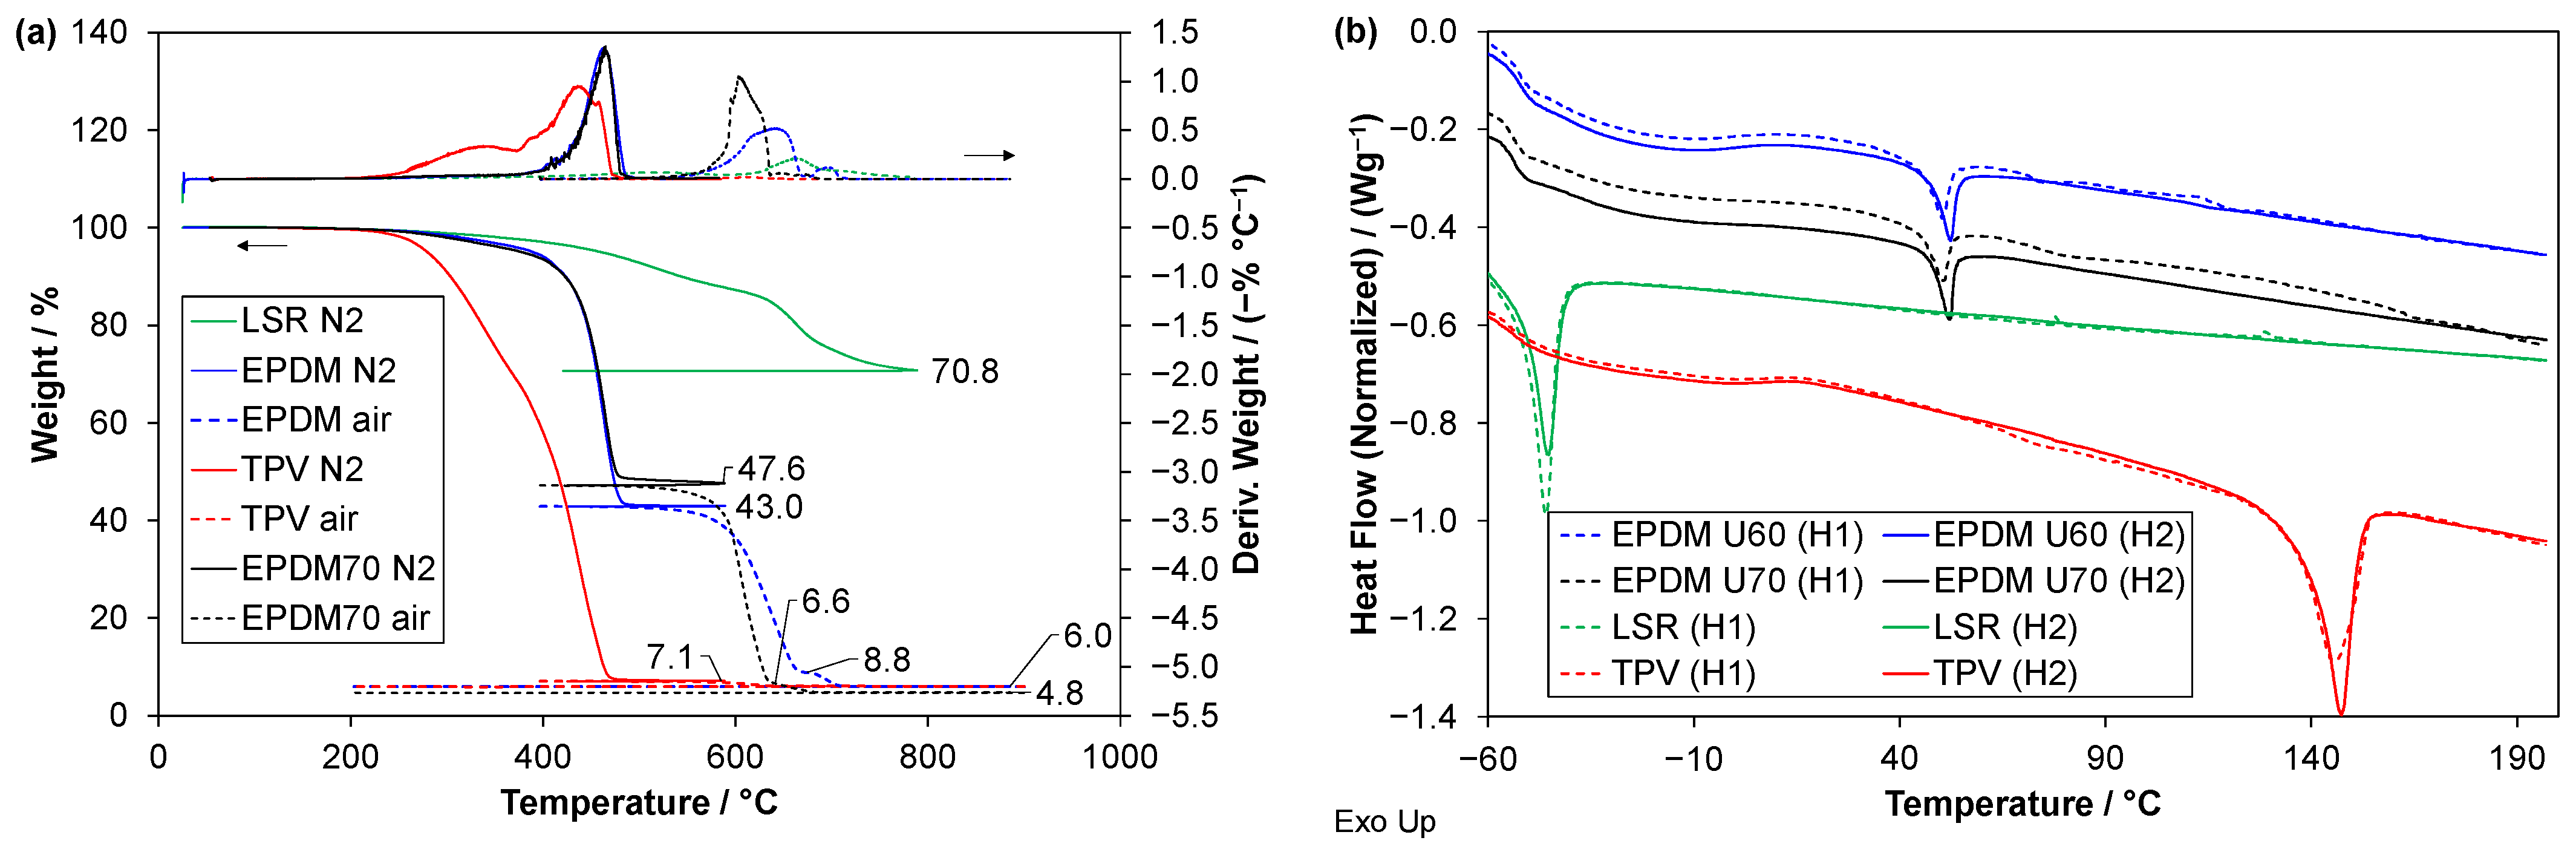
2.2. Thermal Characterization
2.3. Mechanical Testing
2.3.1. Description of Tests and Procedures
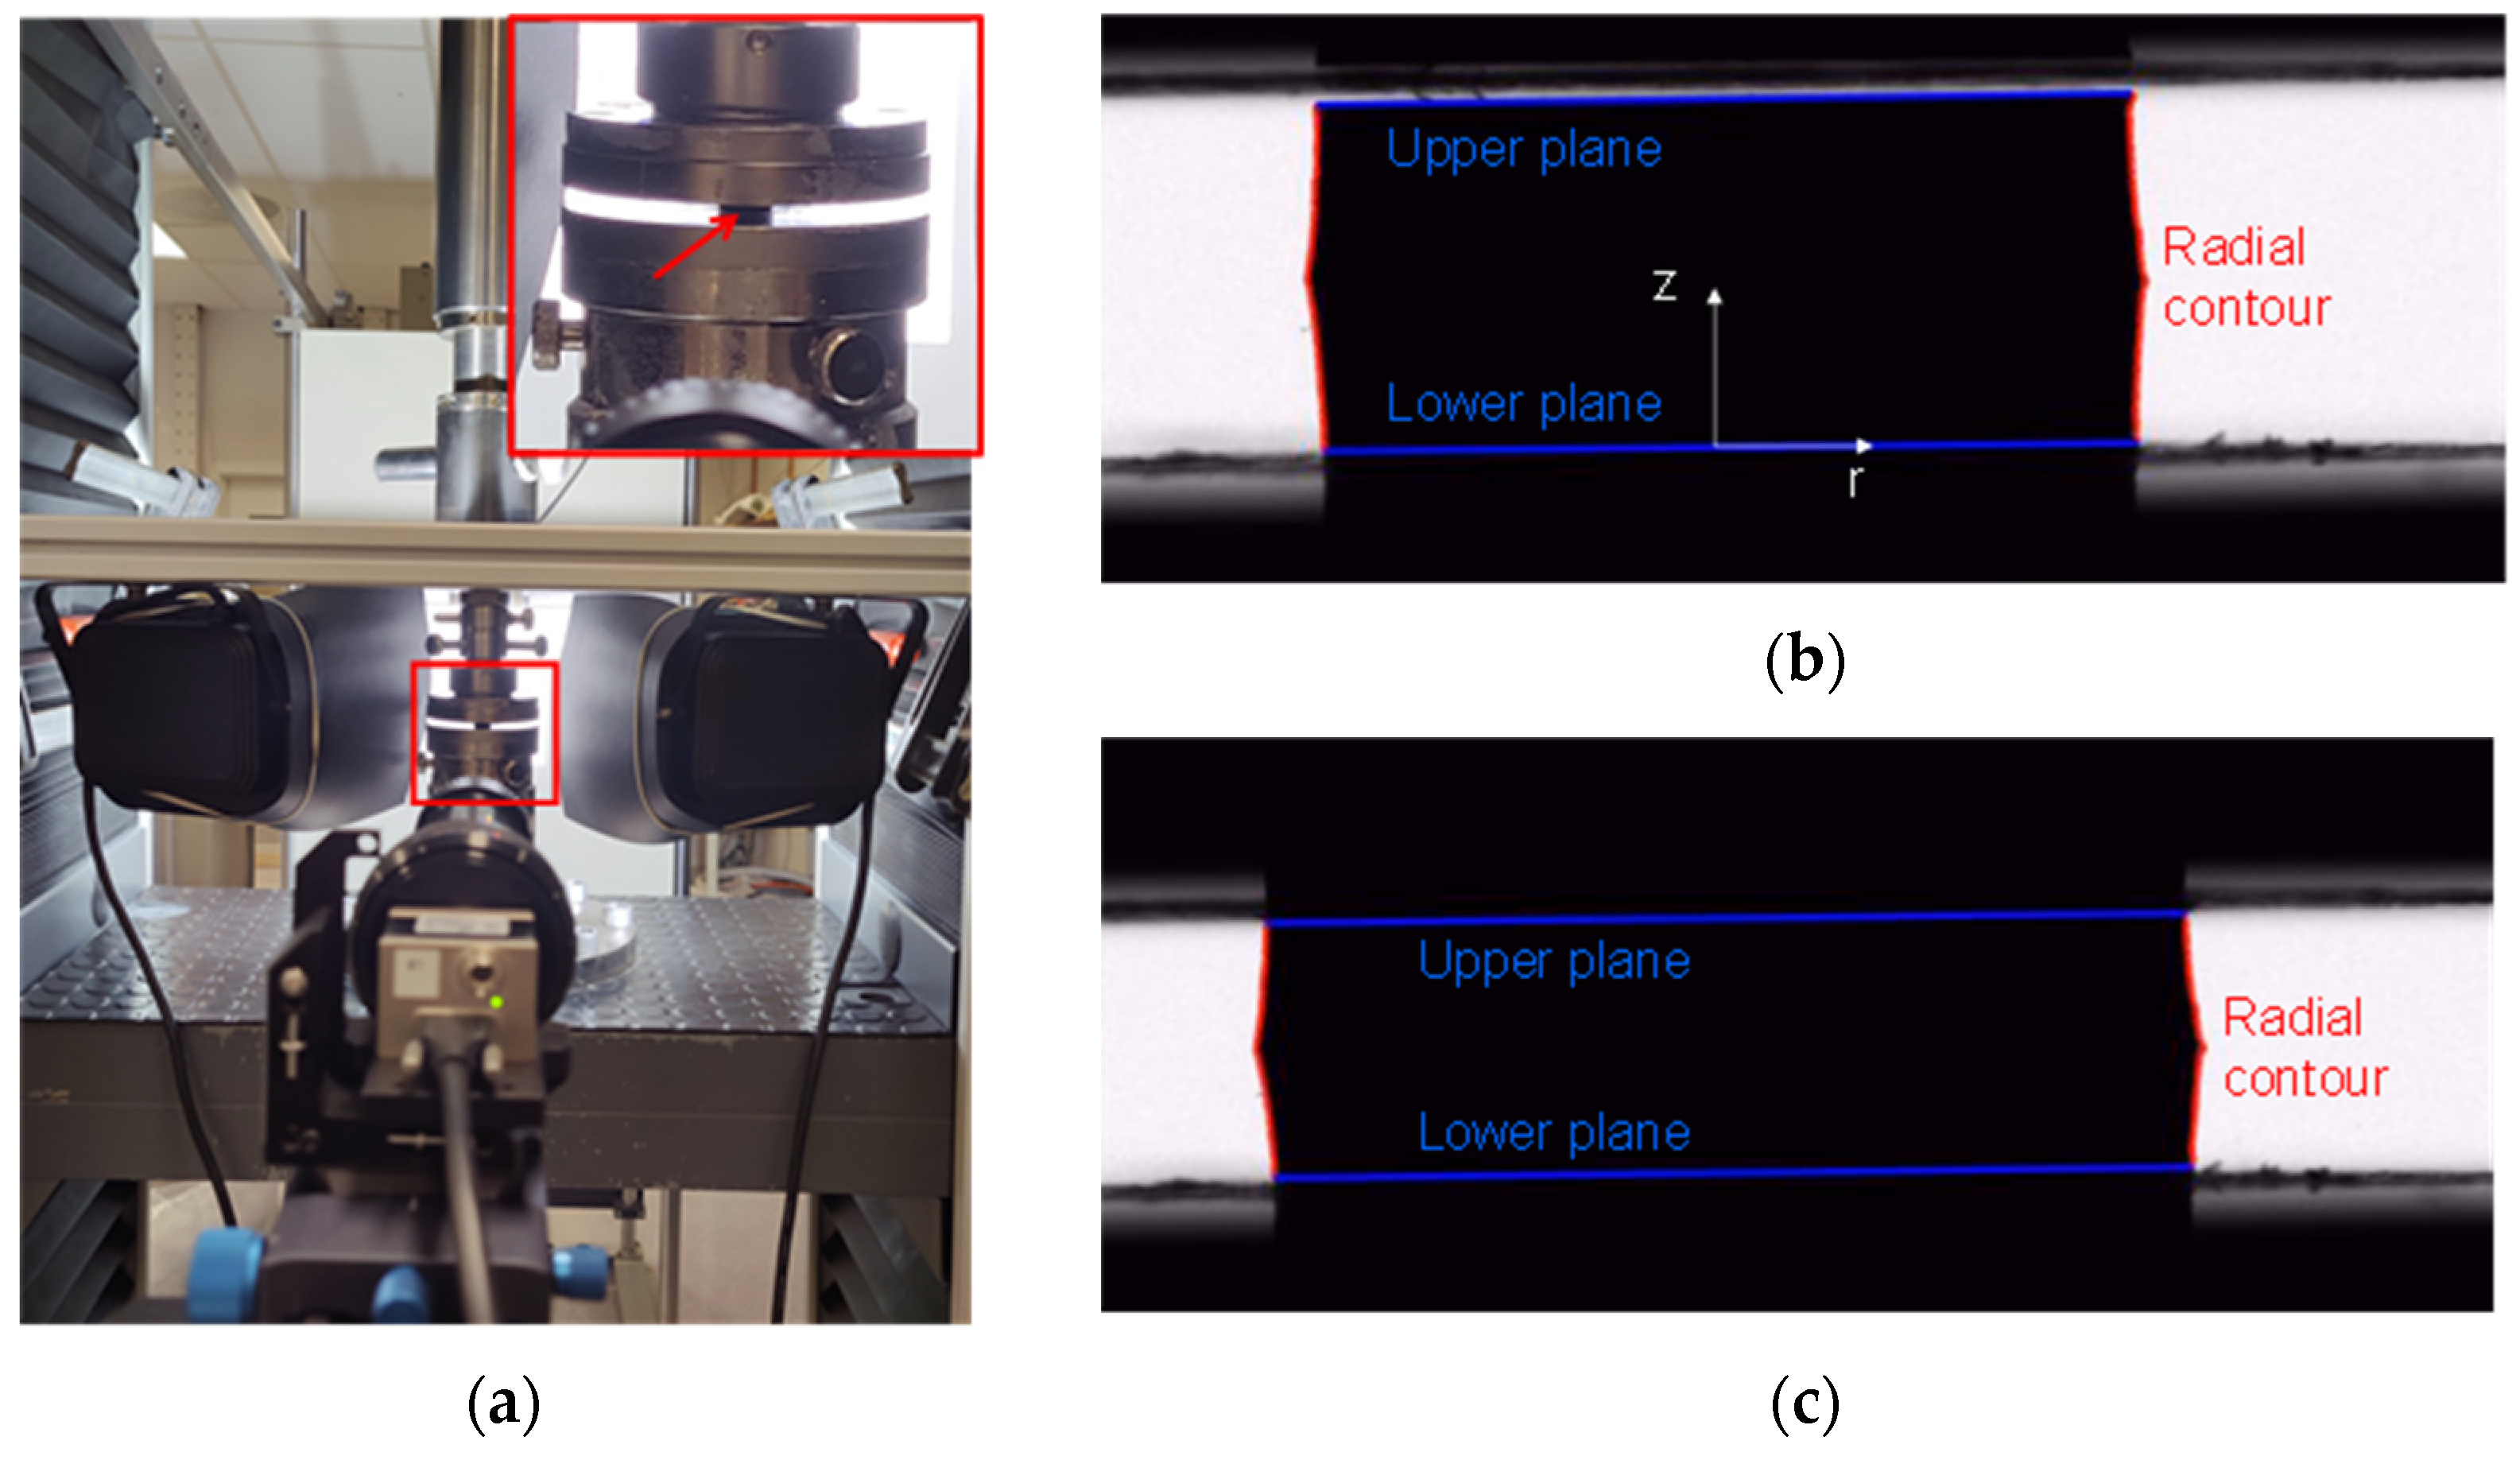
2.3.2. Optical Measurements of Radial Displacement
2.3.3. Parameters Derived from the Compression Tests
3. Results
3.1. Thermal Characterization
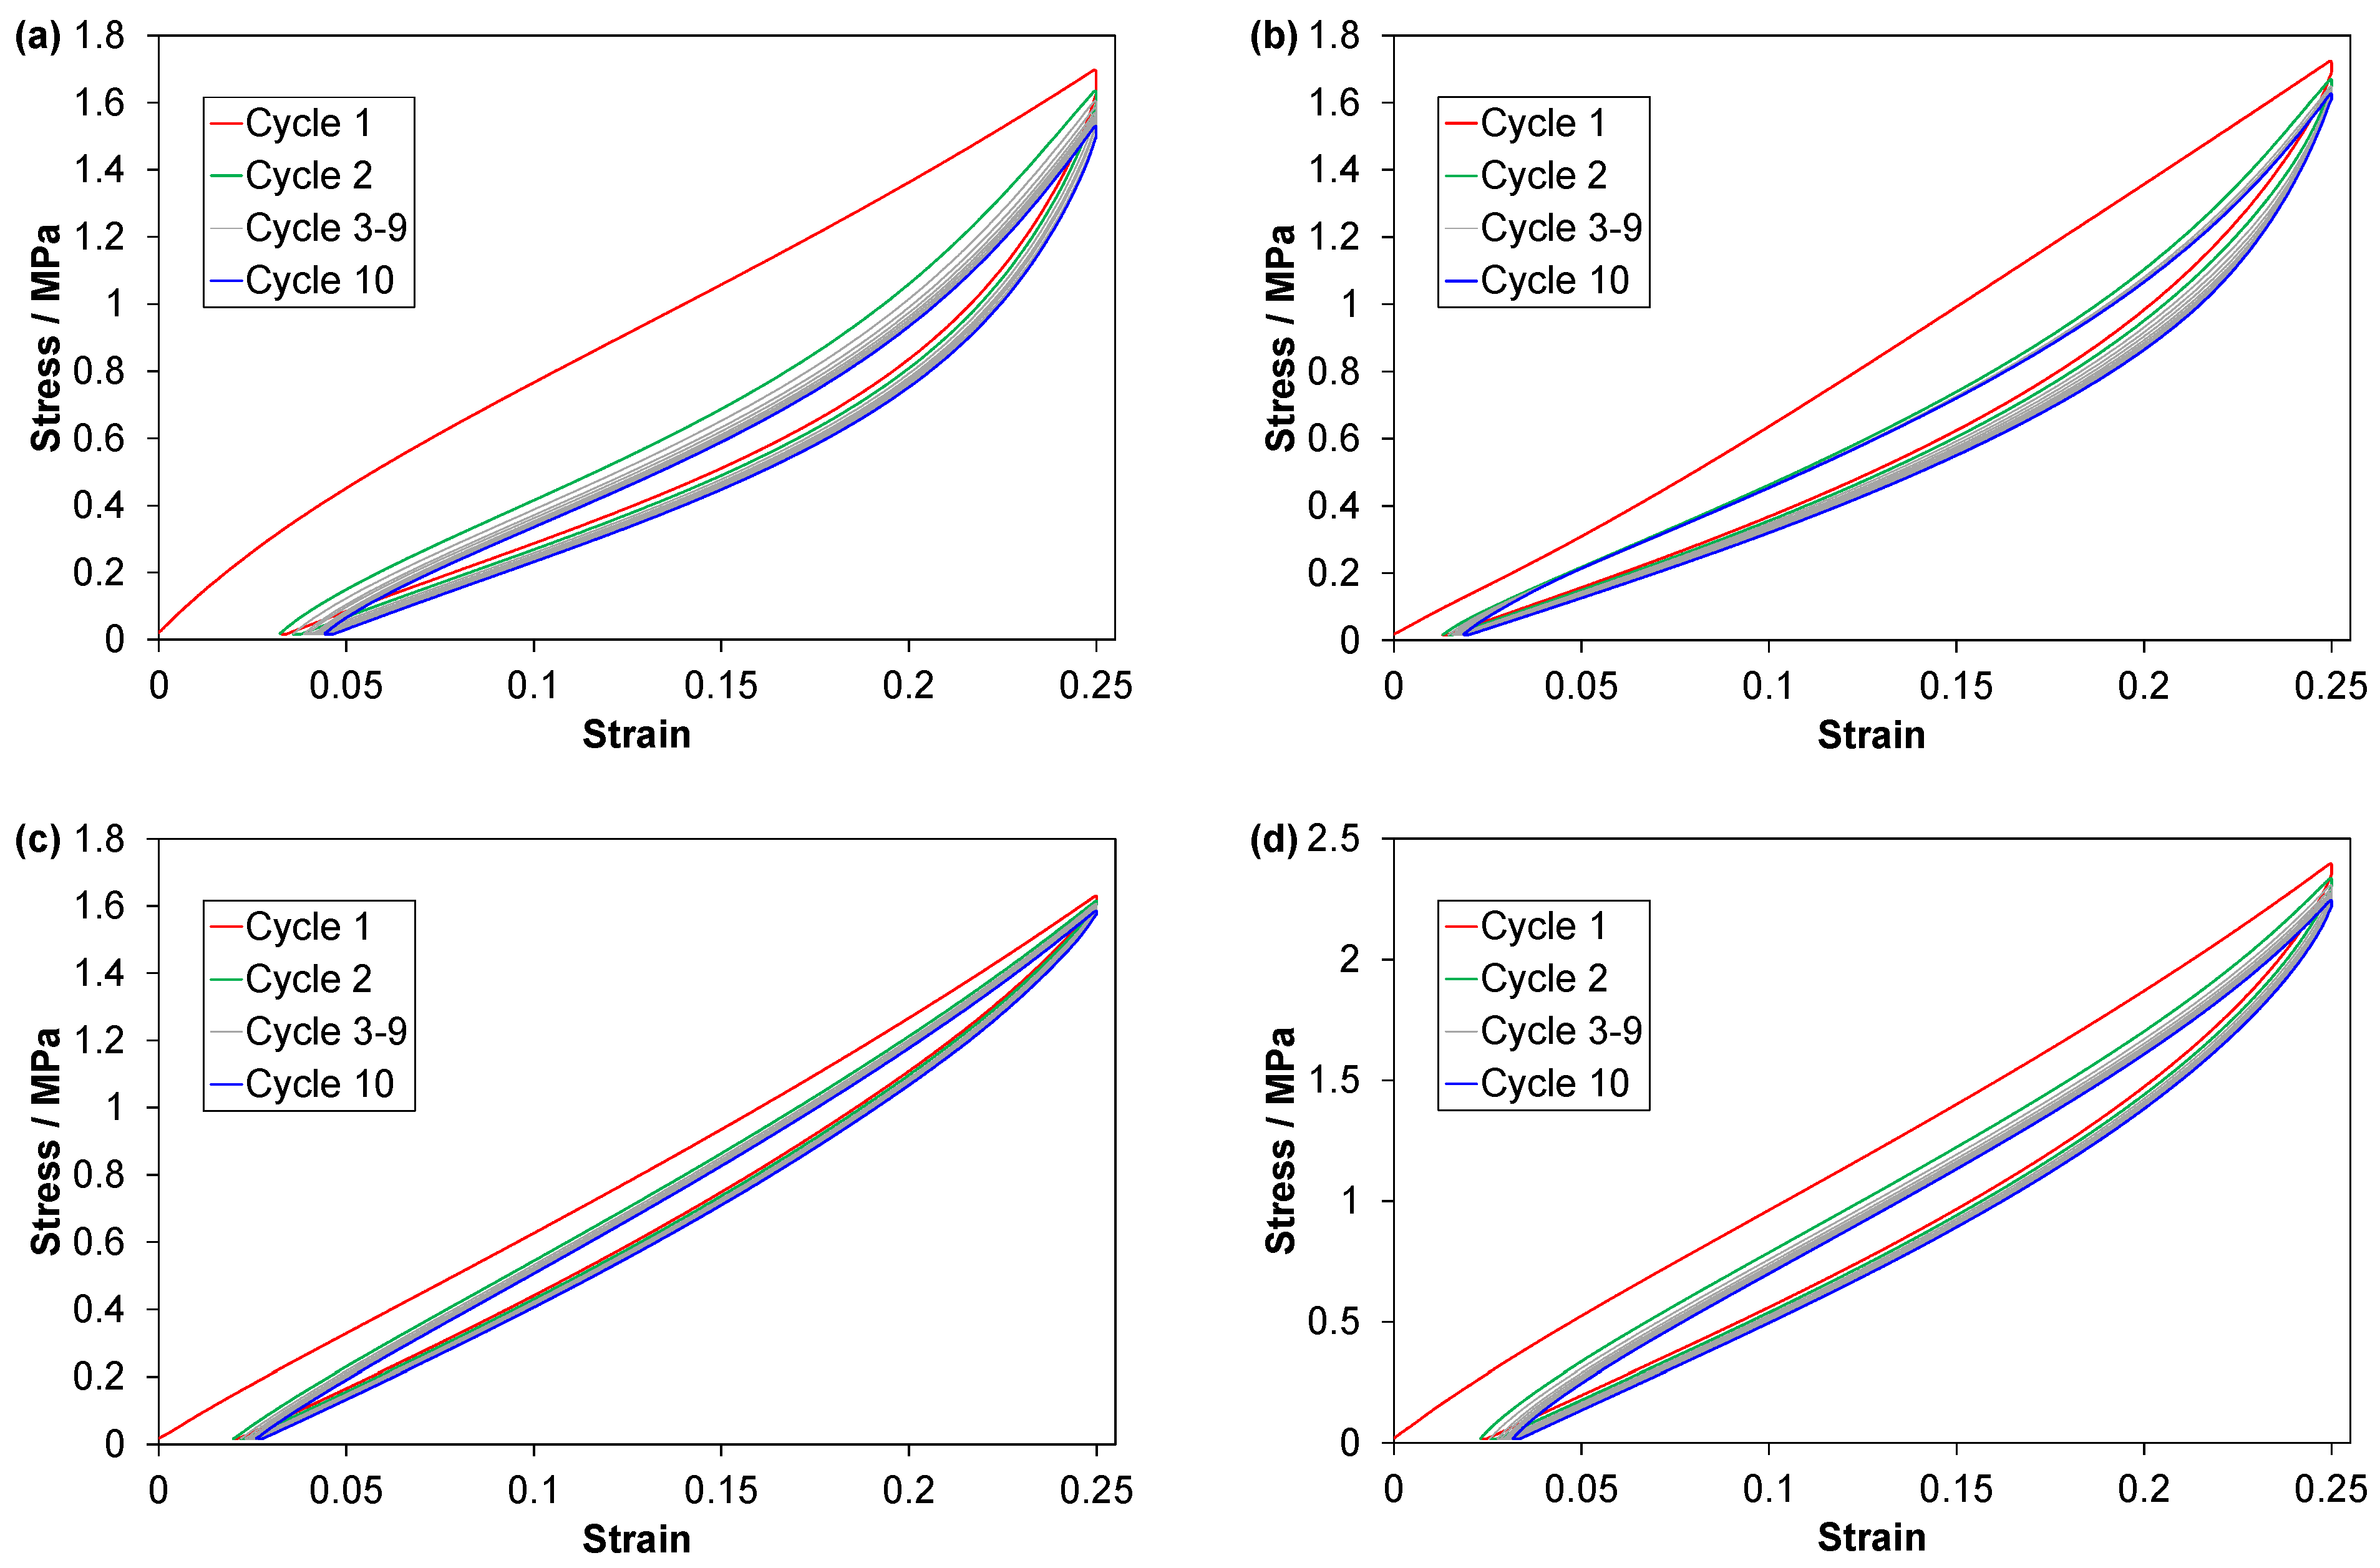
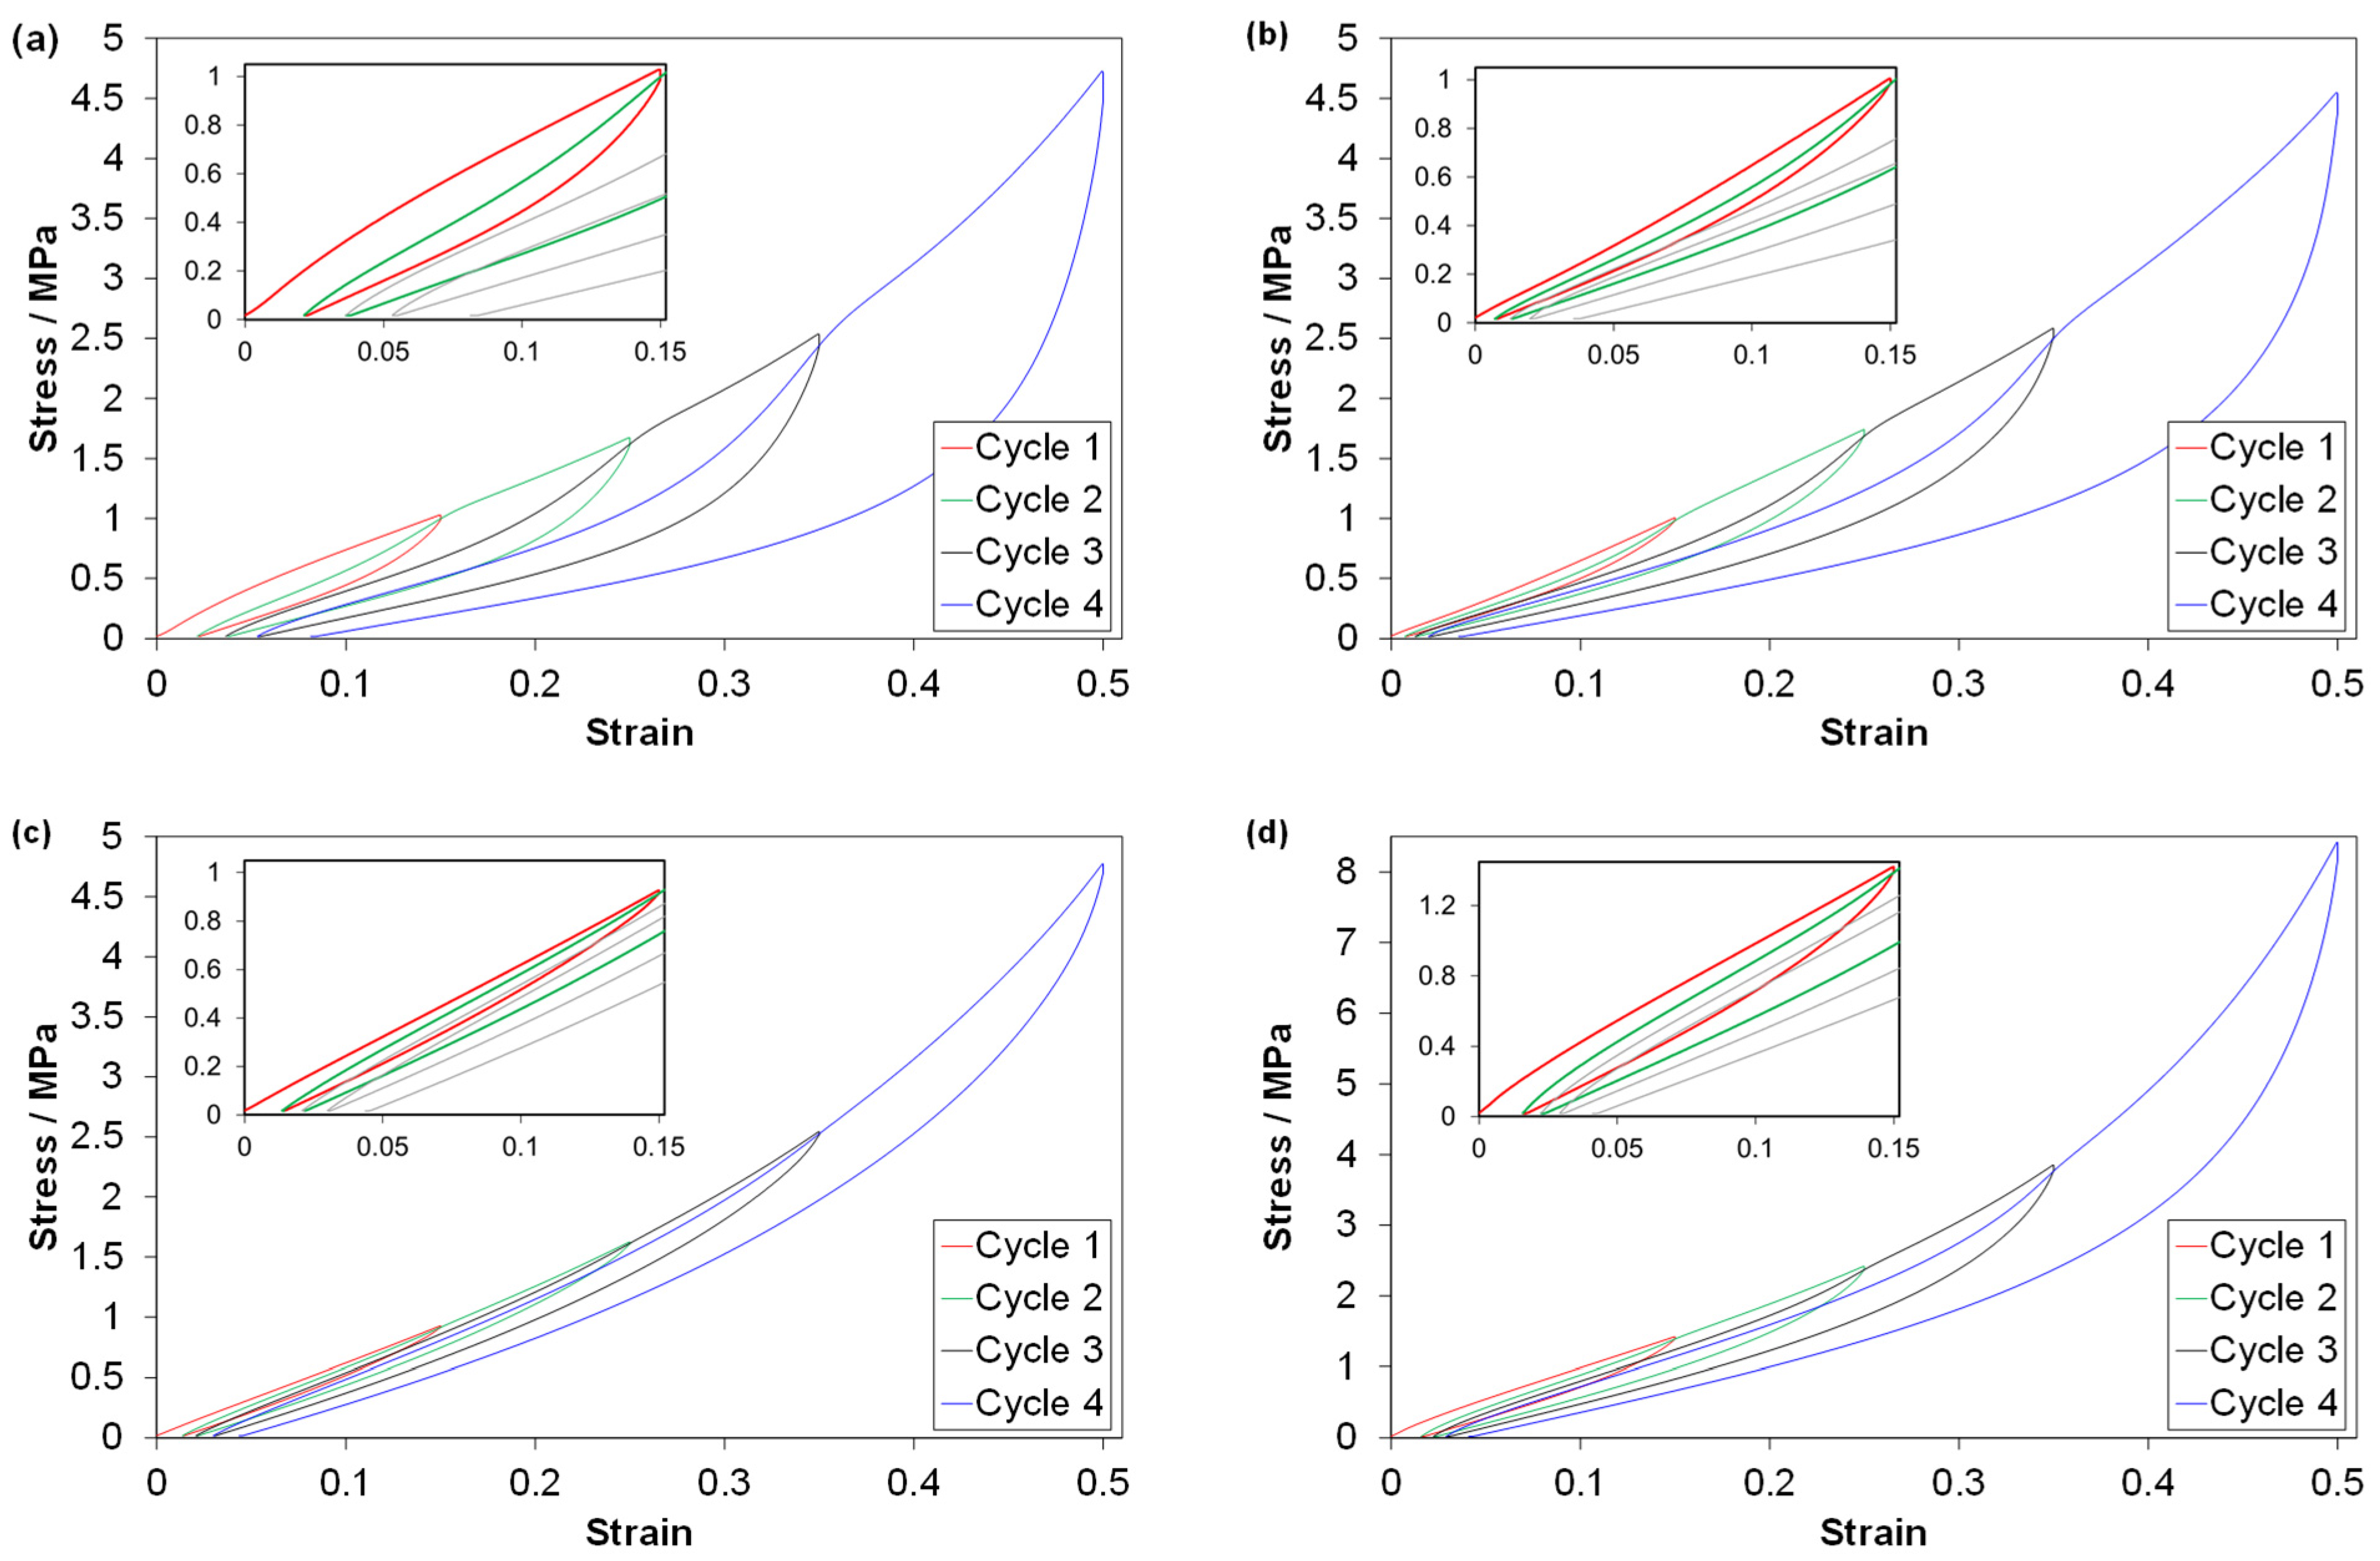
3.2. Cyclic Compression Tests
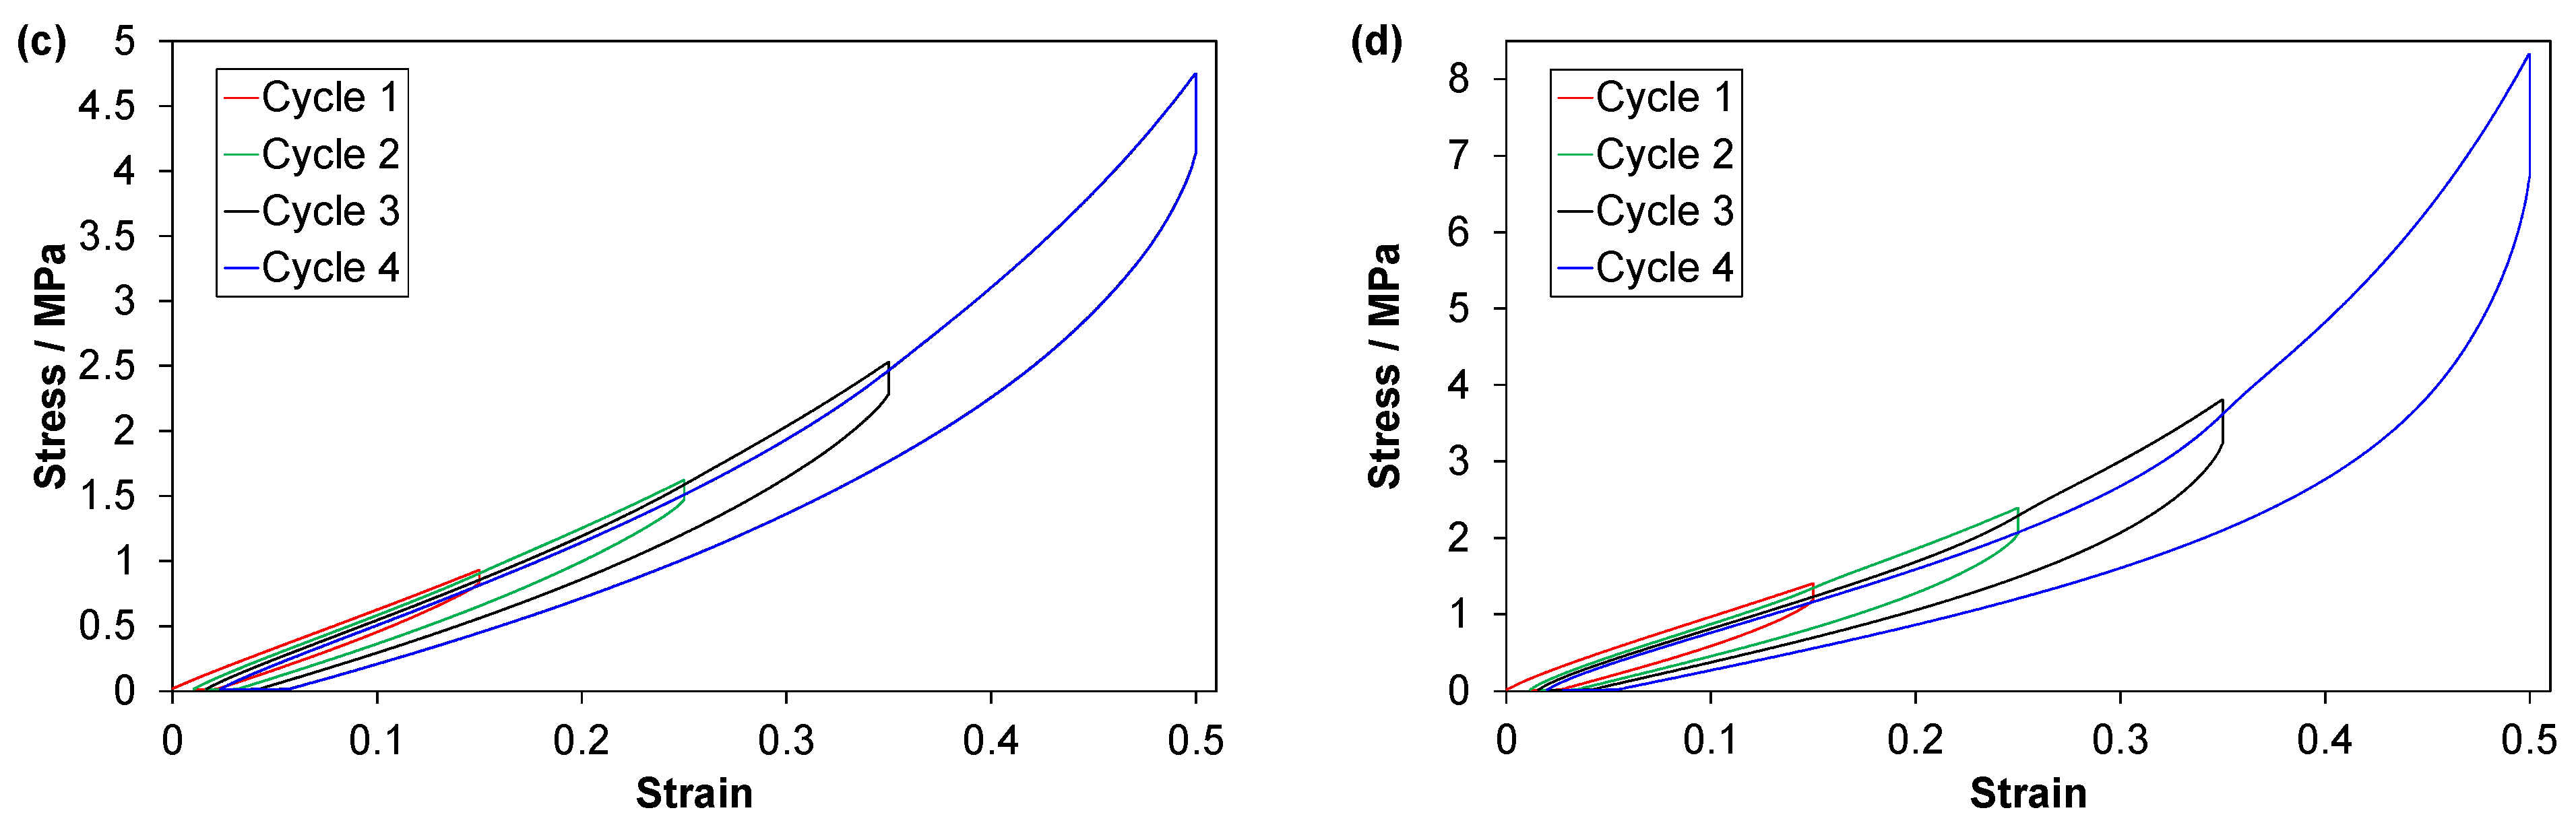
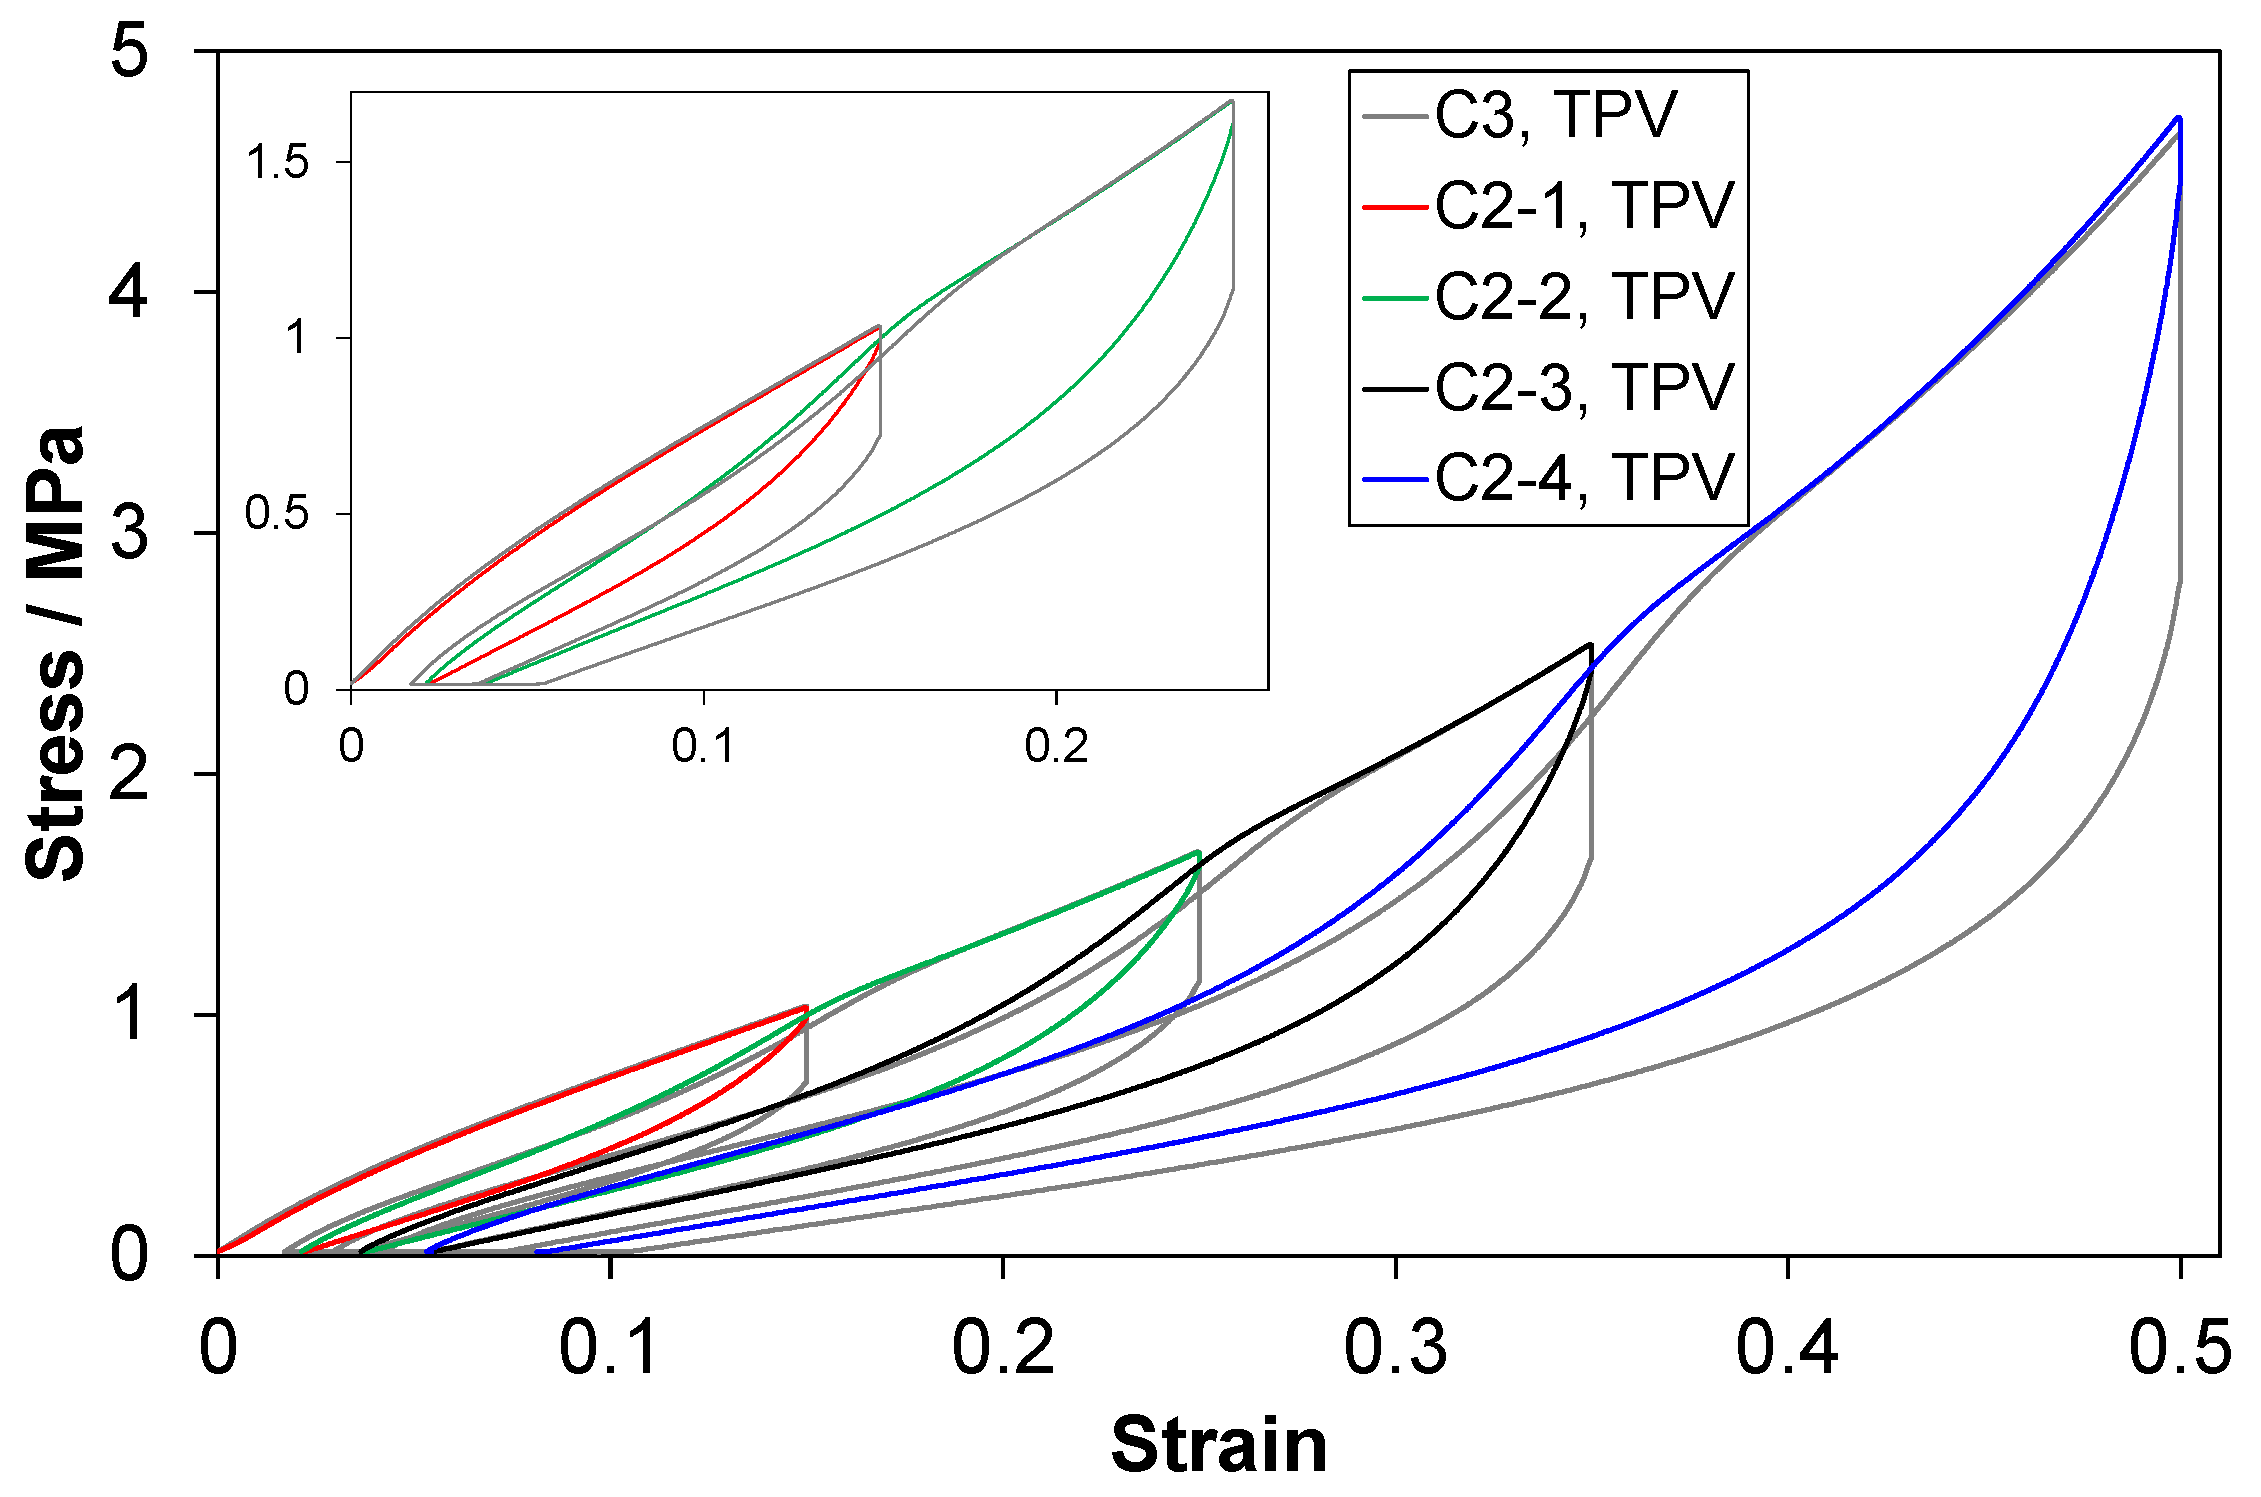
3.2.1. Main Characteristics of the Stress-Strain Curves
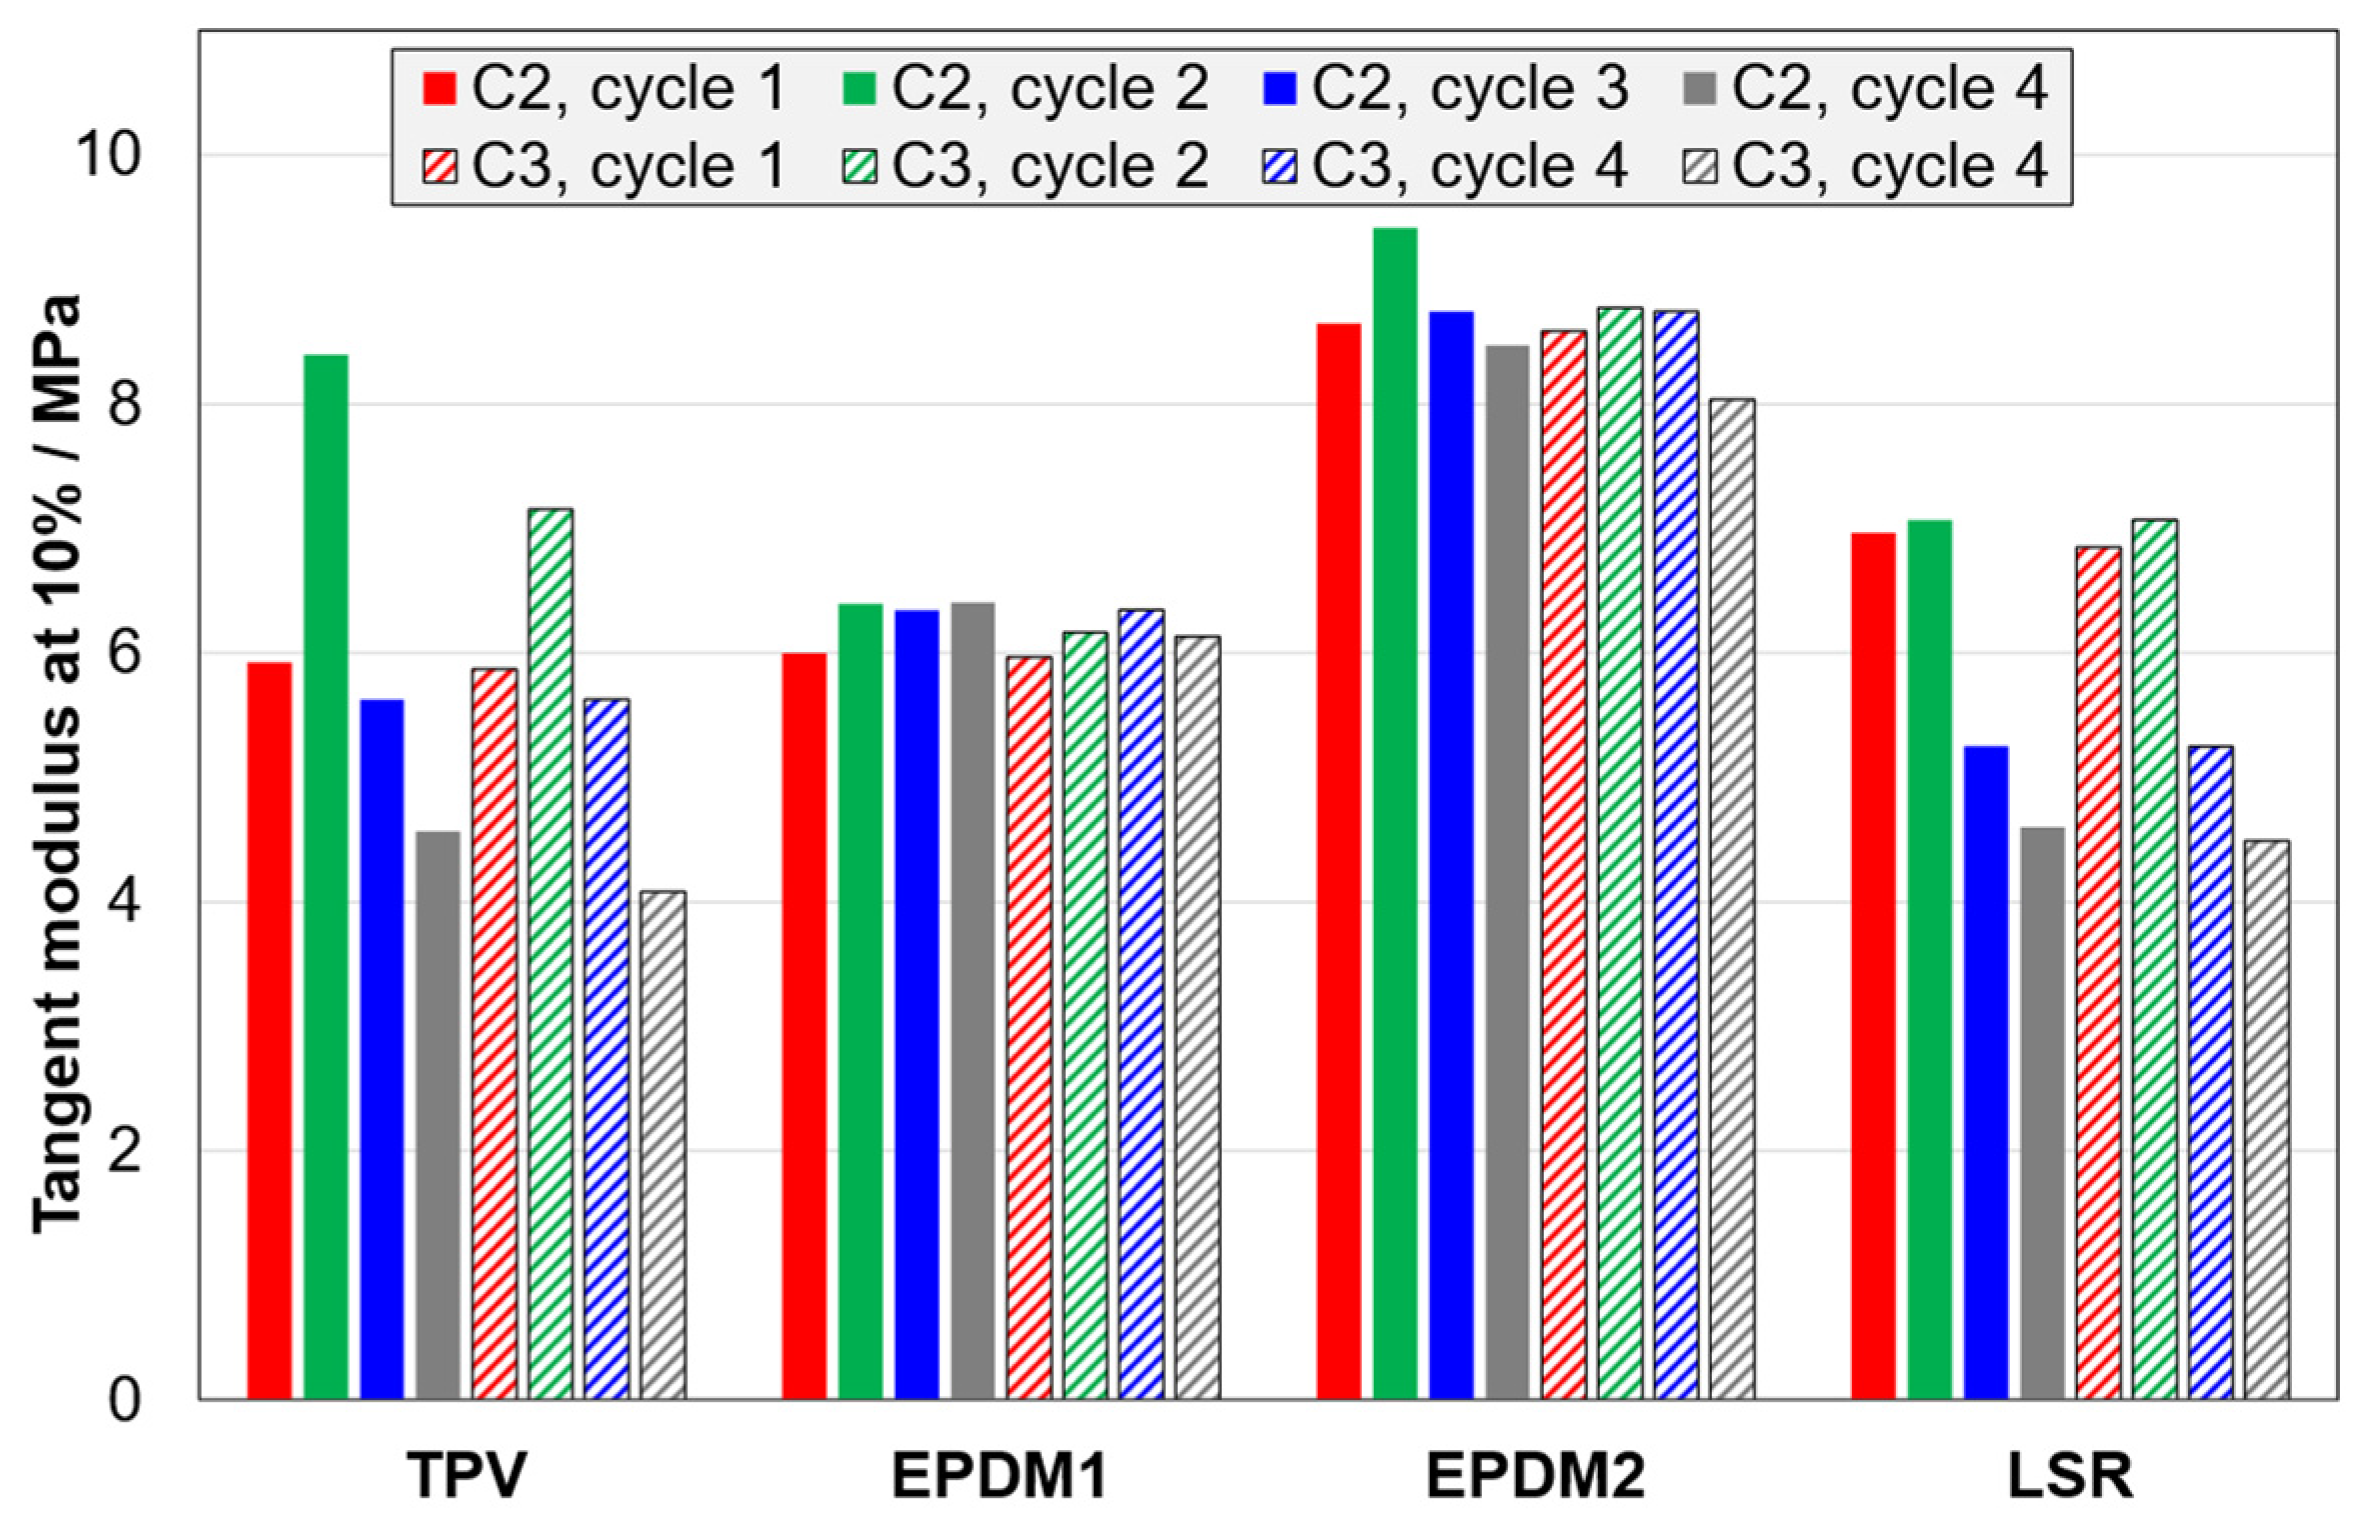
3.2.2. Loading Curves; Modulus, Peak Stress and Mullins Effect
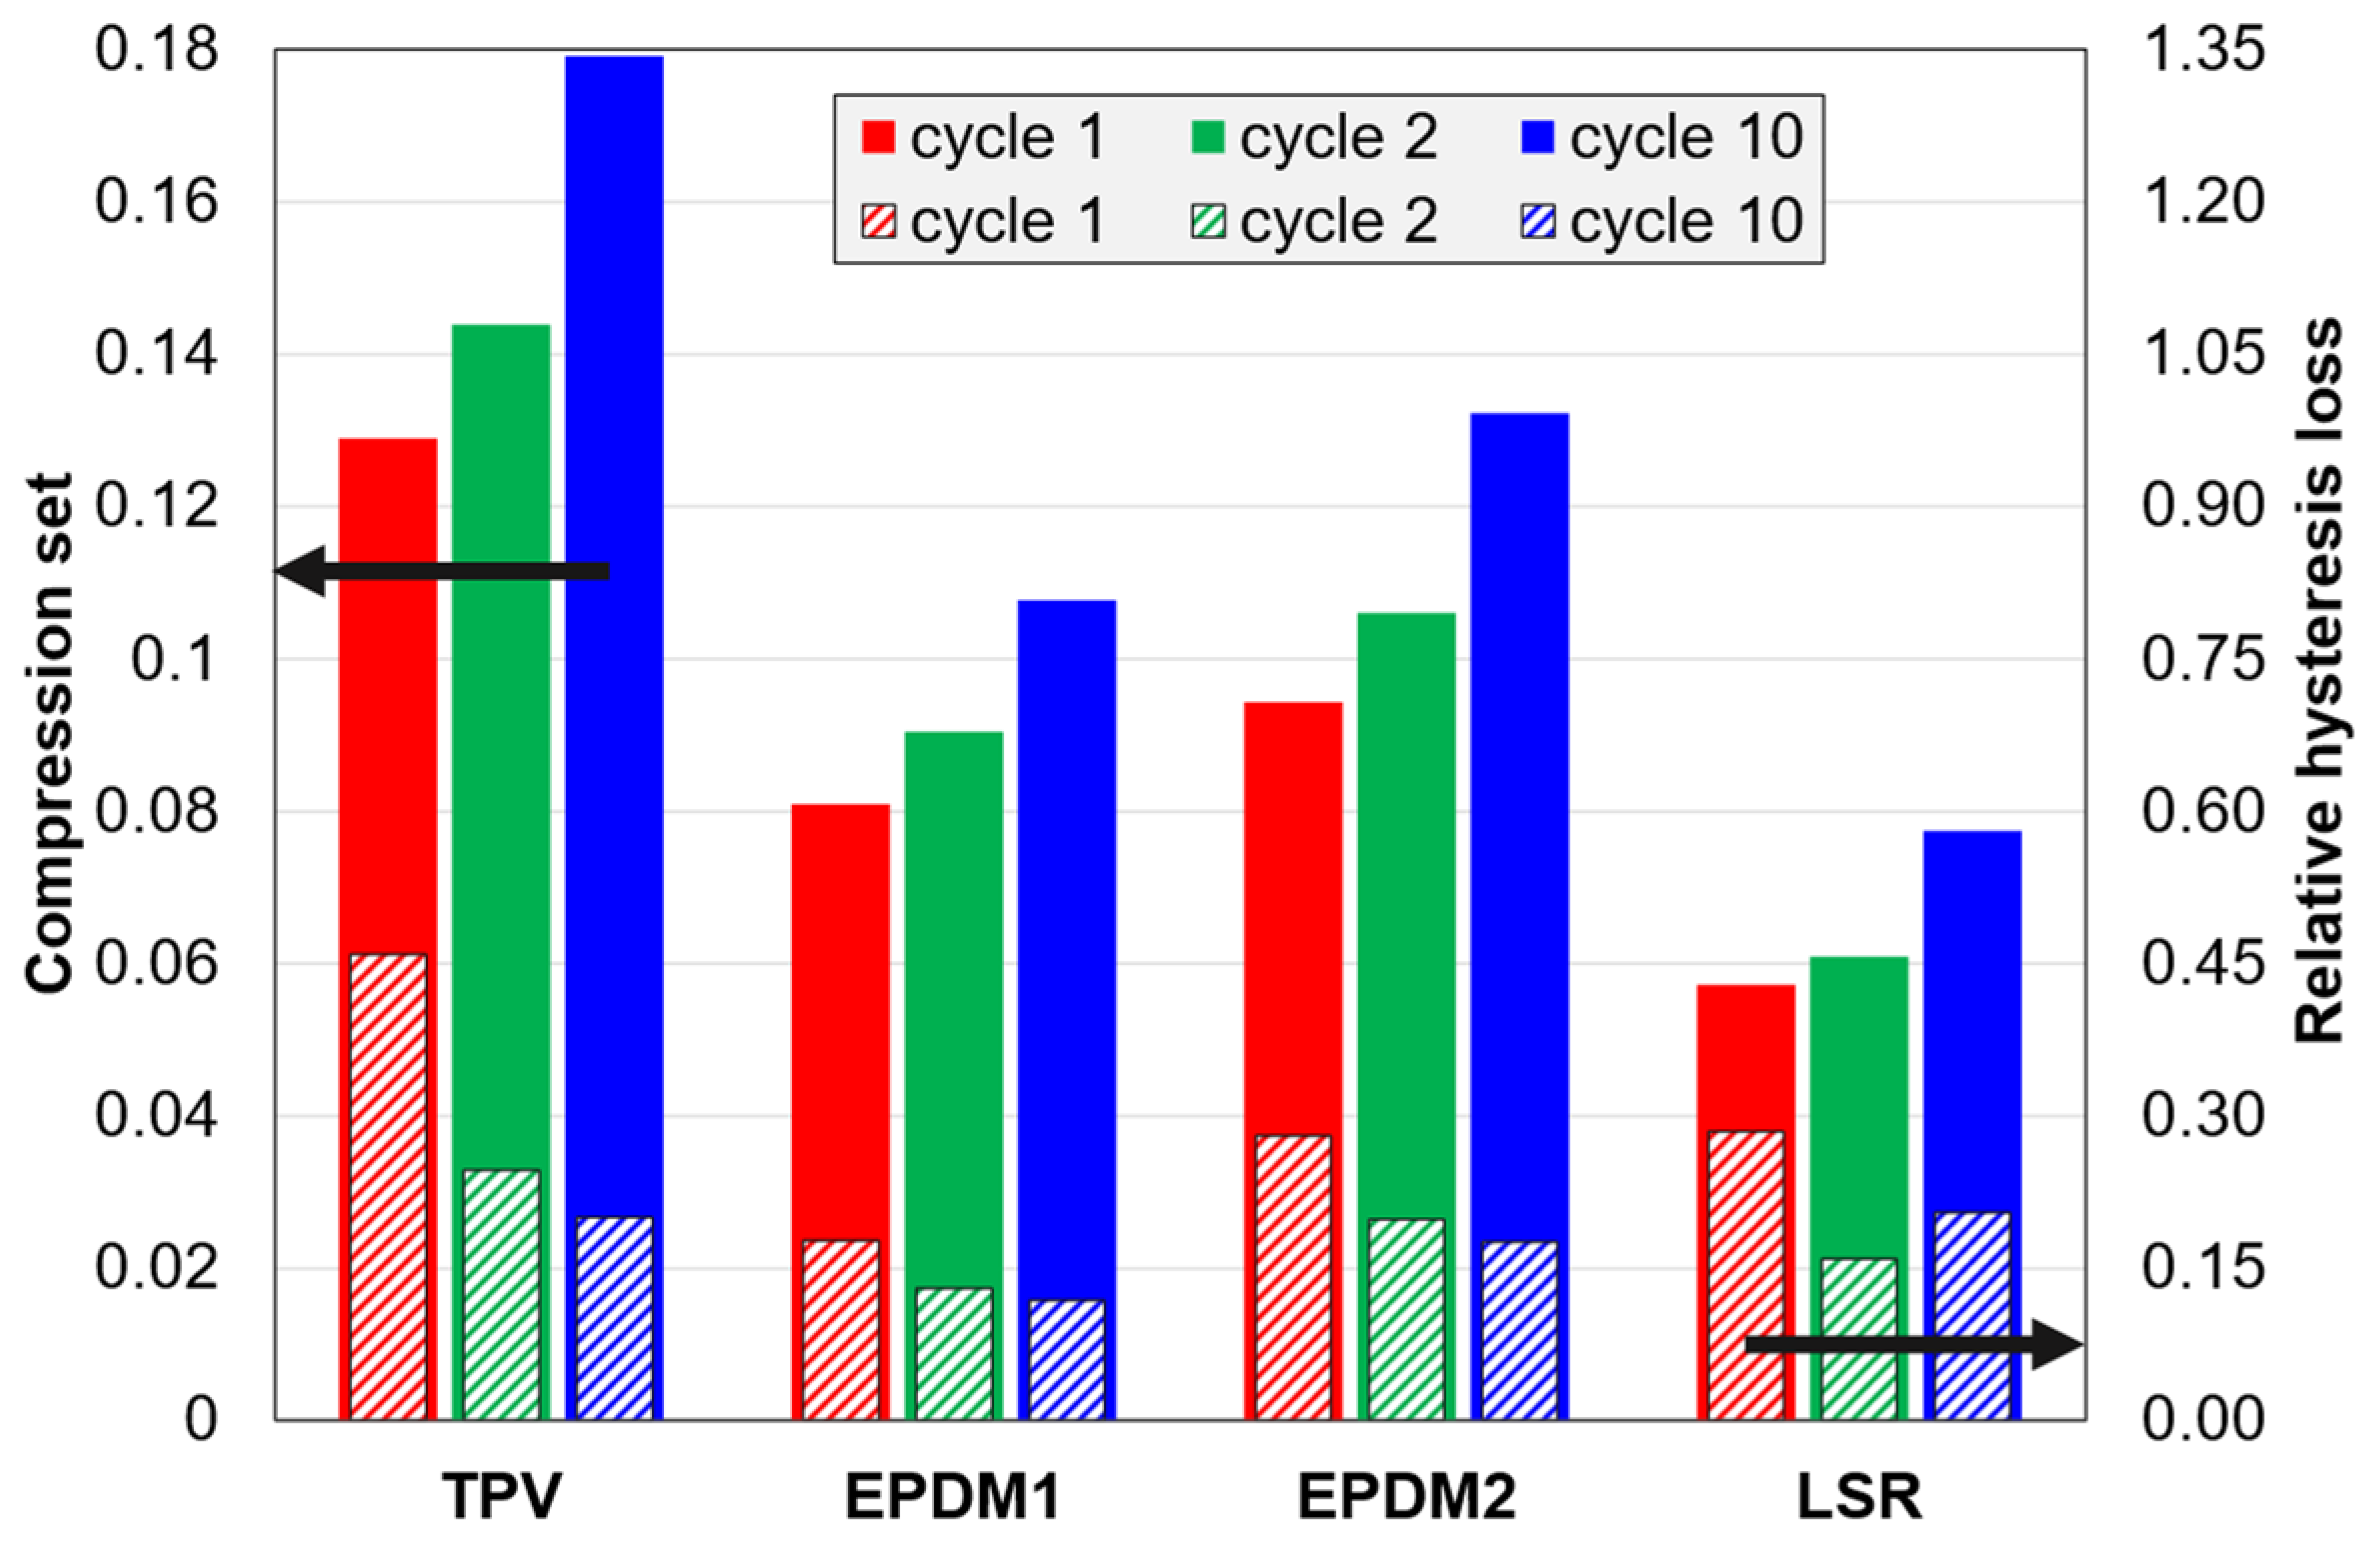
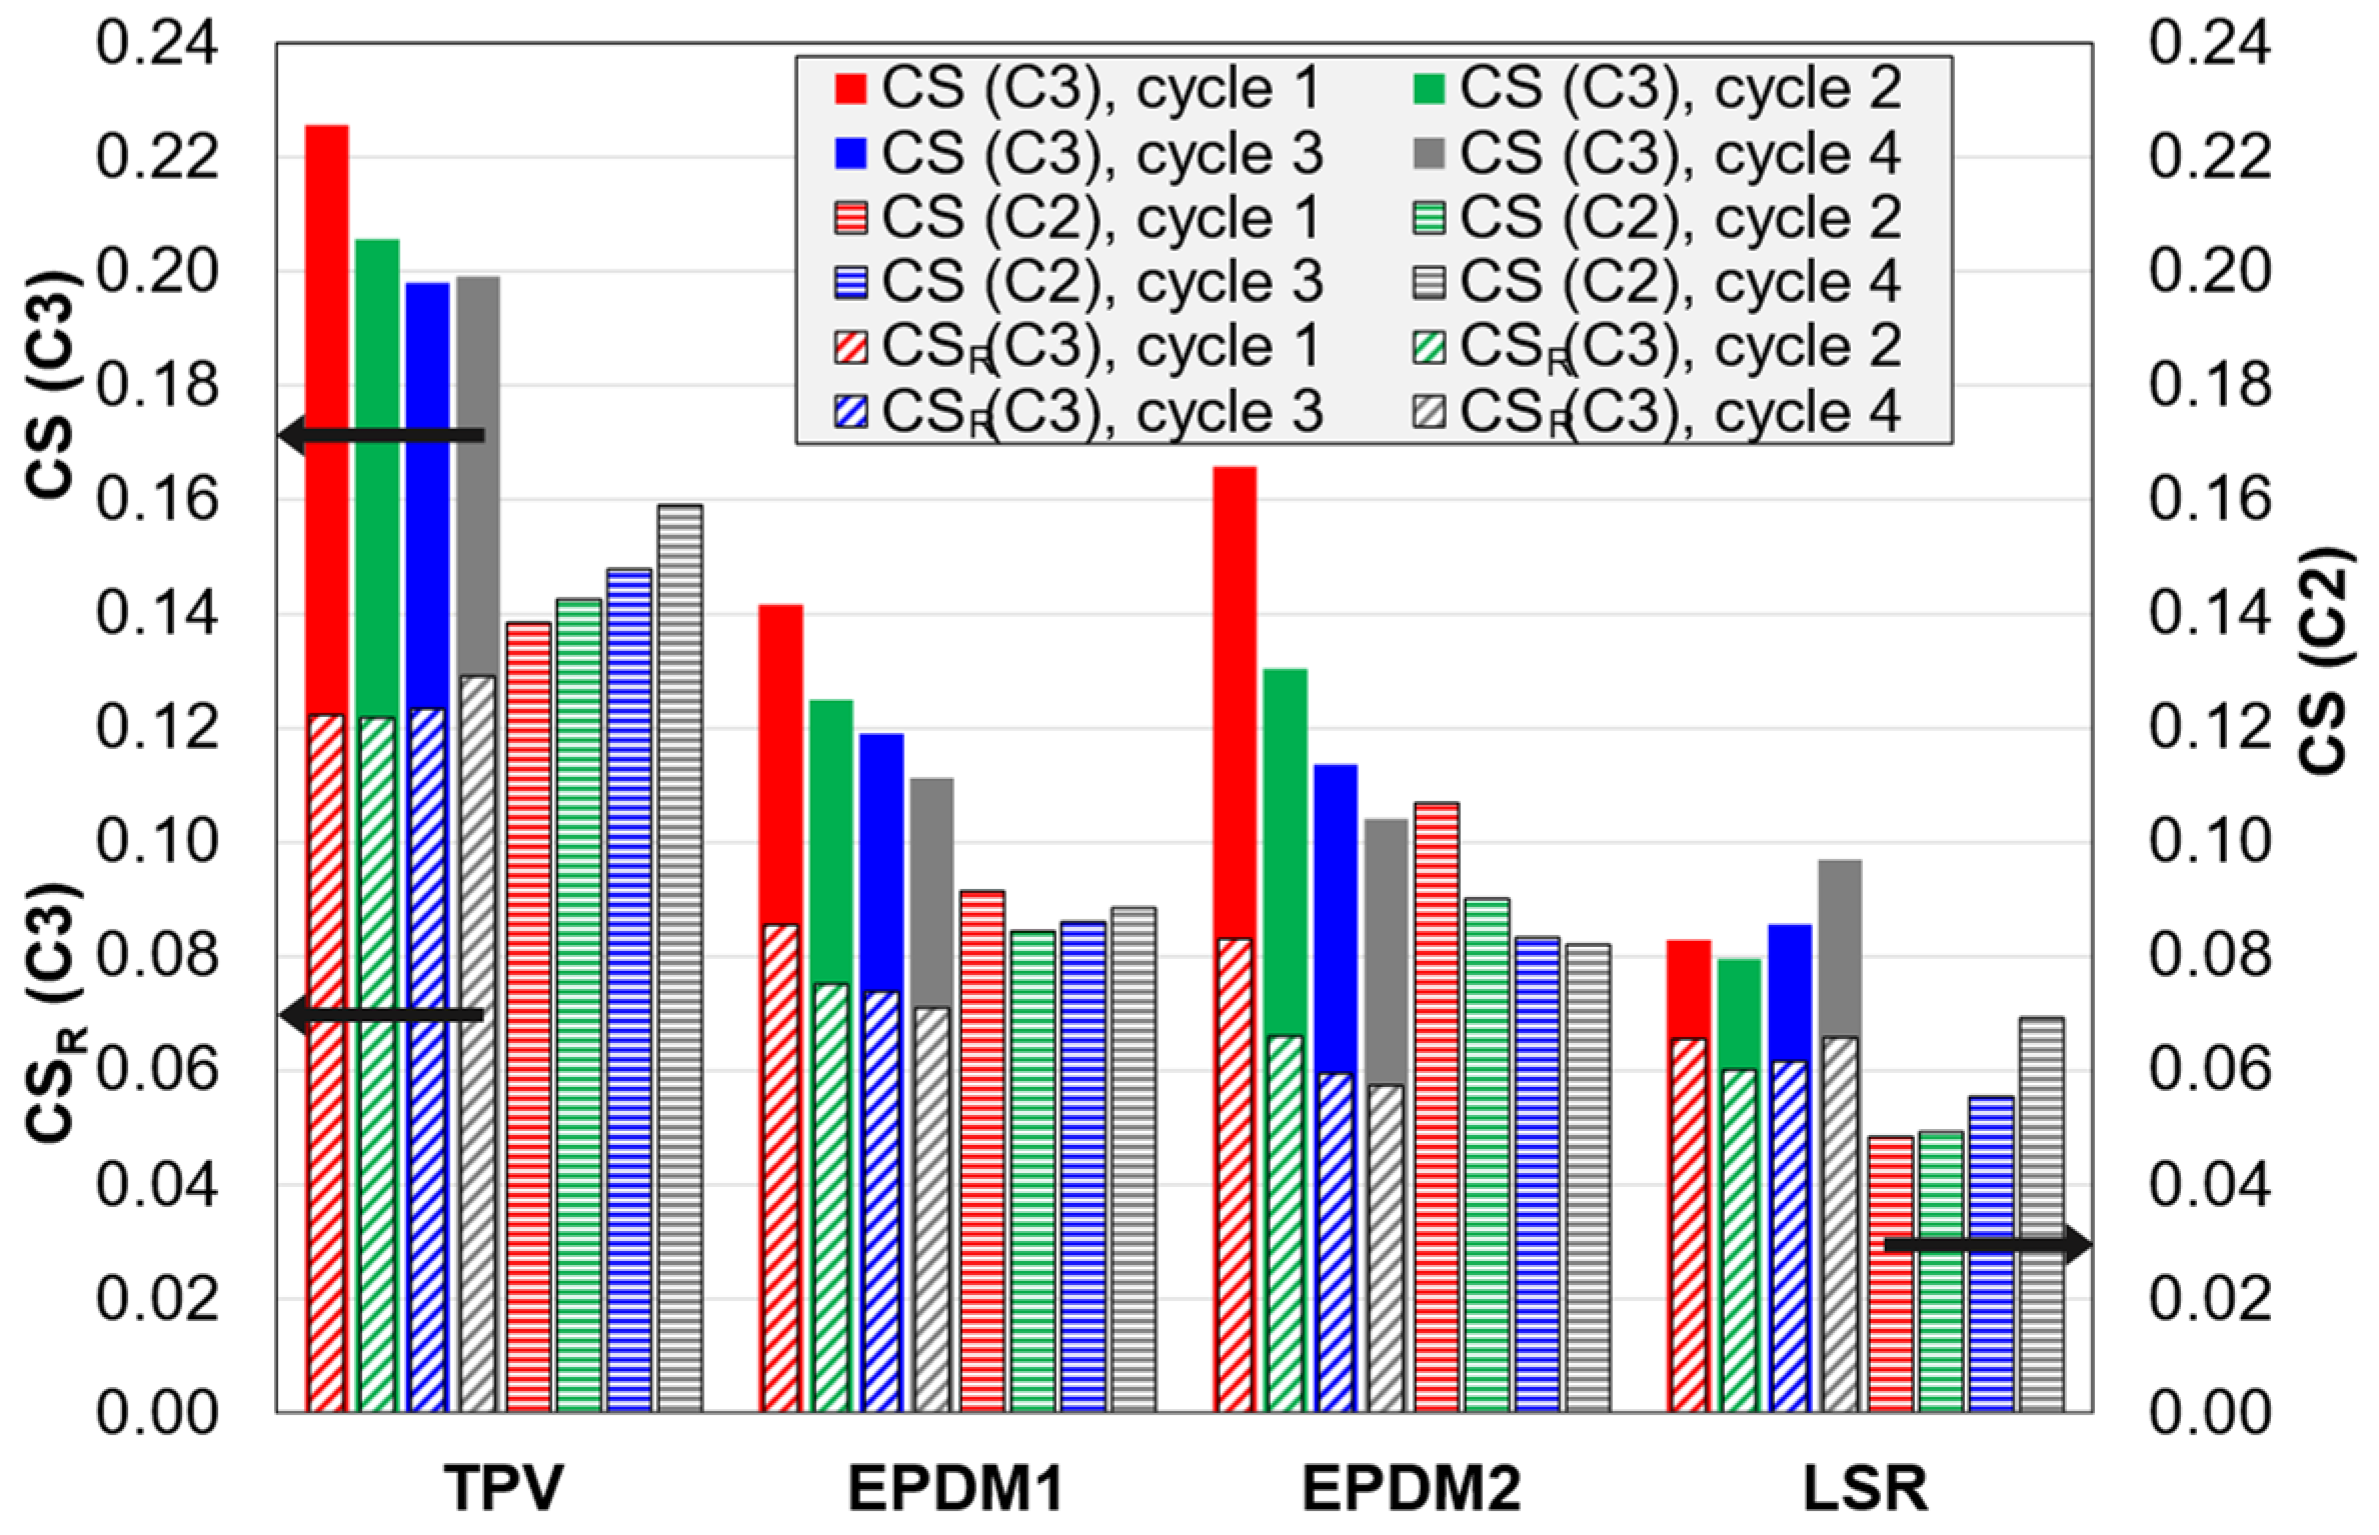
3.2.3. Compression Set and Hysteresis Loss
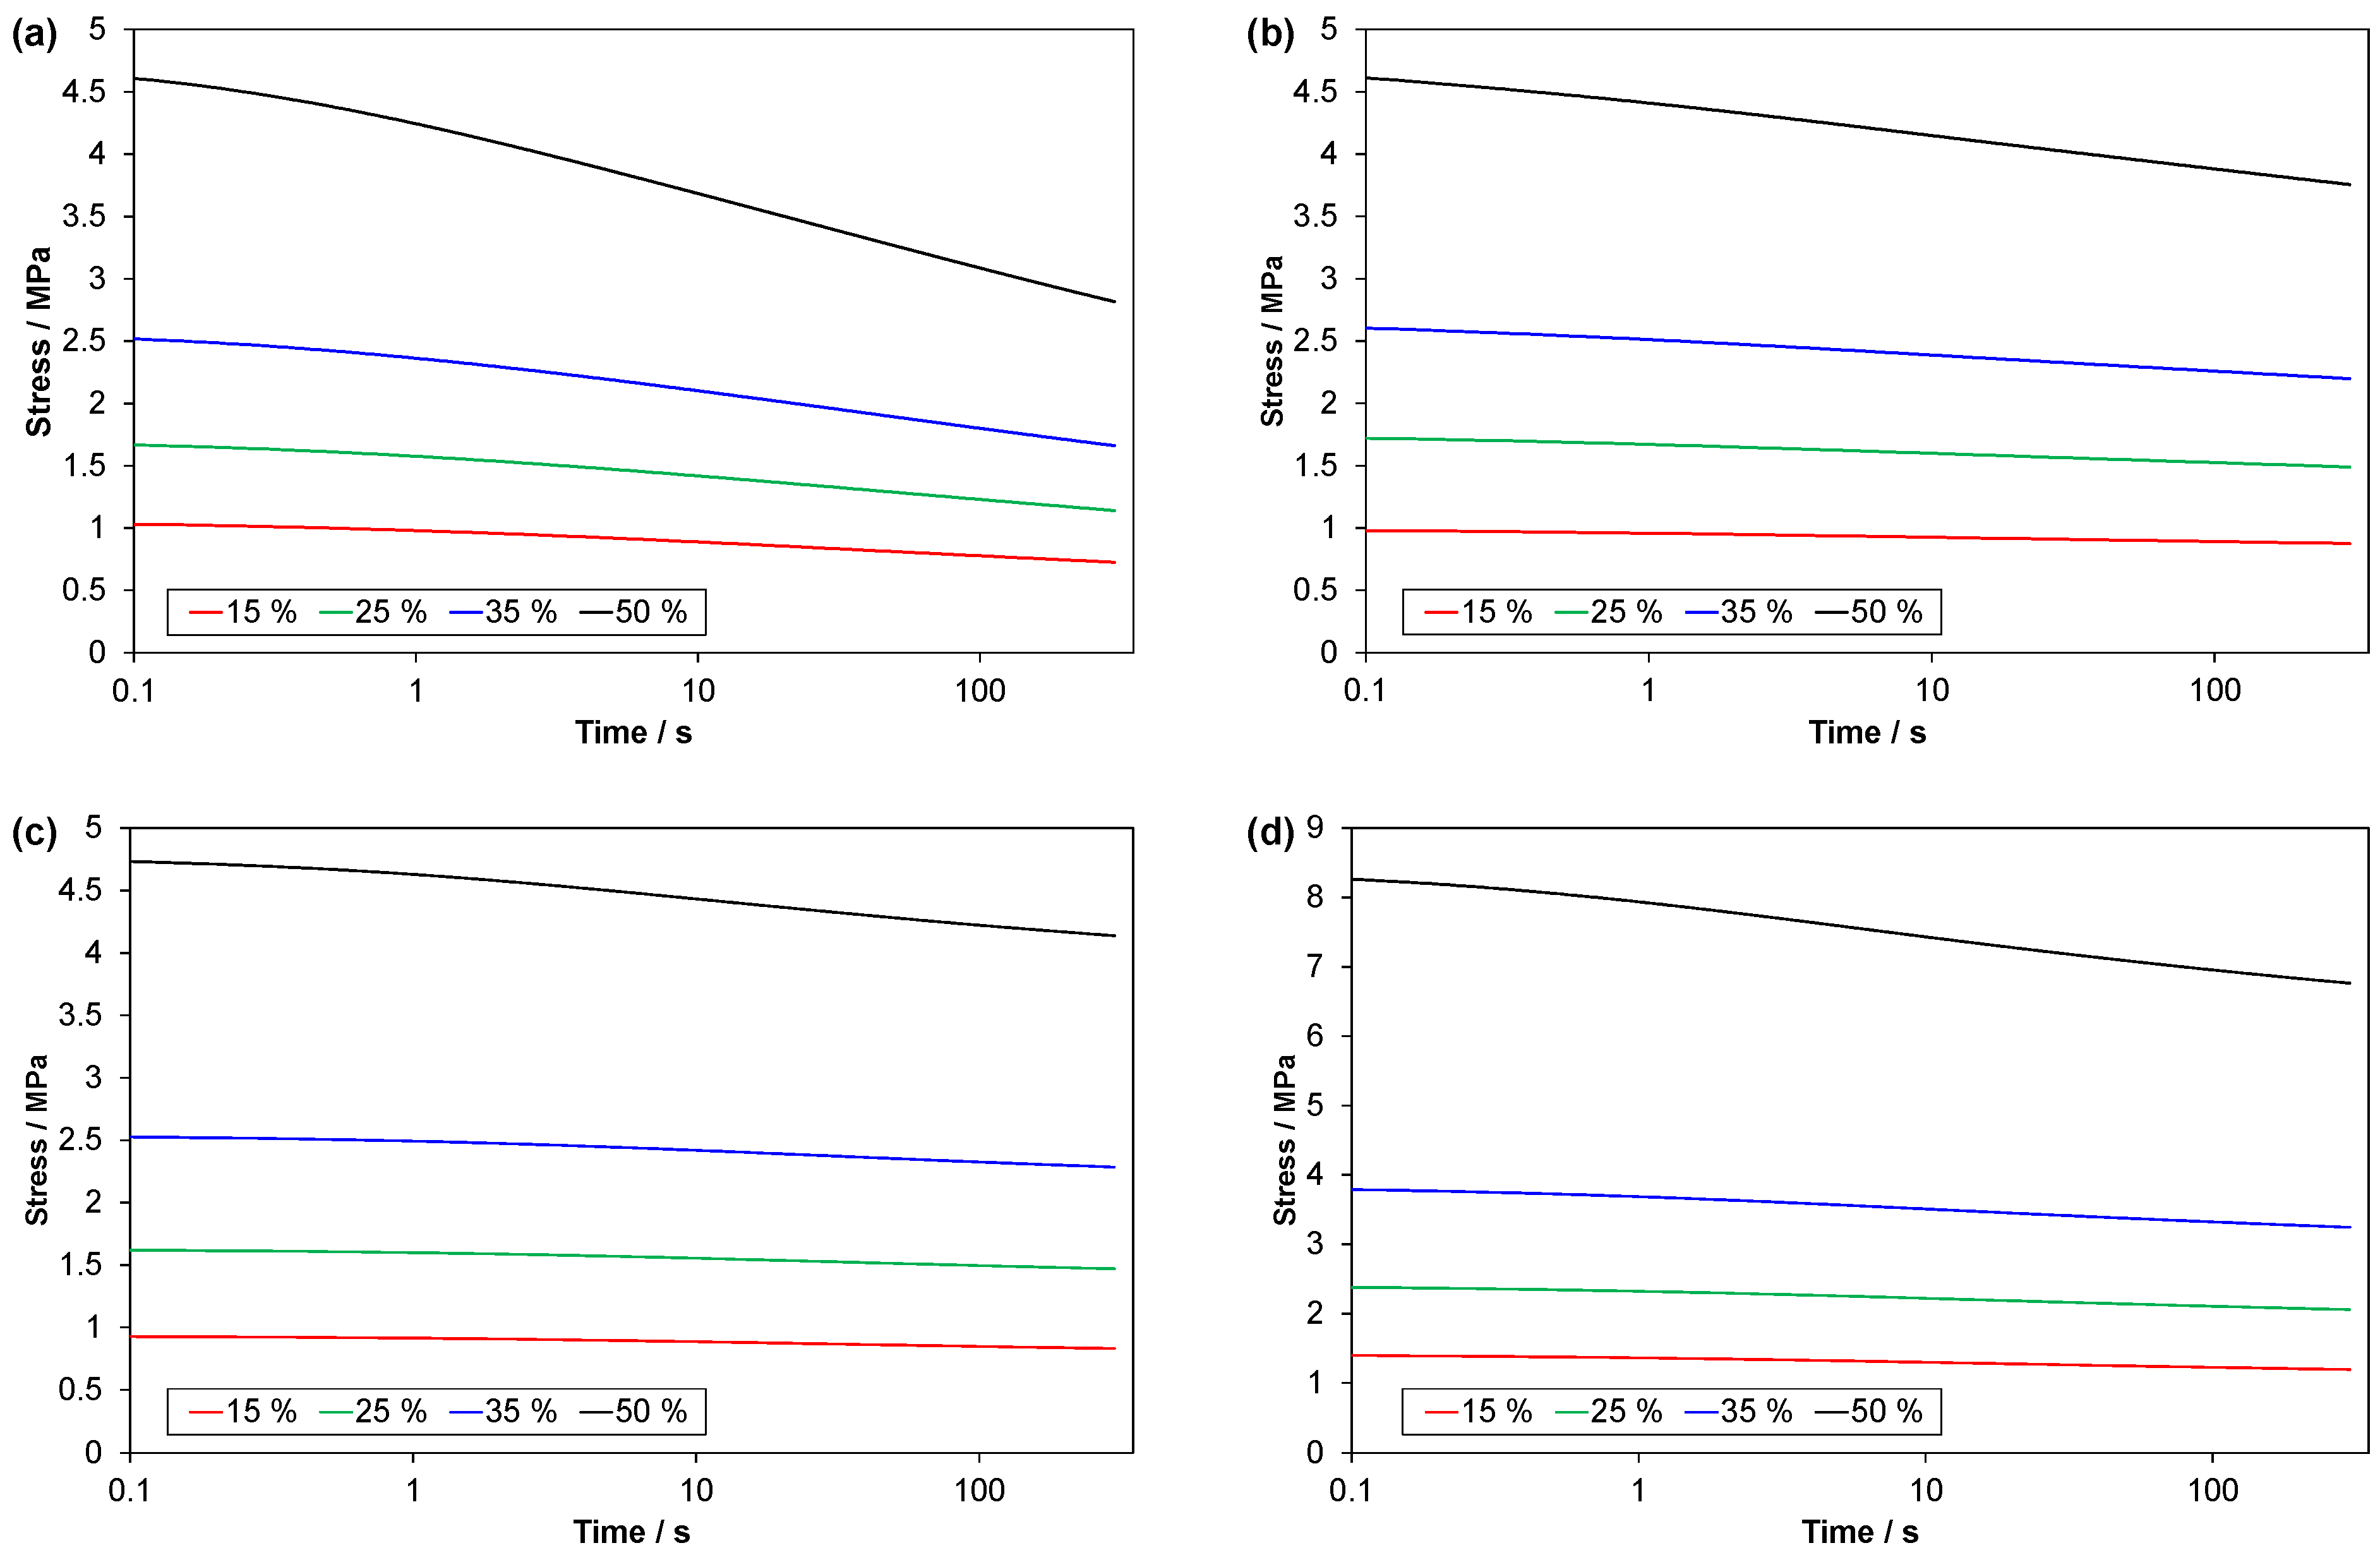
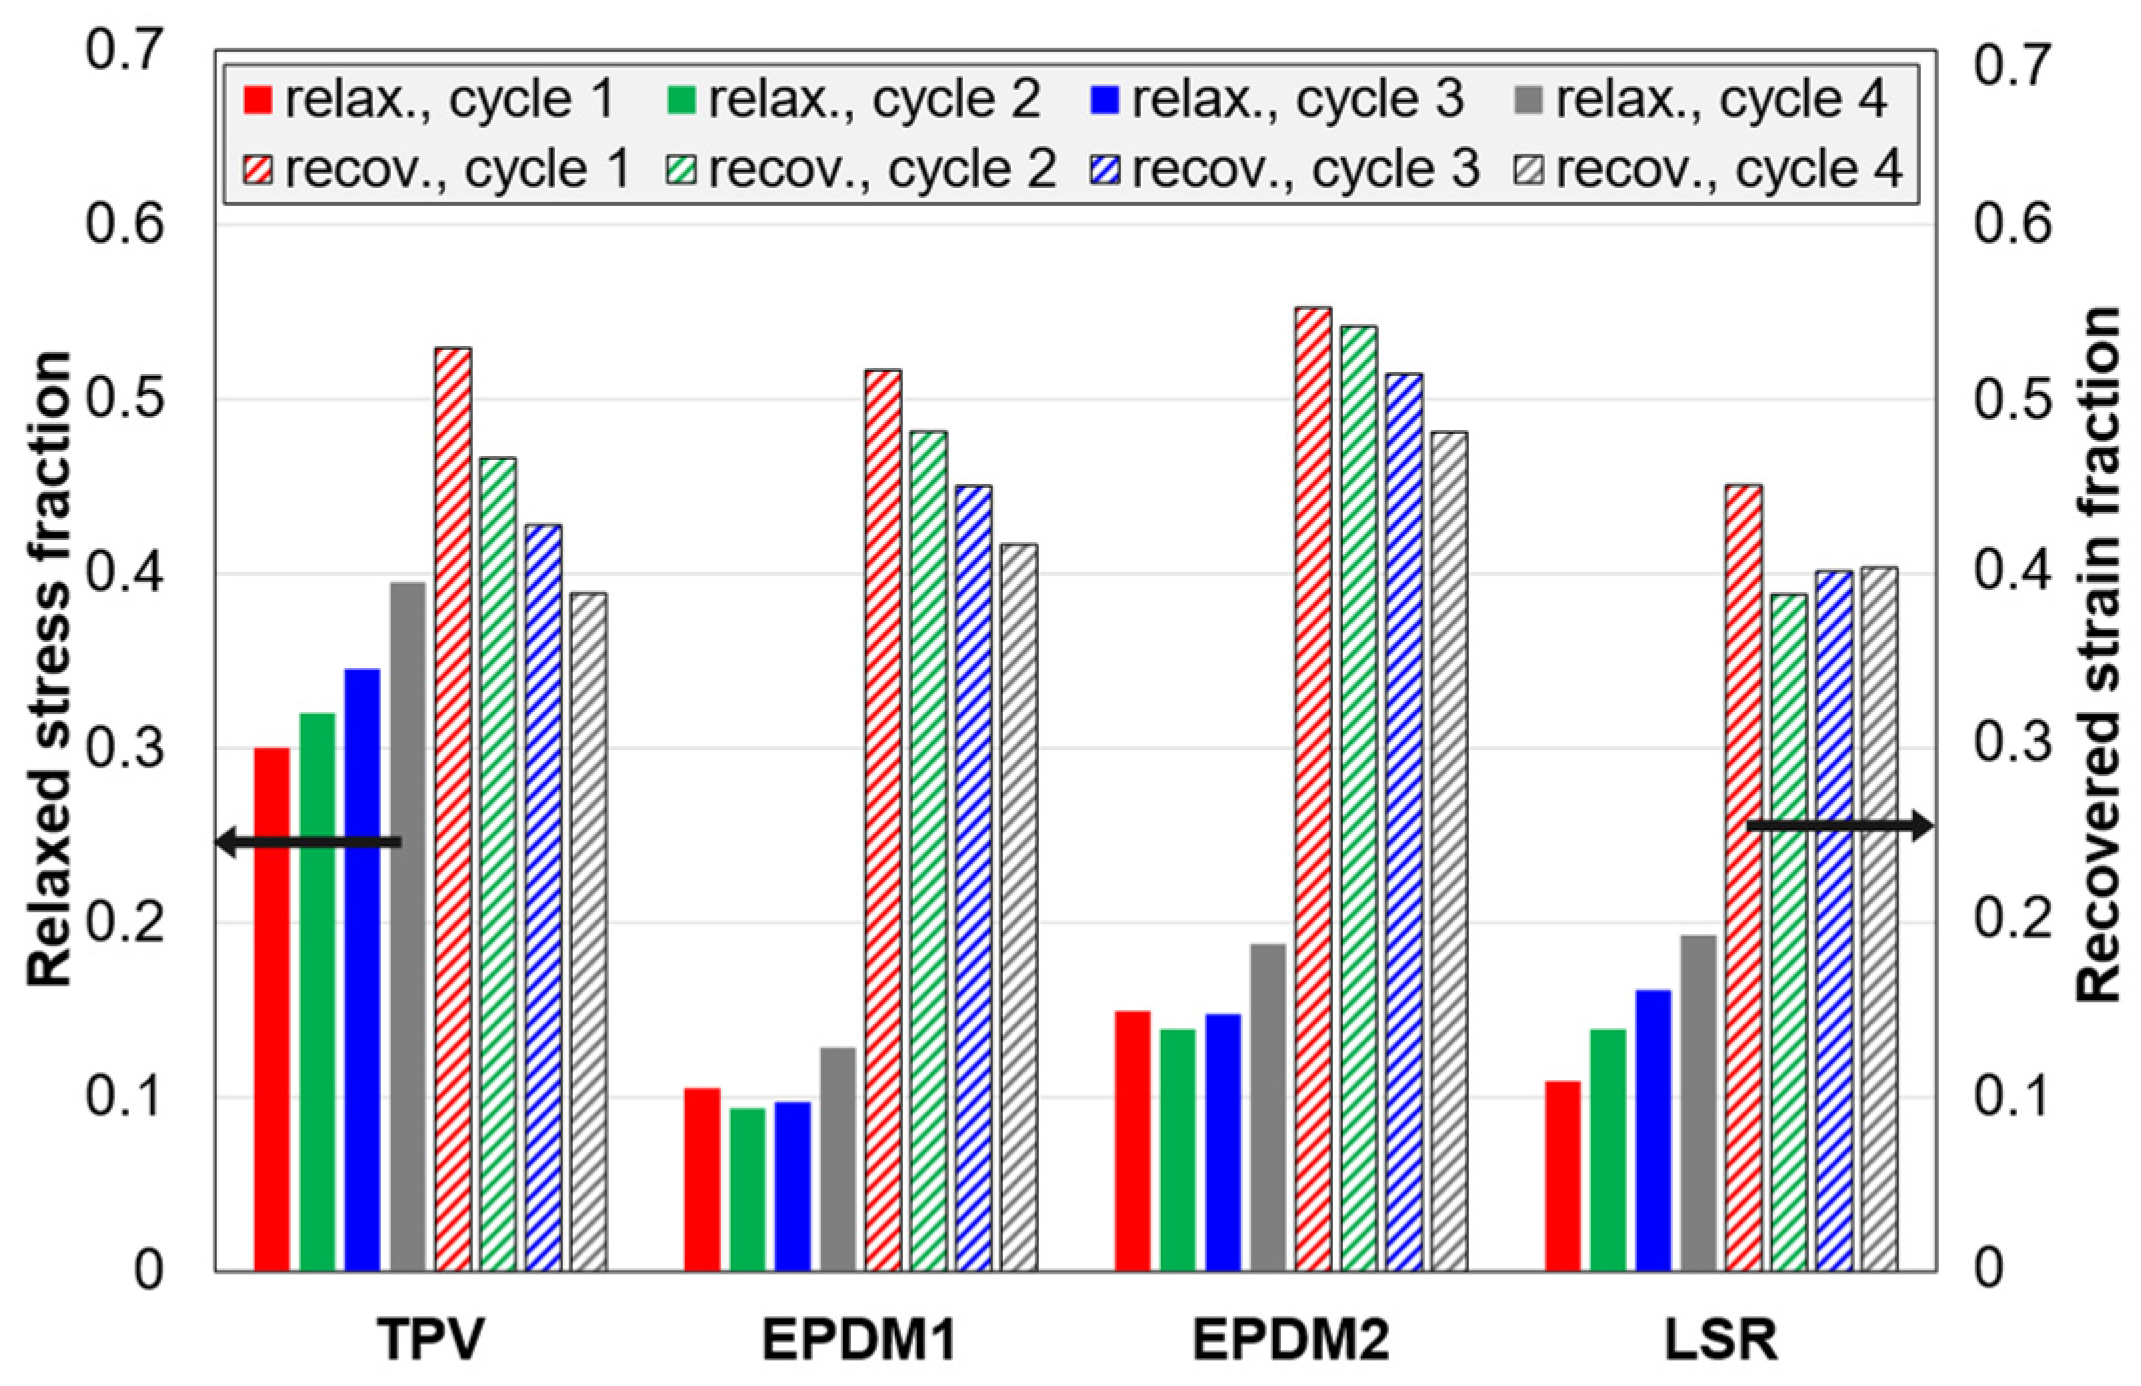
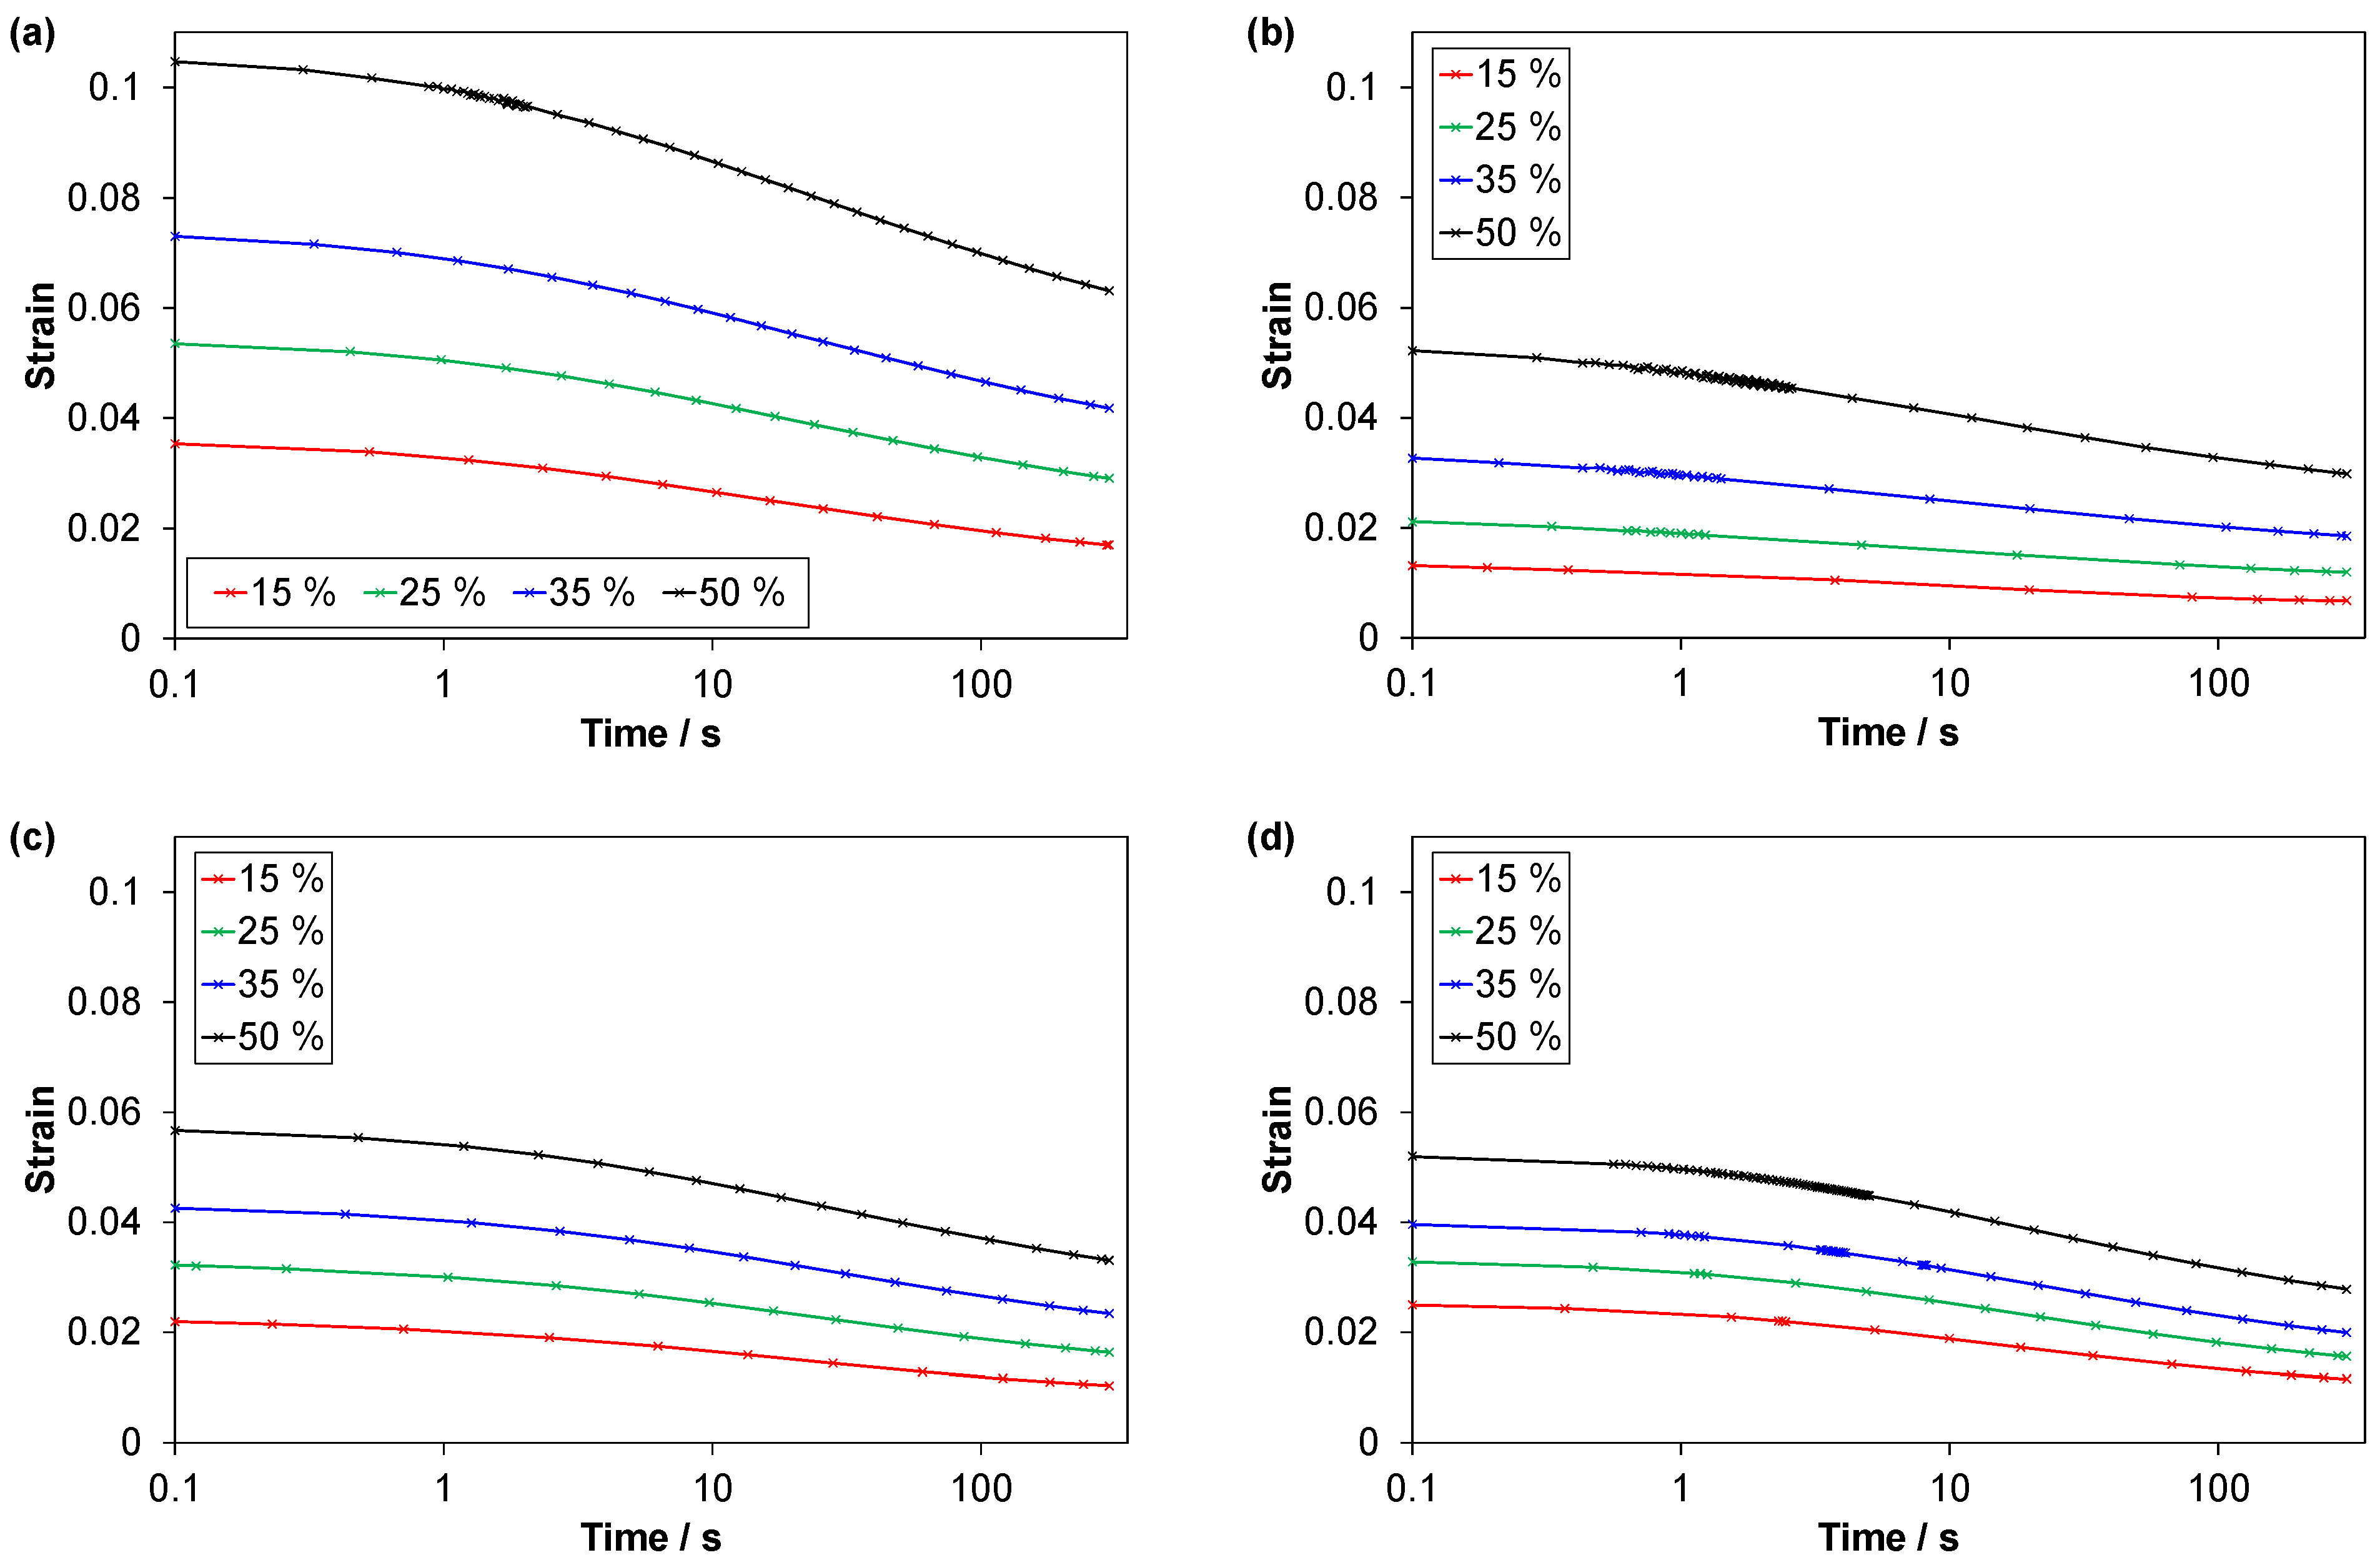
3.2.4. Stress Relaxation and Strain Recovery (C3 Tests)
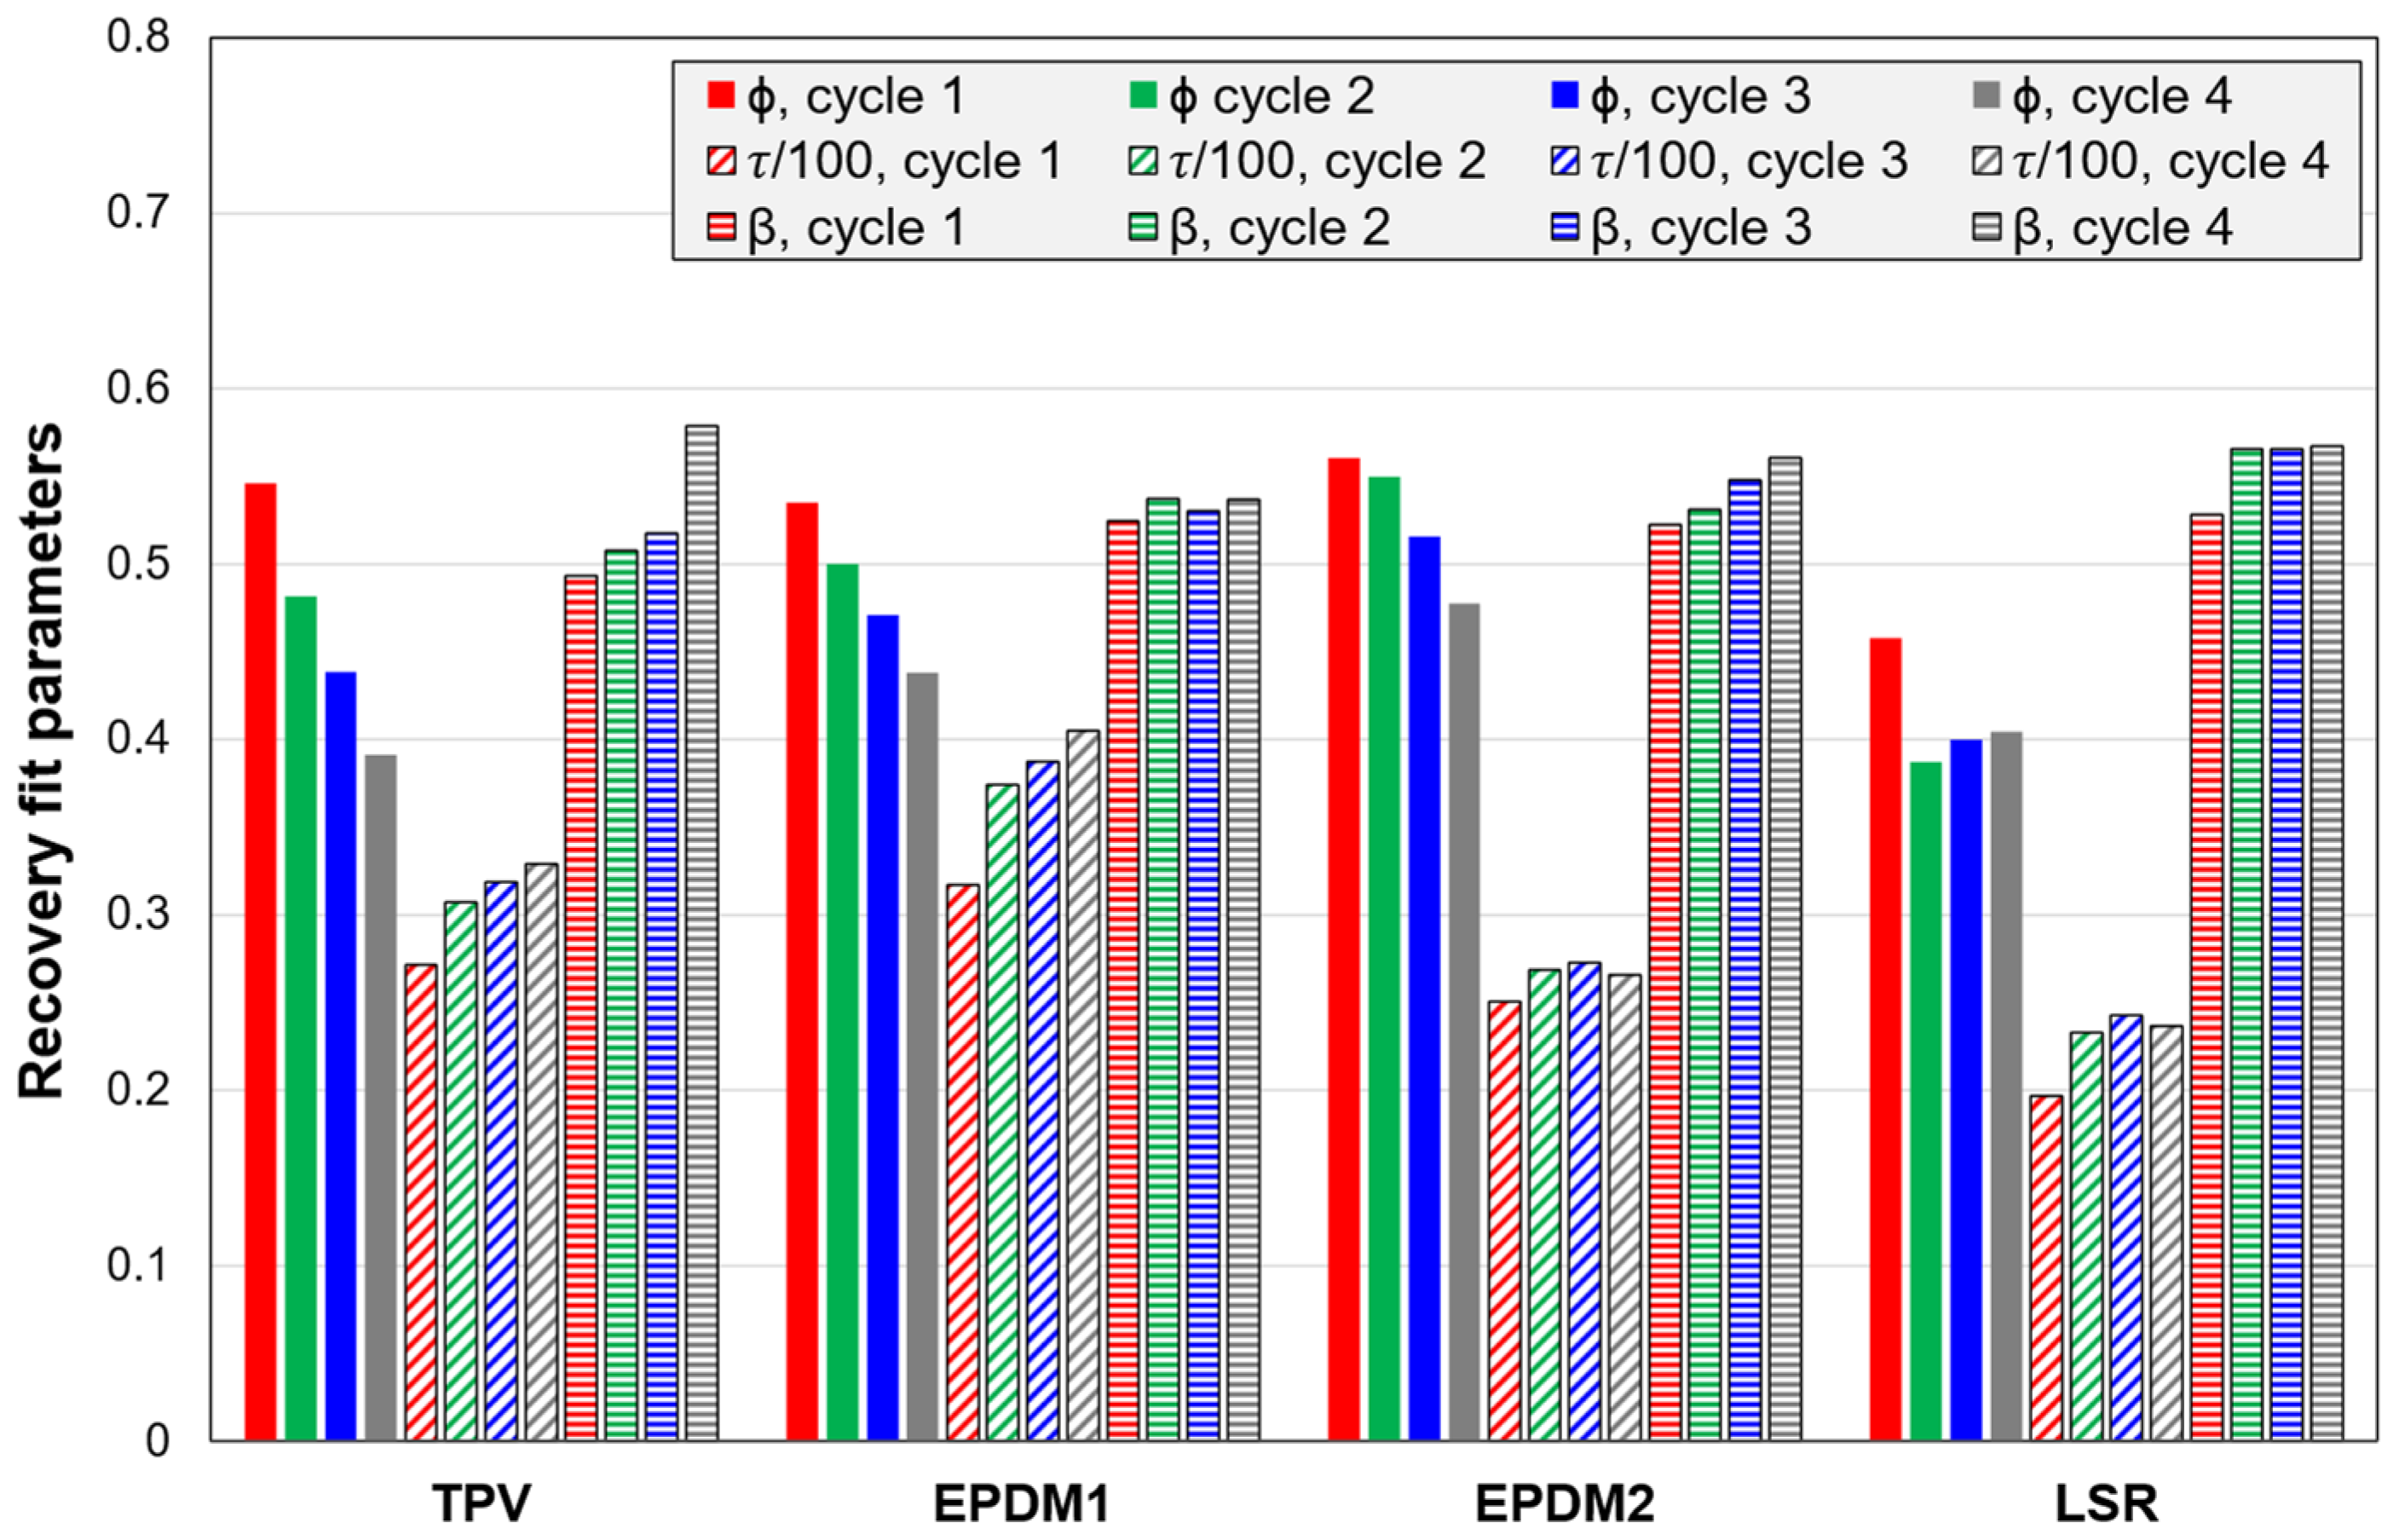
3.2.5. Fitting Parameters for the Stress Relaxation and Strain Recovery
3.2.6. Poisson’s Ratio
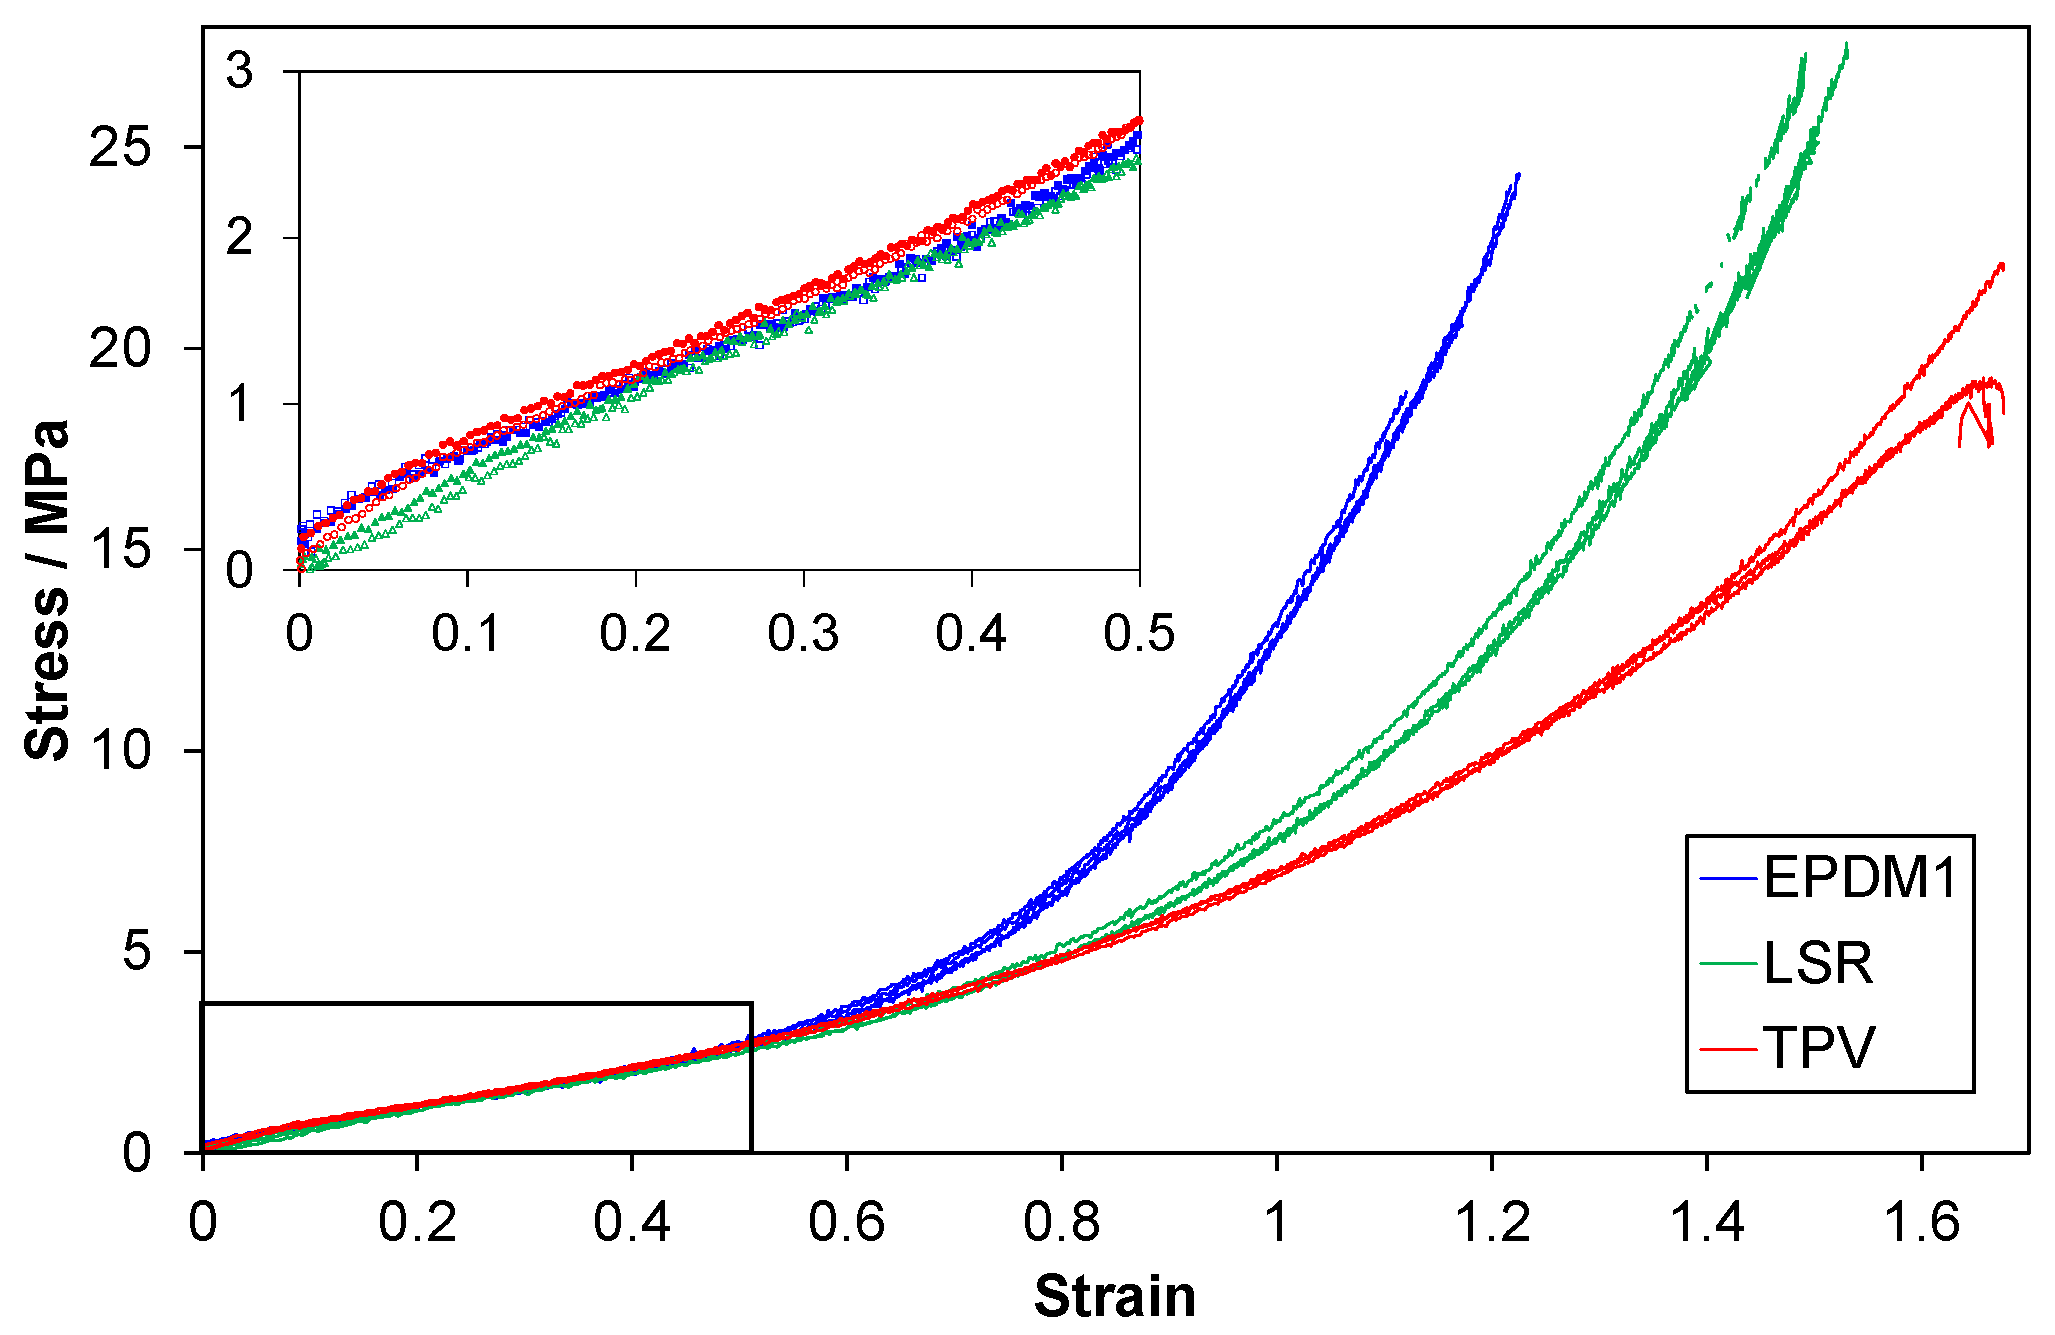
3.3. Tensile Tests to Large Strains
4. Discussion
4.1. Overview
4.2. Mullins Effect
4.3. Compression Set (CS and CSR)
4.4. Relative Hysteresis Loss (HL)
4.5. Stress Relaxation and Strain Recovery
4.6. Correlation between Parameters from the Cyclic Compression Tests
4.6.1. Compression set (CS) vs. Relative Hysteresis Loss (HL)
4.6.2. Mullins Indices vs. Compression Set (CS) and Relative Hysteresis Loss (HL)
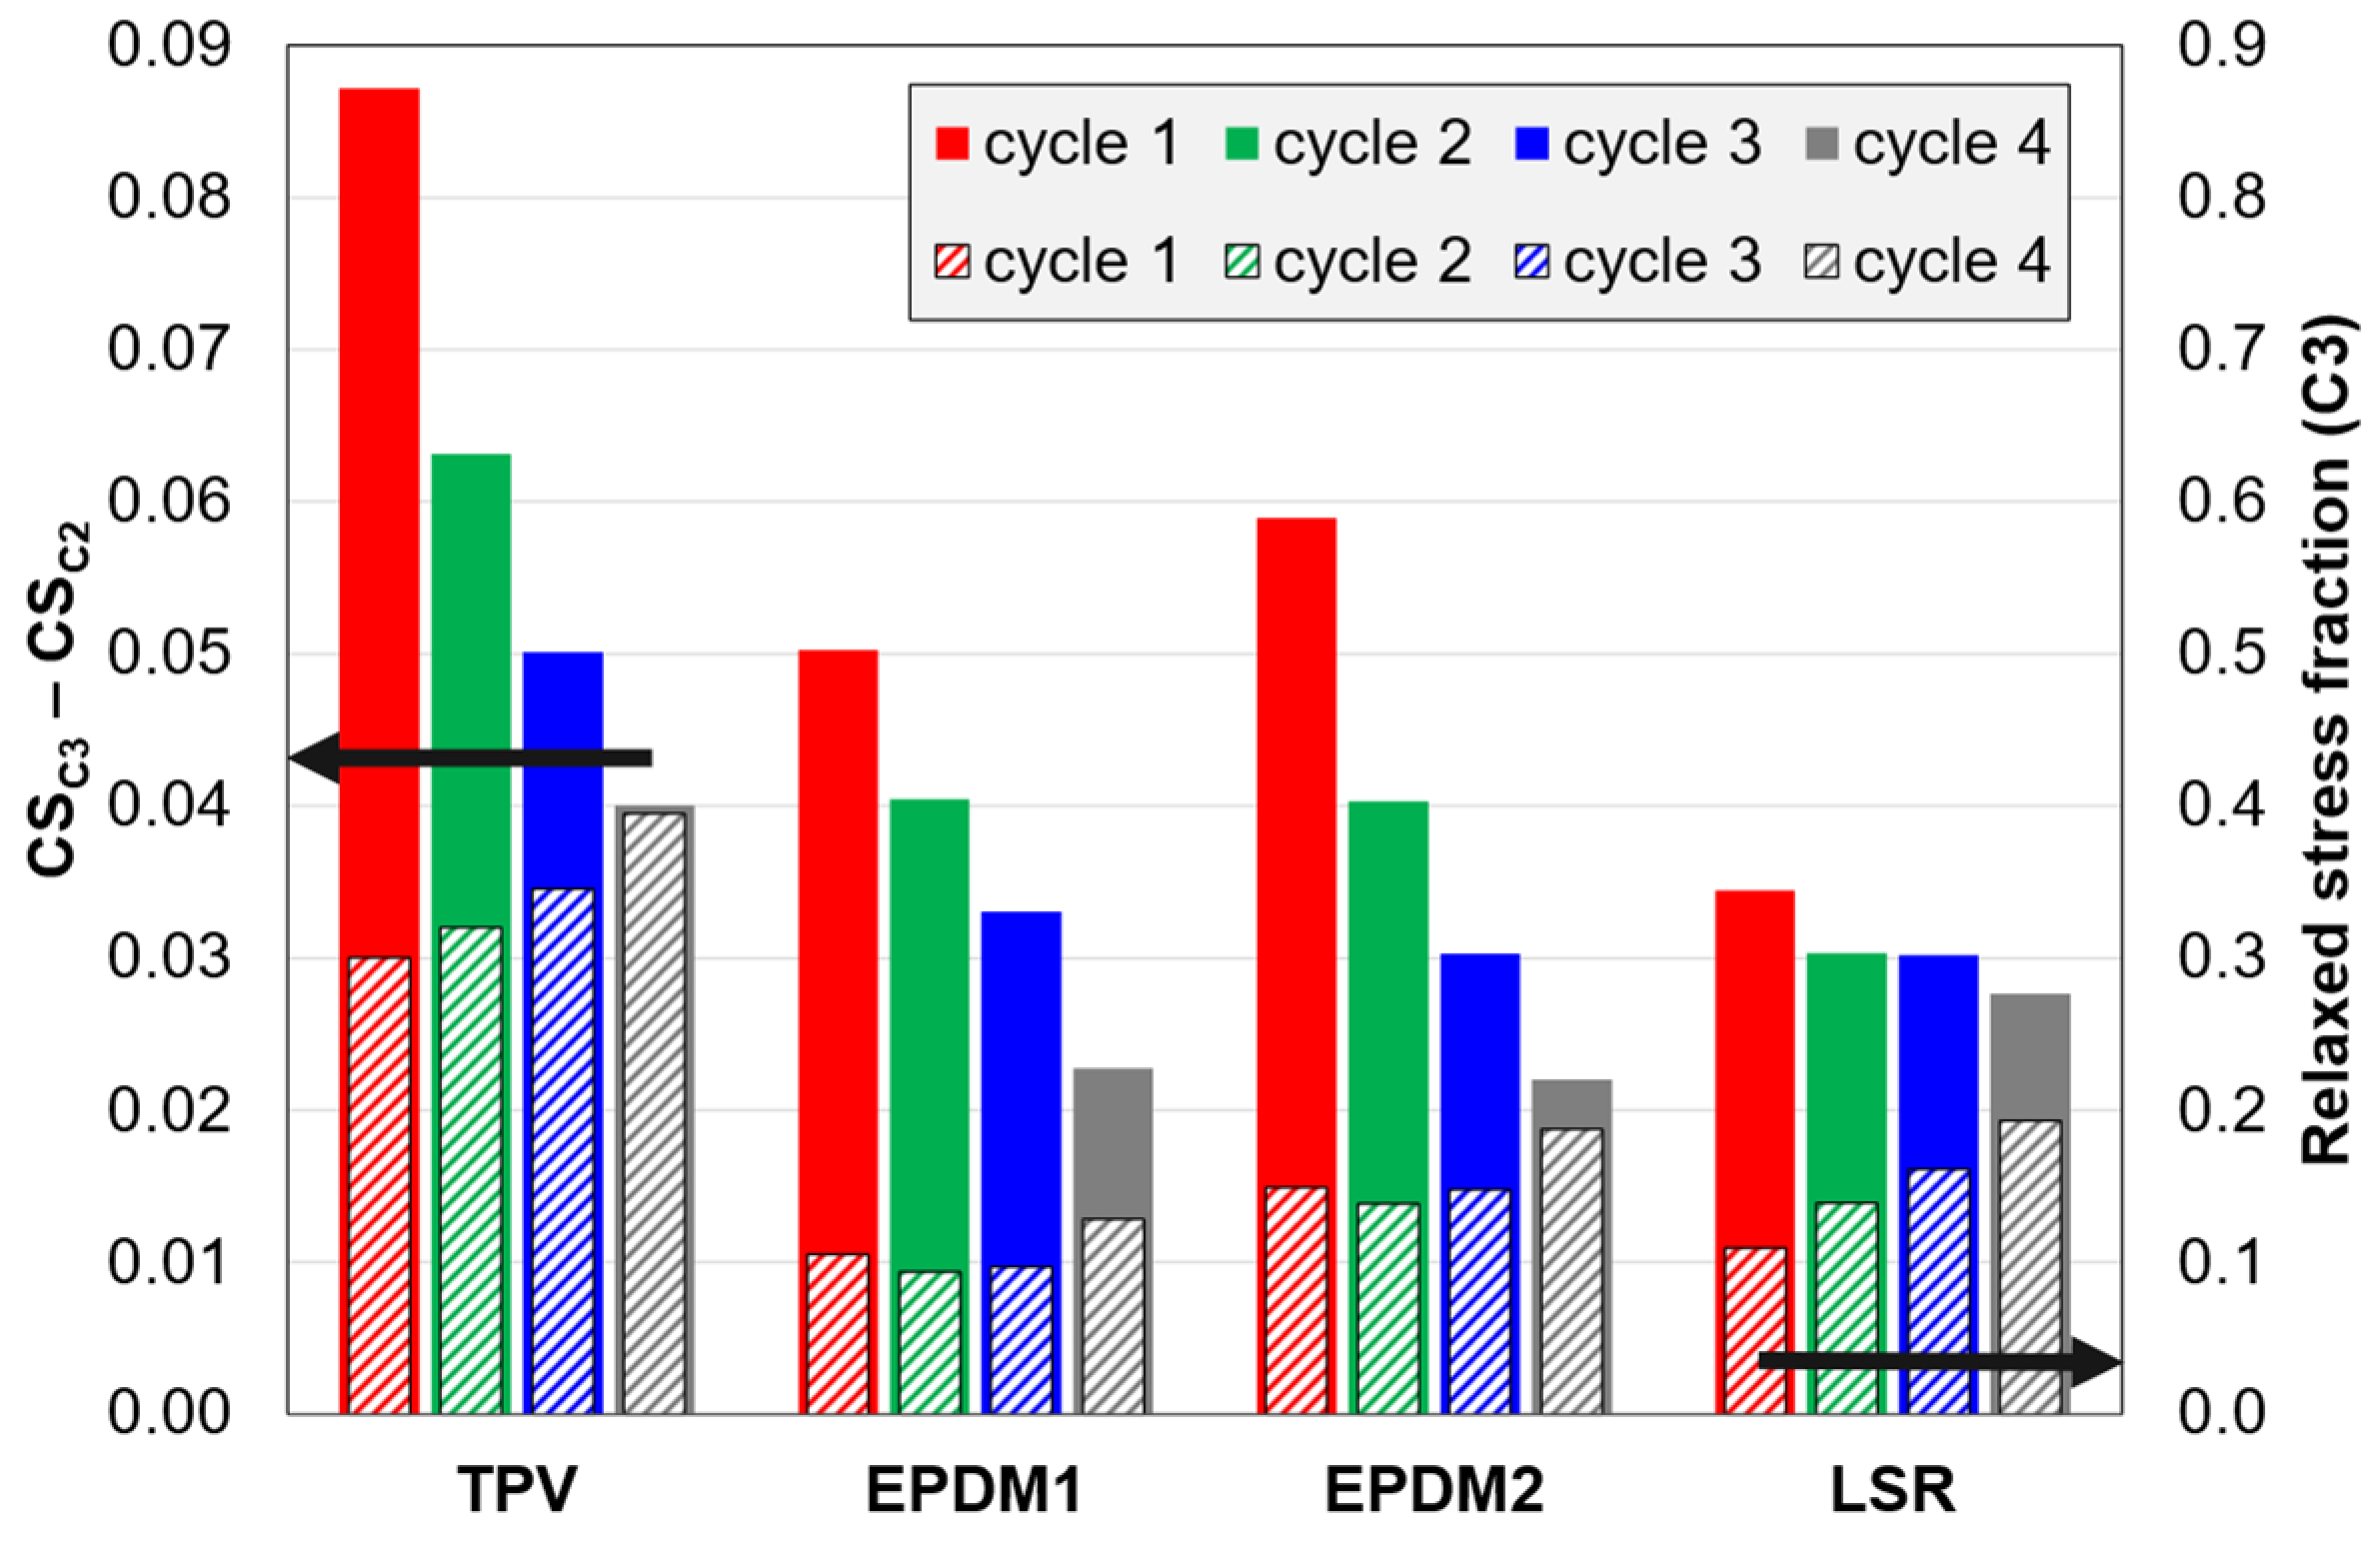
4.6.3. Compression Set vs. Relaxed Stress Fraction
4.7. Tensile Tests to Large Strains
5. Conclusions
Supplementary Materials
Author Contributions
Funding
Institutional Review Board Statement
Informed Consent Statement
Data Availability Statement
Acknowledgments
Conflicts of Interest
Appendix A. Poisson’s Ratio Determined from Axial and Lateral Hencky Strains
Appendix B. How Parameters Were Derived from the Compression Stress-Strain Data
Appendix B.1. Python Script
Apeendix B.2. Demonstration of Mullins Index Calculations
Appendix C. Supplementary Data from Tests C1–C3


Appendix D. Other Parameters for Quantifying the Mullins Effect
Appendix E. Correlation between Parameters from the Cyclic Compression Tests
Appendix E.1. Compression Set (CS) vs. Relative Hysteresis Loss (HL)
Appendix E.2. Mullins Indices vs. Compression Set (CS) and Relative Hysteresis Loss (HL)
Appendix E.3. Compression Set vs. Relaxed Stress Fraction

References
- Turng, L.-S. Special injection moulding processes. In Injection Moulding Handbook, 2nd ed.; Osswald, T.A., Turng, L.-S., Graham, P., Eds.; Carl Hanser: Munich, Germany, 2008; pp. 375–474. [Google Scholar]
- Persson, A.-M.M.R.; Hinrichsen, E.L.; Andreassen, E. On the temperature dependence of the cyclic compressive loading of a thermoplastic vulcanizate elastomer. Polym. Test. 2022; Submitted. [Google Scholar]
- Persson, A.-M.M.R.; Hinrichsen, E.L.; Andreassen, E. Adhesion between thermoplastic elastomers and polyamide-12 with different glass fiber fractions in two-component injection molding. Polym. Eng. Sci. 2020, 60, 1642–1661. [Google Scholar] [CrossRef]
- Persson, A.-M.M.R.; Andreassen, E. Ageing effects on two-component injection molded thermoplastic elastomers. In Proceedings of the SPE ANTEC 2020, Online, 30 March–5 May 2020. [Google Scholar]
- Dick, J.S. Rubber Technology Compounding and Testing for Performance, 2nd ed.; Carl Hanser Verlag: Munich, Germany, 2009; p. 591. [Google Scholar]
- Mark, J.E.; Erman, B.; Roland, C.M. The Science and Technology of Rubber, 4th ed.; Academic Press: Oxford, UK, 2013; p. 786. [Google Scholar]
- Drobny, J.G. Handbook of Thermoplastic Elastomers, 2nd ed.; Elsevier: Amsterdam, The Netherlands, 2014; p. 464. [Google Scholar]
- Bont, M.; Barry, C.; Johnston, S. A review of liquid silicone rubber injection molding: Process variables and process modeling. Polym. Eng. Sci. 2021, 61, 331–347. [Google Scholar] [CrossRef]
- Brook, M.A.; Saier, H.-U.; Schnabel, J.; Town, K.; Maloney, M. Pretreatment of liquid silicone rubbers to remove volatile siloxanes. Ind. Eng. Chem. Res. 2007, 46, 8796–8805. [Google Scholar] [CrossRef]
- Mullins, L. Softening of rubber by deformation. Rubber Chem. Tech. 1969, 42, 339–362. [Google Scholar] [CrossRef]
- Diani, J.; Fayolle, B.; Gilormini, P. A review on the Mullins effect. Eur. Polym. J. 2009, 45, 601–612. [Google Scholar] [CrossRef] [Green Version]
- Hanson, D.E.; Hawley, M.; Houlton, R.; Chitanvis, K.; Rae, P.; Orler, E.B.; Wrobleski, D.A. Stress softening experiments in silica-filled polydimethylsiloxane provide insight into a mechanism for the Mullins effect. Polymer 2005, 46, 10989–10995. [Google Scholar] [CrossRef]
- Drozdov, A.D.; Dusunceli, N. Universal mechanical response of polypropylene under cyclic deformation. J. Polym. Eng. 2012, 32, 31–41. [Google Scholar] [CrossRef]
- Milani, G.; Milani, F. Optimal vulcanization of 2D–3D EPM/EPDM thick elements through peroxidic mixtures. J. Math. Chem. 2009, 47, 229. [Google Scholar] [CrossRef]
- Milani, G.; Galanti, A.; Cardelli, C.; Milani, F.; Cardelli, A. Combined numerical, finite element and experimental-optimization approach in the production process of medium-voltage, rubber-insulated electric cables vulcanized with steam water. Part 1: DSC and rheometer experimental results. Rubber Chem. Tech. 2015, 88, 482–501. [Google Scholar] [CrossRef]
- Candau, N.; Oguz, O.; Peuvrel-Disdier, E.; Bouvard, J.-L.; Pradille, C.; Billon, N. Strain and filler ratio transitions from chains network to filler network damage in EPDM during single and cyclic loadings. Polymer 2020, 197, 122435. [Google Scholar] [CrossRef]
- Litvinov, V.M.; Orza, R.A.; Klüppel, M.; van Duin, M.; Magusin, P.C.M.M. Rubber–filler interactions and network structure in relation to stress–strain behavior of vulcanized, carbon black filled EPDM. Macromolecules 2011, 44, 4887–4900. [Google Scholar] [CrossRef]
- Roland, C.M. Reinforcement of elastomers. In Reference Module in Materials Science and Materials Engineering; Elsevier: Amsterdam, The Netherlands, 2016. [Google Scholar] [CrossRef]
- Liu, X.; Huang, H.; Xie, Z.; Zhang, Y.; Zhang, Y.; Sun, K.; Min, L. EPDM/polyamide TPV compatibilized by chlorinated polyethylene. Polym. Test. 2003, 22, 9–16. [Google Scholar] [CrossRef]
- Ren, N.; Matta, M.E.; Martinez, H.; Walton, K.L.; Munro, J.C.; Schneiderman, D.K.; Hillmyer, M.A. Filler-reinforced elastomers based on functional polyolefin prepolymers. Ind. Eng. Chem. Res. 2016, 55, 6106–6112. [Google Scholar] [CrossRef] [Green Version]
- Babu, R.R.; Singha, N.K.; Naskar, A.K. Interrelationships of morphology, thermal and mechanical properties in uncrosslinked and dynamically crosslinked PP/EOC and PP/EPDM blends. Express Polym. Let. 2010, 4, 197–209. [Google Scholar] [CrossRef]
- Liu, Q.; Zang, K.; Zang, Z.; Wang, Z. Strengthening effect of Mullins effect of high density polyethylene/ethylene-propylene-diene terpolymer thermoplastic vulcanizates under compression mode. J. Thermopl. Compos. Mater. 2018, 31, 1310–1322. [Google Scholar] [CrossRef]
- Wang, C.C.; Zhang, Y.-F.; Liu, Q.Q.; Wang, Z.B. Mullins effect under compression mode and its reversibility of thermoplastic vulcanizate based on ethylene-vinyl acetate copolymer/styrene-butadiene rubber blend. Int. Polym. Proc. 2017, 32, 11–19. [Google Scholar] [CrossRef]
- Stricher, A.M.; Rinaldi, R.G.; Barrès, C.; Ganachaud, F.; Chazeau, L. How I met your elastomers: From network topology to mechanical behaviours of conventional silicone materials. RSC Adv. 2015, 5, 53713–53725. [Google Scholar] [CrossRef]
- Delebecq, E.; Hermeline, N.; Flers, A.; Ganachaud, F. Looking over liquid silicone rubbers: (2) Mechanical properties vs network topology. ACS App. Mater. Interfaces 2012, 4, 3353–3363. [Google Scholar] [CrossRef]
- Krpovic, S.; Dam-Johansen, K.; Skov, A.L. Importance of Mullins effect in commercial silicone elastomer formulations for soft robotics. J. Appl. Polym. Sci. 2021, 138, 50380. [Google Scholar] [CrossRef]
- Lee, W.S.; Yeo, K.S.; Andriyana, A.; Shee, Y.G.; Mahamd Adikan, F.R. Effect of cyclic compression and curing agent concentration on the stabilization of mechanical properties of PDMS elastomer. Mater. Des. 2016, 96, 470–475. [Google Scholar] [CrossRef]
- Clément, F.; Bokobza, L.; Monnerie, L. On the Mullins effect in silica-filled polydimethylsiloxane networks. Rubber Chem. Tech. 2001, 74, 847–870. [Google Scholar] [CrossRef]
- Ehrburger-Dolle, F.; Morfin, I.; Bley, F.; Livet, F.; Heinrich, G.; Richter, S.; Piché, L.; Sutton, M. XPCS investigation of the dynamics of filler particles in stretched filled elastomers. Macromolecules 2012, 45, 8691–8701. [Google Scholar] [CrossRef]
- Ehrburger-Dolle, F.; Morfin, I.; Bley, F.; Livet, F.; Heinrich, G.; Piché, L.; Sutton, M. Experimental clues of soft glassy rheology in strained filled elastomers. J. Polym. Sci. Part B Polym. Phys. 2014, 52, 647–656. [Google Scholar] [CrossRef] [Green Version]
- Bergström, J. Mechanics of Solid Polymers; William Andrew Publishing: New York, NY, USA, 2015. [Google Scholar]
- Wang, Z.; Li, S.; Dongya, W.; Zhao, J. Mechanical properties, Payne effect, and Mullins effect of thermoplastic vulcanizates based on high-impact polystyrene and styrene–butadiene rubber compatibilized by styrene–butadiene–styrene block copolymer. J. Thermopl. Compos. Mater. 2015, 31, 1310–1322. [Google Scholar] [CrossRef]
- Boyce, M.C.; Socrate, S.; Kear, K.; Yeh, O.; Shaw, K. Micromechanisms of deformation and recovery in thermoplastic vulcanizates. J. Mech. Phys. Sol. 2001, 49, 1323–1342. [Google Scholar] [CrossRef]
- Boyce, M.C.; Yeh, O.; Socrate, S.; Kear, K.; Shaw, K. Micromechanics of cyclic softening in thermoplastic vulcanizates. J. Mech. Phys. Sol. 2001, 49, 1343–1360. [Google Scholar] [CrossRef]
- Marckmann, G.; Verron, E.; Gornet, L.; Chagnon, G.; Charrier, P.; Fort, P. A theory of network alteration for the Mullins effect. J. Mech. Phys. Sol. 2002, 50, 2011–2028. [Google Scholar] [CrossRef] [Green Version]
- Plagge, J.; Klüppel, M. Micromechanics of stress-softening and hysteresis of filler reinforced elastomers with applications to thermo-oxidative aging. Polymer 2020, 12, 1350. [Google Scholar] [CrossRef]
- Uthaipan, N.; Junhasavasdikul, B.; Nakason, C.; Thitithammawong, A. Prediction models for the key mechanical properties of EPDM/PP blends as affected by processing parameters and their correlation with stress relaxation and phase morphologies. Polym. Adv. Tech. 2015, 26, 970–977. [Google Scholar] [CrossRef]
- Andrady, A.L.; Llorente, M.A.; Mark, J.E. Model networks of end-linked polydimethylsiloxane chains. VII. Networks designed to demonstrate non-Gaussian effects related to limited chain extensibility. J. Chem. Phys. 1980, 72, 2282–2290. [Google Scholar] [CrossRef]
- Mihai, L.A.; Goriely, A. How to characterize a nonlinear elastic material? A review on nonlinear constitutive parameters in isotropic finite elasticity. Proc. R. Soc. A Math. Phys. Eng. Sci. 2017, 473, 20170607. [Google Scholar] [CrossRef] [Green Version]


| Material ID | Material Type 1 | Grade (Manufacturer) | Hardness 2 (Shore A) |
|---|---|---|---|
| TPV | TPV − (xSEBS + PP) | TV6VAZ (Kraiburg TPE, Waldkraiburg, Germany) | 62.5 |
| LSR | Liquid silicone rubber, VMQ | Elastosil LR 3070/60 A/B 3 (Wacker Chemie, Munich, Germany) | 61.8 |
| EPDM1 | EPDM | 01/U60 EP (LAV.EL. Gomma, Cologne, Italy) | 65.2 |
| EPDM2 | EPDM | 01/U70 EP (LAV.EL. Gomma, Cologne, Italy) | 75.1 |
| Test ID | Description |
|---|---|
| C1 | Ten cycles with the same strain amplitude (25%). Each cycle has two stages: loading from a small pre-force to the strain amplitude and unloading to the pre-force. |
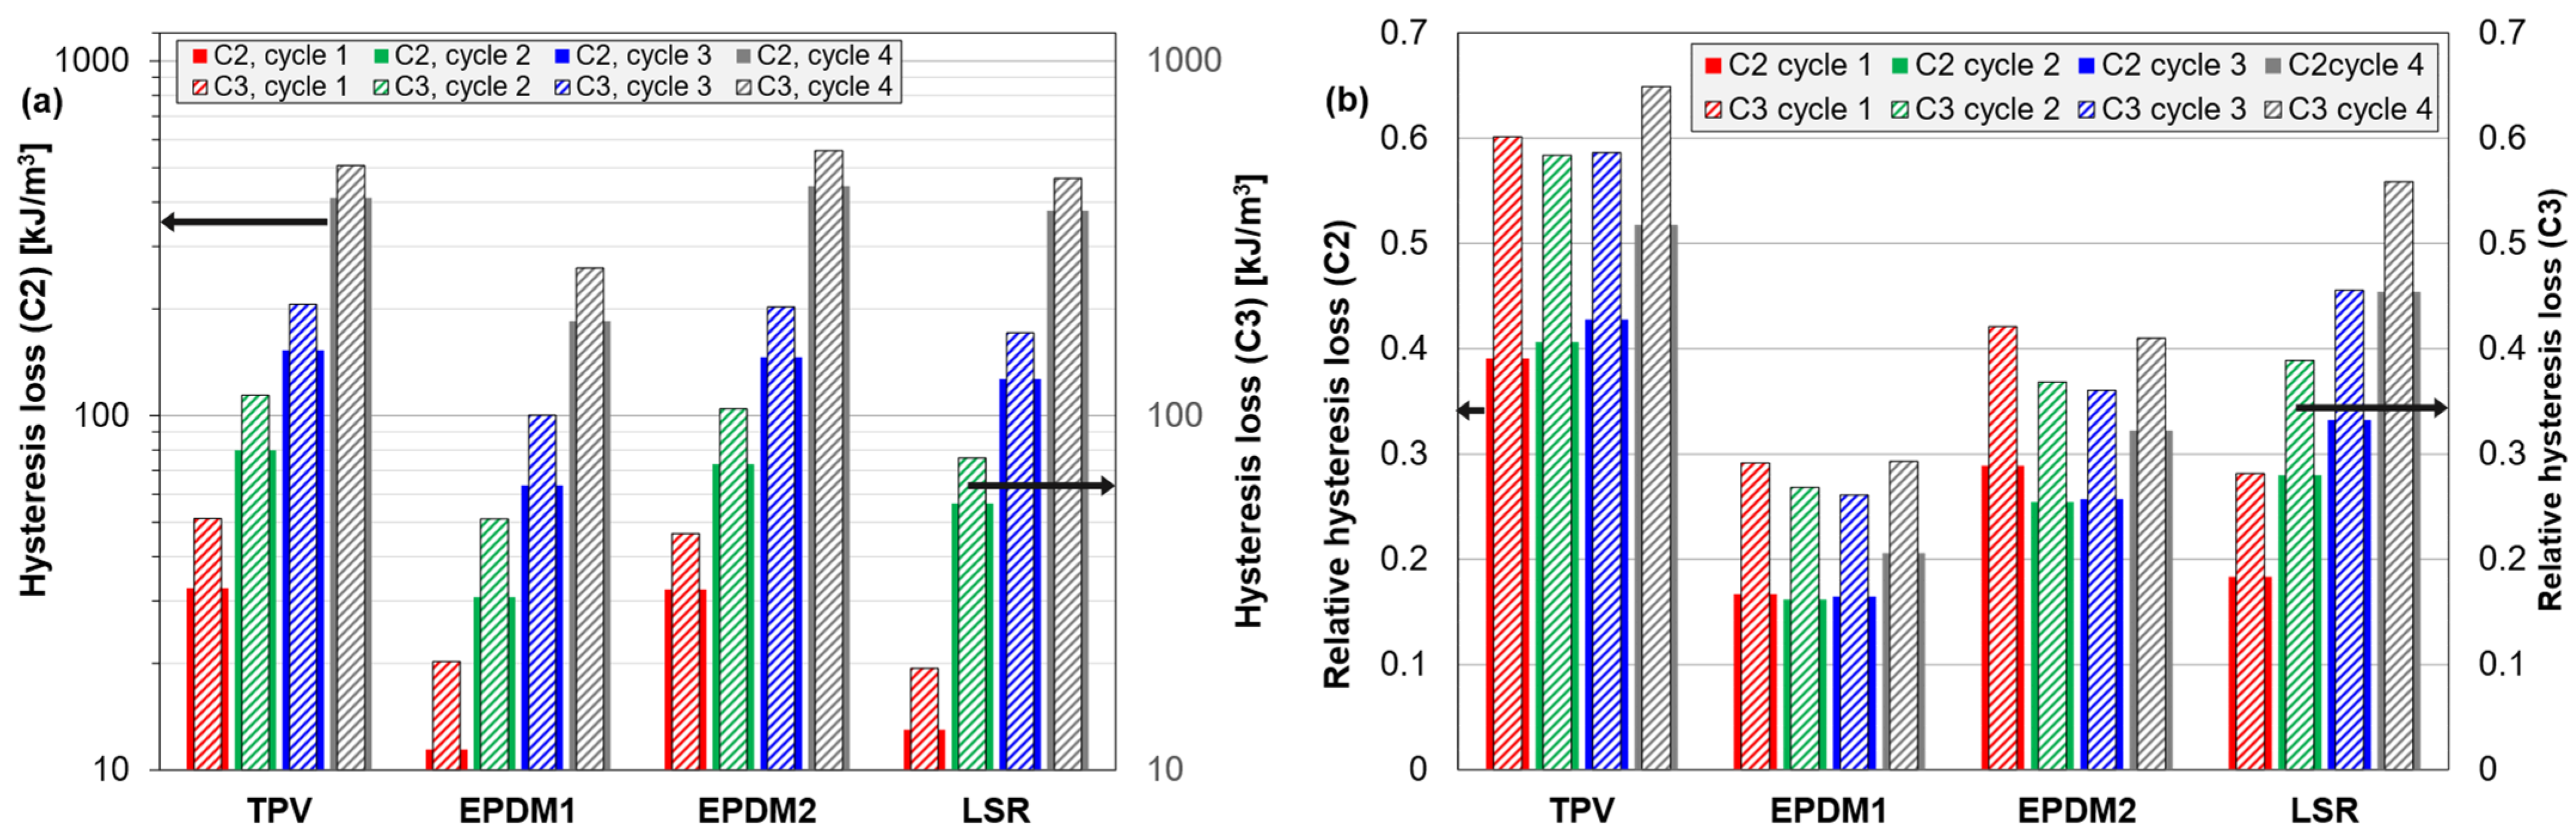
| C2 | Four cycles with increasing strain amplitude (15%, 25%, 35% and 50%). Loading and unloading stages as for C1 tests. |
| C3 | As C2 tests, but with two additional inserted stages: stress relaxation (at constant strain) for 5 min after the loading stage, and strain recovery (at constant pre-force) for 5 min after the unloading stage. |
| ID | Parameter | Description |
|---|---|---|
| TM | Tangent modulus at 10% strain | In this case, the starting point for the 10% strain is the start of the given loading curve, as in ISO 7743. The start point (zero strain for the given loading curve) is obtained by extrapolating the first part of the loading curve to zero stress. |
| MI0 | Mullins index 0 (from C2 tests) | This index quantifies the Mullins effect as the ratio of the stress in loading n to the stress in loading n + 1, at the maximum strain of loading n. |
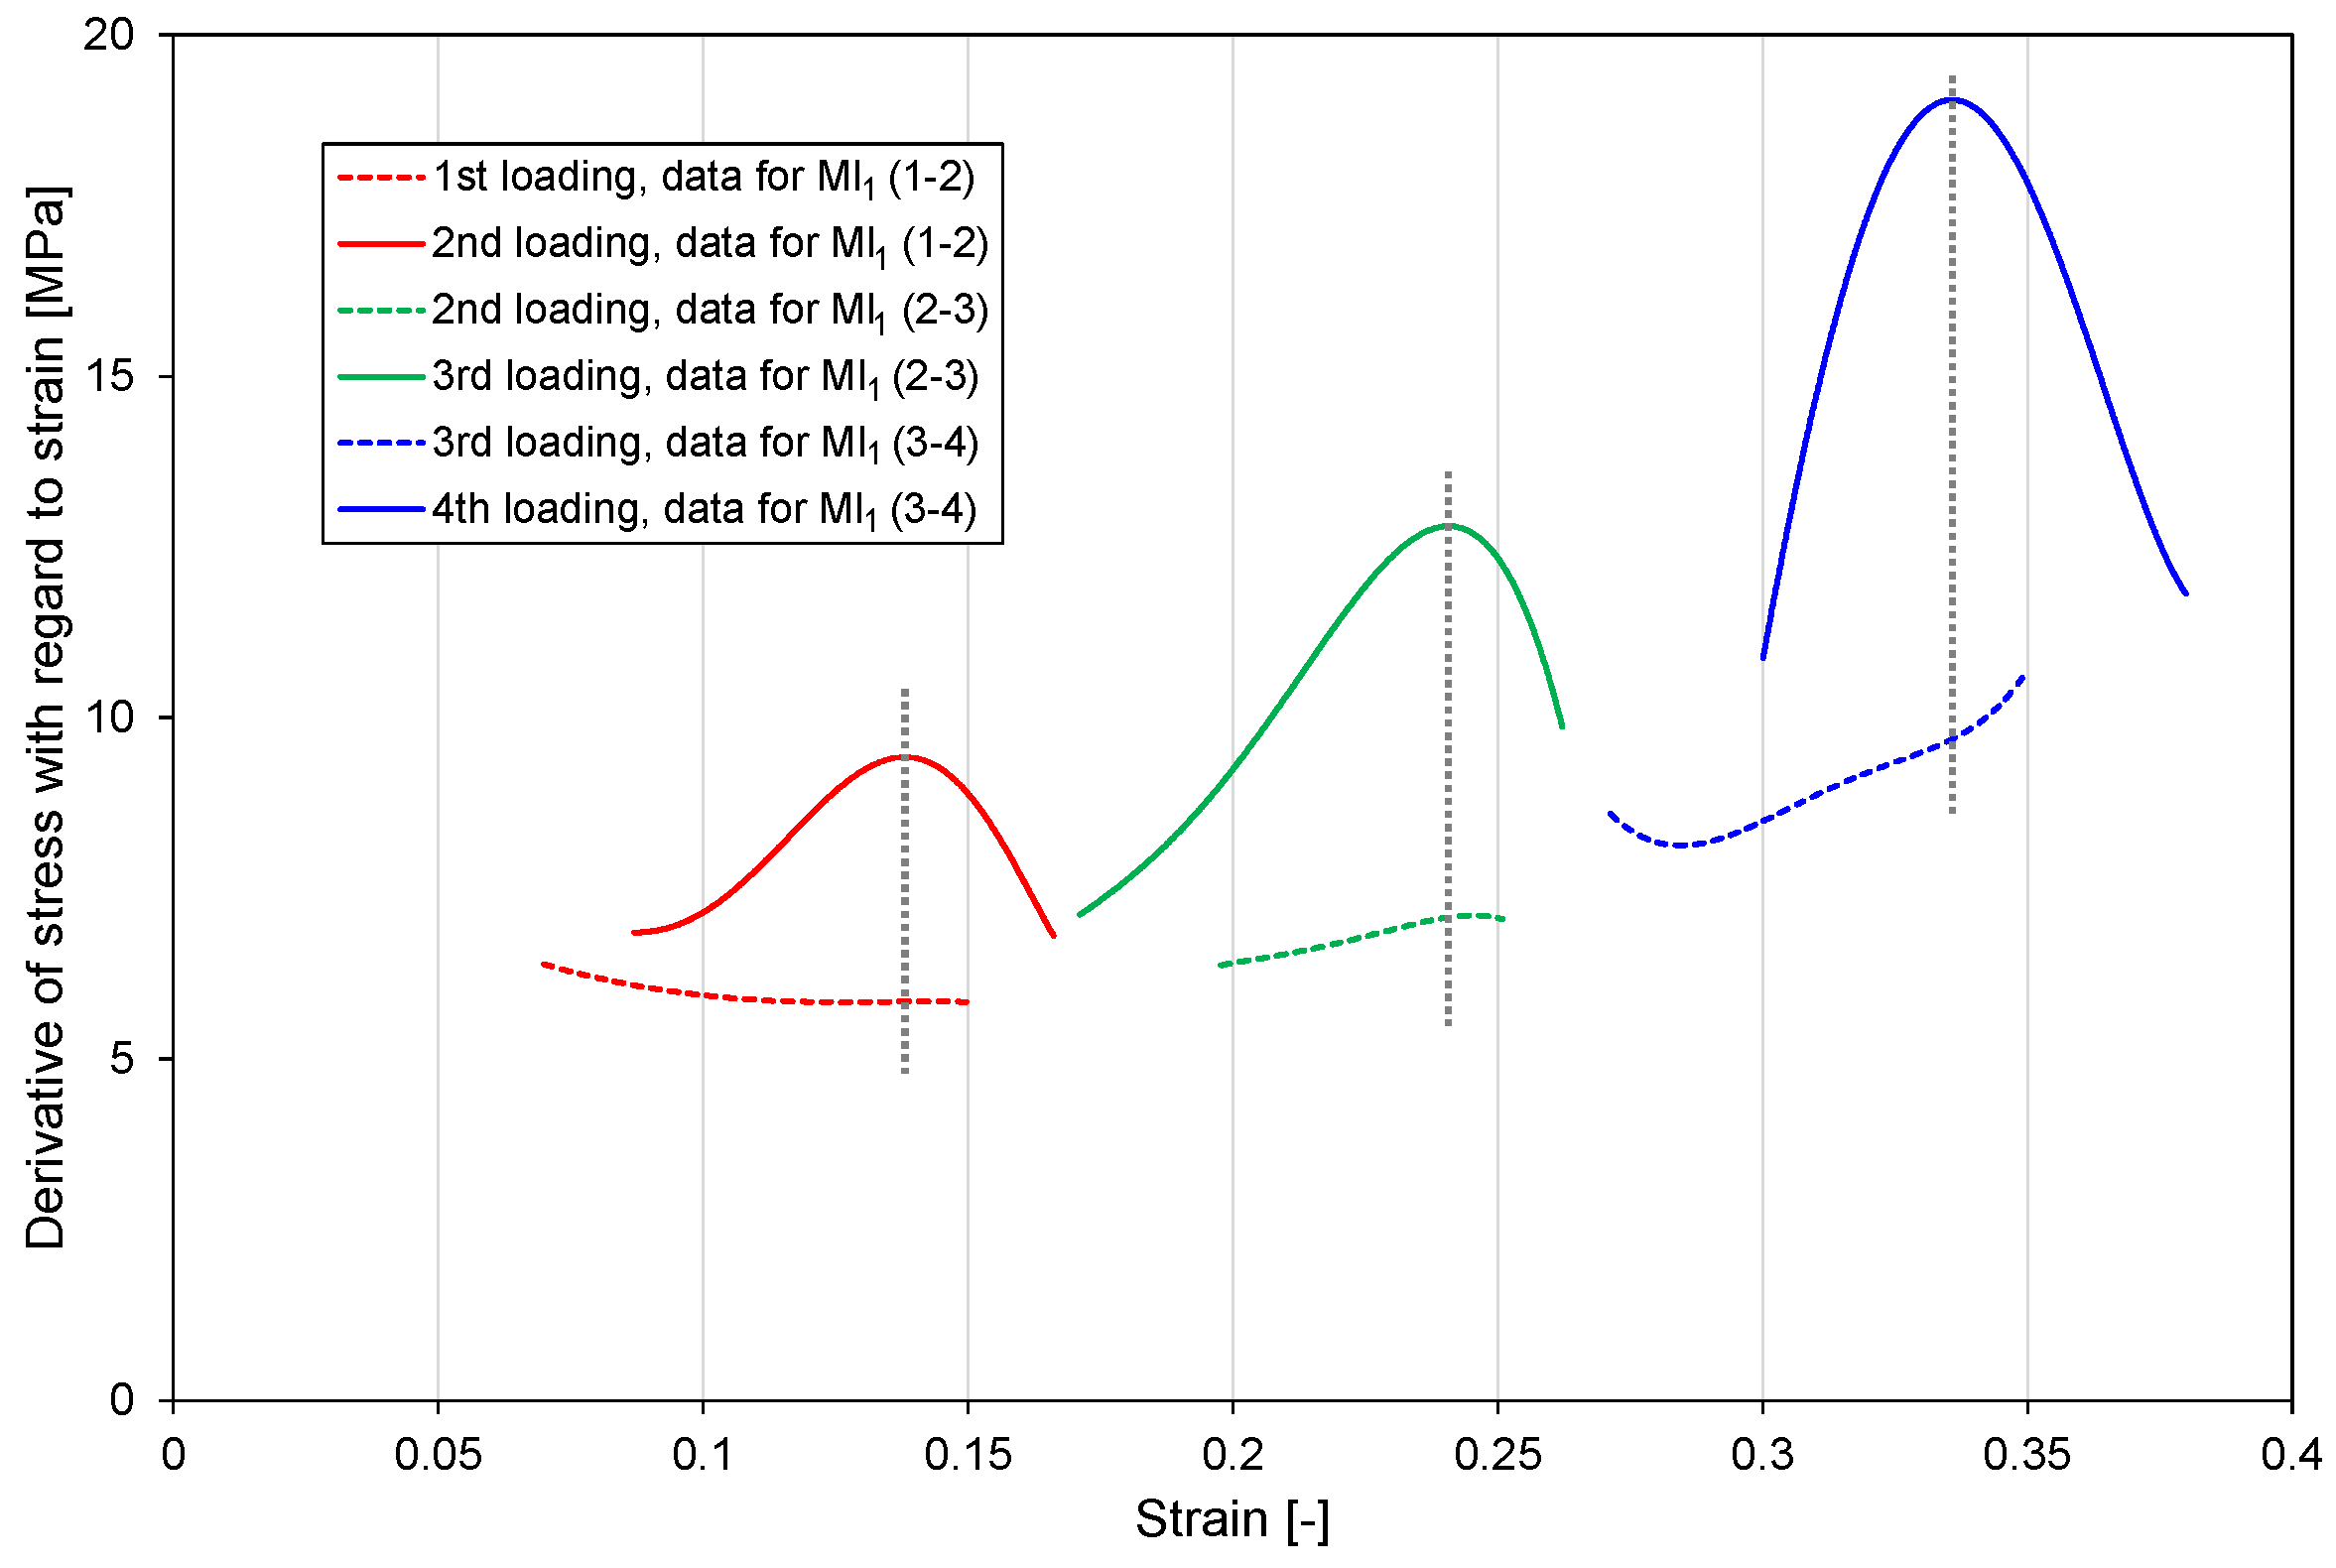
| MI1 | Mullins index 1 (from C2 tests) | This index quantifies the Mullins effect as the derivative of loading curve n + 1 divided by derivative of loading curve n, at the strain corresponding to a local maximum of the former derivative, occurring just below the maximum strain of the latter. See Appendix B, Figure A1. |
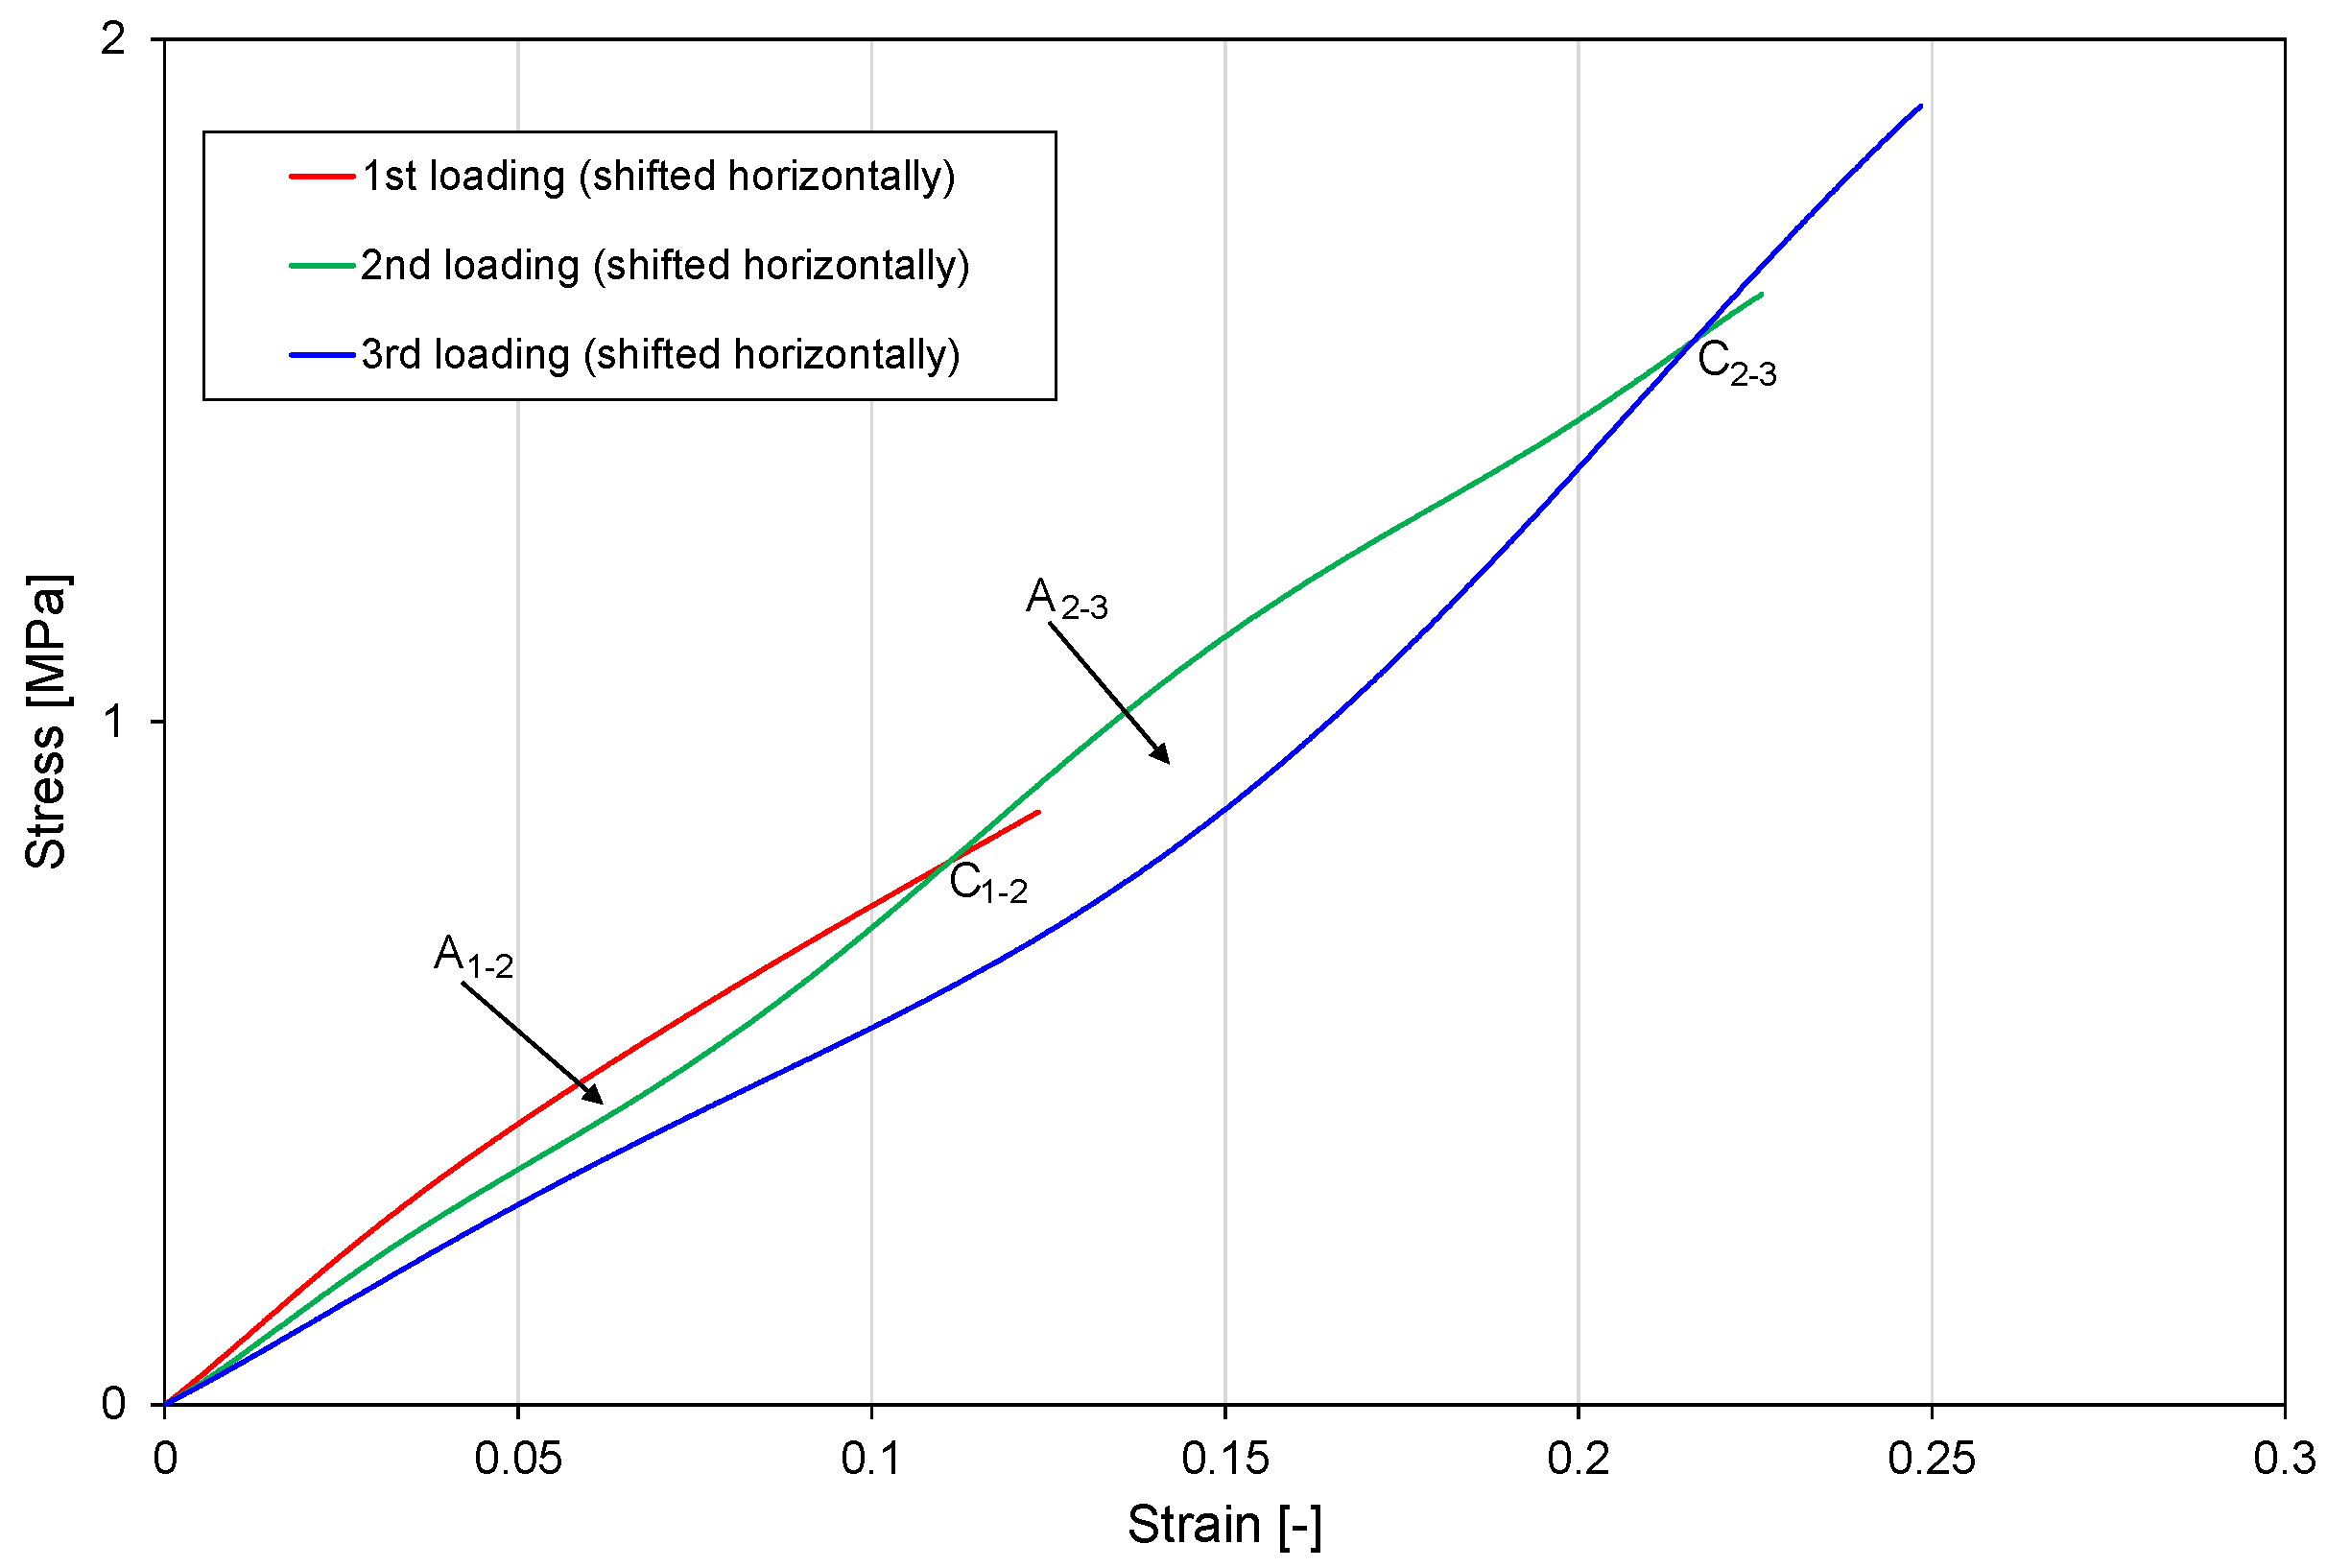
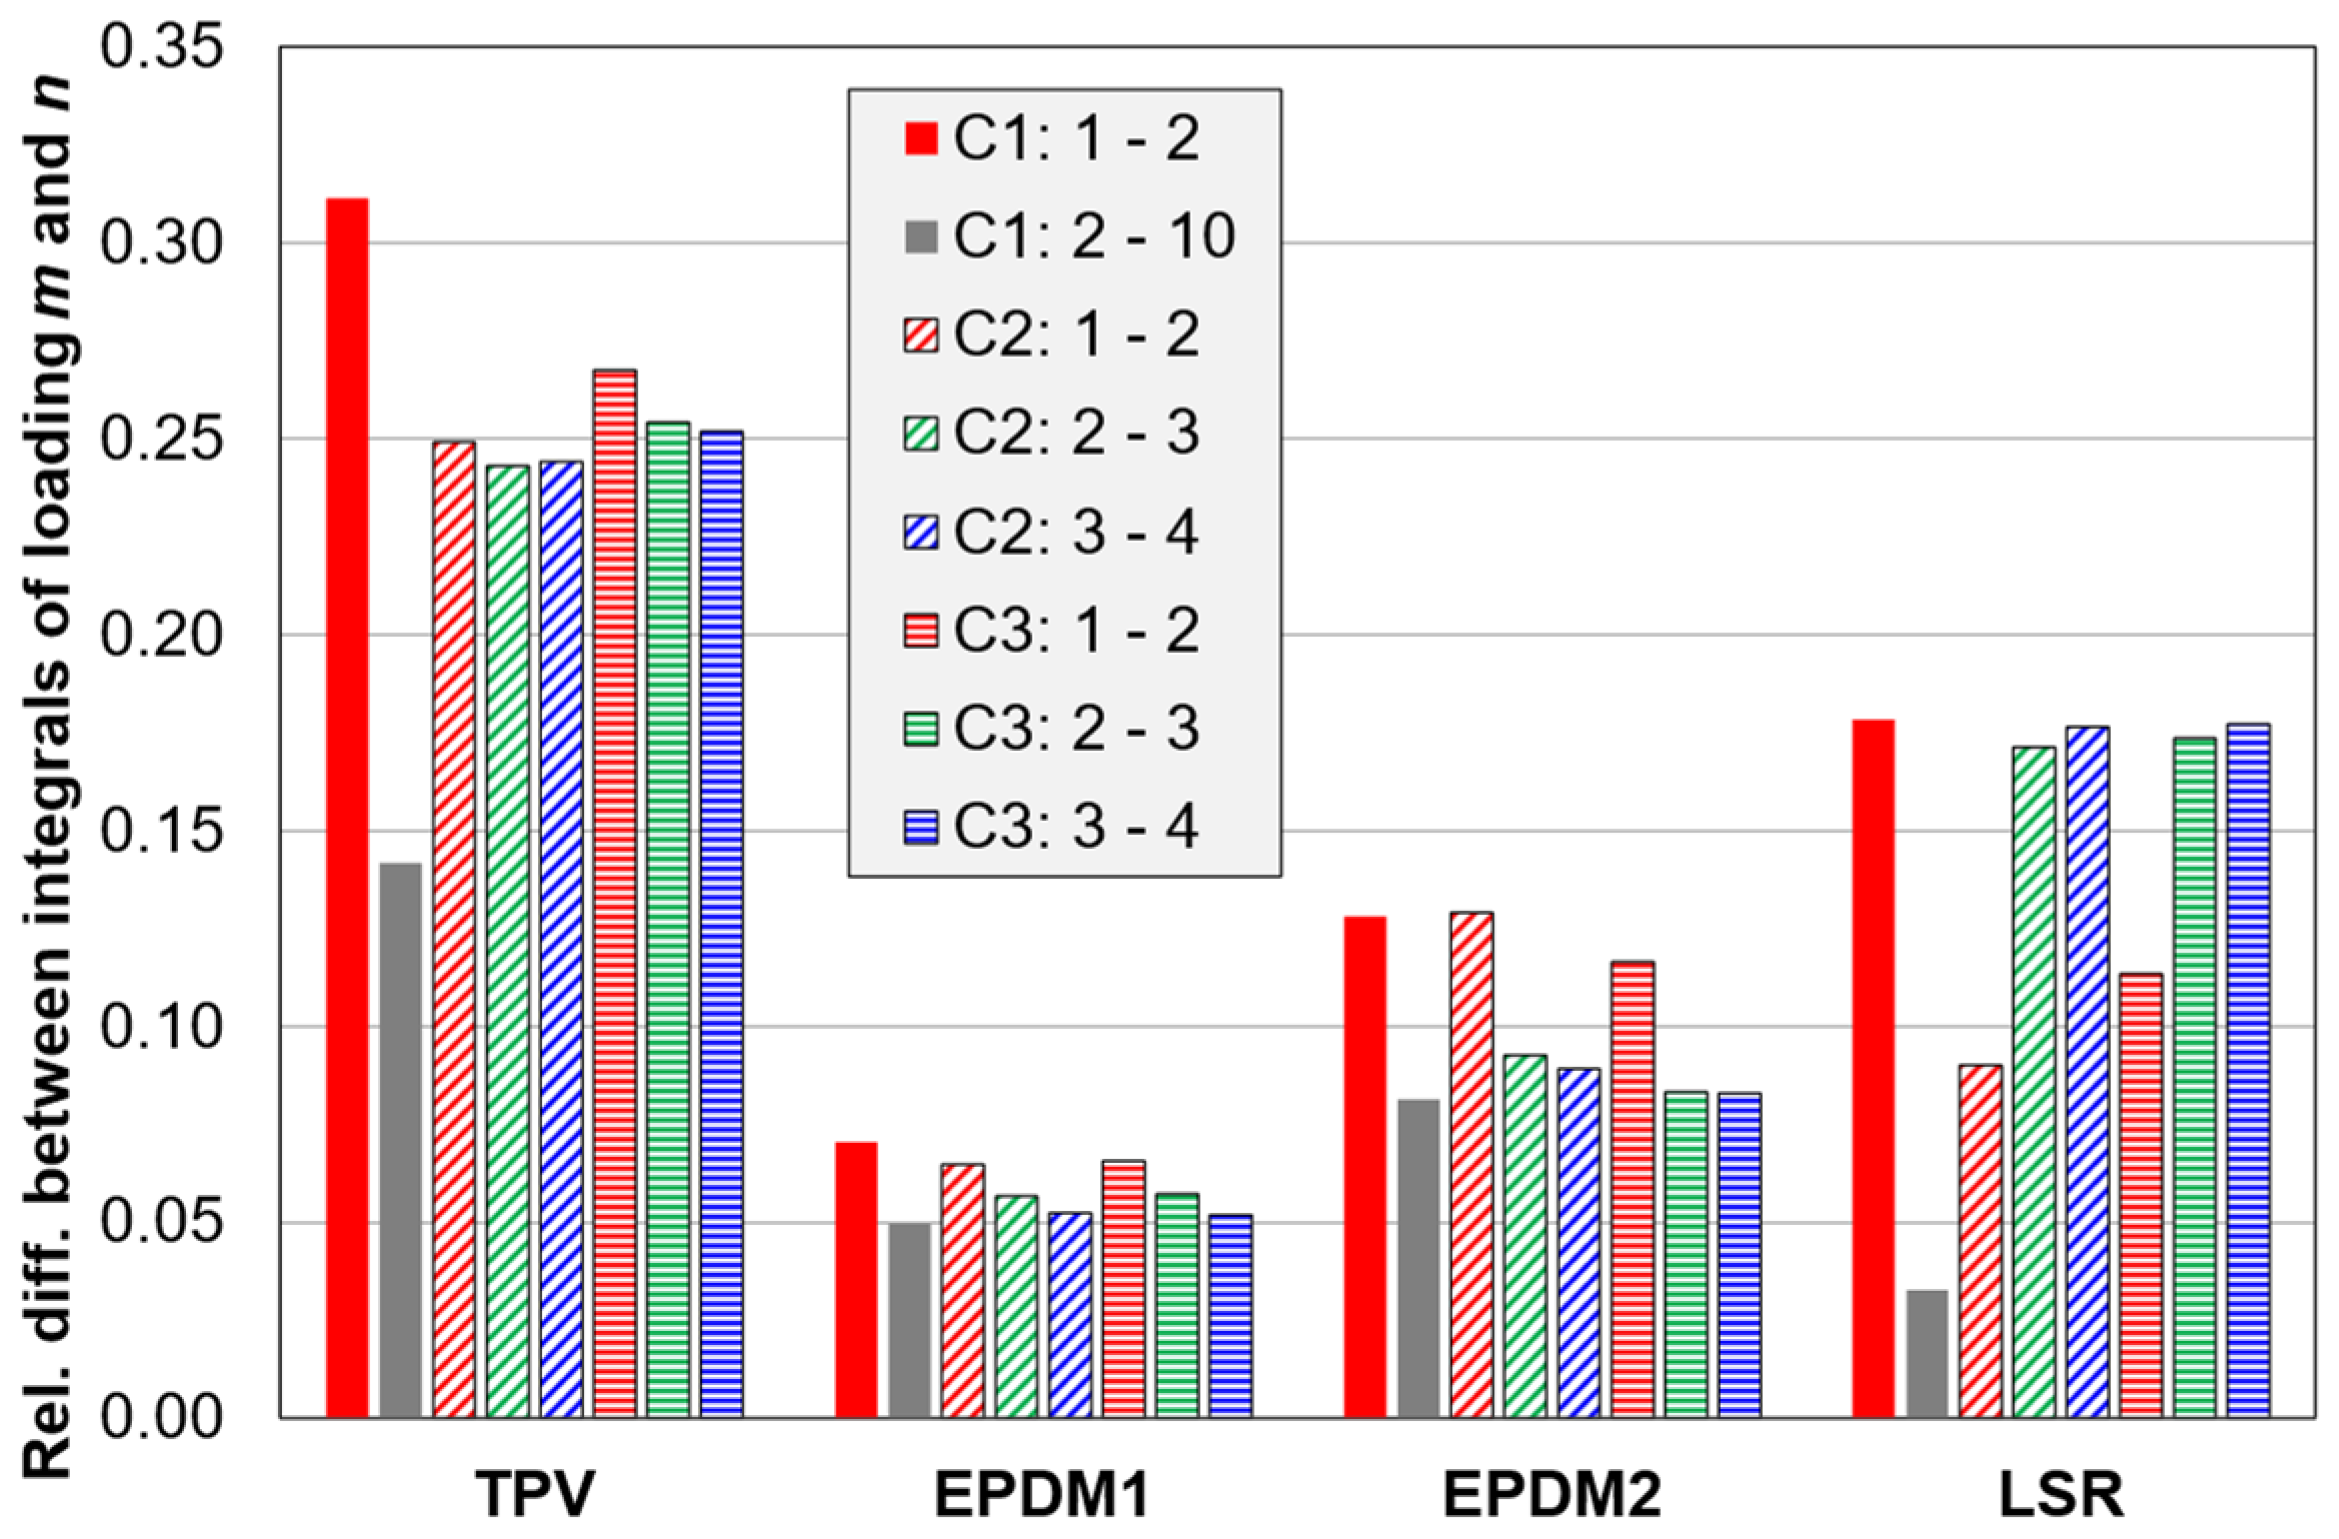
| MI2 | Mullins index 2 (from C2 tests) | This index is based on two consecutive loading curves in C2 tests. To reduce the effect of compression set on the index (via the different starting strains for the two loading curves), the curves are shifted horizontally to start at zero strain; see Appendix B, Figure A2. Then, if a Mullins effect is present, the two curves will cross again at a strain somewhat before the end of the first curve. The index is defined as the relative difference between the integrals of the first and second curve, integrated from zero strain to the crossing strain. Here, “relative” means dividing by the integral of the first curve. |
| CS | Compression set after unloading | Residual strain (instantly) after unloading divided by the strain amplitude (before unloading). The residual strain after unloading is obtained by extrapolating the last part of the unloading curve to zero stress. |
| CSR | Compression set after recovery (for C3 tests) | Residual strain after the recovery stage, divided by the strain amplitude (before unloading). |
| HL | Relative hysteresis loss | The hysteresis loss is the difference between the integral of the loading curve and the integral of the corresponding unloading curve. The relative hysteresis loss is the hysteresis loss divided by the integral of the loading curve. |
| ϕσ | Relaxed stress fraction (C3 tests) | Difference between the initial and final stress in the 5 min relaxation stage, divided by the initial stress. The initial stress is the same as the peak stress (after loading). |
| ϕε | Recovered strain fraction (C3 tests) | Difference between the initial and final strain in the 5 min recovery stage, divided by the initial strain. The initial strain is the instant residual strain after unloading. (The initial and final strains are the basis for CS and CSR, respectively.) |
| ID | Tg (°C) | Tm (°C) | Hm (J/g) | w2 a | w5 b | w7 c | w8 d | T95% (°C) |
|---|---|---|---|---|---|---|---|---|
| TPV | −52.9 | 147.3 | 17.0 | 92.9% | 1.1% | 0.0% | 6.0% | 280 |
| LSR | −45.3 | 7.7 | - e | 0.0% | - e | 0.0% | 460 | |
| EPDM1 | −52.9 | 52.3 | 2.8 | 57.0% | 35% | 1.8% | 6.0% | 390 |
| EPDM2 | −54.1 | 52.0 | 1.6 | 52.4% | 41% | 0.6% | 4.8% | 378 |
| ID | ν | n |
|---|---|---|
| TPV | 0.49 ± 0.01 | 4 |
| LSR | 0.50 ± 0.01 | 3 |
| EPDM1 | 0.49 ± 0.02 | 6 |
Publisher’s Note: MDPI stays neutral with regard to jurisdictional claims in published maps and institutional affiliations. |
© 2022 by the authors. Licensee MDPI, Basel, Switzerland. This article is an open access article distributed under the terms and conditions of the Creative Commons Attribution (CC BY) license (https://creativecommons.org/licenses/by/4.0/).
Share and Cite
Persson, A.-M.M.R.; Andreassen, E. Cyclic Compression Testing of Three Elastomer Types—A Thermoplastic Vulcanizate Elastomer, a Liquid Silicone Rubber and Two Ethylene-Propylene-Diene Rubbers. Polymers 2022, 14, 1316. https://doi.org/10.3390/polym14071316
Persson A-MMR, Andreassen E. Cyclic Compression Testing of Three Elastomer Types—A Thermoplastic Vulcanizate Elastomer, a Liquid Silicone Rubber and Two Ethylene-Propylene-Diene Rubbers. Polymers. 2022; 14(7):1316. https://doi.org/10.3390/polym14071316
Chicago/Turabian StylePersson, Anna-Maria Märta Ruth, and Erik Andreassen. 2022. "Cyclic Compression Testing of Three Elastomer Types—A Thermoplastic Vulcanizate Elastomer, a Liquid Silicone Rubber and Two Ethylene-Propylene-Diene Rubbers" Polymers 14, no. 7: 1316. https://doi.org/10.3390/polym14071316
APA StylePersson, A.-M. M. R., & Andreassen, E. (2022). Cyclic Compression Testing of Three Elastomer Types—A Thermoplastic Vulcanizate Elastomer, a Liquid Silicone Rubber and Two Ethylene-Propylene-Diene Rubbers. Polymers, 14(7), 1316. https://doi.org/10.3390/polym14071316