

Preparation and Characterization of Bio-Based PLA/PEG/g-C3N4 Low-Temperature Composite Phase Change Energy Storage Materials

Abstract
:1. Introduction
2. Materials and Methods
2.1. Materials
2.2. Formulation and Preparation of CPCMs
2.2.1. Preparation of g-C3N4
2.2.2. Formulation of CPCMs
2.2.3. Preparation of CPCMs Samples
2.3. Characterization
2.3.1. Fourier-Transform Infrared Spectroscopy (FTIR)
2.3.2. Scanning Electron Microscopy (SEM) Analysis
2.3.3. X-ray Diffraction (XRD) Analysis
2.3.4. Nanoindentation
2.3.5. Differential Scanning Calorimetry (DSC)
2.3.6. Laser Flash Analysis (LFA)
2.3.7. Thermogravimetric Analysis (TGA)
3. Results
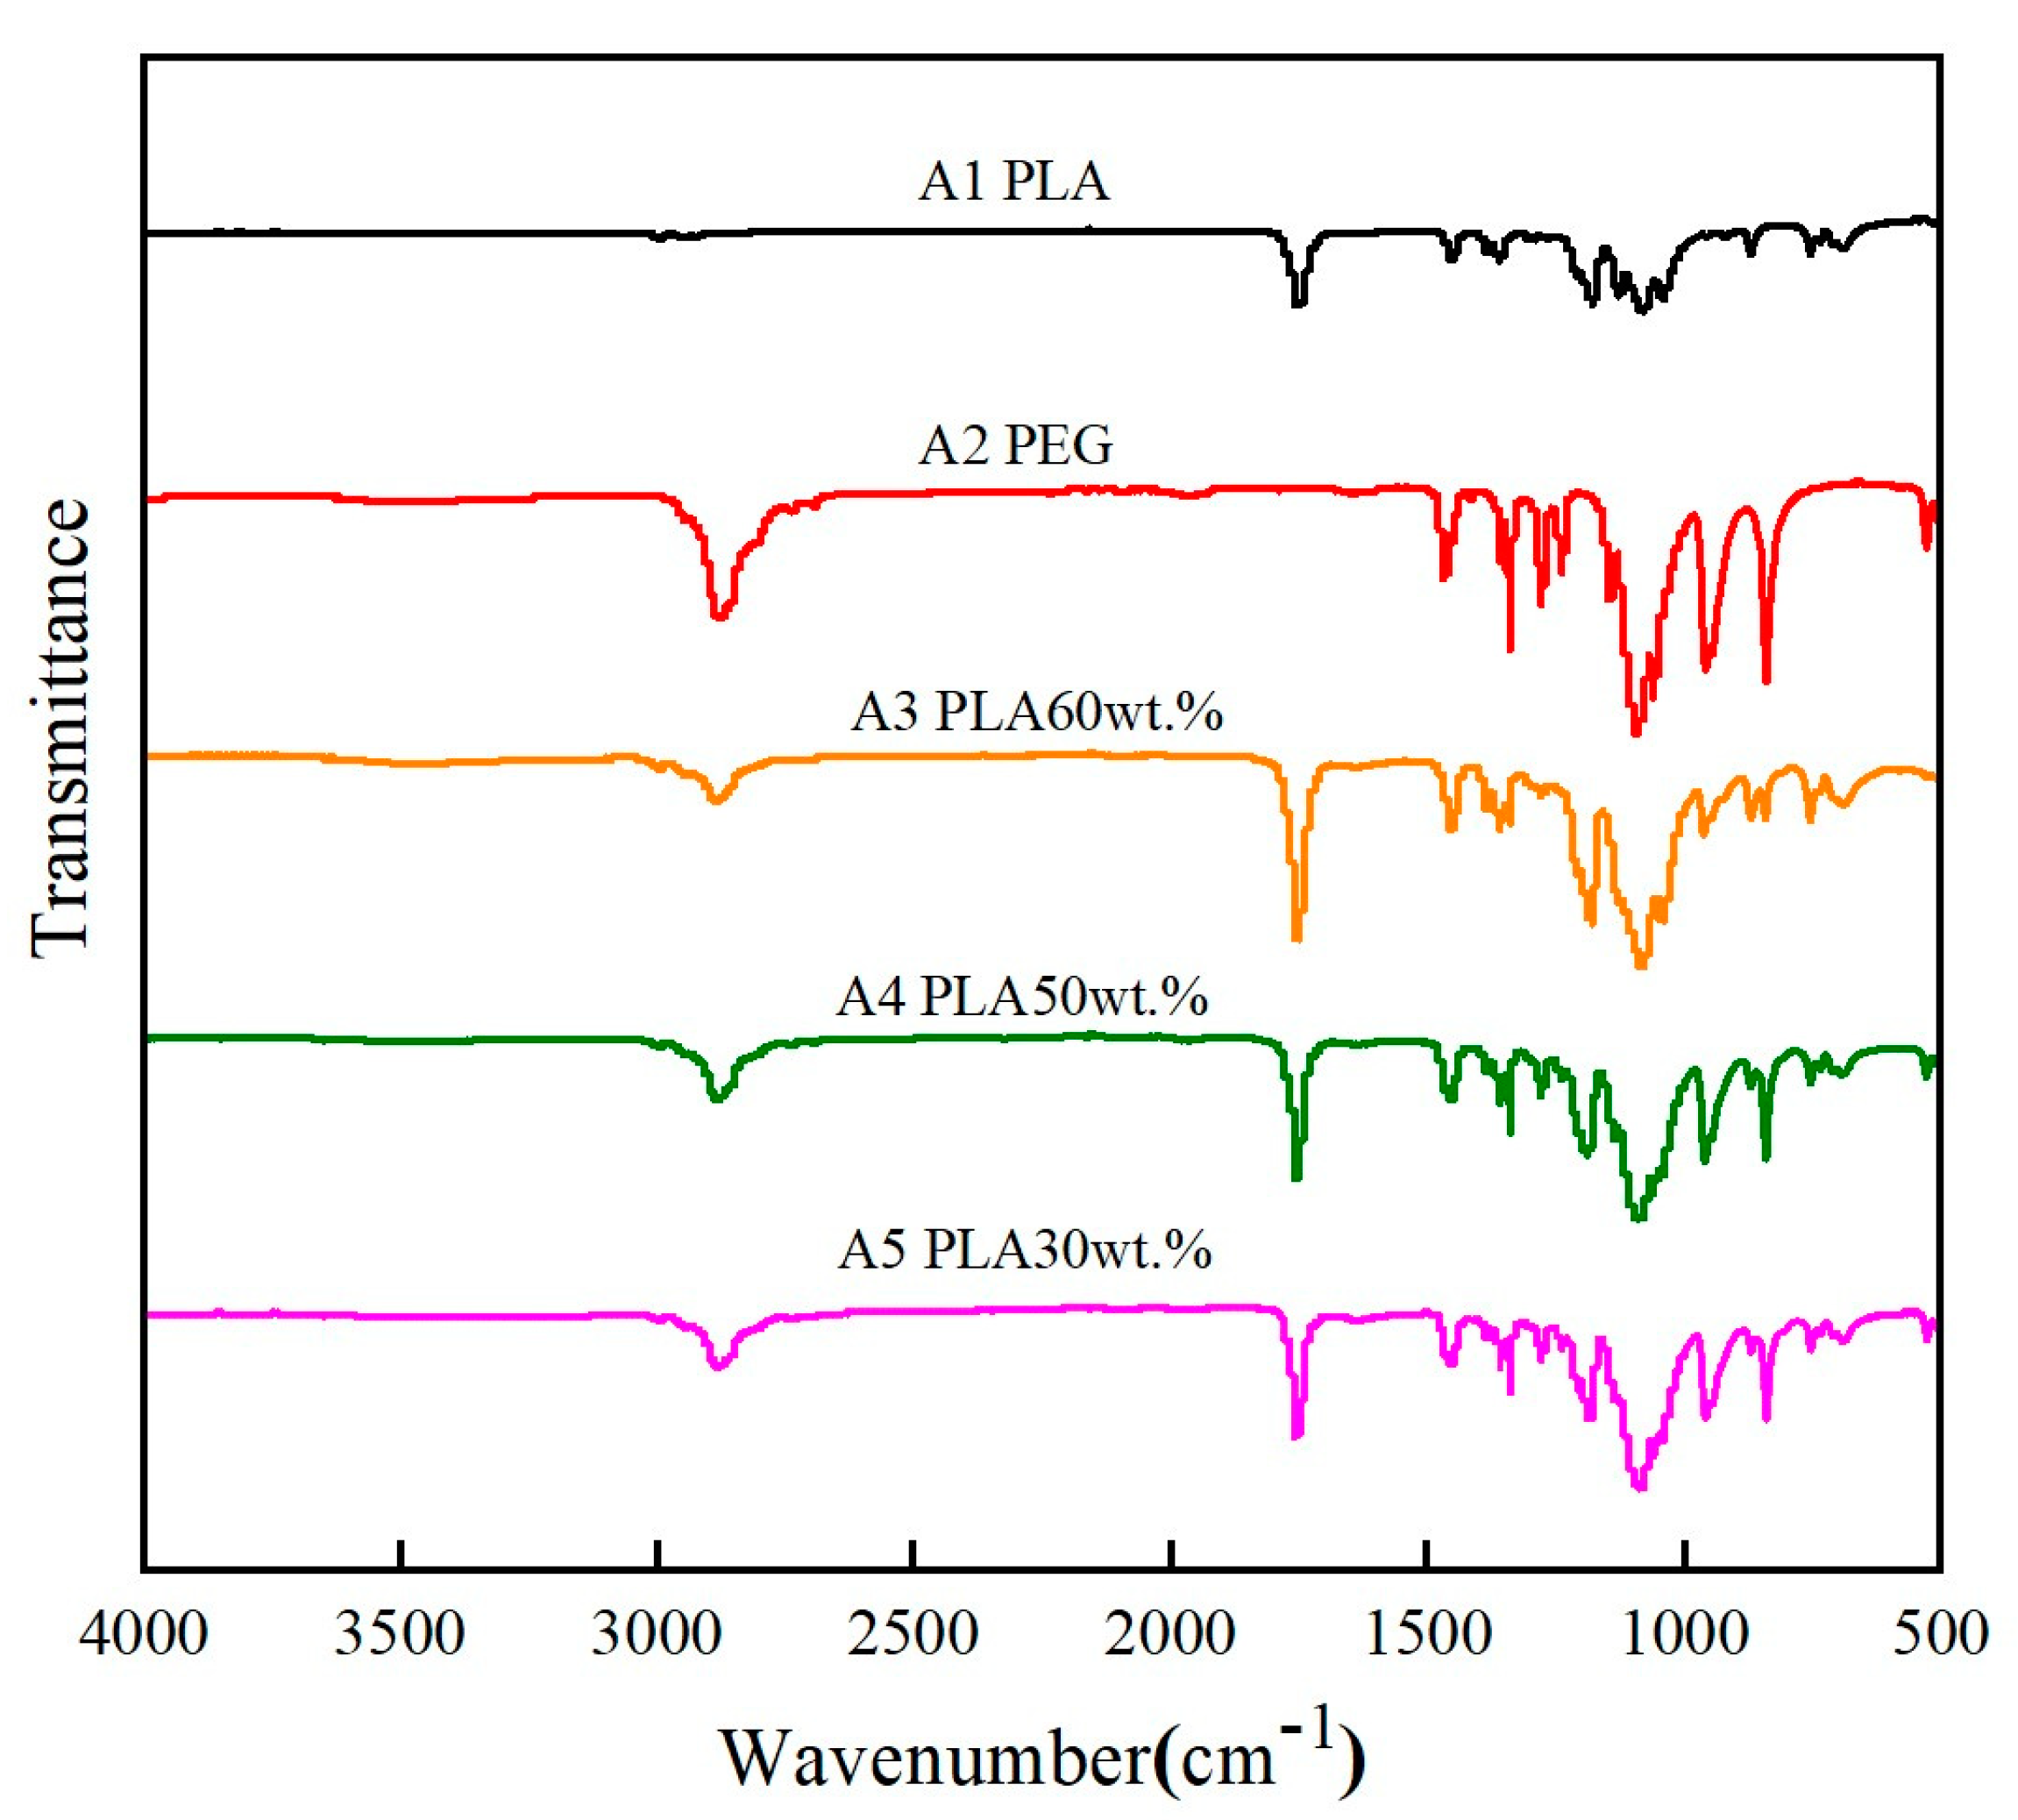
3.1. FTIR Analysis
3.2. SEM Analysis
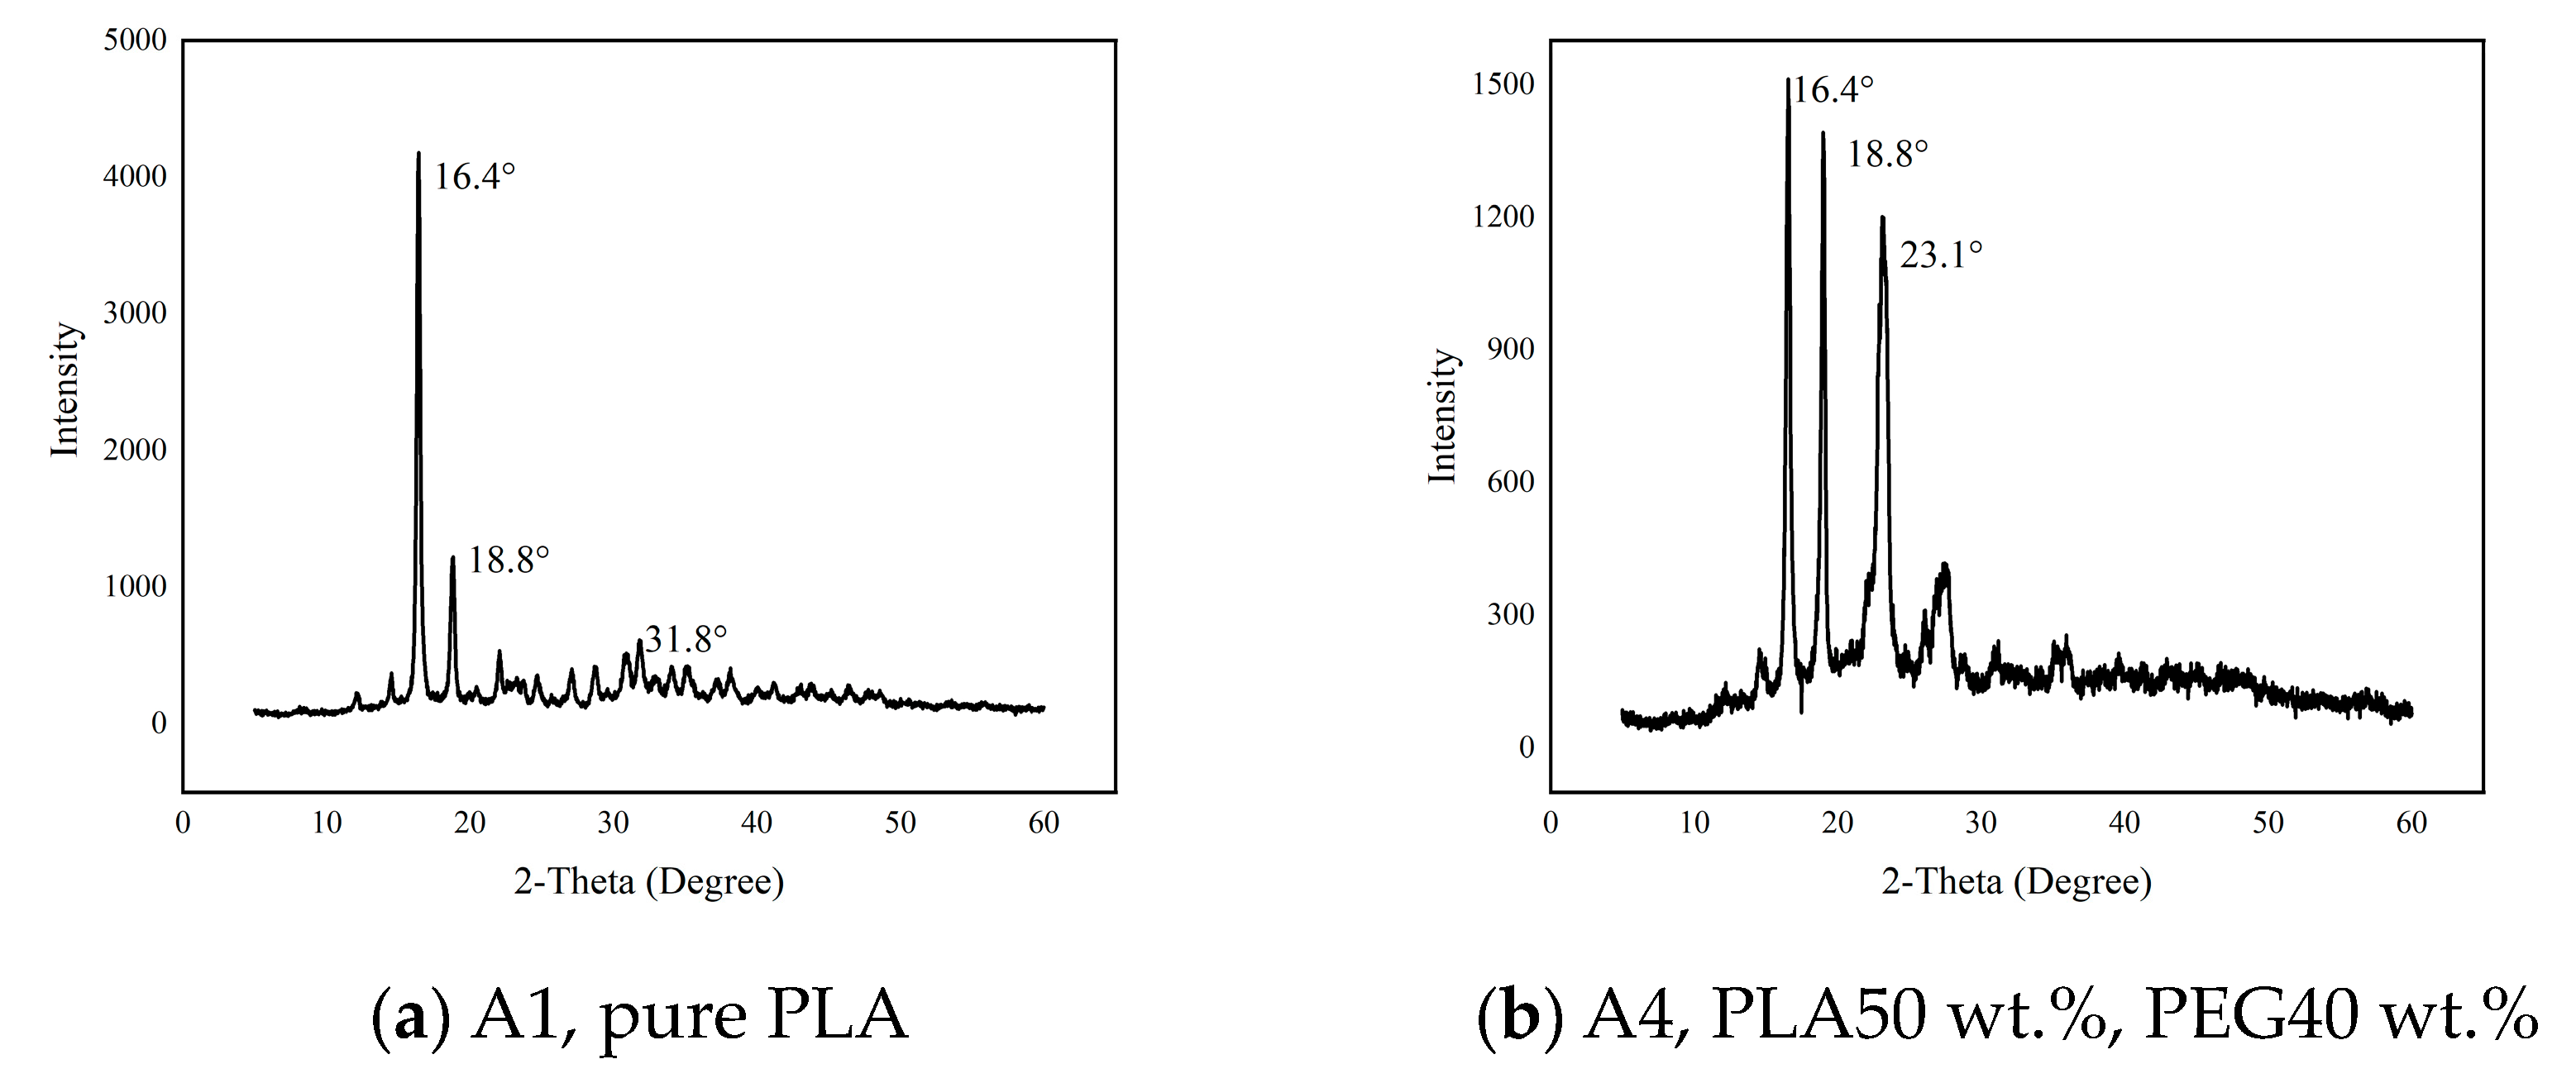
3.3. XRD Analysis
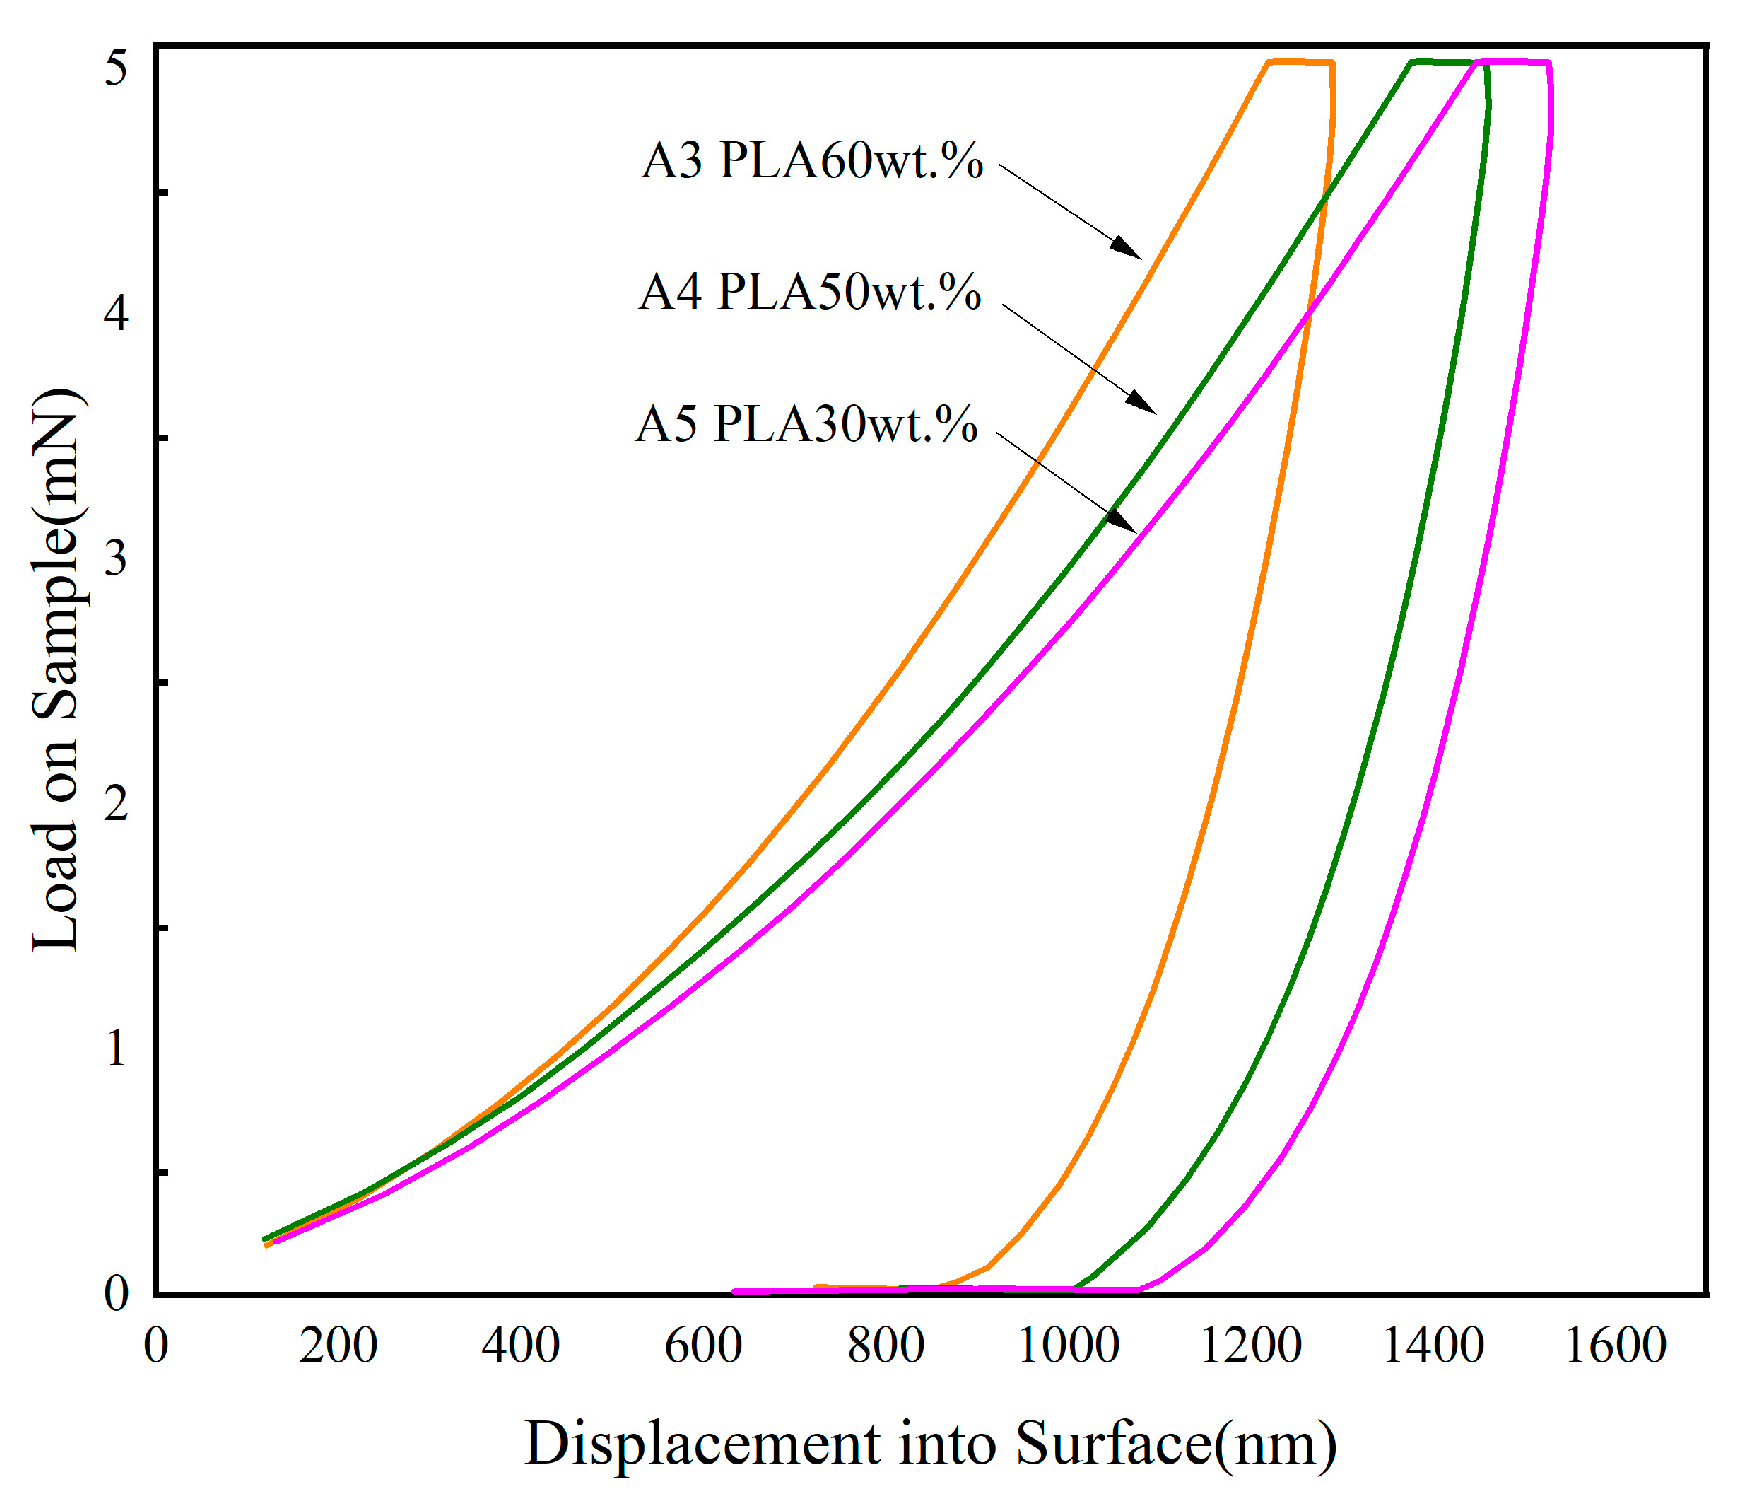
3.4. Analysis with Nanoindentation
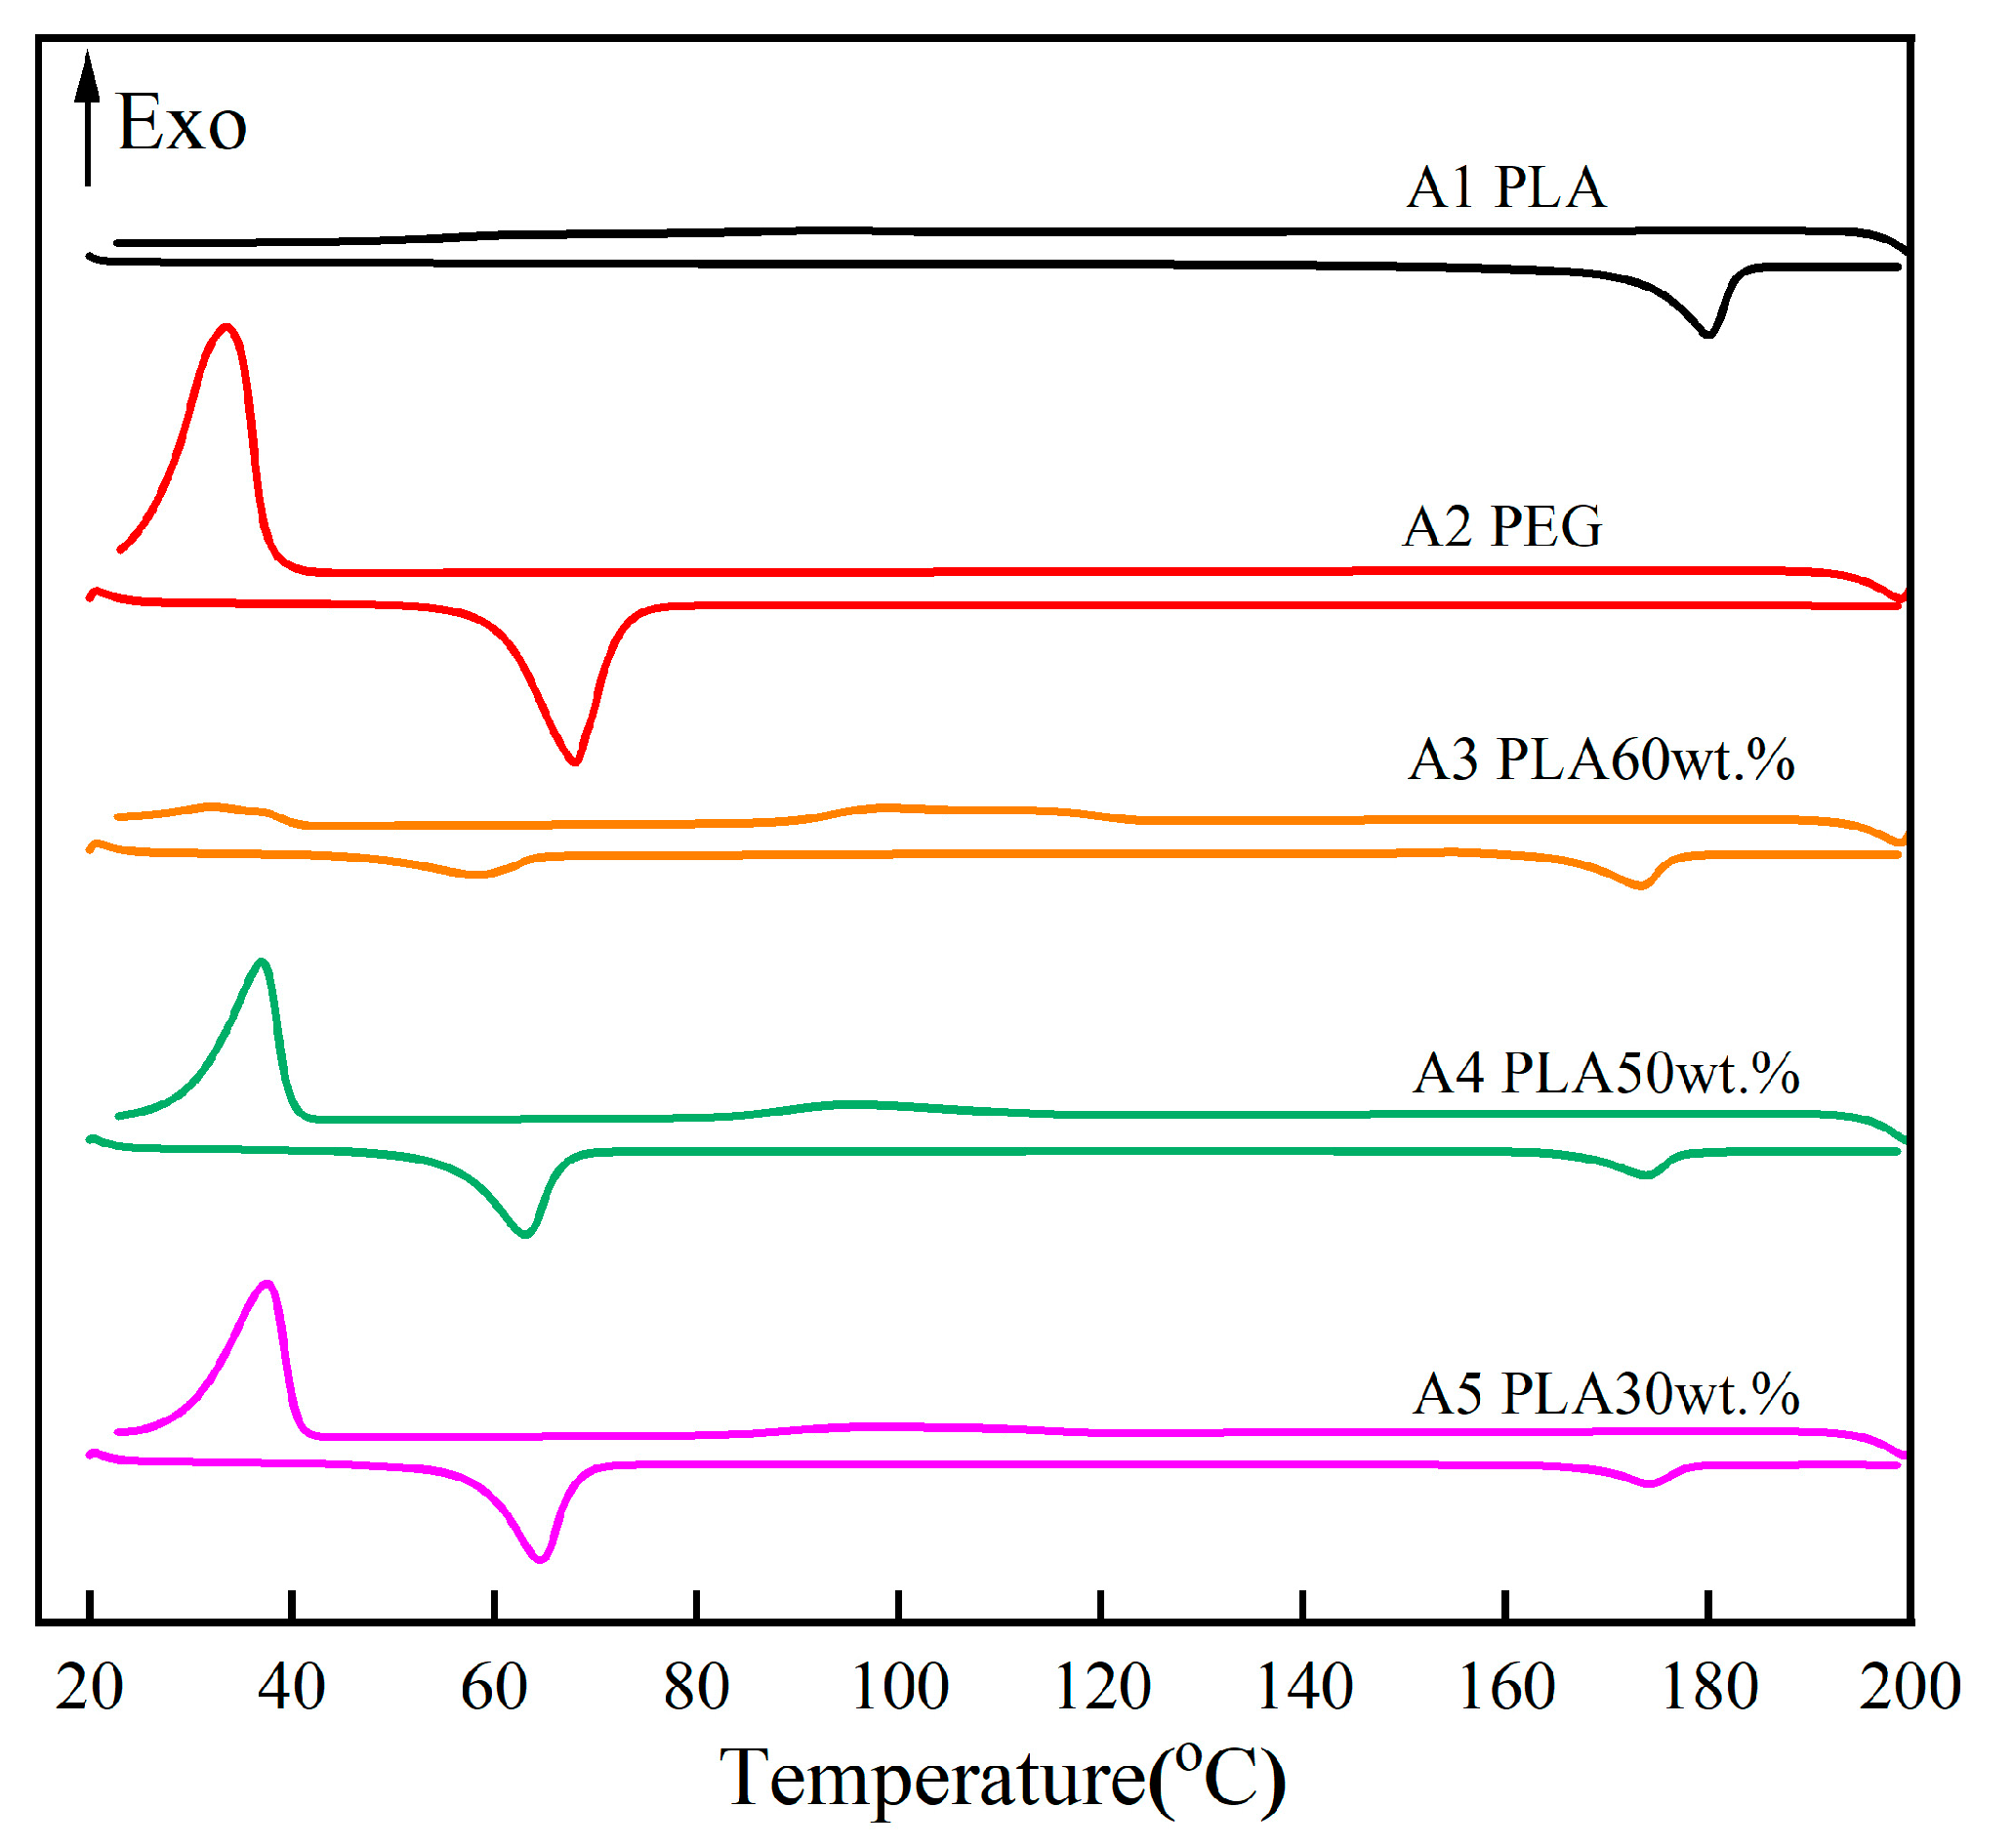
3.5. Phase Change Temperature and Latent Heat
3.6. Energy Density and Thermal Conductivity
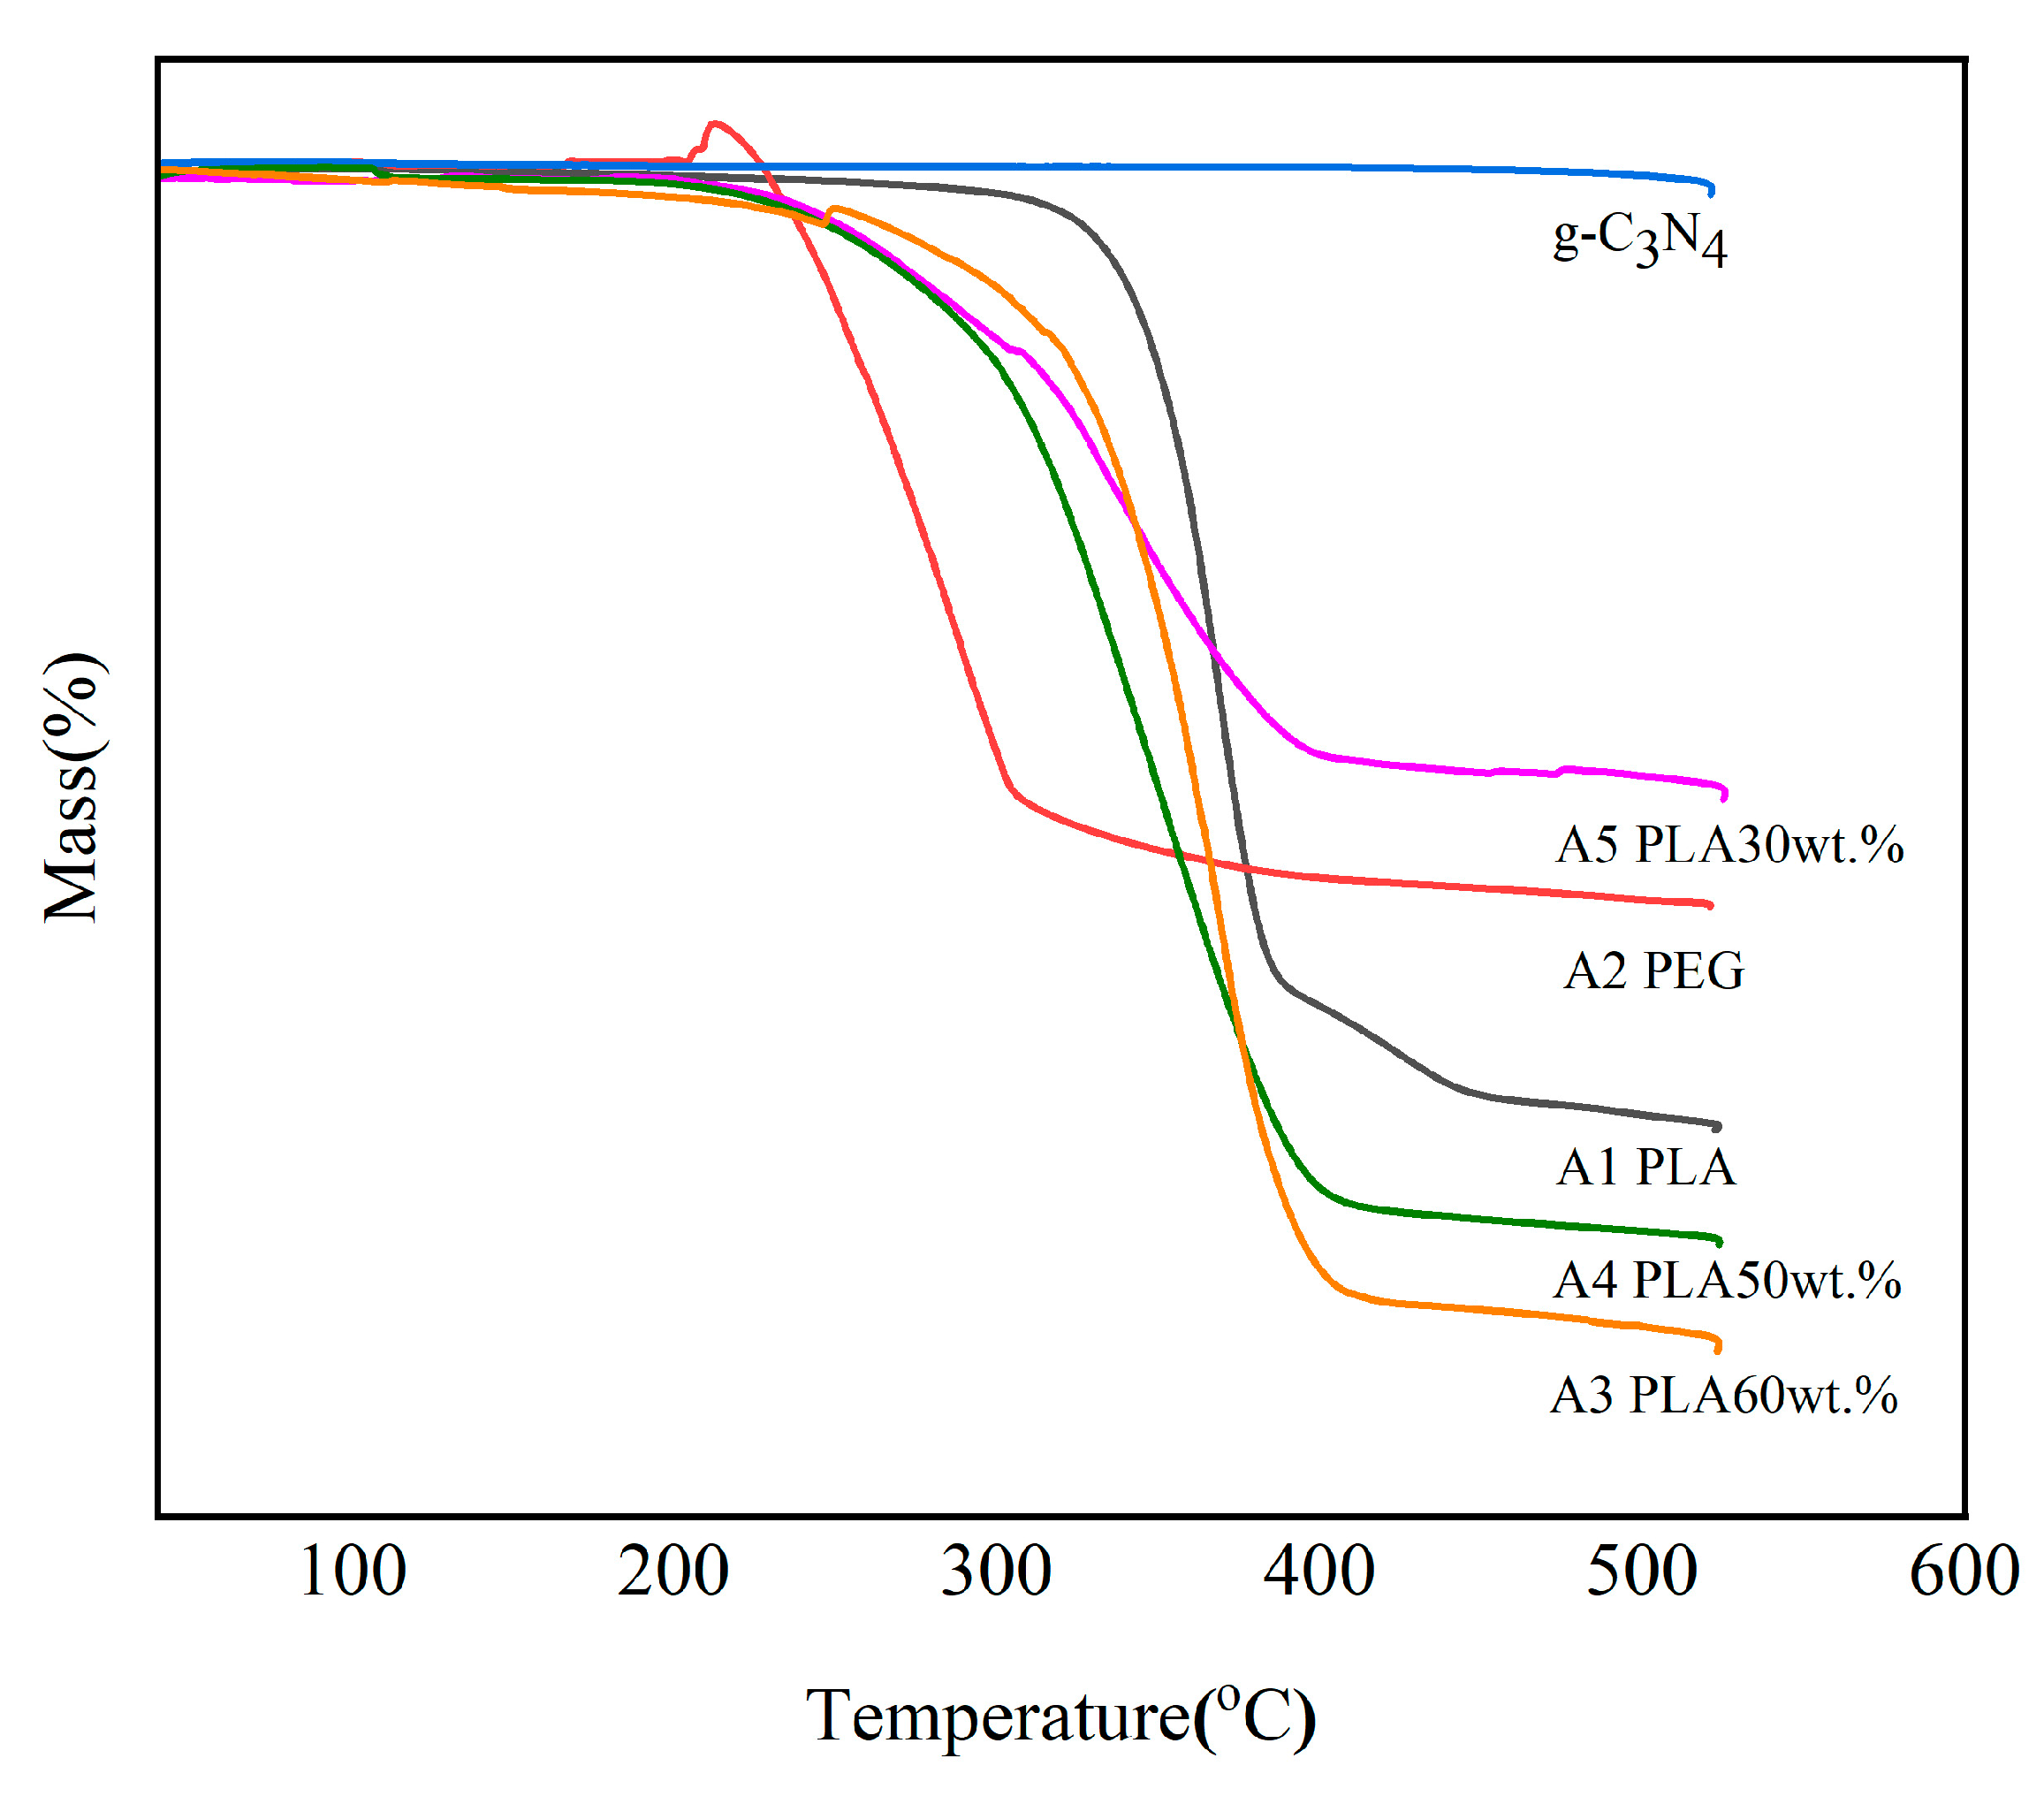
3.7. Thermal Stability
4. Energy Storage Mechanism of CPCMs
5. Conclusions
Author Contributions
Funding
Institutional Review Board Statement
Data Availability Statement
Conflicts of Interest
References
- Kerber, S.; Gilbert, A.Q.; Deinert, M.R.; Bazilian, M.D. Understanding the nexus of energy, environment and conflict: An overview. Renew. Sustain. Energy Rev. 2021, 151, 111473. [Google Scholar] [CrossRef]
- Mao, G.; Huang, N.; Chen, L.; Wang, H. Research on biomass energy and environment from the past to the future: A bibliometric analysis. Sci. Total Environ. 2018, 635, 1081–1090. [Google Scholar] [CrossRef] [PubMed]
- Hameed, G.; Ghafoor, M.A.; Yousaf, M.; Imran, M.; Zaman, M.; Elkamel, A.; Haq, A.; Rizwan, M.; Wilberforce, T.; Abdelkareem, M.A.; et al. Low temperature phase change materials for thermal energy storage: Current status and computational perspectives. Sustain. Energy Technol. Assess. 2022, 50, 101808. [Google Scholar] [CrossRef]
- Xu, T.; Chen, Q.; Huang, G.; Zhang, Z.; Gao, X.; Lu, S. Preparation and thermal energy storage properties of d-Mannitol/expanded graphite composite phase change material. Sol. Energy Mater. Sol. Cells 2016, 155, 141–146. [Google Scholar] [CrossRef]
- Meng, Y.; Zhao, Y.M.; Zhang, Y.; Tang, B. Induced dipole force driven PEG/PPEGMA form-stable phase change energy storage materials with high latent heat. Chem. Eng. J. 2020, 390, 124618. [Google Scholar] [CrossRef]
- Mishra, R.K.; Verma, K.; Mishra, V.; Chaudhary, B. A review on carbon-based phase change materials for thermal energy storage. J. Energy Storage 2022, 50, 104166. [Google Scholar] [CrossRef]
- Tang, Y.; Lin, Y.; Jia, Y.; Fang, G. Improved thermal properties of stearyl alcohol/high density polyethylene/expanded graphite composite phase change materials for building thermal energy storage. Energy Build. 2017, 153, 41–49. [Google Scholar] [CrossRef]
- Tang, Y.; Su, D.; Huang, X.; Alva, G.; Liu, L.; Fang, G. Synthesis and thermal properties of the MA/HDPE composites with nano-additives as form-stable PCM with improved thermal conductivity. Appl. Energy 2016, 180, 116–129. [Google Scholar] [CrossRef]
- Cangialosi, D.; Alegría, A.; Colmenero, J. Effect of nanostructure on the thermal glass transition and physical aging in polymer materials. Prog. Polym. Sci. 2016, 54–55, 128–147. [Google Scholar] [CrossRef]
- Nazari, M.; Jebrane, M.; Terziev, N. Multicomponent bio-based fatty acids system as phase change material for low temperature energy storage. J. Energy Storage 2021, 39, 102645. [Google Scholar] [CrossRef]
- Mert, H.H.; Eslek, A.; Mert, E.H.; Mert, M.S. Preparation and characterization of shape-stable bio-based composite phase change materials for thermal energy storage: Coconut oil / activated carbon from cherry stones doped composites. Energy Sources Part A Recovery Util. Environ. Eff. 2022, 44, 5381–5397. [Google Scholar] [CrossRef]
- Abe, K.; Higashi, K.; Watabe, K.; Kobayashi, A.; Limwikrant, W.; Yamamoto, K.; Moribe, K. Effects of the PEG molecular weight of a PEG-lipid and cholesterol on PEG chain flexibility on liposome surfaces. Colloids Surf. A Physicochem. Eng. Asp. 2015, 474, 63–70. [Google Scholar] [CrossRef] [Green Version]
- Greco, A.; Ferrari, F.; Maffezzoli, A. Mechanical properties of poly(lactid acid) plasticized by cardanol derivatives. Polym. Degrad. Stab. 2019, 159, 199–204. [Google Scholar] [CrossRef]
- Lebedev, S.M.; Khlusov, I.A.; Chistokhin, D.M. Poly(lactic acid) based polymer composites for biomedicine. AIP Conf. Proc. 2020, 2310, 020180. [Google Scholar] [CrossRef]
- Wang, J.; Lian, X.; Chen, S.; Li, H.; Xu, K. Effect of Bi2WO6/g-C3N4 composite on the combustion and catalytic decomposition of energetic materials: An efficient catalyst with g-C3N4 carrier. J. Colloid Interface Sci. 2022, 610, 842–853. [Google Scholar] [CrossRef]
- Wu, B.; Ge, L.; Wu, H.; Wang, X.; Ge, Q.; Miao, J.; Cao, M.; Chen, P.; Xia, R.; Qian, J. Layer-by-Layer Assembled g-C3N4 Nanosheets/Cellulose Nanofibers Oriented Membrane-Filler Leading to Enhanced Thermal Conductivity. Adv. Mater. Interfaces 2019, 6. [Google Scholar] [CrossRef]
- Afsharpanah, F.; Izadi, M.; Hamedani, F.A.; Mousavi Ajarostaghi, S.S.; Yaïci, W. Solidification of nano-enhanced PCM-porous composites in a cylindrical cold thermal energy storage enclosure. Case Stud. Therm. Eng. 2022, 39, 102421. [Google Scholar] [CrossRef]
- Zhou, X.; Qiu, S.; Liu, J.; Zhou, M.; Cai, W.; Wang, J.; Chu, F.; Xing, W.; Song, L.; Hu, Y. Construction of porous g-C3N4@PPZ tubes for high performance BMI resin with enhanced fire safety and toughness. Chem. Eng. J. 2020, 401, 126094. [Google Scholar] [CrossRef]
- Zhang, L.; Tu, S.; Wang, H.; Du, Q. Preparation of polymer/graphene oxide nanocomposites by a two-step strategy composed of in situ polymerization and melt processing. Compos. Sci. Technol. 2018, 154, 1–7. [Google Scholar] [CrossRef]
- Teggar, M.; Ajarostaghi, S.S.; Yıldız, Ç.; Arıcı, M.; Ismail, K.A.; Niyas, H.; Lino, F.A.; Mert, M.S.; Khalid, M. Performance enhancement of latent heat storage systems by using extended surfaces and porous materials: A state-of-the-art review. J. Energy Storage 2021, 44, 103340. [Google Scholar] [CrossRef]
- Hang, Z.; Lv, Z.; Feng, L.; Liu, B. Study of Compatibility and Flame Retardancy of TPU/PLA Composites. Materials 2022, 15, 2339. [Google Scholar] [CrossRef] [PubMed]
- Jiang, Z.; Rivero, M.; Liu, X.; She, X.; Xuan, Y.; Ding, Y. A novel composite phase change material for medium temperature thermal energy storage manufactured with a scalable continuous hot-melt extrusion method. Appl. Energy 2021, 303, 117591. [Google Scholar] [CrossRef]
- Liu, Y.; Chen, W.; Kim, H. Synthesis, Characterization, and Hydrolytic Degradation of Polylactide/Poly(ethylene glycol)/Nano-silica Composite Films. J. Macromol. Sci. Part A—Chem. 2012, 49, 348–354. [Google Scholar] [CrossRef]
- Seligra, P.G.; Lamanna, M.; Famá, L. Promising PLA-functionalized MWCNT composites to use in nanotechnology. Polym. Compos. 2015, 37, 3066–3072. [Google Scholar] [CrossRef]
- Harmen, Y.; Chhiti, Y.; M’hamdi Alaoui, F.E.; Bentiss, F.; Jama, C.; Duquesne, S.; Bensitel, M. Thermal performance of PEG-MWCNTs composites as shape-stabilised phase change materials for thermal energy storage. Fuller. Nanotub. Carbon Nanostructures 2021, 29, 732–738. [Google Scholar] [CrossRef]
- Yu, Q.; Li, Y.; Han, L.; Yin, X.; Xu, J.; Zhou, Y.; Chen, D.; Du, Z.; Wang, L.; Tan, Y. Self-suspended starch fluids for simultaneously optimized toughness, electrical conductivity, and thermal conductivity of polylactic acid composite. Compos. Sci. Technol. 2019, 169, 76–85. [Google Scholar] [CrossRef]
- Cao, X.; Chi, X.; Deng, X.; Sun, Q.; Gong, X.; Yu, B.; Yuen, A.C.; Wu, W.; Li, R.K. Facile Synthesis of Phosphorus and Cobalt Co-Doped Graphitic Carbon Nitride for Fire and Smoke Suppressions of Polylactide Composite. Polymers 2020, 12, 1106. [Google Scholar] [CrossRef]
- Ghalia, M.A.; Dahman, Y. Investigating the effect of multi-functional chain extenders on PLA/PEG copolymer properties. Int. J. Biol. Macromol. Struct. Funct. Interact. 2017, 95, 494–504. [Google Scholar] [CrossRef]
- Lee, C.H.; Khalina, A.; Lee, S. Importance of Interfacial Adhesion Condition on Characterization of Plant-Fiber-Reinforced Polymer Composites: A Review. Polymers 2021, 13, 438. [Google Scholar] [CrossRef]
- Mohapatra, A.K.; Mohanty, S.; Nayak, S.K. Effect of PEG on PLA/PEG blend and its nanocomposites: A study of thermo-mechanical and morphological characterization. Polym. Compos. 2021, 35, 283–293. [Google Scholar] [CrossRef]
- Ji, X.; Cai, Y.; Xie, A.; Liu, J.; Zhu, P.; Zhang, M. Characterization of mechanical properties of hydroxyapatite/poly(lactic acid) composites based on nanoindentation method. J. Compos. 2018, 35, 11. (In Chinese) [Google Scholar]
- Hashim, N.; Amin, N.; Abdullah, S.; Abdullah, A.H.; Abdullah, N.; Mohamed, R.M.; Yahya, N.A.; Yusoh, K.B. The Effect of Blending Methods on the Properties of PLA/Gr Nanocomposites. J. Phys. Conf. Ser. 2020, 1532, 012012. [Google Scholar] [CrossRef]
- Li, F.; Zhang, S.; Liang, J.; Wang, J. Effect of polyethylene glycol on the crystallization and impact properties of polylactide-based blends. Polym. Adv. Technol. 2015, 26, 465–475. [Google Scholar] [CrossRef]
- Saravana, S.; Bheemaneni, G.; Kandaswamy, R. Effect of Polyethylene glycol on Mechanical, Thermal, and Morphological Properties of Talc Reinforced Polylactic Acid Composites. Mater. Today Proc. 2018, 5, 1591–1598. [Google Scholar] [CrossRef]
- Xue, P.; Wang, K.; Jia, M.; Yang, M. Biodegradation and mechanical property of polylactic acid/thermoplastic starch blends with poly (ethylene glycol). J. Wuhan Univ. Technol.-Mater. Sci. Ed. 2013, 28, 157–162. [Google Scholar] [CrossRef]
- Hashim, N.; Retenam, K.; Somderam, S.; Yusoh, K.B. Effect of Processing Method on Thermal Behavior in PLA/PEG Melt Blending. Adv. Mater. Res. 2015, 1134, 185–190. [Google Scholar] [CrossRef]
- Navarro, M.E.; Andréu, P.; Qiao, G.; Ding, Y. Thermal properties of a novel medium temperature thermal energy storage composite based on sodium nitrate as phase change material. In Proceedings of the 12th International Conference on Heat Transfer, Fluid Mechanics and Thermodynamics, Costa del Sol, Spain, 11–13 June 2016. [Google Scholar]
- Zhang, L.; Zhang, W.X.; Cai, G.N.; Fu, X.Y. Study of thermal performance parameters of PLA. Plast. Ind. 2012, 40, 68–71. (In Chinese) [Google Scholar]
- Wang, L. The Study on Preparation and Performances of Nanocomposites Phase Change Materials; Lanzhou University of Technology: Lanzhou, China, 2017. (In Chinese) [Google Scholar]
- Meng, J.; Tang, X.; Zhang, Z.; Zhang, X.; Shi, H. Fabrication and properties of poly(polyethylene glycol octadecyl ether methacrylate). Thermochim. Acta 2013, 574, 116–120. [Google Scholar] [CrossRef]


| Sample | A1 | A2 | A3 | A4 | A5 |
|---|---|---|---|---|---|
| PEG (wt.%) | 0 | 100 | 30 | 40 | 60 |
| PLA (wt.%) | 100 | 0 | 60 | 50 | 30 |
| g-C3N4 (wt.%) | 0 | 0 | 10 | 10 | 10 |
| Sample | A3 | A4 | A5 |
|---|---|---|---|
| Modulus At Max Load (GPa) | 3.577 | 3.267 | 3.044 |
| Hardness At Max Load (GPa) | 0.137 | 0.114 | 0.096 |
| Depth at Max Load (nm) | 1291.345 | 1491.341 | 1531.124 |
| Melt | |||||||
| Sample | Fusion Temperature Tmo1 (°C) | Melting Point Tmp1 (°C) | Latent Heat ΔHm1 (J/g) | Fusion Temperature Tmo2 (°C) | Melting Point Tmp2 (°C) | Latent Heat ΔHm2 (J/g) | Total Latent Heat Total ΔHm (J/g) |
| A1 | / | / | / | 173.65 | 180.02 | 68.12 | 68.12 |
| A2 | 60.25 | 68.00 | 163.10 | / | / | / | 163.10 |
| A3 | 47.28 | 58.36 | 30.99 | 165.94 | 173.29 | 27.81 | 58.80 |
| A4 | 56.02 | 63.06 | 83.69 | 167.14 | 173.83 | 21.19 | 104.88 |
| A5 | 58.29 | 64.54 | 89.80 | 168.40 | 174.15 | 16.30 | 106.1 |
| Crystallization | |||||||
| Sample | Crystallization Temperature Tco1 (°C) | Tcp1 (°C) | Latent Heat ΔHc1 (J/g) | Crystallization Temperature Tco2 (°C) | Tcp2 (°C) | Latent Heat ΔHc2 (J/g) | Total Latent Heat Total ΔHc (J/g) |
| A1 | / | / | / | 105.08 | 91.62 | 3.27 | 3.27 |
| A2 | 37.35 | 33.57 | 114.89 | / | / | / | 114.89 |
| A3 | 39.90 | 32.23 | 7.42 | 123.55 | 98.27 | 22.10 | 29.52 |
| A4 | 39.73 | 36.97 | 64.85 | 114.90 | 94.63 | 15.01 | 79.86 |
| A5 | 40.41 | 37.51 | 68.73 | 119.15 | 96.43 | 11.32 | 80.05 |
| T (°C) | 30 | 50 | 80 | 100 | 120 | Average |
|---|---|---|---|---|---|---|
| A1 | 1.87 | 2.01 | 2.21 | 2.32 | 2.36 | 2.15 |
| A3 | 1.79 | 3.91 | 2.17 | 2.20 | 2.24 | 2.46 |
| A4 | 2.02 | 3.18 | 2.51 | 2.52 | 2.60 | 2.57 |
| A5 | 1.74 | 2.65 | 2.29 | 2.24 | 2.29 | 2.24 |
| T (°C) | 50 | 80 | 100 | 120 | Average | Enhancement |
|---|---|---|---|---|---|---|
| A1 | 0.28 | 0.26 | 0.23 | 0.21 | 0.25 | 0 |
| A3 | 0.54 | 0.25 | 0.22 | 0.19 | 0.30 | 20% |
| A4 | 0.40 | 0.29 | 0.26 | 0.24 | 0.29 | 16% |
| A5 | 0.43 | 0.33 | 0.28 | 0.26 | 0.32 | 28% |
Disclaimer/Publisher’s Note: The statements, opinions and data contained in all publications are solely those of the individual author(s) and contributor(s) and not of MDPI and/or the editor(s). MDPI and/or the editor(s) disclaim responsibility for any injury to people or property resulting from any ideas, methods, instructions or products referred to in the content. |
© 2023 by the authors. Licensee MDPI, Basel, Switzerland. This article is an open access article distributed under the terms and conditions of the Creative Commons Attribution (CC BY) license (https://creativecommons.org/licenses/by/4.0/).
Share and Cite
Feng, L.; Ding, J.; Hu, H.; Lv, Z.; Zhang, Y.; Xu, B.; Quan, J.; Hao, S.; Fan, H.; Hang, Z. Preparation and Characterization of Bio-Based PLA/PEG/g-C3N4 Low-Temperature Composite Phase Change Energy Storage Materials. Polymers 2023, 15, 2872. https://doi.org/10.3390/polym15132872
Feng L, Ding J, Hu H, Lv Z, Zhang Y, Xu B, Quan J, Hao S, Fan H, Hang Z. Preparation and Characterization of Bio-Based PLA/PEG/g-C3N4 Low-Temperature Composite Phase Change Energy Storage Materials. Polymers. 2023; 15(13):2872. https://doi.org/10.3390/polym15132872
Chicago/Turabian StyleFeng, Liu, Junjie Ding, Hengming Hu, Zichun Lv, Yongsheng Zhang, Boqiang Xu, Jingru Quan, Shijie Hao, Haojie Fan, and Zusheng Hang. 2023. "Preparation and Characterization of Bio-Based PLA/PEG/g-C3N4 Low-Temperature Composite Phase Change Energy Storage Materials" Polymers 15, no. 13: 2872. https://doi.org/10.3390/polym15132872