Article

Alginate–Moroccan Clay, New Bio-Nanocomposite for Removal of H2PO4, HPO42−, and NO3 Ions from Aqueous Solutions

by
Rachid Aziam
1,
Daniela Simina Stefan
2,*,
Abdelali Aboussabek
1,
Mohamed Chiban
1 and
Alexa-Maria Croitoru
3,4
1
Laboratory of Applied Chemistry and Environment, Department of Chemistry, Faculty of Science, Ibnou Zohr University, Agadir BP 8106, Morocco
2
Department of Analytical Chemistry and Environmental Engineering, Faculty of Chemical Engineering and Biotechnologies, National University of Science and Technology Politehnica of Bucharest, 1-7 Polizu Street, 011061 Bucharest, Romania
3
Department of Science and Engineering of Oxide Materials and Nanomaterials, Faculty of Chemical Engineering and Biotechnologies, National University of Science and Technology Politehnica of Bucharest, 1-7 Polizu Street, 011061 Bucharest, Romania
4
National Centre for Micro- and Nanomaterials, National University of Science and Technology Politehnica of Bucharest, 313, Spl. Independentei Steet, 060042 Bucharest, Romania
*
Author to whom correspondence should be addressed.
Polymers 2023, 15(24), 4666; https://doi.org/10.3390/polym15244666
Submission received: 7 November 2023 / Revised: 27 November 2023 / Accepted: 4 December 2023 / Published: 11 December 2023

Abstract

:
The aim of this work is to synthesize and characterize alginate–Moroccan clay bio-composite in order to improve our understanding of the adsorption of inorganic pollutants found in textile effluents. Characterization of the bio-composite used was carried out using a variety of techniques (IR-TF, SEM, DRX, and pHZPC). The influence of the medium’s physico-chemical parameters (temperature, pH, initial concentration, etc.) on the retention of inorganic pollutants was also studied. Studies of adsorption and inorganic pollutants such as orthophosphate (H2PO4 and HPO42−) and nitrate (NO3) ions were carried out, using simple solutions from the laboratory, in a batch system. This study explored the impact of adsorbent dose, contact time, solution pH, and temperature on the adsorption process. Various kinetic models, including pseudo-first-order, pseudo-second-order, intra-particle diffusion, and Elovich models, were tested and evaluated, to illustrate the adsorption kinetics. This study’s findings demonstrated that the adsorption process follows second-order kinetics, with associated rate constants successfully determined. The correlation coefficient for the pseudo-second-order kinetic model is nearly equal to 1 (>0.98), and the value of theoretical adsorption capacity (qe,the) is comparable to the experimental one (qe,the = 58.14 mg/g for H2PO4, qe,the = 54.64 mg/g for HPO42−, and qe,the = 52.63 mg/g for NO3). Additionally, the adsorption equilibrium was investigated through the application of various mathematical models, including the Langmuir, Freundlich, Temkin, and Dubinin–Radushkevich isotherm models, to assess the mechanistic parameters associated with the adsorption process. Among these models, the Langmuir isotherm emerged as the most suitable one for characterizing the adsorption of H2PO4, HPO42−, and NO3 ions using bio-nanocomposite beads. The maximum adsorbed amounts of metal ions by the bio-nanocomposite used were 625 mg/g for H2PO4, 909.09 mg/g for HPO42−, and 588.23 mg/g for NO3 from the batch system. The endothermic and physical nature of the adsorption is suggested by the positive values of ΔH°, which is consistent with experimental findings. The adsorption process is spontaneous, as evidenced by the negative ΔG° values. Positive ΔS° values indicate increased randomness at the solid/liquid interface during adsorption of ion-organic ions onto the engineered bio-nanocomposite. The obtained results demonstrated that, from a scientific perspective, alginate–Moroccan clay bio-nanocomposites exhibit a highly significant adsorption capability for the removal of oxyanions in aqueous environments.

1. Introduction

Inorganic pollutants, particularly orthophosphate and nitrate ions, are one of the main causes of pollution. When present in high concentrations in the natural environment, they generate significant pollution, with considerable repercussions on the ecosystem and human health.
The increasing concentration of phosphates in the environment due to human activities has been considered a matter of concern for more than four decades, but the main question is to know is the amount of the additional phosphorus that has contributed to the eutrophication of lakes, ponds, and other water bodies [1,2]. Once released into the environment, phosphate ions disperse into water bodies, mainly as a result of processes such as soil erosion, rock decomposition, and animal and wildlife droppings.
Phosphates are one of the anions assimilated by the human body. Their presence in water is due to the release of industrial waste (food processing, laundry, and surface treatment), agricultural waste (fertilizers and pesticides), domestic waste (detergents, washing powder, and shampoos), or their use to remove corrosion and scale (polyphosphate). Phosphates are the mineral forms of phosphorus, formed from PO43− ions (they are generally not very soluble in water) [3,4,5,6,7]. Hydrogenated forms (H2PO4 and HPO42−) are much more soluble.
The European Community has set a maximum contaminant level of 50 mg/L and recommended levels of 25 mg/L for industrial wastewaters [8]. In Morocco, the maximum admissible concentration values for nitrate and phosphorus in potable waters are, respectively, 50 mg/L and 0.05 mg/L, equivalent to 0.15 mg/L of hydrogen phosphate ions [8].
For agriculture and irrigation, the accepted orthophosphate standard is 0.2 mg/L [9]. An elevated concentration of nitrate in drinking water can lead to a condition in infants known as methemoglobinemia, colloquially referred to as “blue disease”, as well as other associated health issues [10]. The most important environmental problems caused by nitrogen and phosphorus compounds are eutrophication of water resources and infectious diseases [11]. The presence of orthophosphate and nitrate anions in liquid effluents poses a threat for both human health and the wider ecosystem. According to the recommendations of the World Health Organization (WHO), the permissible levels for nitrates and phosphates in water sources are established at 50 mg/L and 5 mg/L, respectively [12]. Conventional techniques for eliminating nitrate and phosphate ions from wastewater encompass methods like reduction through diverse approaches, including coagulation, flocculation [13,14], biological treatment [15], membrane filtration [3], ion exchange [16], chemical precipitation [17], and adsorption methods [13,18,19]. Due to the significant drawbacks of the existing methods for removing inorganic pollutants, adsorption is a suitable alternative for removing phosphates and nitrates from liquid effluents. Adsorption technology is unique in that it offers multiple advantages, such as low cost, high selectivity, effective ability to remove orthophosphate (H2PO4, HPO42−) and nitrate (NO3) ions, even at low concentrations, ease of use, simple design, high capacity, and the prospect of producing minimal quantities of by-products [20,21].
Natural clays are more efficient due to their excellent swelling properties [22], low cost [23], high specific surface area [24], and other structural features [25].
Furthermore, alginate is a polysaccharide that is extracted from brown algae. It is composed of repeating units of the sugars mannuronic acid and guluronic acid, which give alginate its characteristic properties. Additionally, as a biopolymeric support for natural clay, alginate is a natural, non-toxic, low-cost, and environment friendly polymer polysaccharide with high biodegradability. Its advantageous properties, such as thickening, gelling, and stabilizing, make alginate an appealing option for researchers seeking to create composite bead adsorbents by combining it with clay [26,27].
Zhao et al. (2023) reported that coordination polymers, thanks to their advantageous properties such as simplicity of production, rapid response, and high sensitivity, are well suited to the detection of trace environmental toxins [28].
Elaborate bio-composites are also considered among the materials with excellent adsorption properties, in particular hybrid bio-composites based on alginate and gelatin, which are generally considered to be universal adsorbents. The formulation of bio-composite beads will pave the way for their eventual use on an industrial scale as adsorbents in water treatment, due to their ease of physical separation and reusability. Encapsulation in bio-polymer beads overcomes this problem [29]. This study focuses on the investigation of major pollutants, such as orthophosphate (H2PO4 and HPO42−) and nitrate (NO3) ions, which are widely prevalent in this context. This work is part of a sustainable development approach using innovative, low-cost materials, with a view to implement them in aqueous effluent treatment techniques. The aim of the project is to prepare and synthesize alginate-based bio-composites, and to study the adsorption capacity of the biomaterials developed for the removal of some nitrate and phosphate ions in aqueous solutions. This study explored the impact of adsorbent dose, contact time, solution pH, and temperature on the adsorption process. Various kinetic models, including pseudo-first-order, pseudo-second-order, intra-particle diffusion, and Elovich models, were tested and evaluated to illustrate the adsorption kinetics. This study’s findings demonstrated that the adsorption process follows second-order kinetics, with associated rate constants successfully determined. The Langmuir isotherm emerged as the most suitable one for characterizing the adsorption of orthophosphate and nitrate ions using bio-nanocomposite beads. The obtained results demonstrated that, from a scientific perspective, alginate-based bio-nanocomposites exhibit a highly significant adsorption capability for the removal of inorganic pollutants in aqueous solutions.

2. Materials and Methods
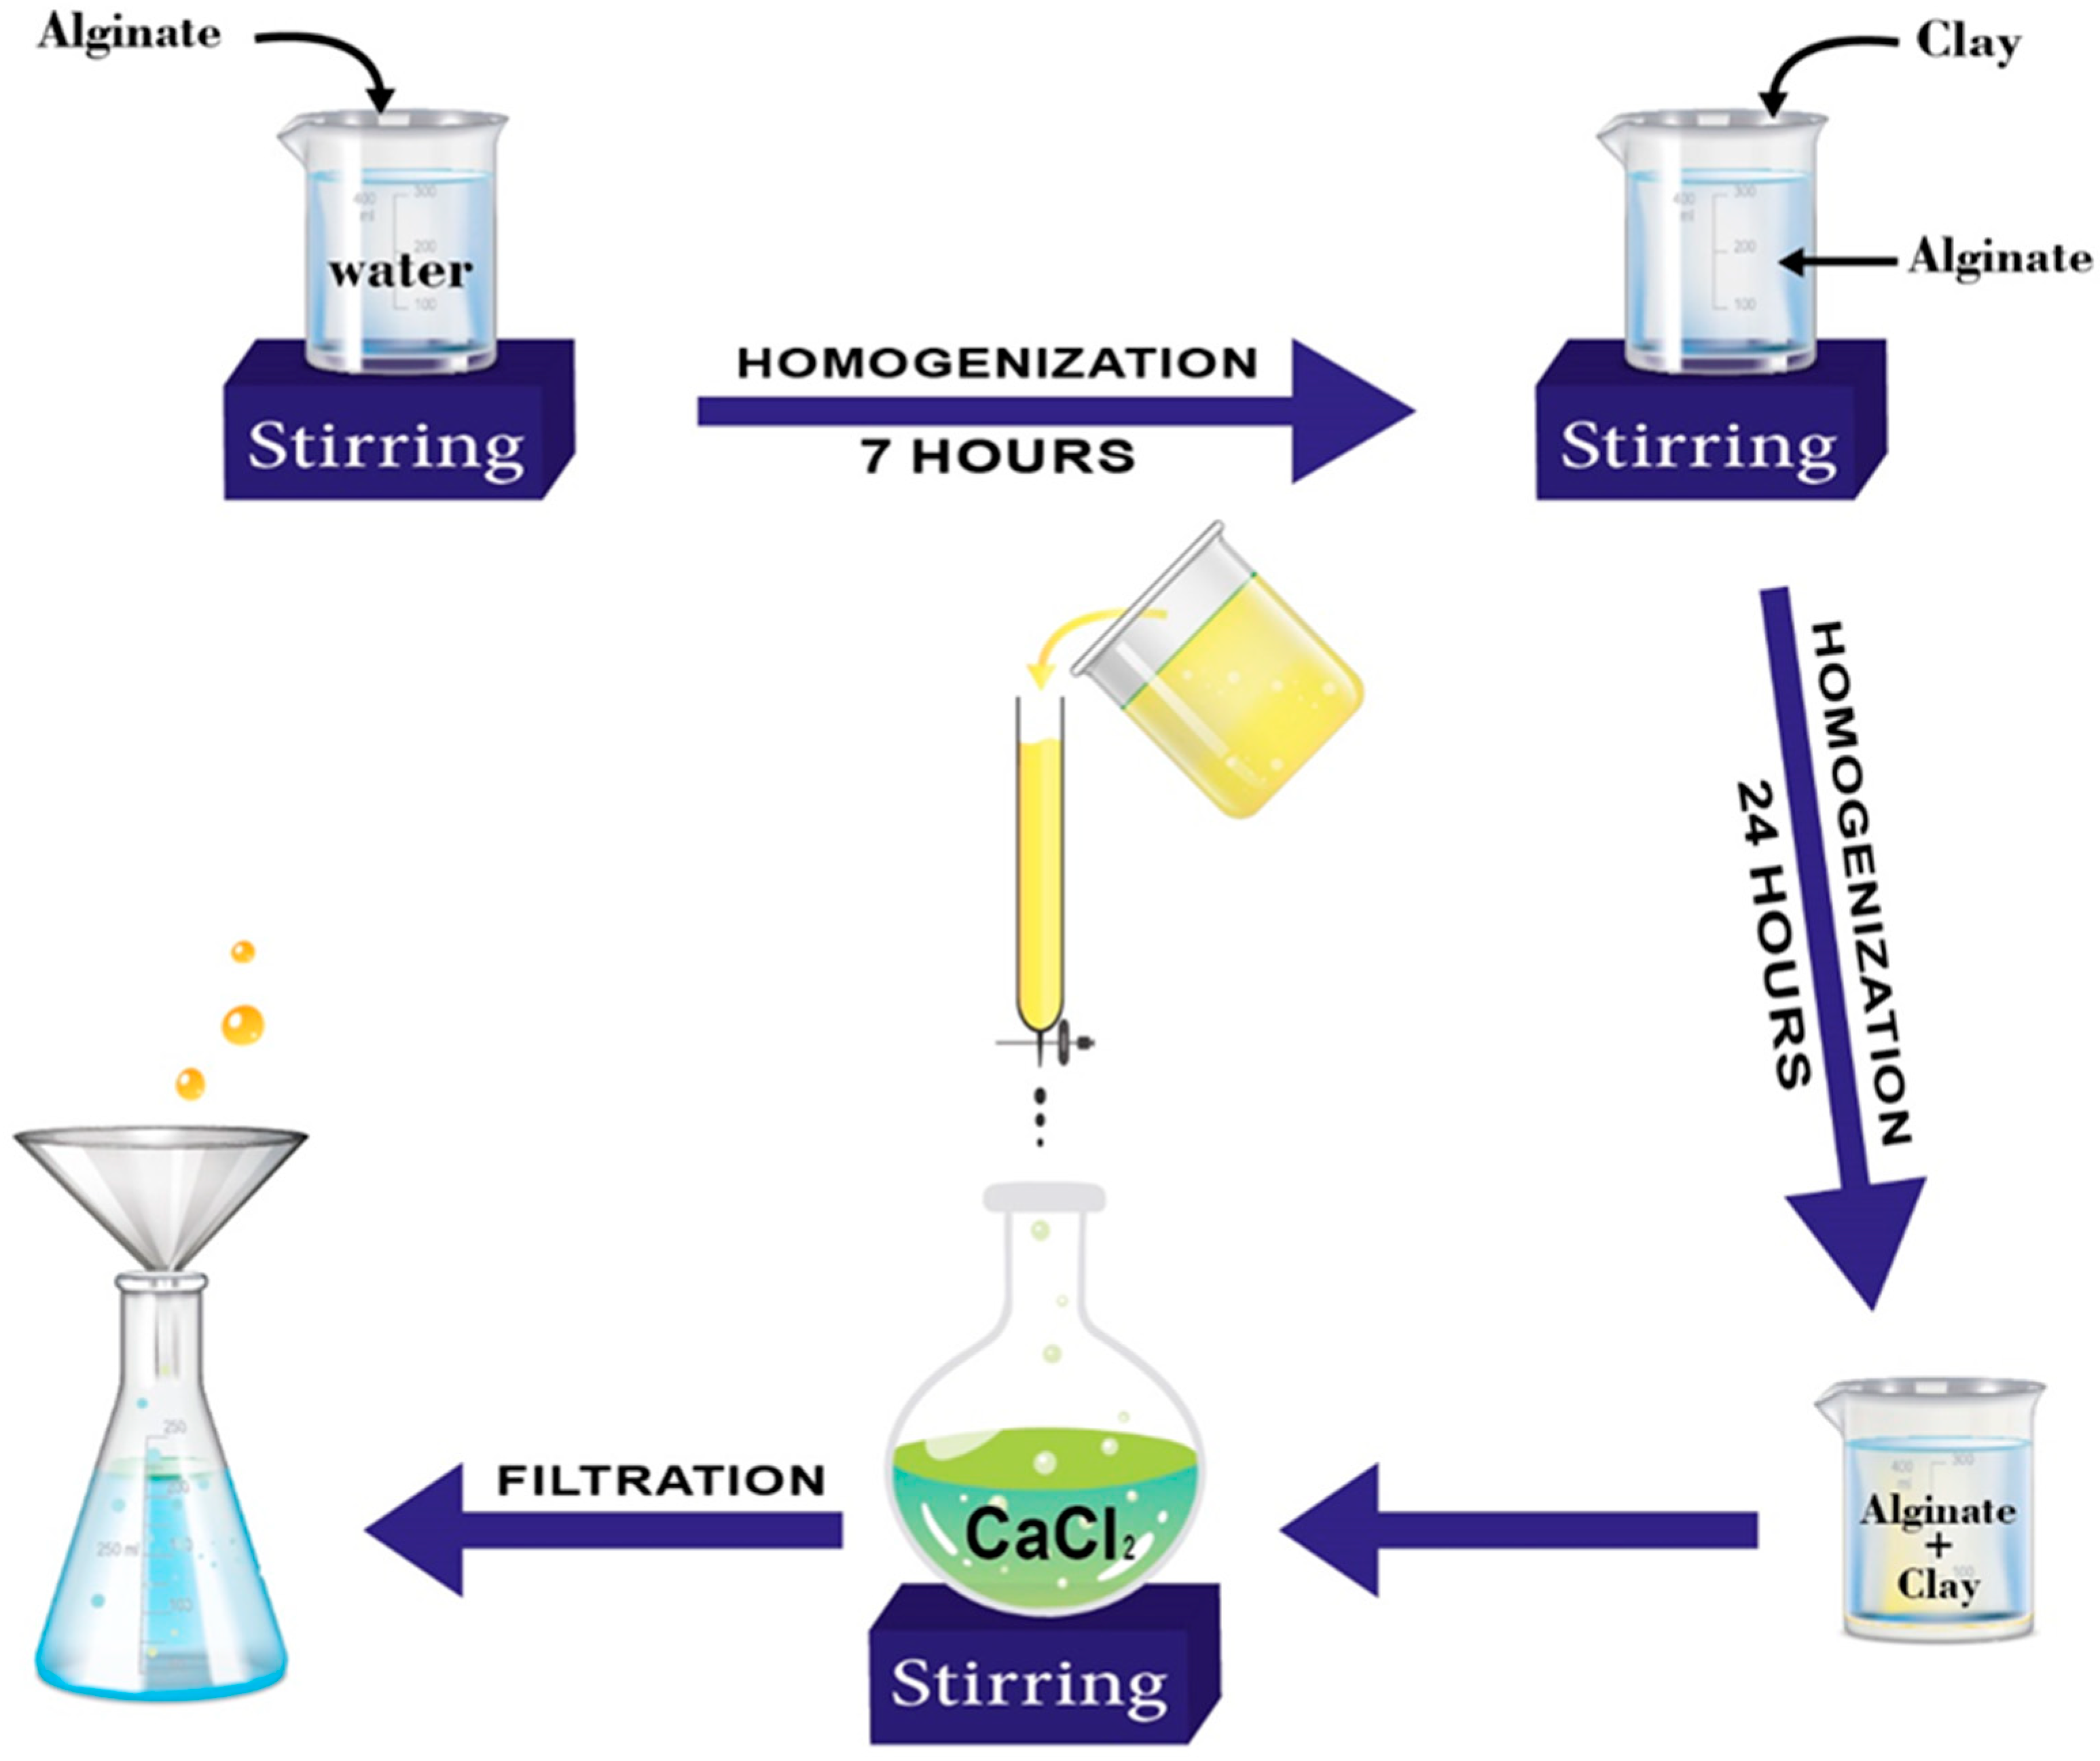
2.1. Adsorbent

A bio-nanocomposite based on alginate-encapsulated Moroccan clay was developed using the extrusion synthesis method, as shown in the diagram below (Figure 1).
A mass of 1 g of alginate was continuously stirred with bidistilled water in a 100 mL Erlenmeyer flask for 7 h, at a temperature of 40 °C. The solutions were agitated at 500 rpm to completely disperse the alginate. After that, the alginate suspension received 2 g of Moroccan natural clay, while being gently magnetically stirred at room temperature. The alginate–clay solution is injected into a syringe for bead production. The syringe is held vertically above a 0.1 M calcium chloride (CaCl2) gelling solution. The treatment is drip-fed into the gel bath gradually. The saline solution instantly gels, and alginate beads are created by an accumulation of chains around Ca2+ cations. The mixture (alginate/clay beads and calcium chloride solution) is allowed to rest for a maturation time, which is sufficiently long for complete gelation. The maturation time varies depending on the cation concentration, ionic strength, and pH. After maturation, the beads are filtered and washed multiple times with distilled water. After washing, the beads are used immediately as in the case of “hydrogel” beads [29].

2.2. Adsorption Experiments

The adsorption experiments were conducted in batches at room temperature, except for those investigating the temperature’s impact. The batch mode was chosen for its simplicity and effectiveness. A known quantity of bio-nanocomposite beads was added to stoppered Erlenmeyer glass flasks with a 100 mL capacity, along with 50 mL of orthophosphate and nitrate ions with a known concentration and solution pH. To ensure uniform mixing, the stirring speed was maintained constant throughout each cycle. After varying the contact time (t), the resulting solutions were centrifuged at 5000 rpm for 10 min. The supernatant was then subjected to 0.45 μm membrane filtration, and the filtrate was analyzed. The concentration of the remaining ion solution was determined using a UV–visible spectrophotometer at its respective λmax value, which is 700 nm for orthophosphate (H2PO4 and HPO42−) ions and 415 nm for nitrates (NO3). The removed orthophosphate and nitrate ion concentration (Cr) from the aqueous solution was calculated as the difference between the initial concentration (C0) and the concentration at different contact times. The initial pH is equal to 7.73 for the HPO42− solution, 5.22 for the H2PO4 solution, and 6.52 for the NO3.
The amount removed per unit mass of adsorbent (qt, mg/g) at time “t” was calculated as follows:
q t = C 0 C t × V m
The removal percentage of H2PO4, HPO42−, and NO3 ions was calculated by:
% a d s o r p t i o n = 100 ( C 0 C t ) C 0
where qt (mg/g) indicates the amount of H2PO4, HPO42−, and NO3 ions removed per unit mass of the adsorbent at a given time (t). C0 (mg/L) represents the initial concentration of H2PO4, HPO42−, and NO3 ions in the aqueous solution. Ct (mg/L) is the concentration of H2PO4, HPO42−, and NO3 ions at time (t). V (L) denotes the volume of the working solution.

3. Results and Discussion

3.1. Characterization of Bio-Nanocomposite Beads

3.1.1. XRD Analysis

The alginate–clay bio-nanocomposite elaborated was prepared and characterized by several analyses. The XRD technique was evaluated within the scanning range of 5° ≤ 2θ ≤ 80° to confirm the crystalline structure of alginate–clay bio-nanocomposites. The X–ray diffraction spectra of the alginate–clay bio-nanocomposite elaborated is displayed in Figure 2. The X–ray diffraction analysis was examined using a Bruker CCD–Appex (Faculty of Science, Ibnou Zohr University, Agadir, Morocco) apparatus equipped with an X-ray generator (Ni filtered Cu-Kα radiation), operated at 40 kV and 40 mA. Samples in powder form were scanned from 5° to 80° (2θ), at a step of 2° min−1. The diffraction signals at 2θ values of 9.61°, 18.05°,19.85°, 29.13°, 35.03°, and 42.45° correspond to the lattice planes of clay (Muscovite) mineral. Additionally, there is a diffraction peak at 2θ = 20.95°, 26.68°, and 42.60°, indicating the presence of quartz [30,31]. The diffractograms of alginate–clay bio-nanocomposites demonstrate the effective dispersion of clay layers within the amorphous alginate matrix (ALG). This dispersion is evident from the observed shifts and reduction in the intensity of the peaks, which are typically associated with the interbasal distances between the clay layers [29,32].

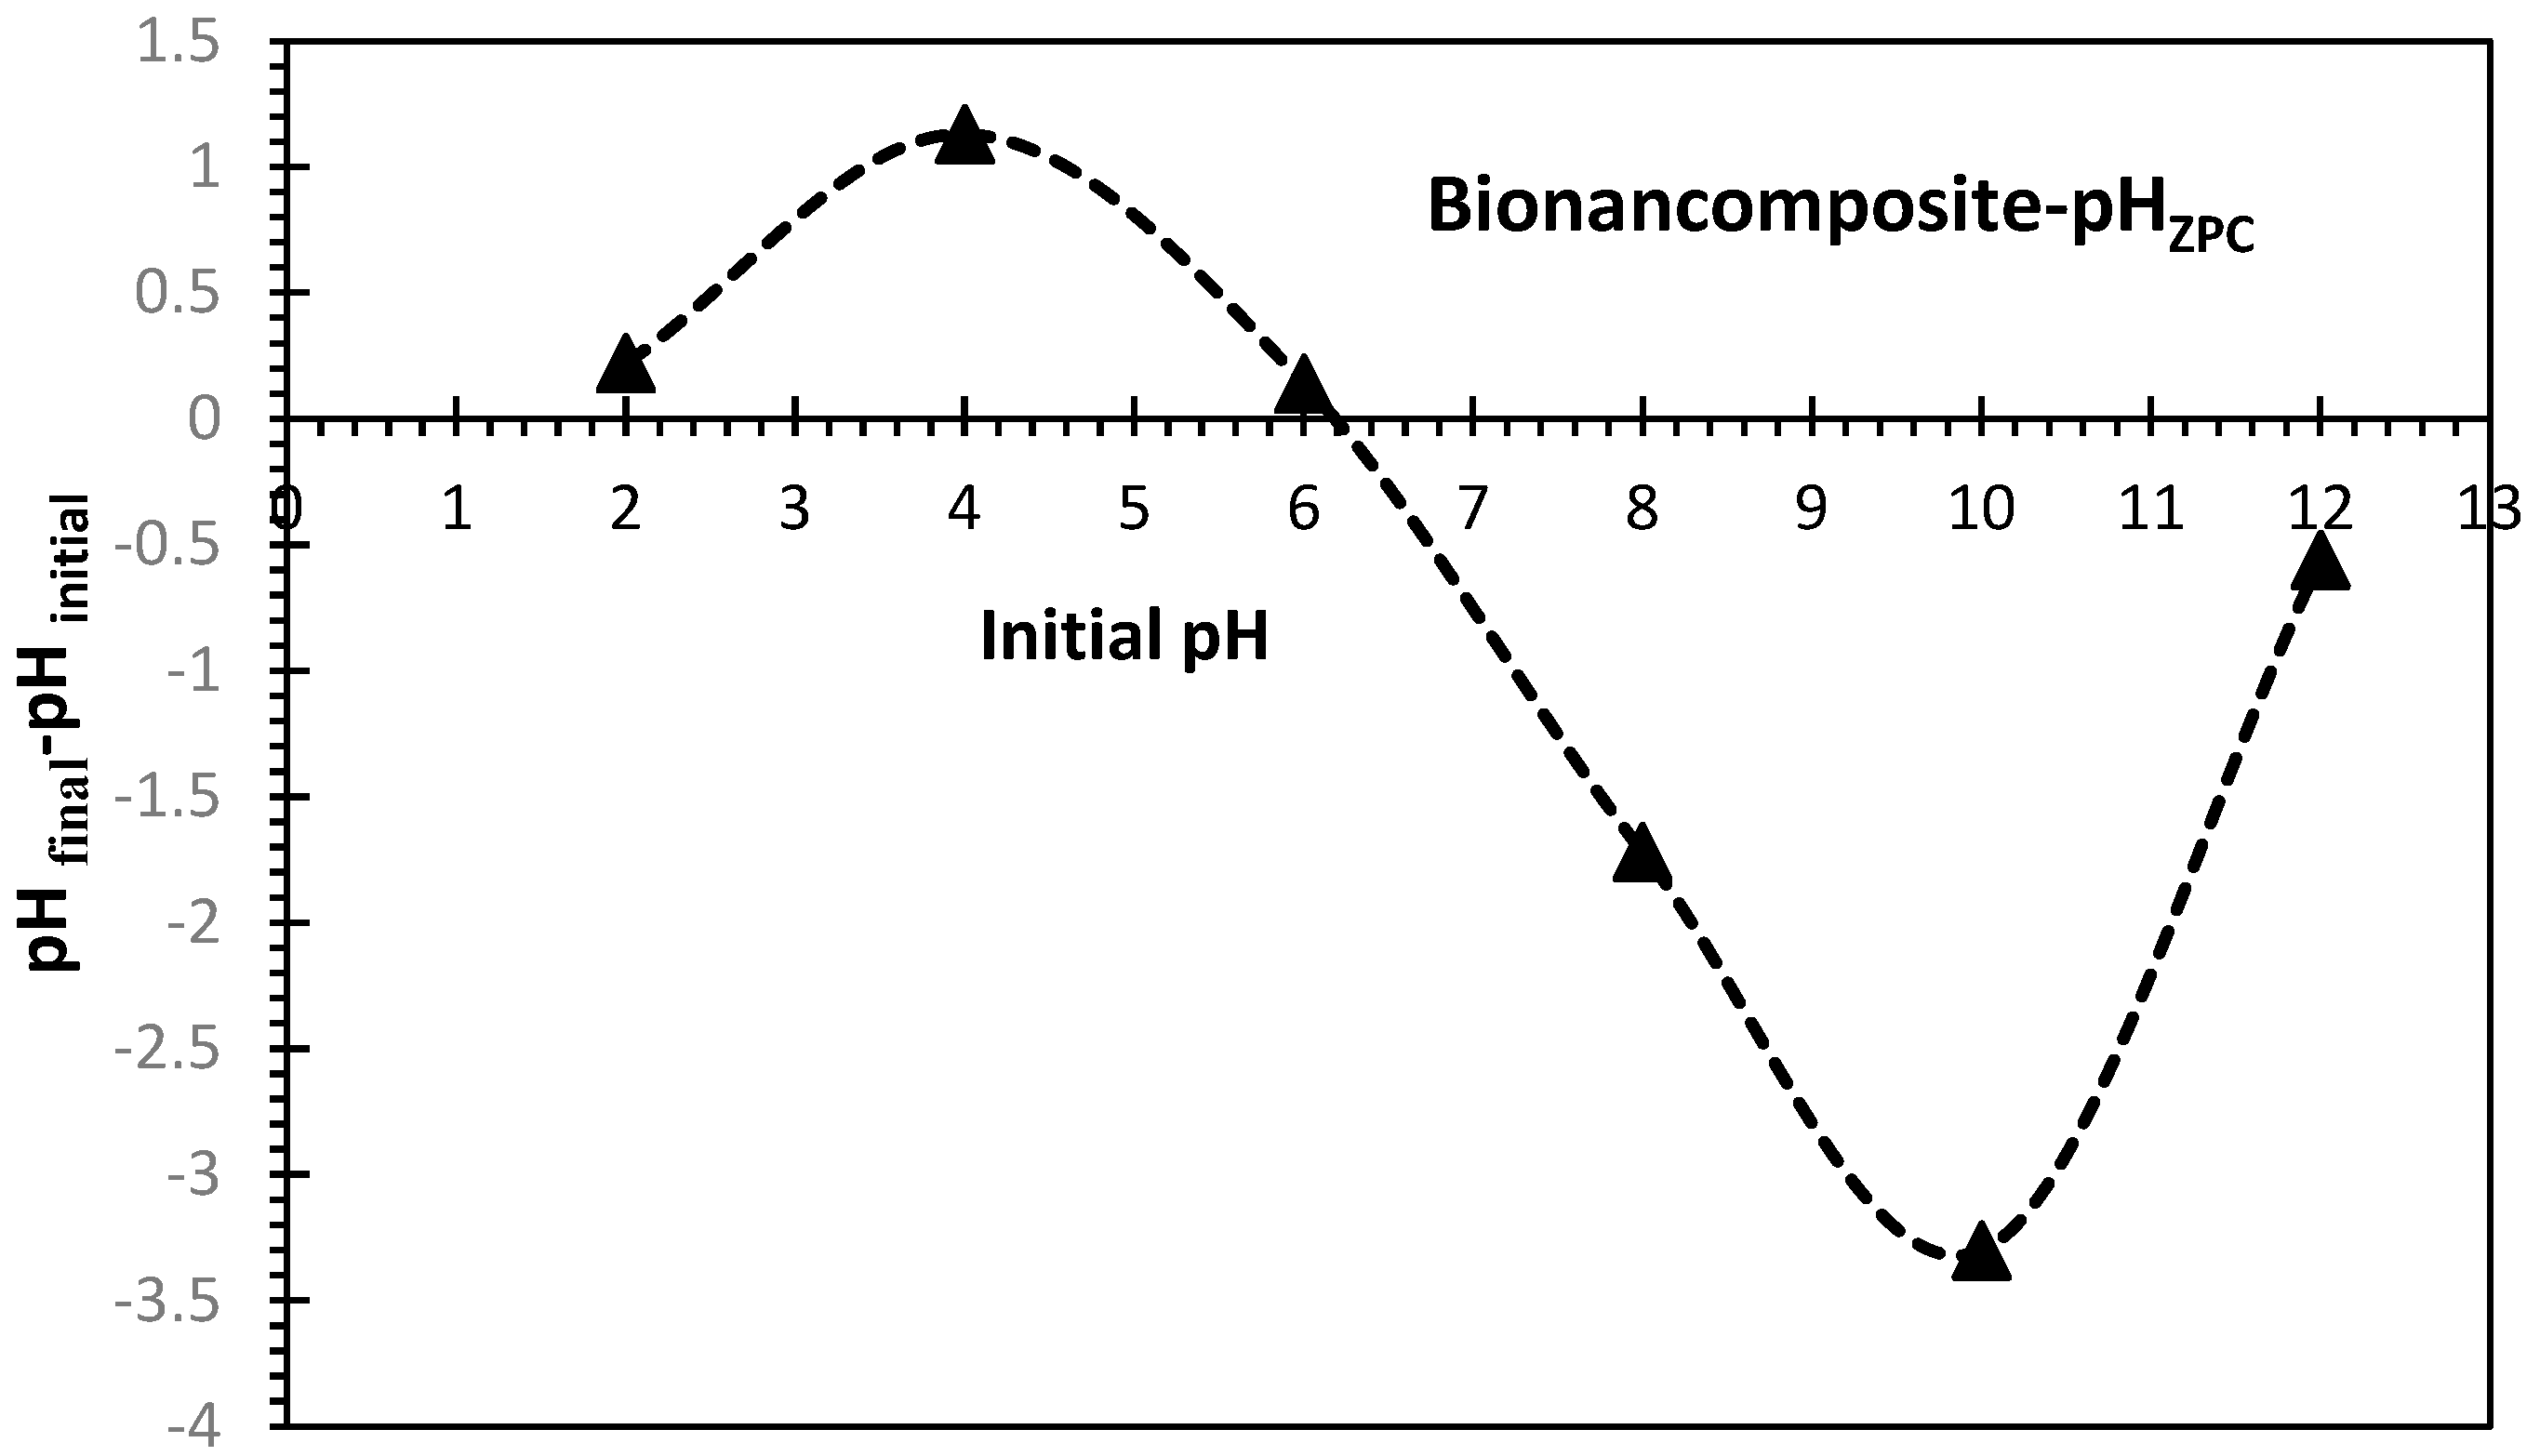
3.1.2. pH of Zero point charge for Bio-Nanocomposite Adsorbent

To determine the pHZPC of the adsorbent, 50 mL of 0.01 M NaCl solution was placed in different 250 mL Erlenmeyer flasks, and 0.5 g of the alginate–clay bio-nanocomposite beads were introduced into each of them. The pH values of these solutions were adjusted between 2 and 12 with 0.1 M HCl/NaOH solutions. These flasks were kept for 48 h, and the final pH of the solutions was measured. The difference between the initial and final pH was measured, and the point where ΔpH = 0 was taken as the point of zero charge (Figure 3). The pHZPC of the alginate–clay bio-nanocomposite used was found to be 6.2 (Figure 3). This figure shows that the bio-nanocomposite surface under study bears a positive charge at pH levels below the pHZPC, but the surface is dominated by negative charges at pH levels above the pHZPC [14,33].

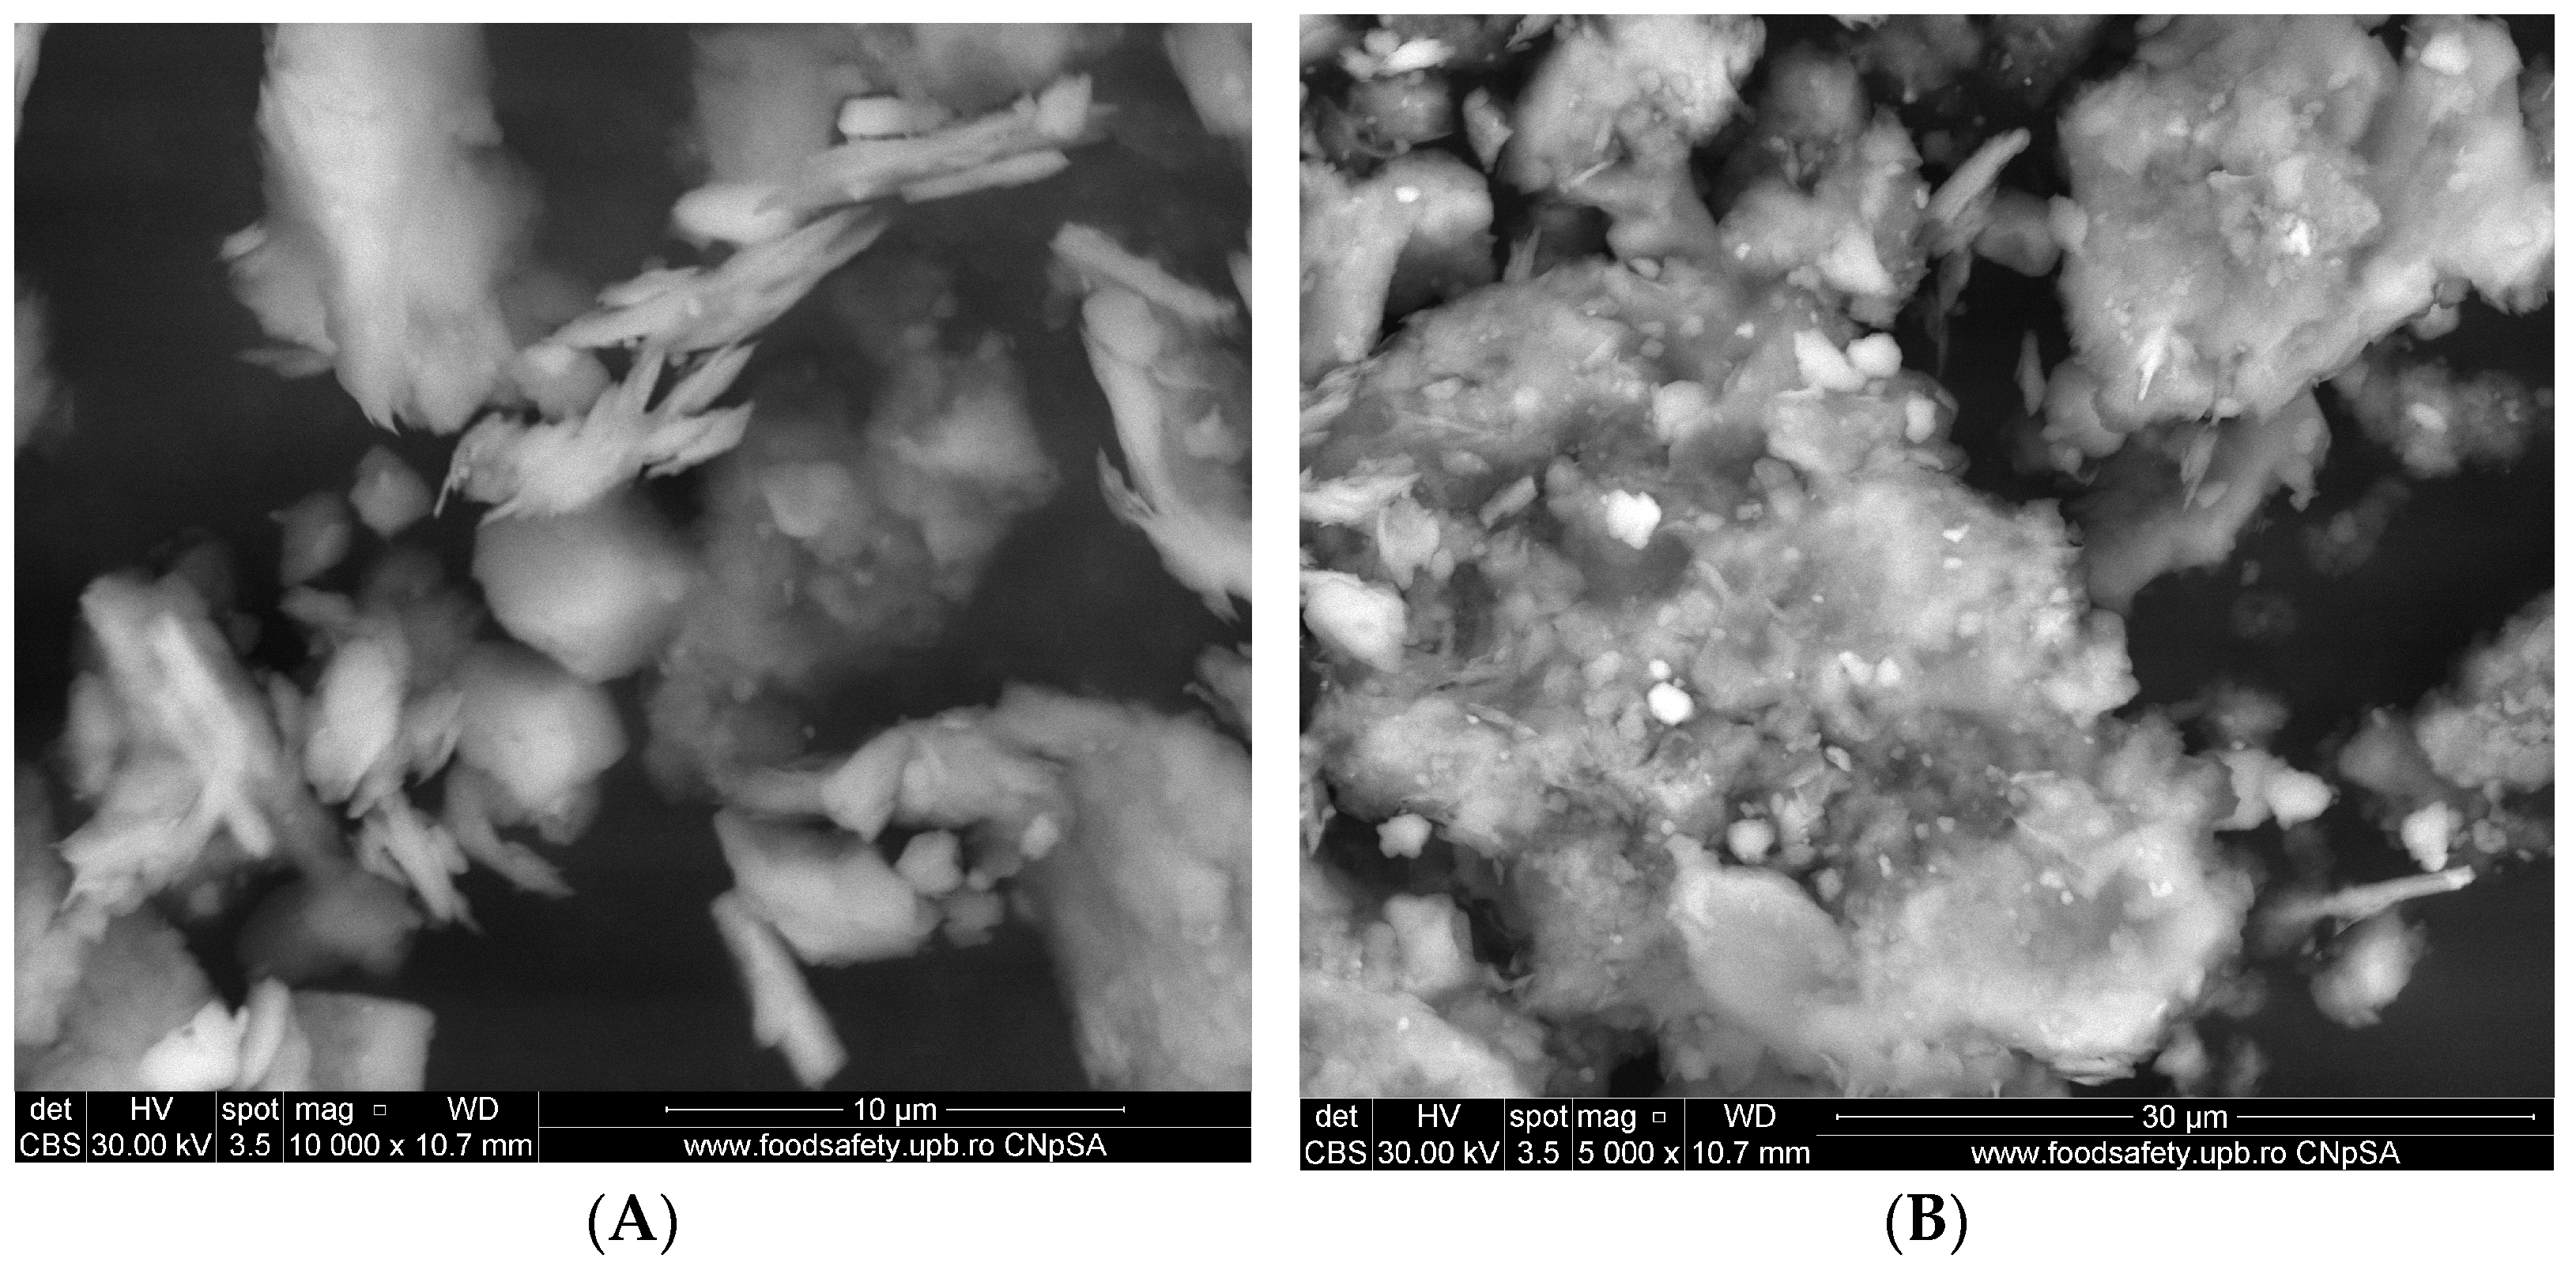
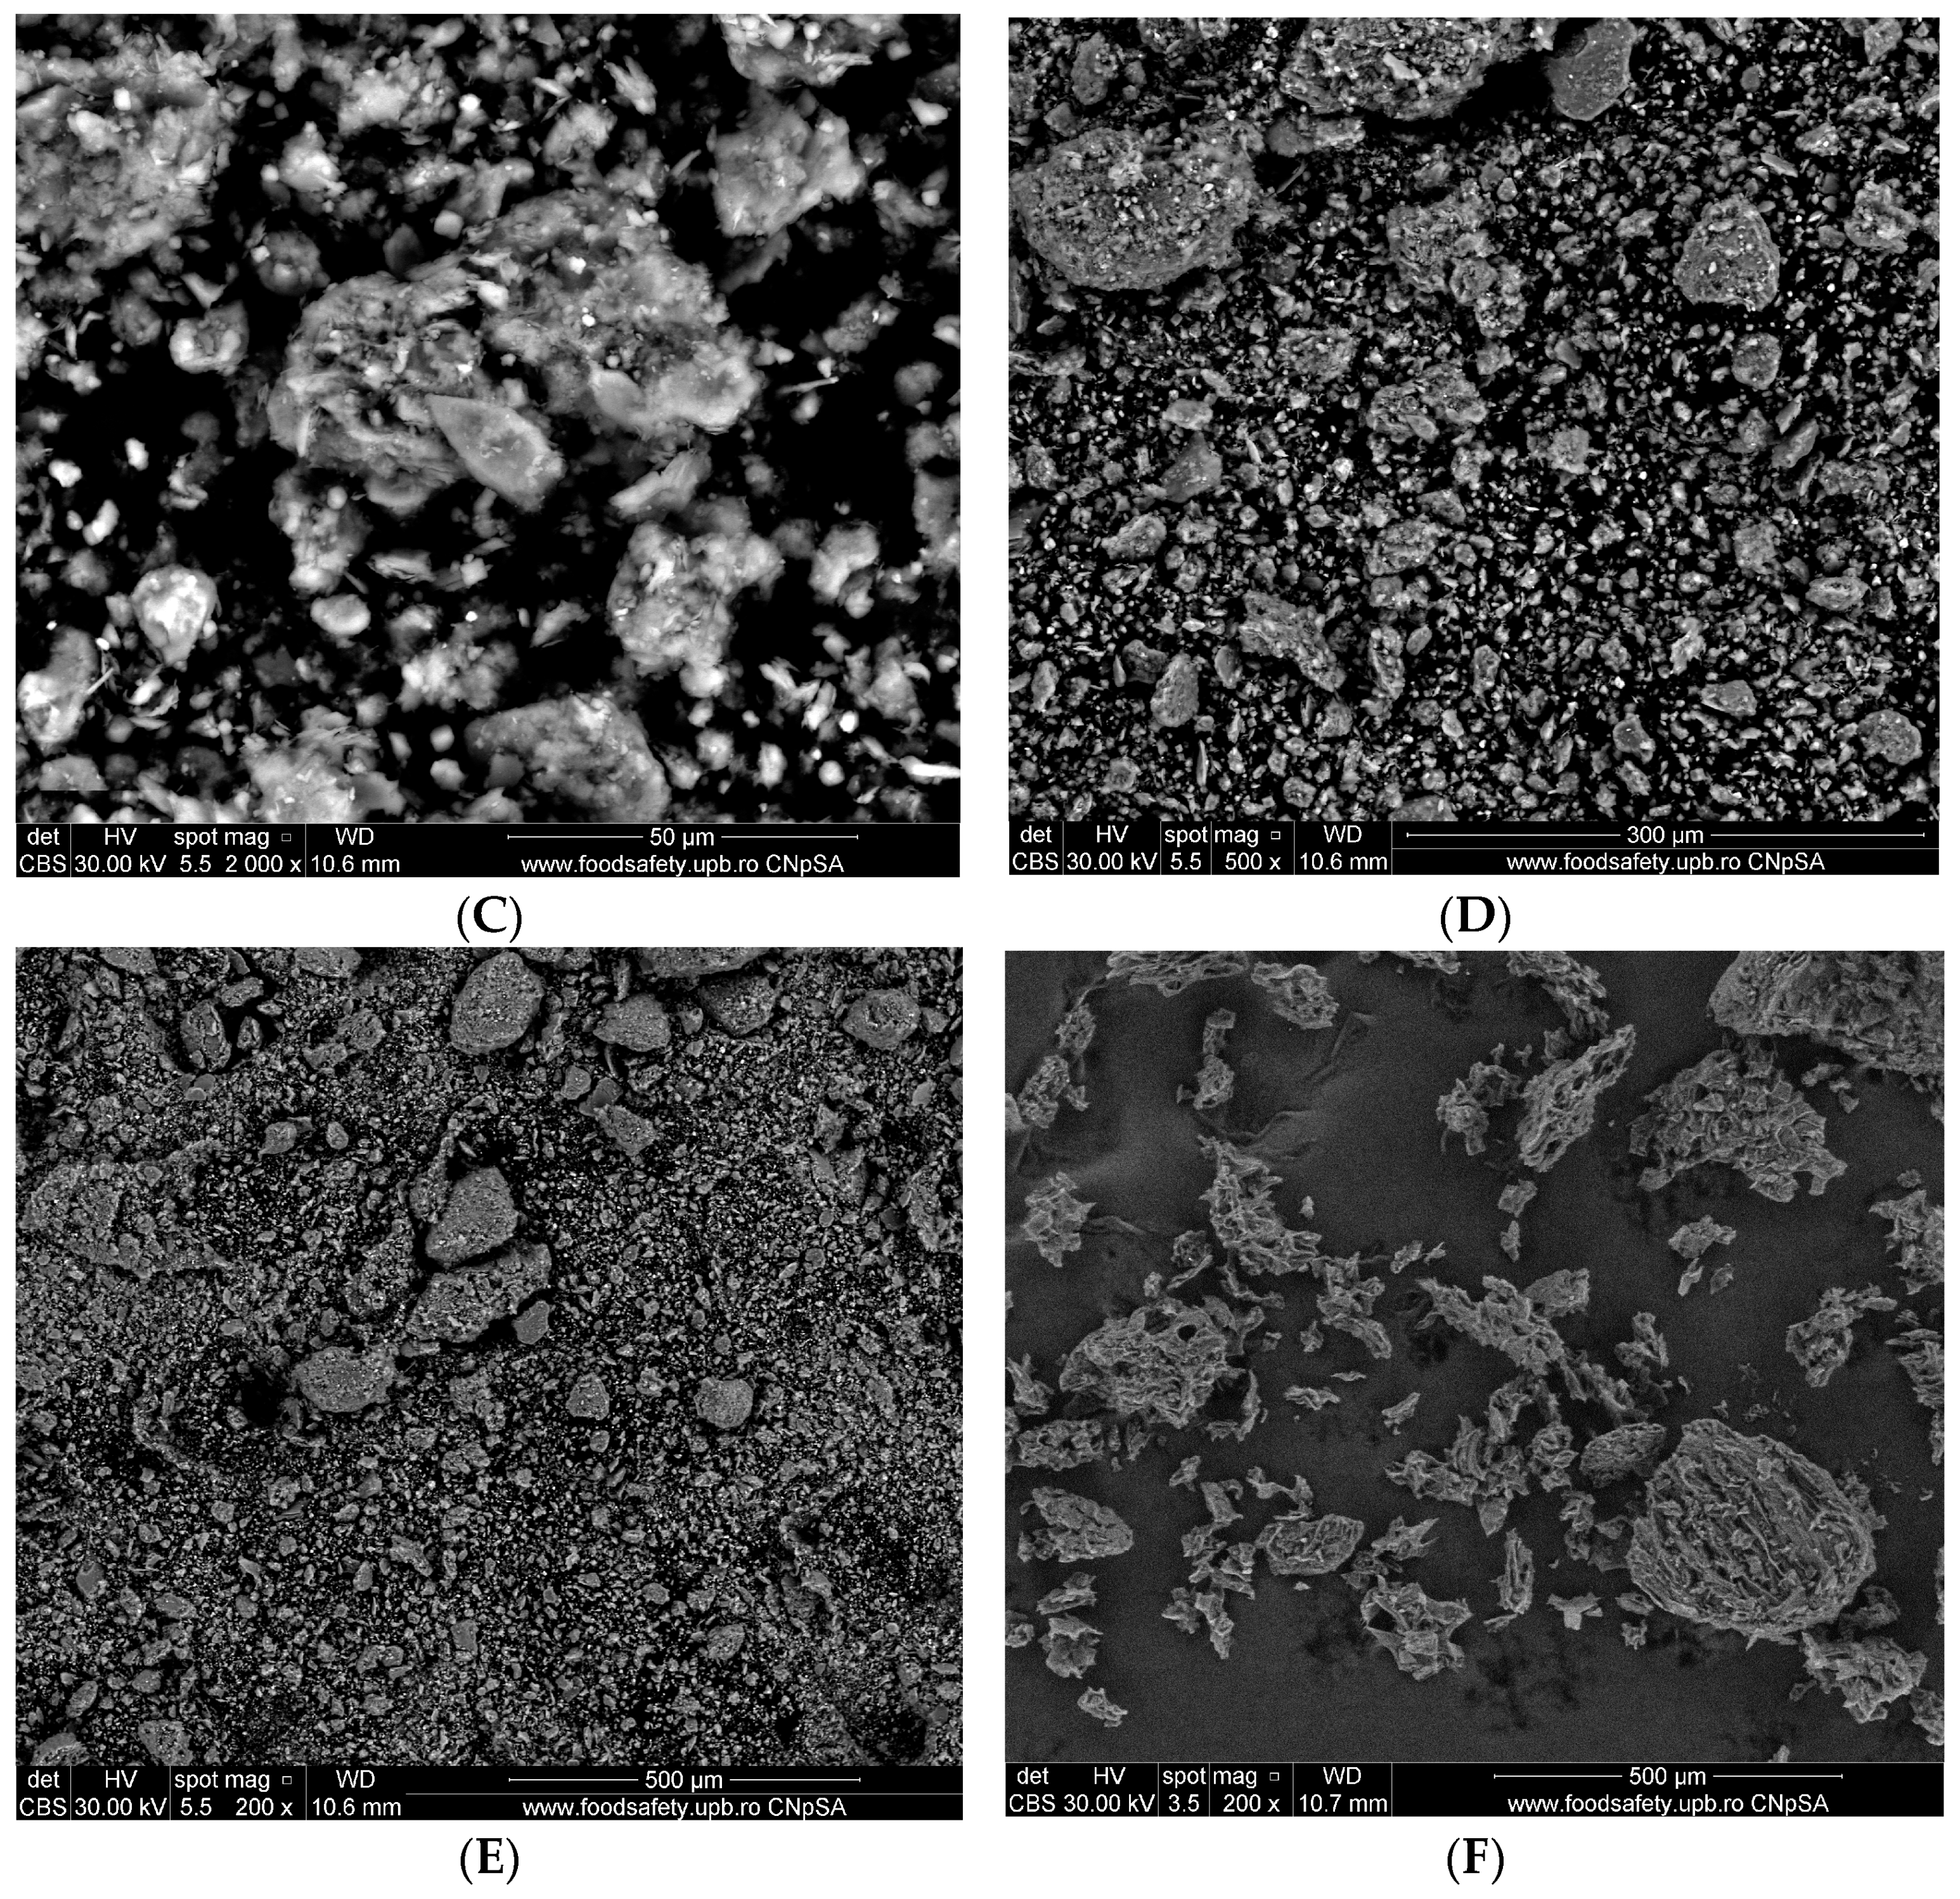
3.1.3. Scanning Electron Microscopy (SEM)

Scanning electron microscopy enables us to observe grain morphology and, in particular, to estimate their approximate diameter, i.e., the way in which the grains, fibers, and fiber aspects of the processed material are arranged. The alginate–clay bio-nanocomposite was analyzed by SEM coupled with energy-dispersive X-ray analysis (SEM/EDX, Inspect F50 (National University of Science and Technology Politehnica of Bucharest, București, Romania)). The SEM images of the natural clay microparticles (Muscovite) and the alginate–Moroccan clay bio-nanocomposite studied are presented in Figure 4 and Figure 5, respectively.
The images obtained on the clay sample (Figure 4) generally show that this material is characterized by two aspects: the dispersed powder and the formation of a few agglomerates of different shapes, ranging in size from 10 to 50 µm (Images A, B, and C). At higher magnification, these agglomerates are formed by the assembly of small particles of inhomogeneous morphology and different shapes (Images D, E, and F). According to these images, these forms of agglomerates and small particles are characterized by the presence of a large number of pores at the total surface level of the clay used, which will be of interest for use as adsorbents or heterogeneous catalysts.
Figure 5 shows SEM images of alginate–clay bio-nanocomposite microparticles obtained at different magnifications. At high magnification, these images show agglomerates of a very fine powder containing grains of various sizes and inhomogeneous shapes with different dimensions (500 µm and 1 mm) (Images A and B).
Images C and D show that these grains are difficult to individualize, as most of them appear to have coalesced. This shape seems to be very interesting for use in adsorption due to the quantity of cavities and pores observed.

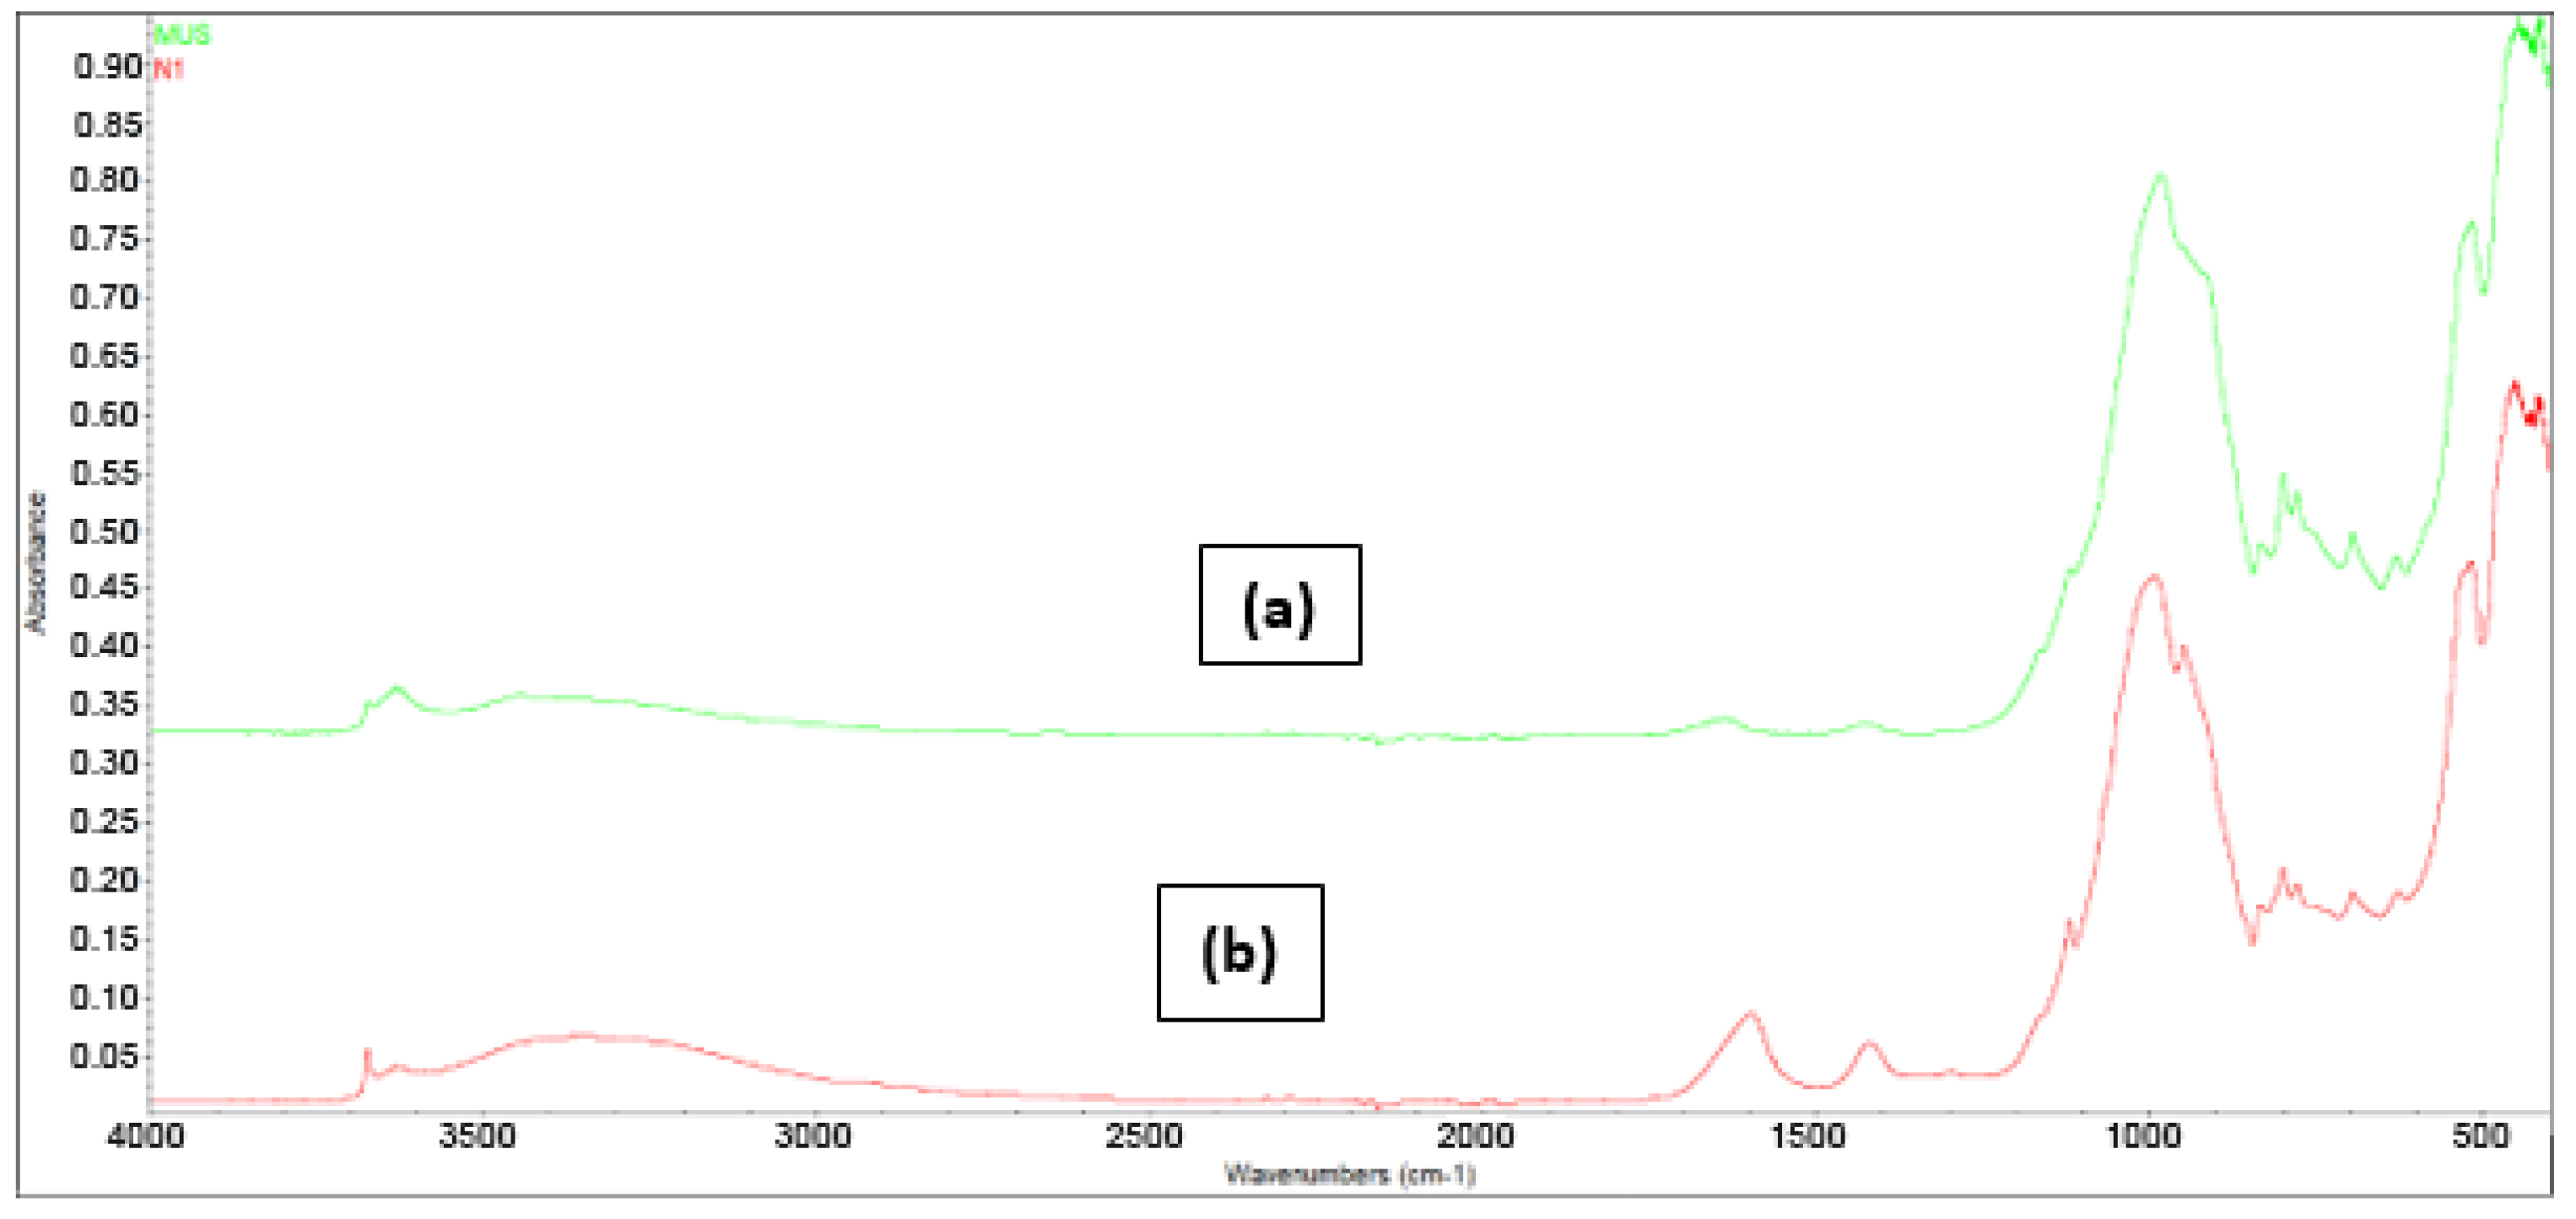
3.1.4. FT-IR Spectroscopy

The IR spectra of natural clay and alginate–clay bio-nanocomposite are shown in Figure 6. FT-IR spectroscopy was employed to investigate the structure and surface functional groups of both Moroccan clay and the alginate–clay bio-nanocomposite. As illustrated in Figure 6, the silica component displays characteristic absorption peaks at specific wavelengths of 470, 520, 640, 700, 780, 800, 950, and 996 cm−1. The 470 cm−1 band is associated with Si–O stretching vibrations, while the 996 cm−1 band is a result of Si–O–Si bending vibrations found in the dioctahedral of the natural clay. Moreover, there are two minor peaks at 520 cm−1 [34,35,36], corresponding to Al–O–Si, and at 800 cm−1, related to Si–O bending and Si–OH stretching vibrations. The band at 3640 cm−1 arises from the stretching vibration of OH units within the clay layers attached to aluminum. In the case of the composite materials, their spectroscopic profiles closely resemble the previously obtained results, featuring distinctive peaks in the 1420 and 1600 cm−1 range, which are indicative of COO vibrations of alginate [37,38].

3.2. Factors Controlling the Adsorption of H2PO4 and HPO42− and NO3 Ions from Aqueous Solution by Alginate–Clay Bio-Nanocomposite

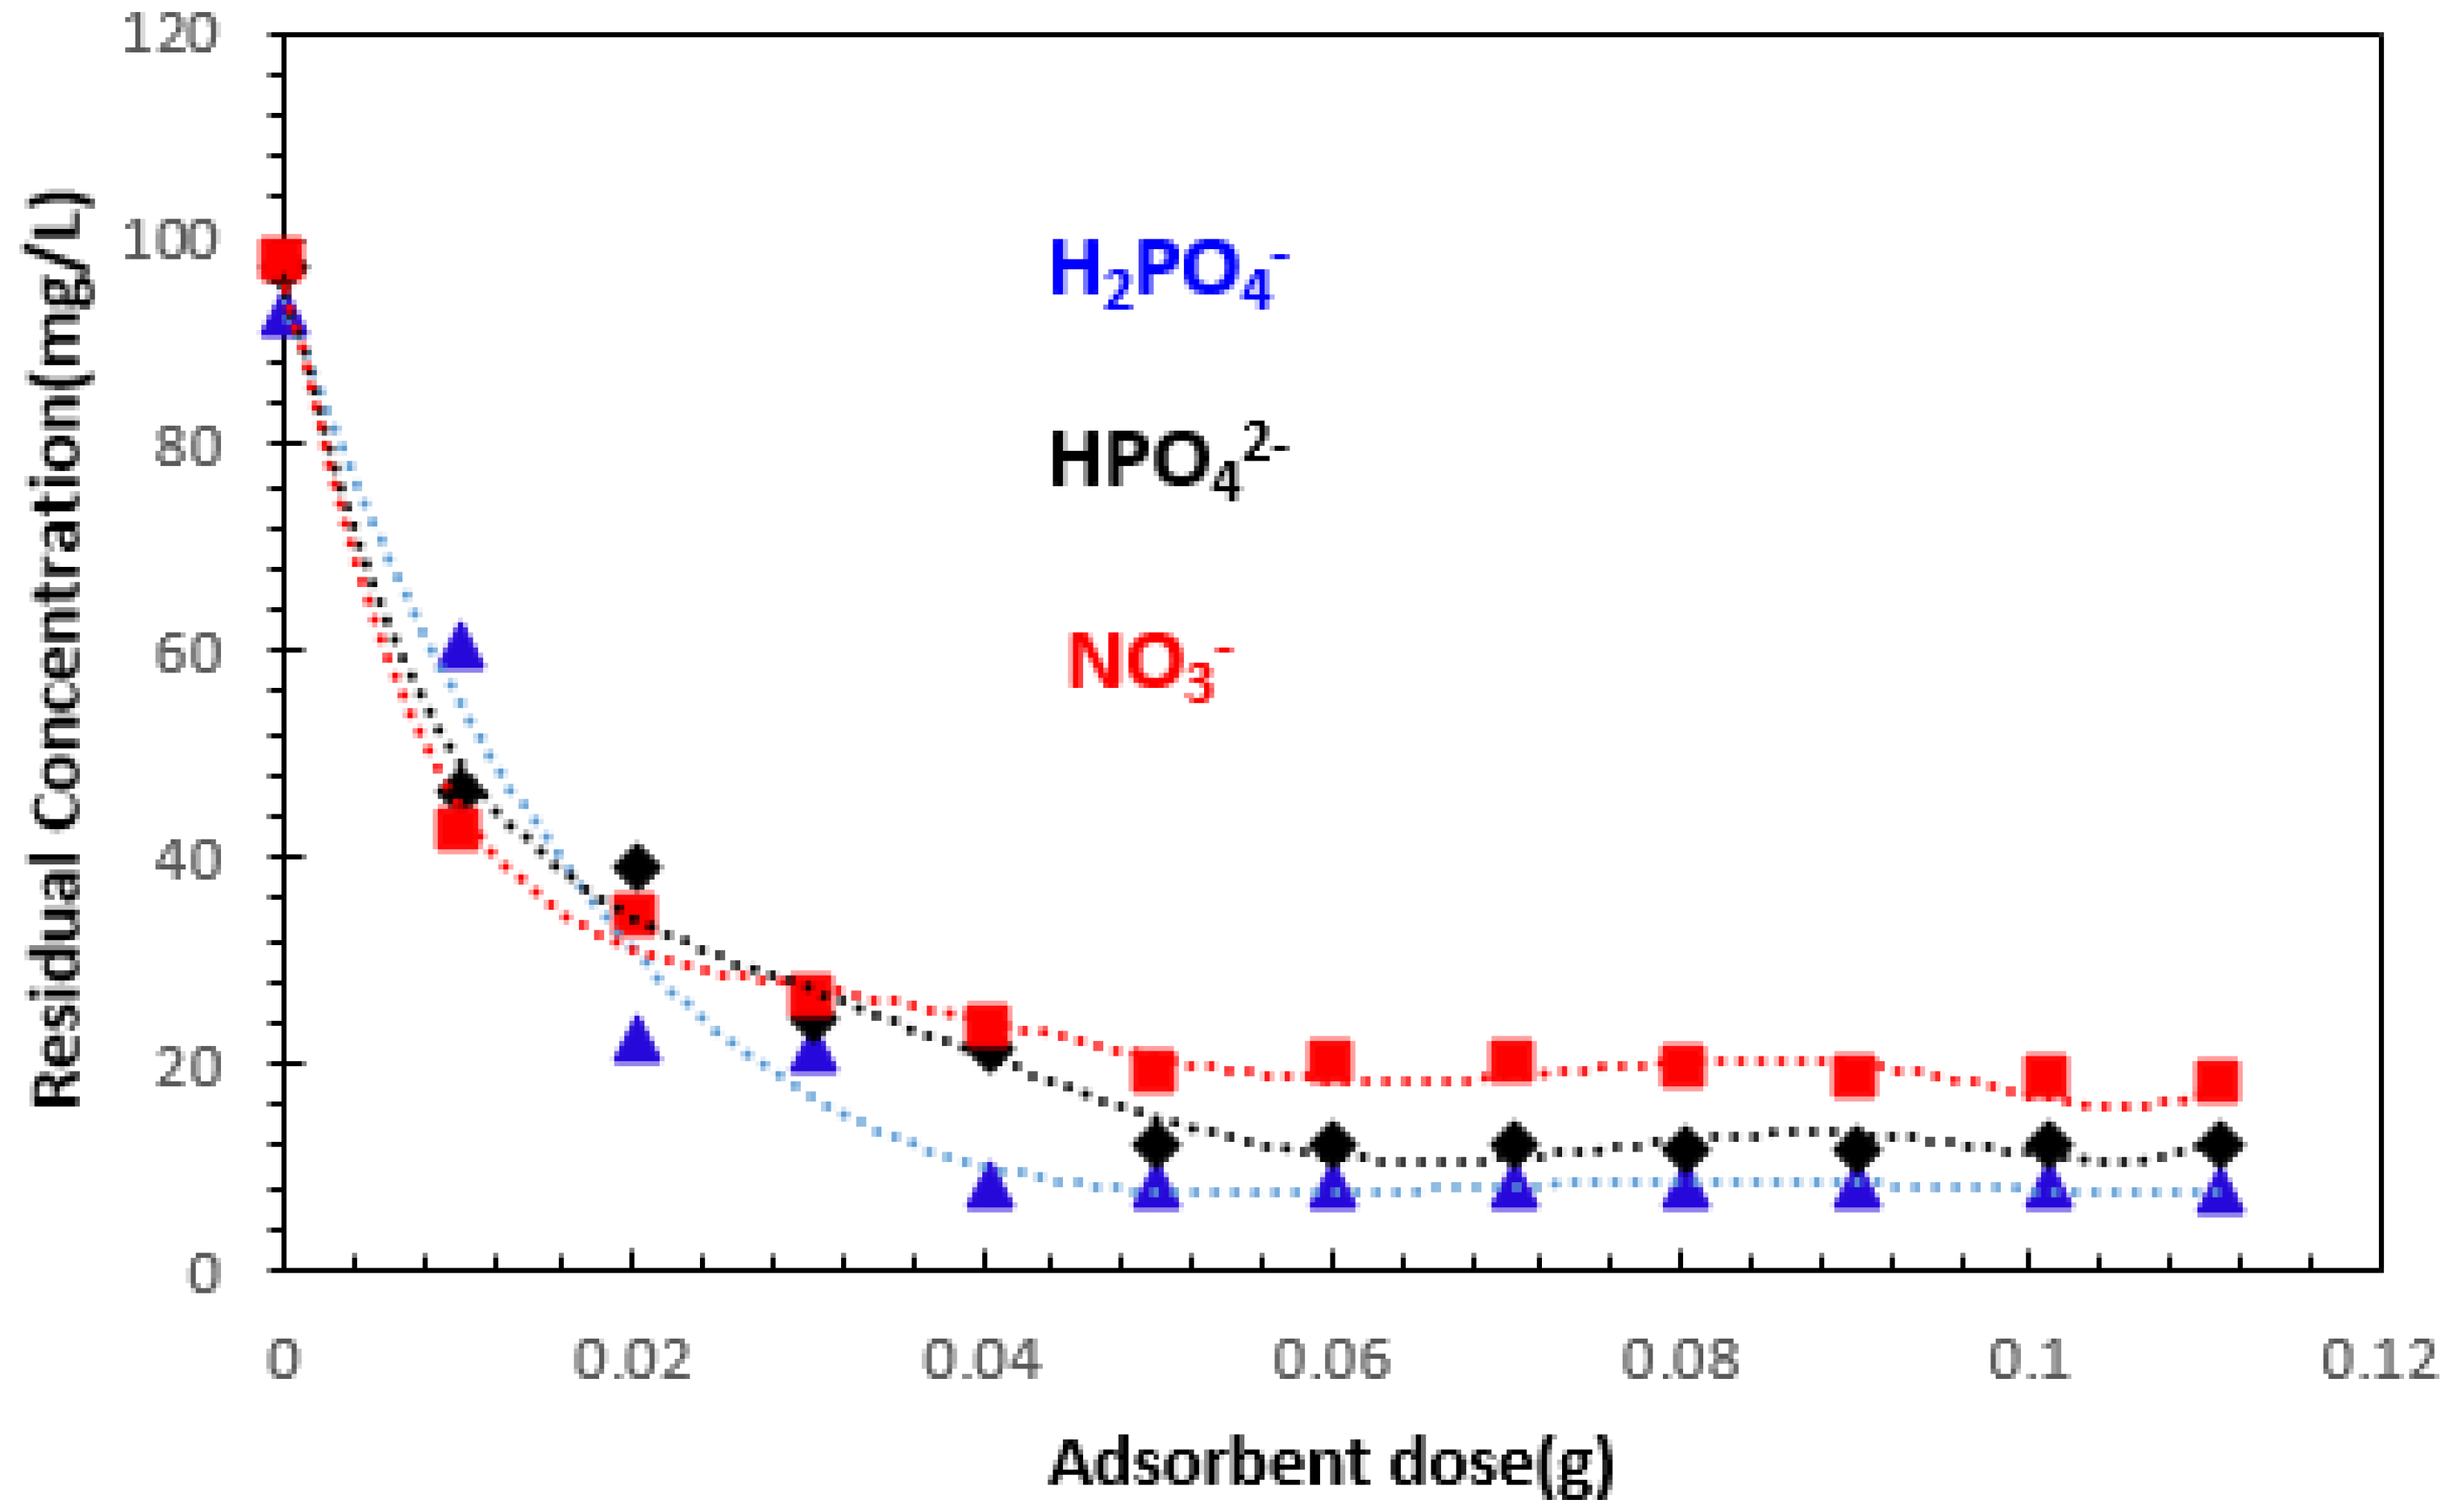
3.2.1. Effect of Adsorbent Dosage

The adsorbent dosage is a crucial parameter, as it defines the capacity of an adsorbent for a given initial concentration of the adsorbate [39]. The effect of adsorbent dosage on the removal of orthophosphates (H2PO4 and HPO42−) and nitrates (NO3) at C0 = 100 mg/L was studied by stirring in different masses at 25 °C.
Figure 7 illustrates the variation in the amount of orthophosphate and nitrate ions adsorbed as a function of adsorbent mass.
The removal of H2PO4, HPO42−, and NO3 ions increases with the adsorbent dose, which could be explained by the increase in the number of available adsorption sites [15]. From these results, we can see that the relative adsorption capacity expressed in residual concentration decreases with increasing material mass, then stabilizes at an optimum mass equal to 0.06 g for orthophosphate and nitrate ions, where a plateau of maximum adsorption appears.
This may be due to the overlapping of adsorption sites as a result of adsorbent particle clutter. According to several published studies, this behavior can be explained by the fact that a large quantity of adsorbent creates particle agglomerations, resulting in a reduction in the total adsorption surface area and, consequently, a decrease in the quantity of adsorbate per unit mass of adsorbent [14,40,41]. In the following subsections, we will work with an optimum mass of 0.06 g for the ions studied. This result shows that 0.06 g of alginate–clay bio-nanocomposite per 50 mL of solution, corresponding to a mass/volume ratio equal to 1.2 g/L (R = 1.2 g/L), is sufficient to achieve the adsorption equilibrium for H2PO4, HPO42−, and NO3 ions, after a contact time of 12 h.

3.2.2. Effect of Contact Time

Contact time is considered an interesting operational parameter for an economical wastewater treatment process. The impact of contact time on discontinuous adsorption of H2PO4, HPO42−, and NO3 ion solution is illustrated in Figure 8.
From this figure, we can see that the adsorption kinetics of H2PO4, HPO42−, and NO3 ions on the nanocomposite used is characterized by two distinct steps, the first relatively rapid and the second indicated by the equilibrium step. The equilibrium time is around 120 min for orthophosphate ions and 180 min for nitrate ions.
These times are more than sufficient to establish equilibrium for the study of parameters which influence the removal of H2PO4, HPO42−, and NO3 ions by the alginate–clay bio-nanocomposite studied. When equilibrium is established, the adsorption rate stabilizes. The increase in the amount adsorbed as a function of time in the first stage may be due to the large number of vacant sites available on the adsorbent surface [40].

3.2.3. Effect of Initial Solution pH

The pH can have an impact on the structure of both adsorbent and adsorbate, as well as on the adsorption mechanism. This is due to the existence of protons that can modify the charge on the surface of adsorbent [41,42].
The pH plays a critical role in determining the stability and the prevailing forms of orthophosphate ions, including H2PO4, HPO42−, and PO43− [43]. The main phosphate ions in acidic solution are H2PO4 and HPO42−, while under alkaline conditions, they exist as PO43−. Figure 9 shows the relative predominance of the different forms of orthophosphate ions as a function of pH, under standard conditions. Phosphoric acid is a triacid and dissociates in the following sequence [10,44,45].
H3PO4 + H2O ⇄ H2PO4 + H3O+ (pKa1 = 2.1)
H2PO4 + H2O ⇄ HPO42− + H3O+ (pKa2 = 7.2)
HPO42− + H2O ⇄ PO43 + H3O+ (pKa3 = 12.4)
The examination of the pH impact was carried out according to the following method. In the initial step, 0.06 g of bio-nanocomposite beads were introduced into multiple flasks, each containing 50 milliliters of H2PO4, HPO42−, and NO3 ion solution. The study of the effect of solution pH on the adsorption of phosphate and nitrate ions was carried out at an initial concentration of 100 mg/L and at different pH. The pH ranged from 2.08 to 11.95 for H2PO4, from 2.12 to 11.90 for HPO42−, and from 2.10 to 11.96 for NO3. The results are shown in Figure 10. This figure shows that the adsorbed quantities of orthophosphate and nitrate ions remain significantly higher, at pH values below the pHZPC of the bio-nanocomposite. These results show that the adsorbed amount of H2PO4, HPO42−, and NO3 ions is slightly increased, when the initial pH of the solution is below six, and then decreased in the basic medium, which can be explained by the pH value of the zero-charge point. We can see that, at pH values below the pH of the zero point charge (pH < pHZPC), the removed amount of orthophosphate and nitrate ions is significant. The surface of the bio-nanocomposite used at pH< pHZPC is positively charged, which favors anion adsorption. This can be explained by the electrostatic attraction between the anions and the positively charged adsorbent surface. At pH values above pHZPC, due to the presence of hydroxide ions (OH), the surface of the bio-nanocomposite is negatively charged, leading to a reduction in the quantity adsorbed. For the adsorption of orthophosphate and nitrate ions, the surface of the bio-nanocomposite must be positively charged [46,47]. The decrease in adsorption capacity when pH increases can be explained by the fact that, at a higher pH, there are more OH ions in the solution that are likely to compete with orthophosphates, resulting in a noticeable decrease in adsorption towards the studied anions. Additionally, the surface of the adsorbent becomes more negatively charged at a higher pH, leading to greater repulsion, and thus a decrease in phosphate removal [3].
A similar study by Elemile et al. (2022) [48] on the removal of nitrate ions by modified chicken feathers (MCFs) showed that the highest nitrate removal efficiency was observed in the initial pH range below eight. When the initial pH is less than eight, the adsorption removal efficiency of nitrates increases along with the pH increase, as shown in Figure 10, and begins to decrease when the initial pH value is greater. For pH values below 8.0, the decrease in removal efficiency could be caused by dissociation of functional groups on the adsorbent.

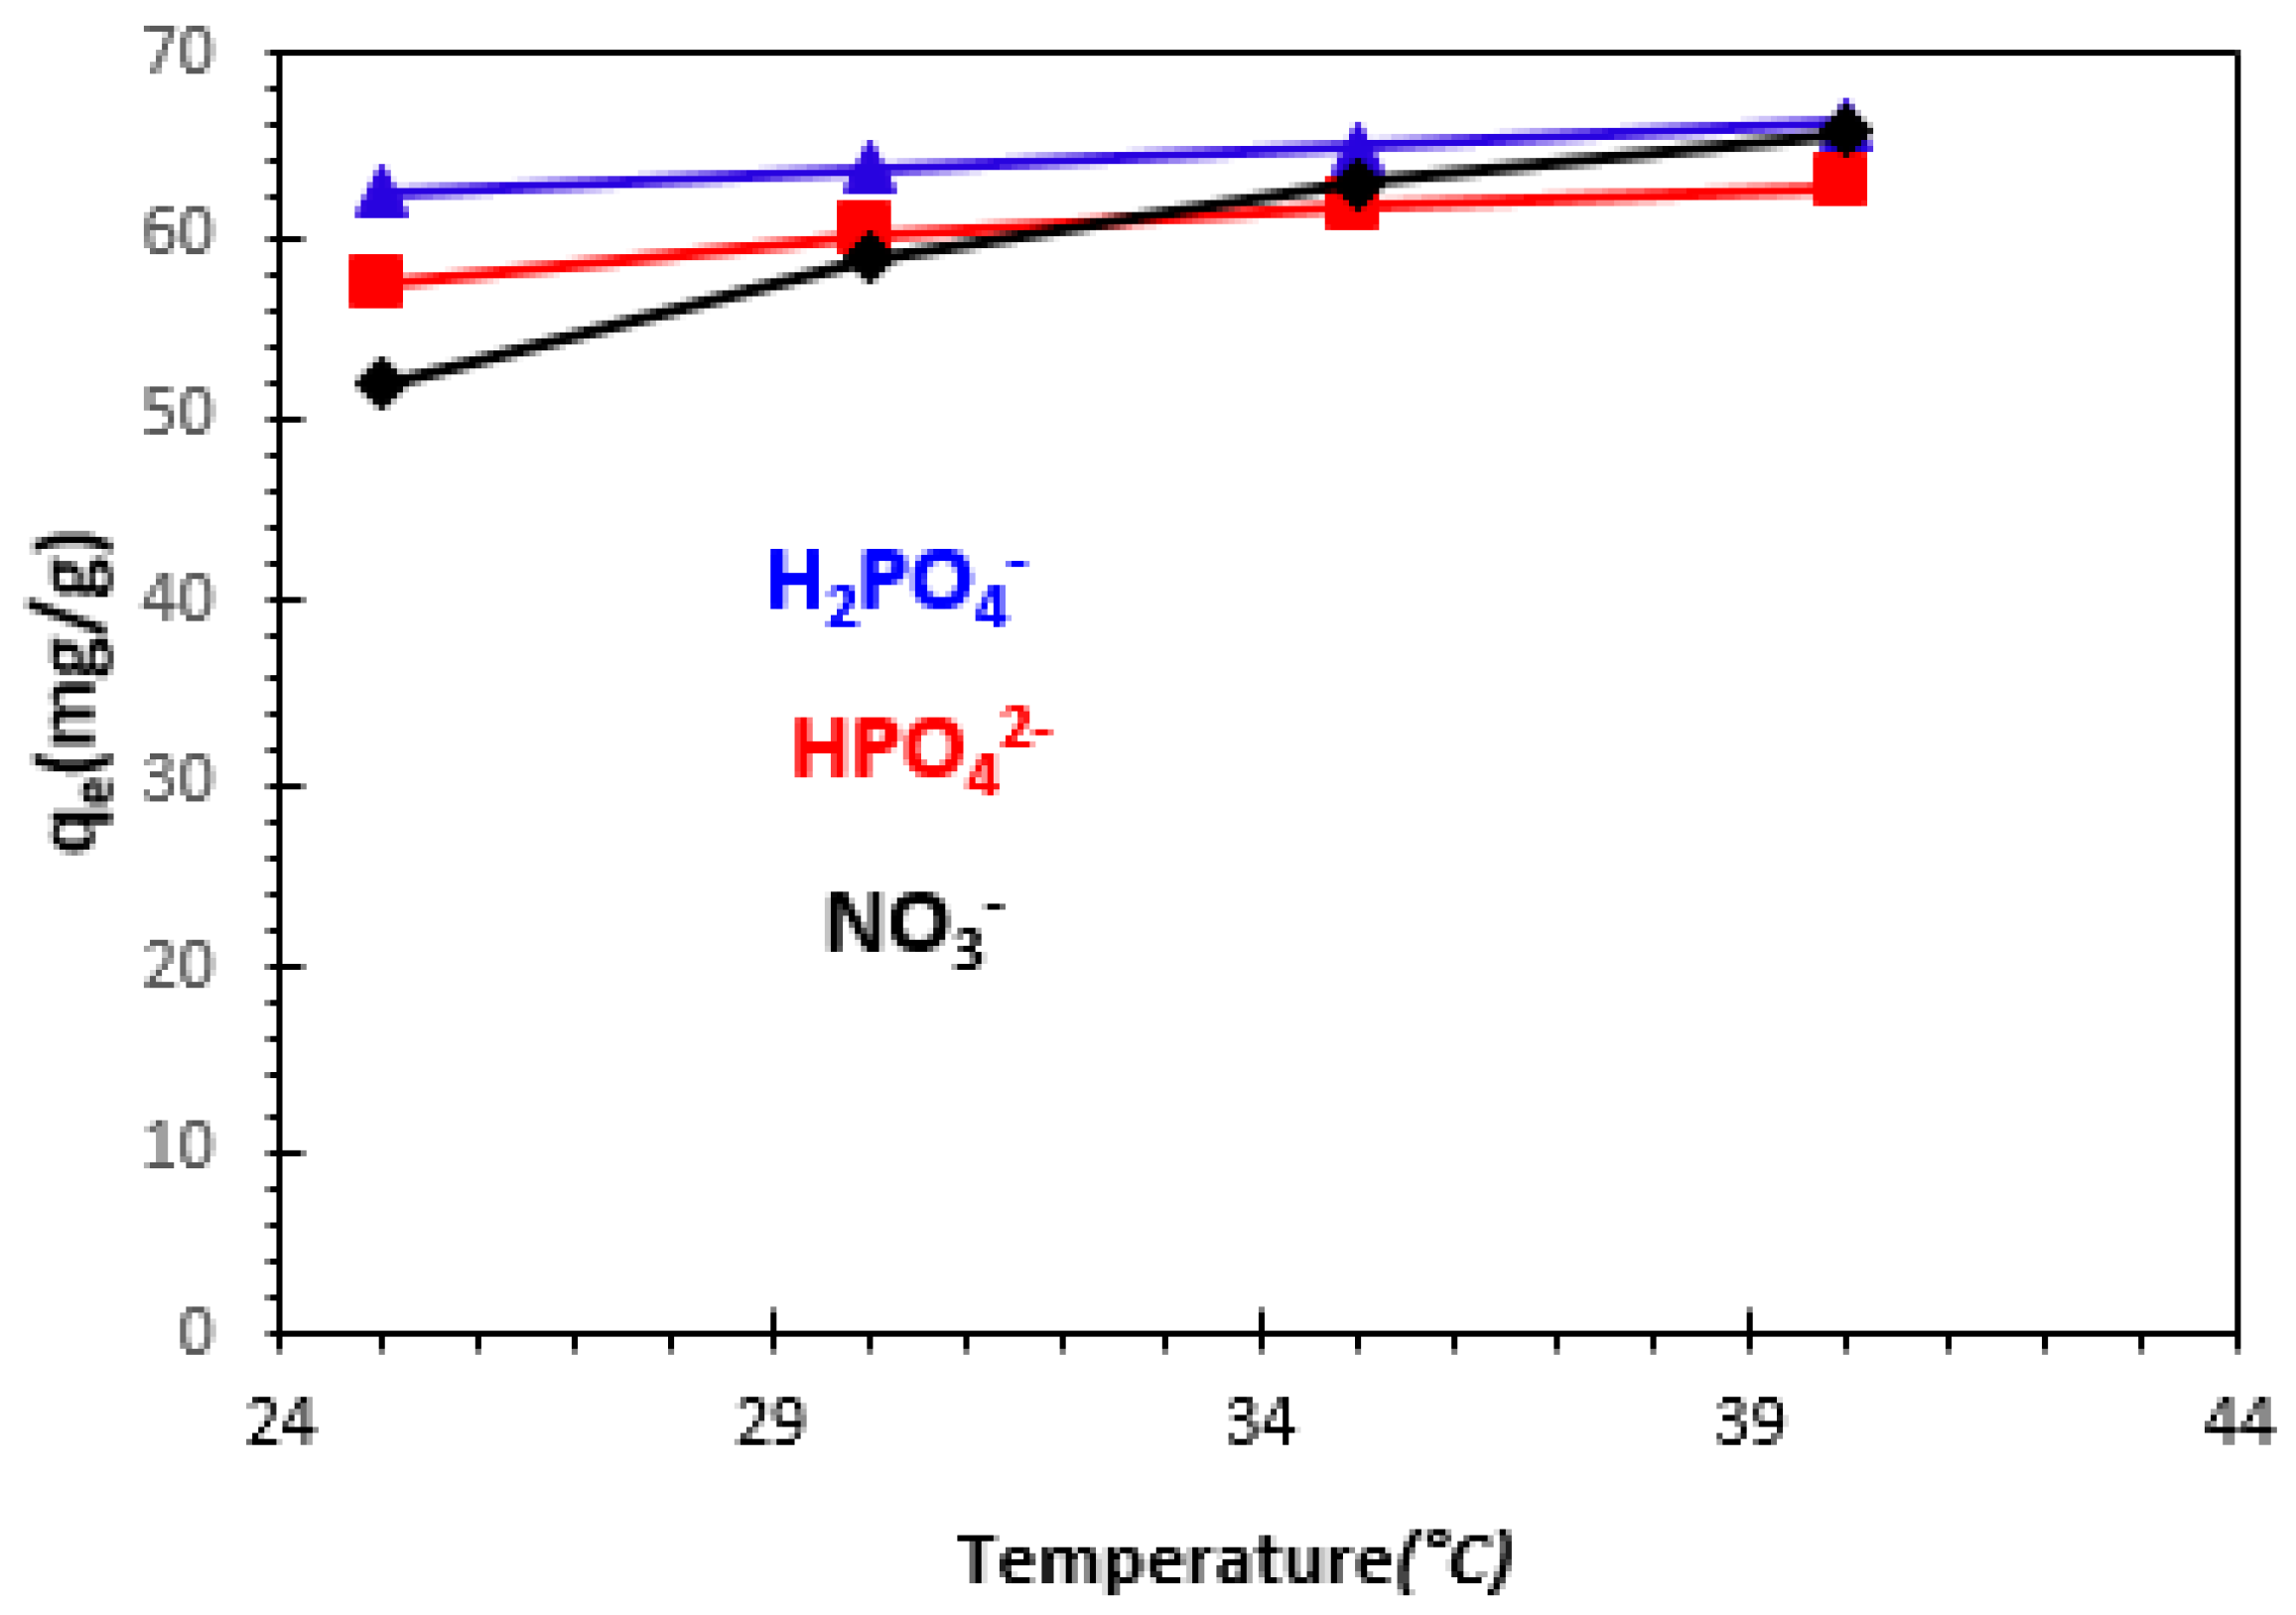
3.2.4. Effect of Temperature

The influence of solution temperature on the adsorption of H2PO4, HPO42−, and NO3 ions was tested over a temperature range from 25 to 40 °C, with an initial concentration of 100 mg/L (Figure 11). Increasing the temperature from 25 °C to 40 °C resulted in a slight increase in the adsorption capacity of the prepared bio-nanocomposite. These results lead to the conclusion that adsorption capacity increases with increasing temperature, suggesting endothermic adsorption. These results can be verified by determining the thermodynamic parameters.
A similar study by Morghi et al. (2015) [47] on nitrate ion adsorption using chitin showed that the concentration of NO3 adsorbed by chitin increases slightly with temperature, and that this adsorption would be endothermic. The optimum temperature at equilibrium contact time for the adsorption of nitrate ions onto chitin was obtained at 35 °C. Abidar et al. (2015) [49] studied the evolution of the retained concentration of H2PO4 and HPO42− ions as a function of temperature for an initial concentration of 100 mg/L. This study showed that the concentration of retained orthophosphate ions (Cr) increases with increasing temperature.

3.3. Adsorption Kinetic Models

The experimental data on adsorption kinetics were examined using a variety of kinetic models, namely the pseudo-first-order model, pseudo-second-order model, Elovich model, and intra-particle diffusion model [13].

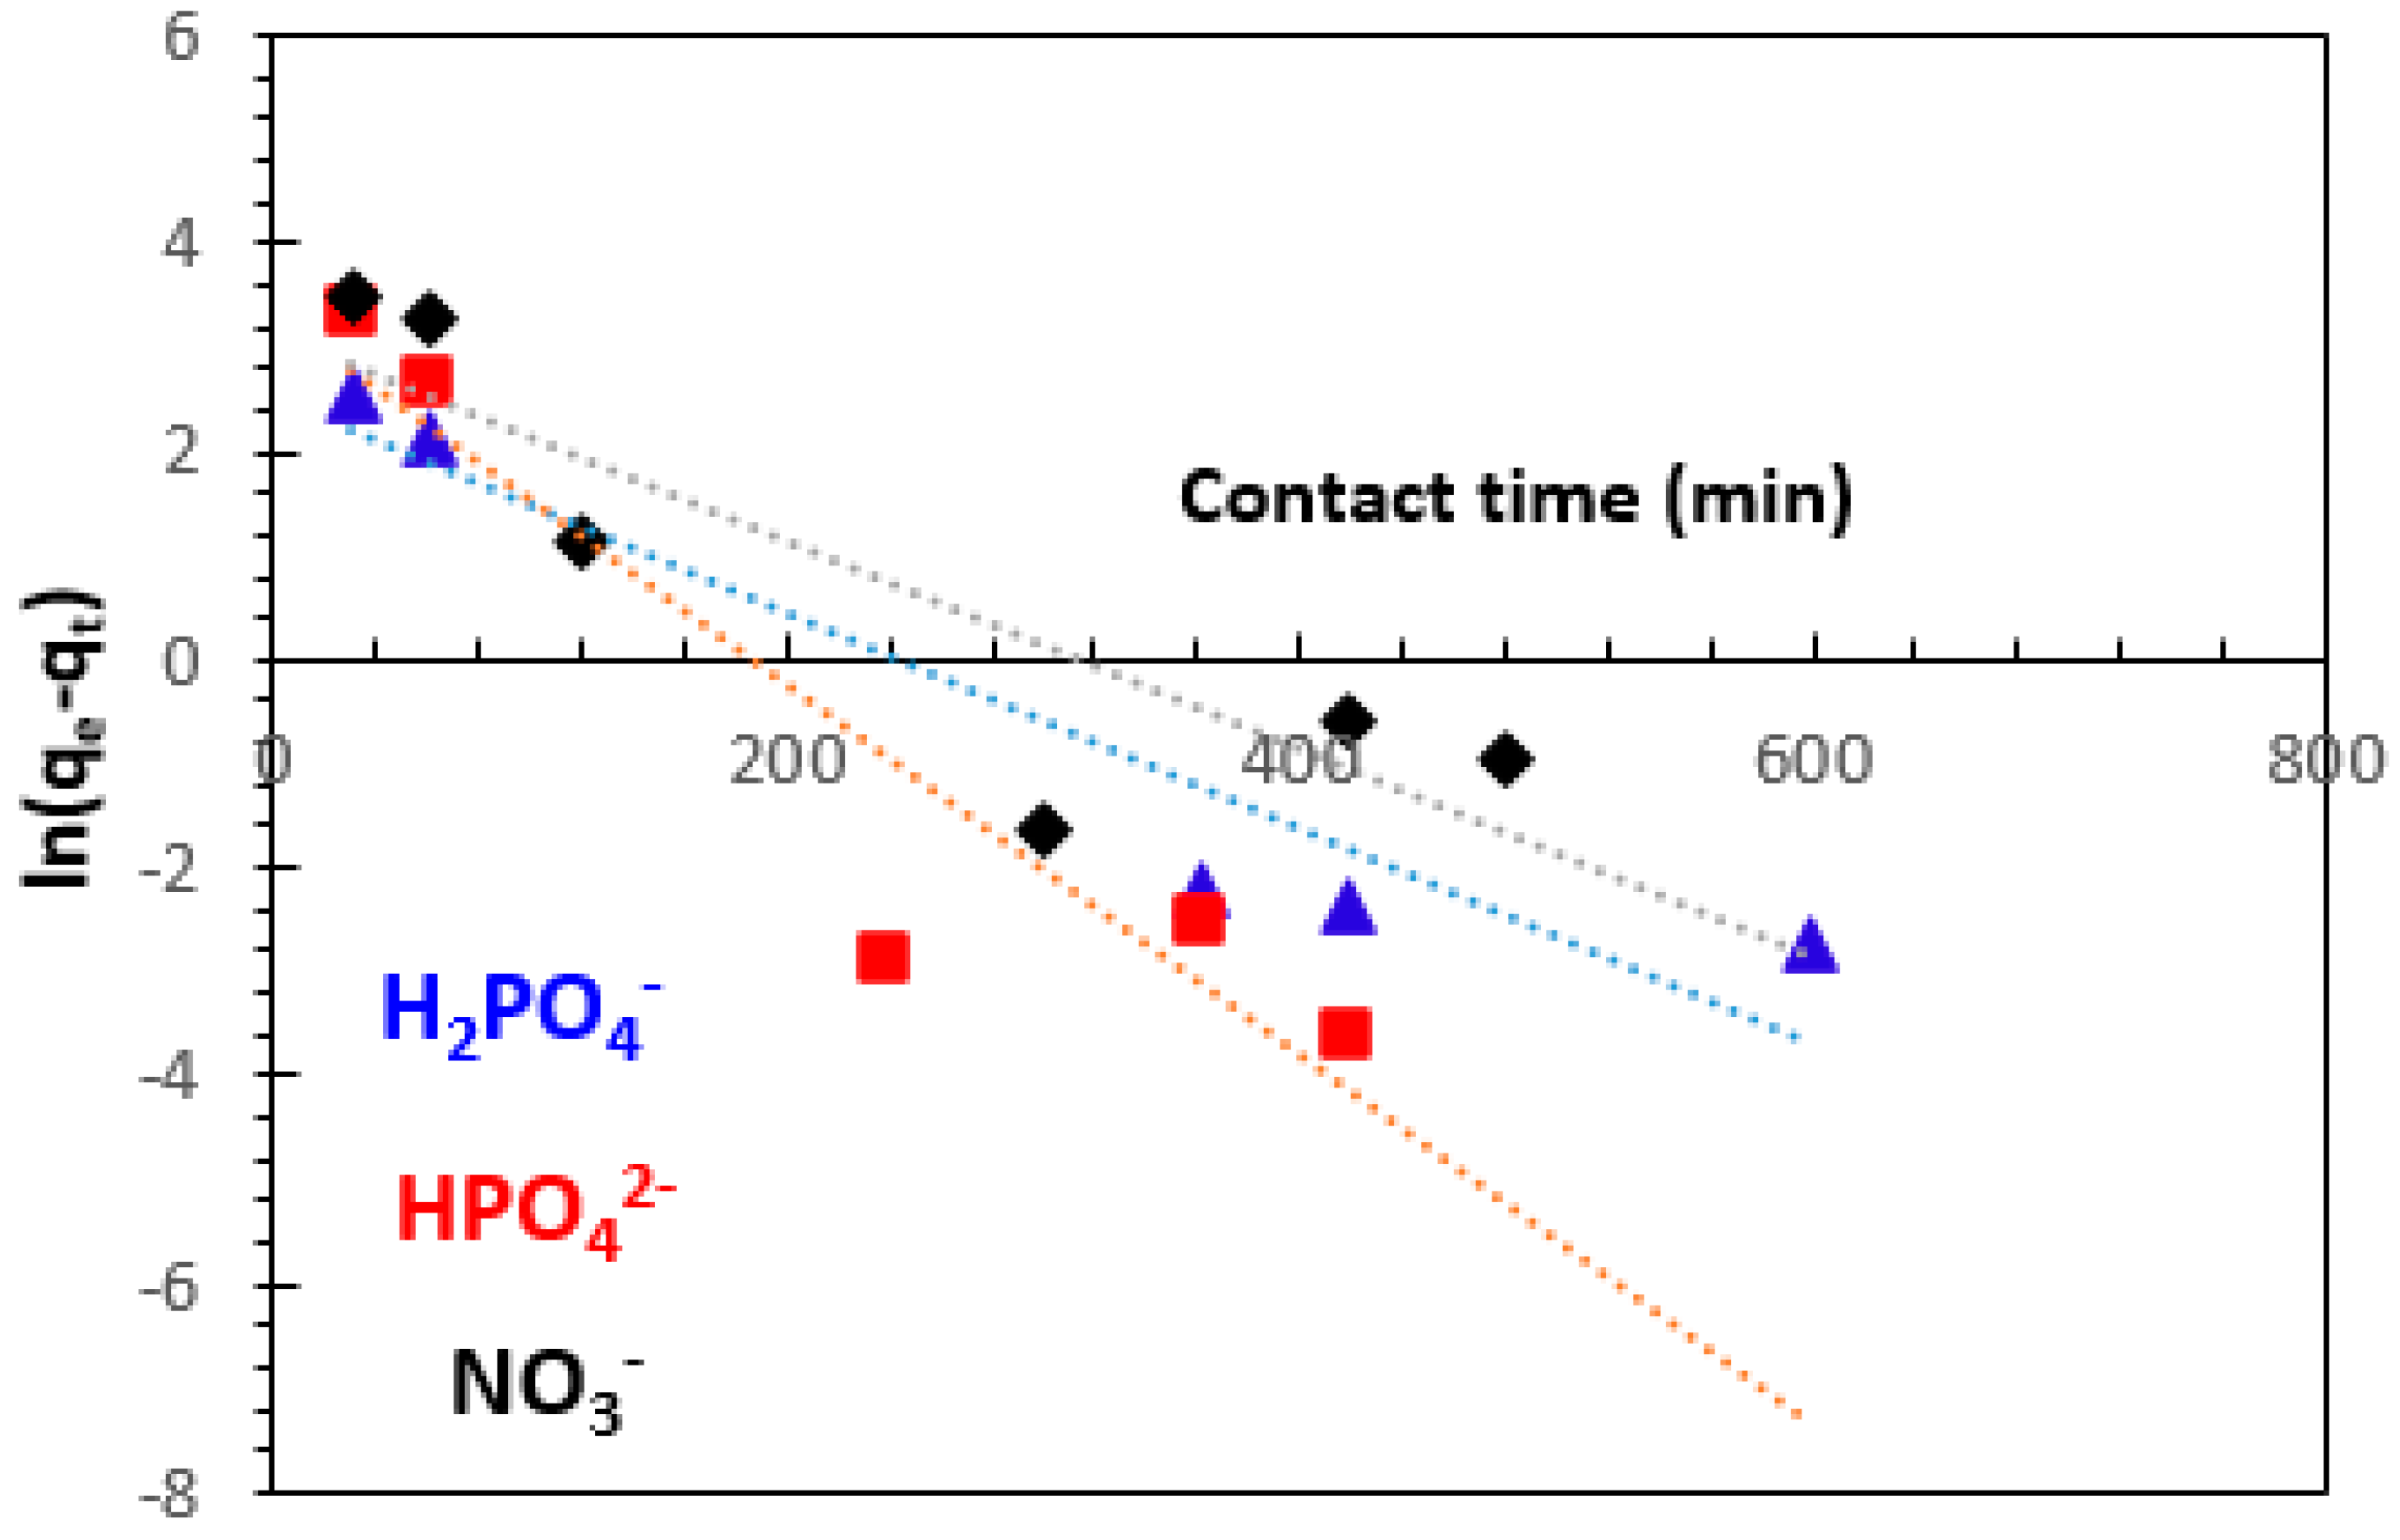
3.3.1. Pseudo-First-Order Kinetics Model

The kinetics equation of the pseudo-first-order model and its linearized form may be represented as follows [13,50,51,52,53,54]:
d q t d t = k 1 q e q t         n o n l i n e a r   f o r m      
ln q e q t = ln q e k 1 t           l i n e a r   f o r m    
where k1 (min−1) is the rate constant for the pseudo-first-order kinetics model, qe (mg.g−1) and qt (mg.g−1) are the amounts of H2PO4, HPO42−, and NO3 ions retained on weight unit of adsorbent at equilibrium, and at any time t (min), respectively.
The plot of ln (qe−qt) versus contact time t for alginate–clay bio-nanocomposite gives a straight line of slope –k1 and intercepts ln qe (Figure 12). The values of the theoretical adsorption capacity (qe,the), the rate constant for the pseudo-first-order kinetics model (k1), and the correlation coefficient (R2) are presented in Table 1. The table shows that the value of theoretical adsorbed amount qe is not quite similar to the experimental value (qe,the = 6.853 mg/g < qe,exp = 62.37 mg/g for H2PO4, qe,the = 9.079 mg/g < qe,exp = 57.30 mg/g for HPO42−, and qe,the = 8.584 mg/g < qe,exp = 51.85 mg/g for NO3), suggesting the insufficiency of pseudo-first-order model. We find that, under these conditions, the pseudo-first-order model is not adequate to describe the adsorption kinetics of H2PO4, HPO42−, and NO3 from aqueous solutions onto bio-nanocomposite beads.

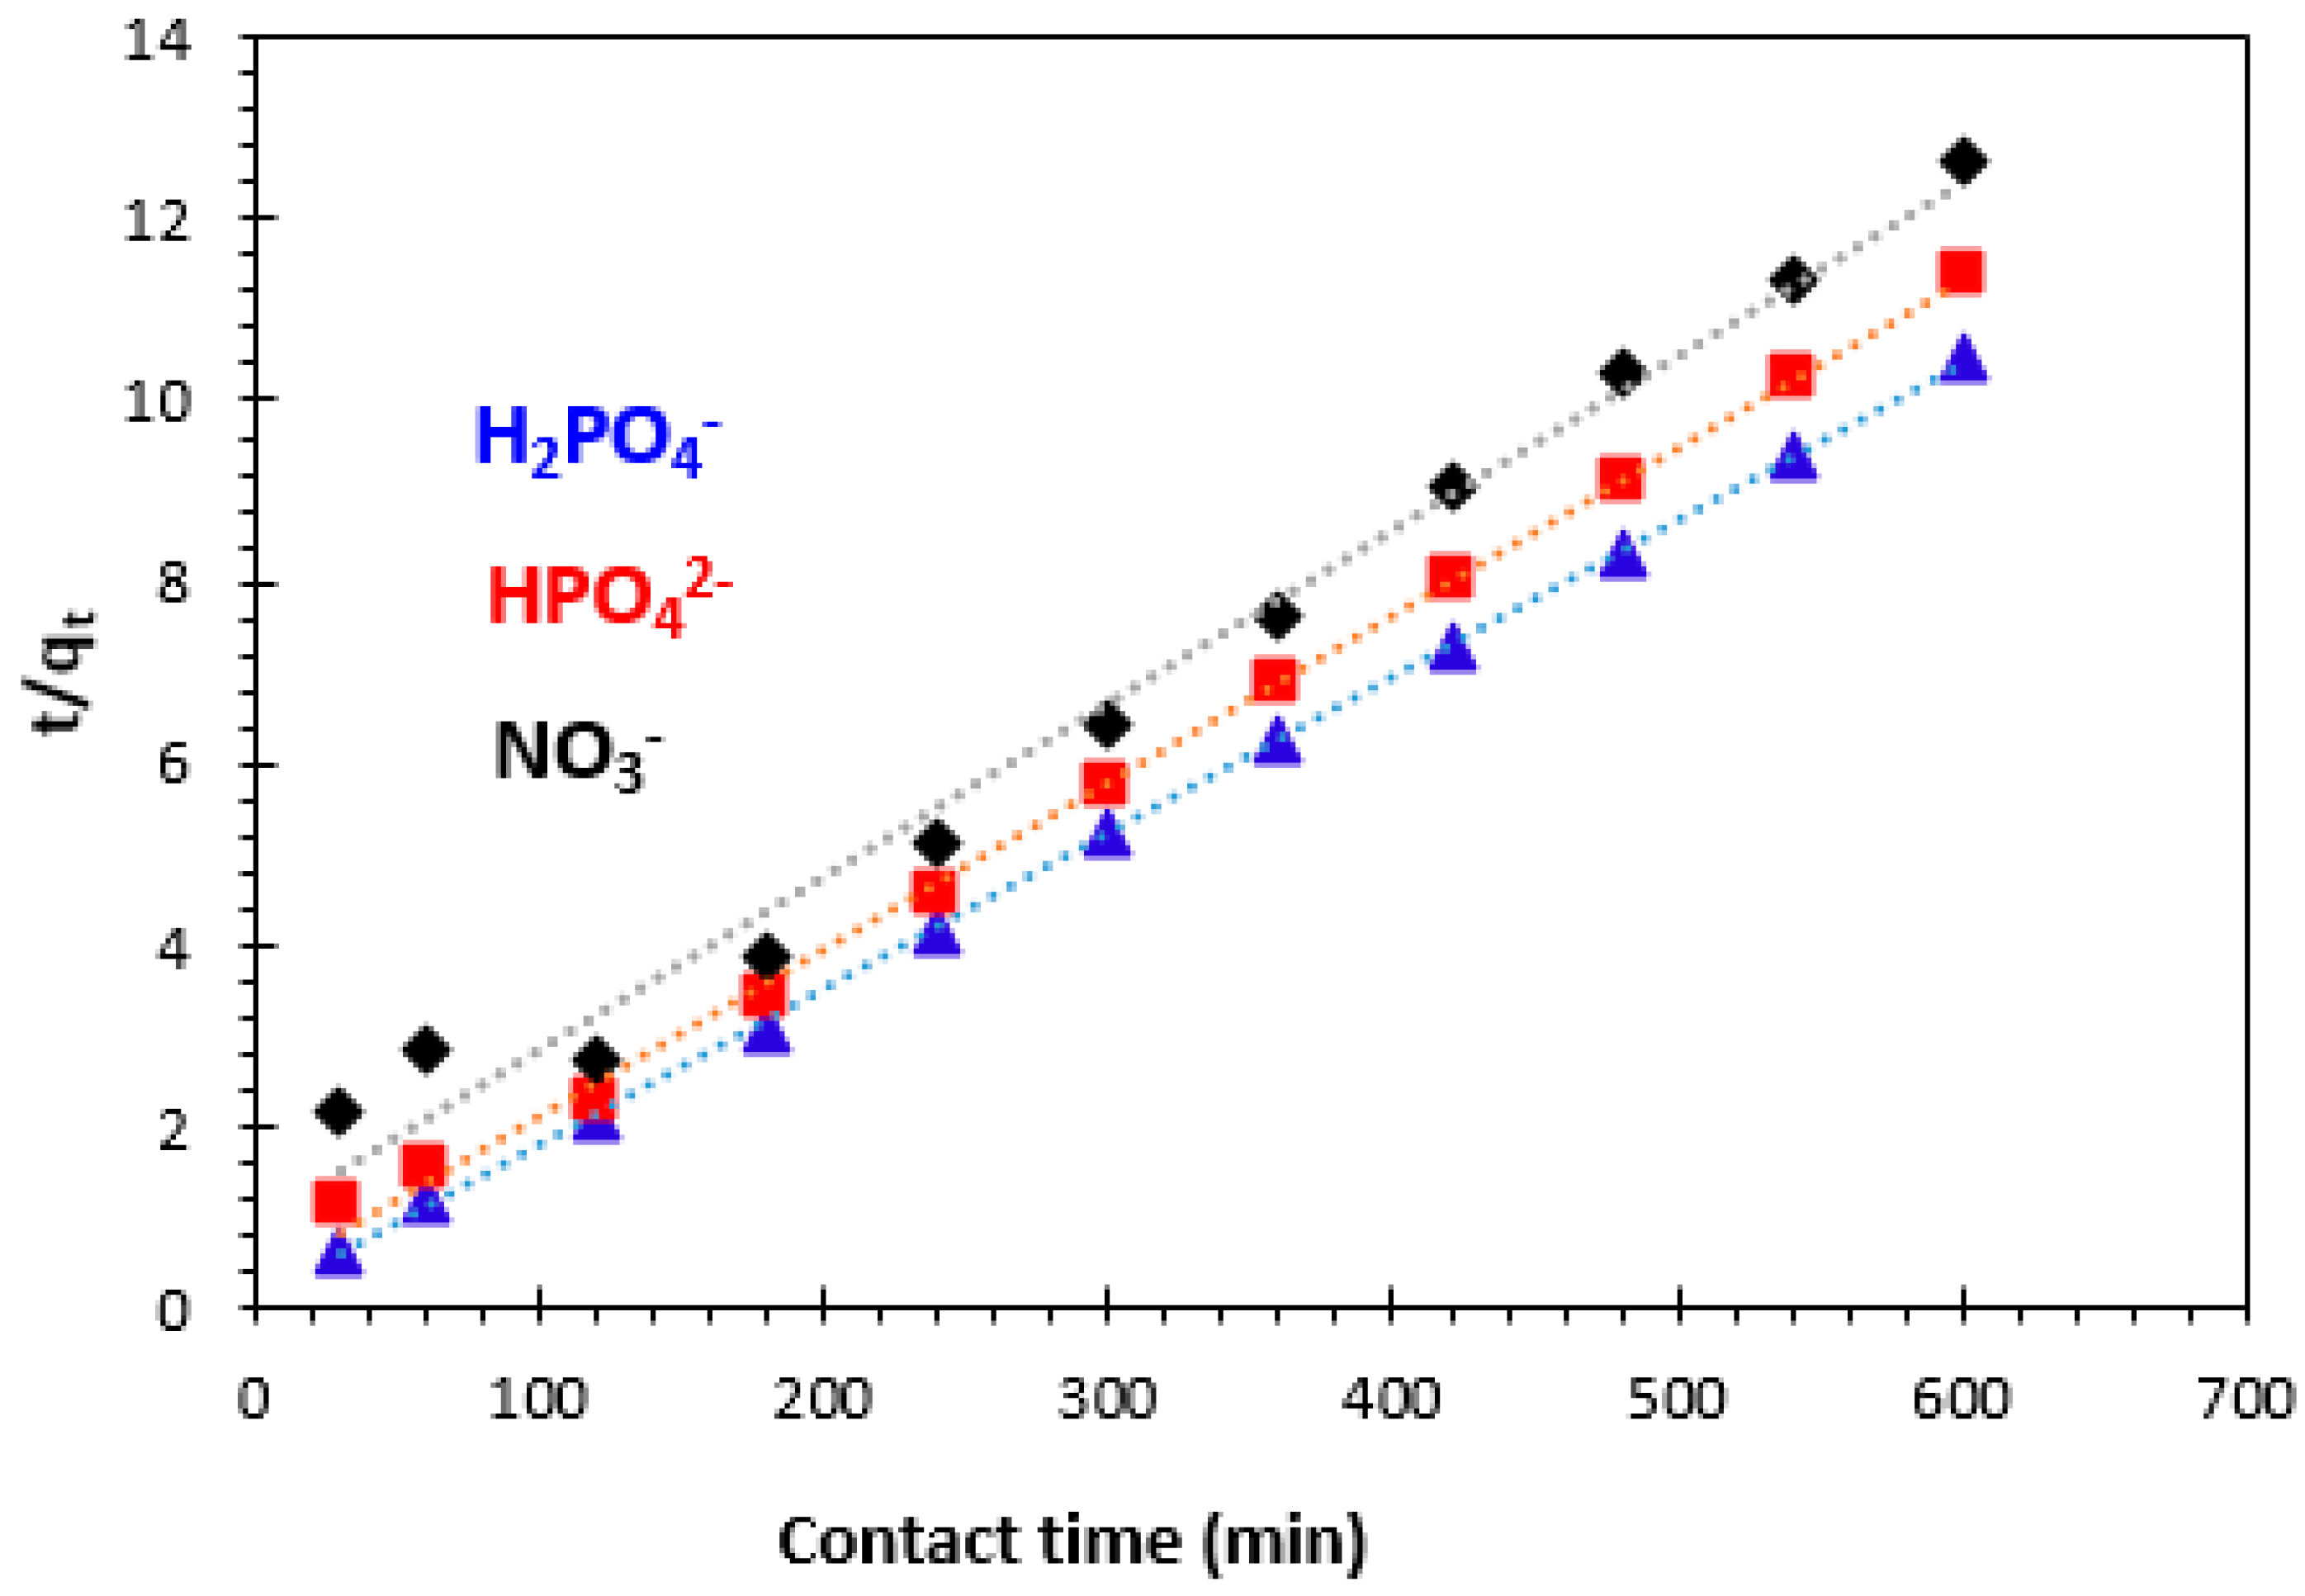
3.3.2. Pseudo-Second-Order Kinetics Model

The rate equation and its linearized form for the pseudo-second-order kinetics model can be represented as follows [13,50,51,52,53,54]:
d q t d t = k 2 q e q t 2     n o n l i n e a r   f o r m
t q t = 1 k 2 q e 2 + 1 q e t           l i n e a r   f o r m    
where k2 (g.mg−1min−1) is the rate constant for the pseudo-second-order kinetics model, qe (mg/g) and qt (mg/g) are the amounts of H2PO4, HPO42−, and NO3 ions retained on weight unit of adsorbent at equilibrium, and at any contact time t (min), respectively. The pseudo-second-order plots of H2PO4, HPO42−, and NO3 adsorption are presented in Figure 13, and the kinetic parameters are given in Table 1. The correlation coefficient for the pseudo-second-order kinetic model is nearly equal to one (>0.99), and the value of theoretical adsorption capacity (qe,the) is comparable to the experimental one (qe,the = 58.14 mg/g for H2PO4, qe,the = 54.64 mg/g for HPO42−, and qe,the = 52. 63 mg/g for NO3).
Therefore, it was concluded that the pseudo-second-order adsorption model is more appropriate to describe the adsorption kinetics of H2PO4, HPO42−, and NO3 ions on bio-nanocomposite.

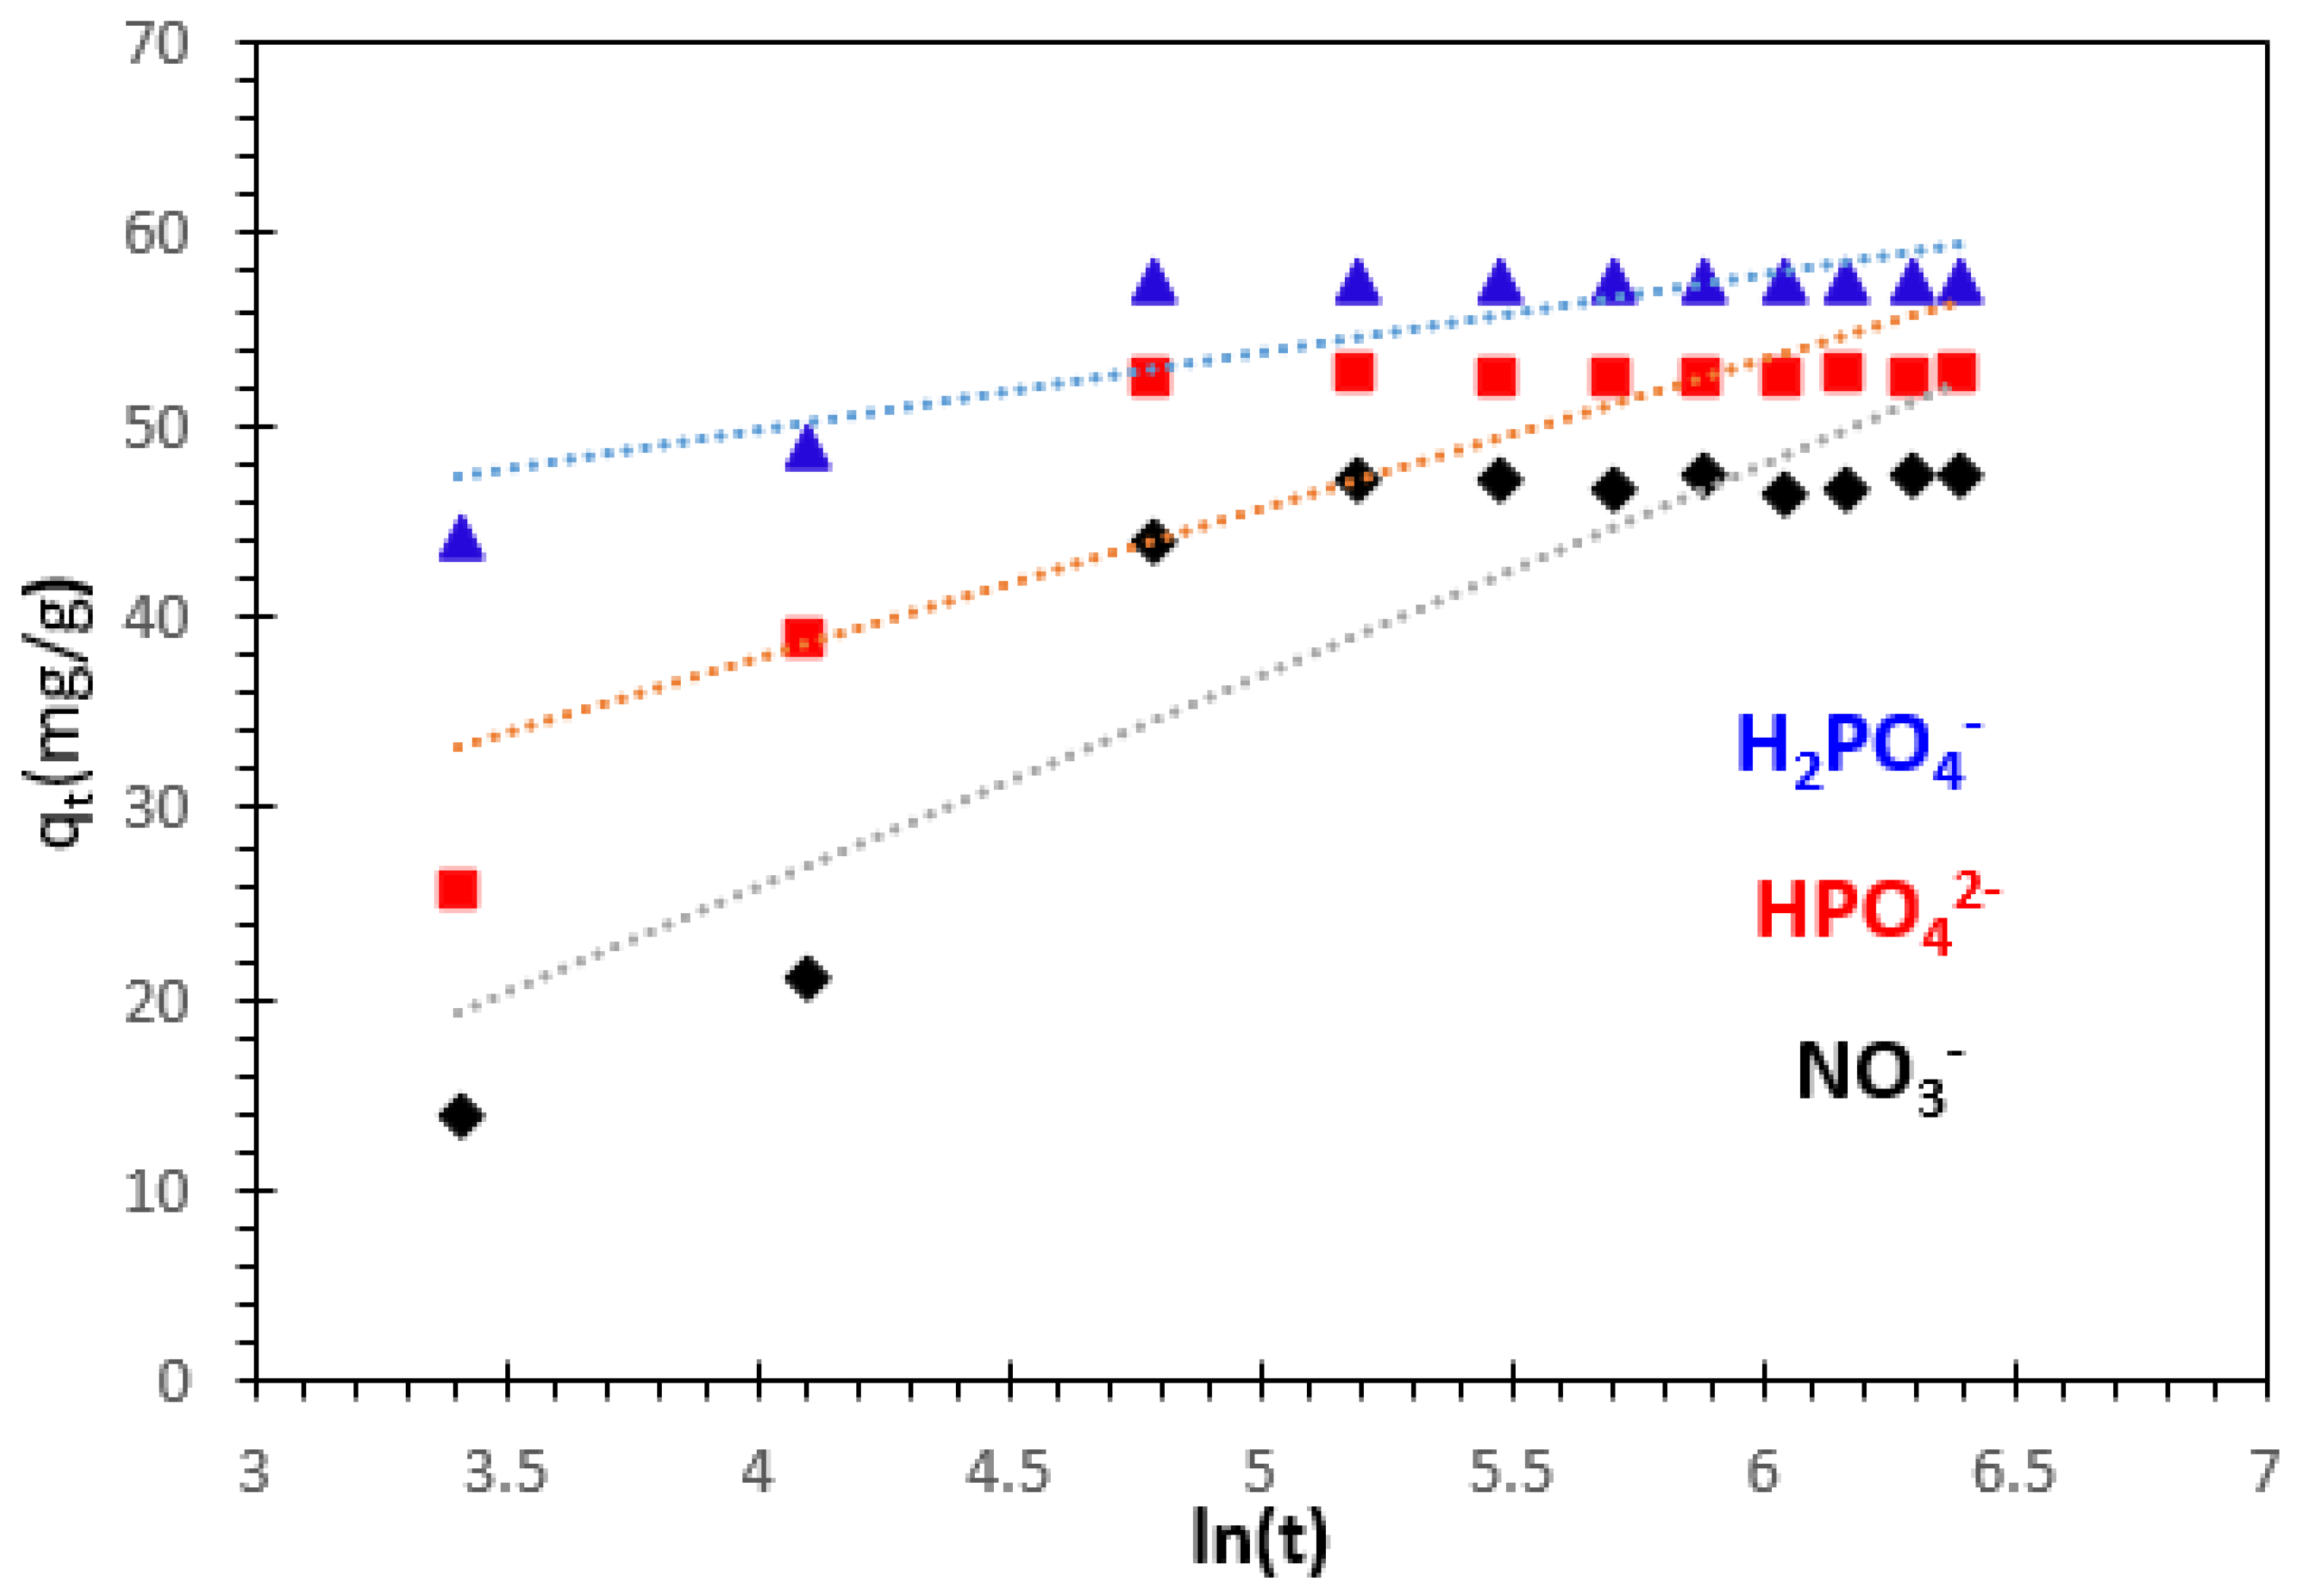
3.3.3. Elovich Kinetic Model

The Elovich model is applicable to systems with heterogeneous surfaces and is particularly suitable for describing chemisorption kinetics [13]. The model can be expressed using Equations (7) and (8), where the terms qe (mg/g) and qt (mg/g) represent the amounts of H2PO4, HPO42−, and NO3 adsorbed at equilibrium and at any given contact time t (minutes), respectively.
The Elovich model is valid for systems with heterogeneous surface and is suitable for chemisorption kinetics. The equation for Elovich kinetic model and its linearized form may be expressed as:
d q t d t = α e β q t       n o n l i n e a r   f o r m
q t = l n ( α β ) β + 1 β ln ( t )       l i n e a r   f o r m
where qe (mg.g−1) and qt (mg.g−1) are the amounts of H2PO4, HPO42−, and NO3 adsorbed at equilibrium, and at any contact time t (min), respectively. α (mg.g−1.min−1) is the initial adsorption rate, and β (g.mg−1) is the desorption constant related to the extent of the surface coverage and activation energy for chemisorption. The Elovich kinetic constants α and β are obtained from the intercept and the slope, respectively (Figure 14). The correlation coefficient indicates that the Elovich model is not adequate to characterize the H2PO4, HPO42−, and NO3 ion adsorption on nanocomposite beads.

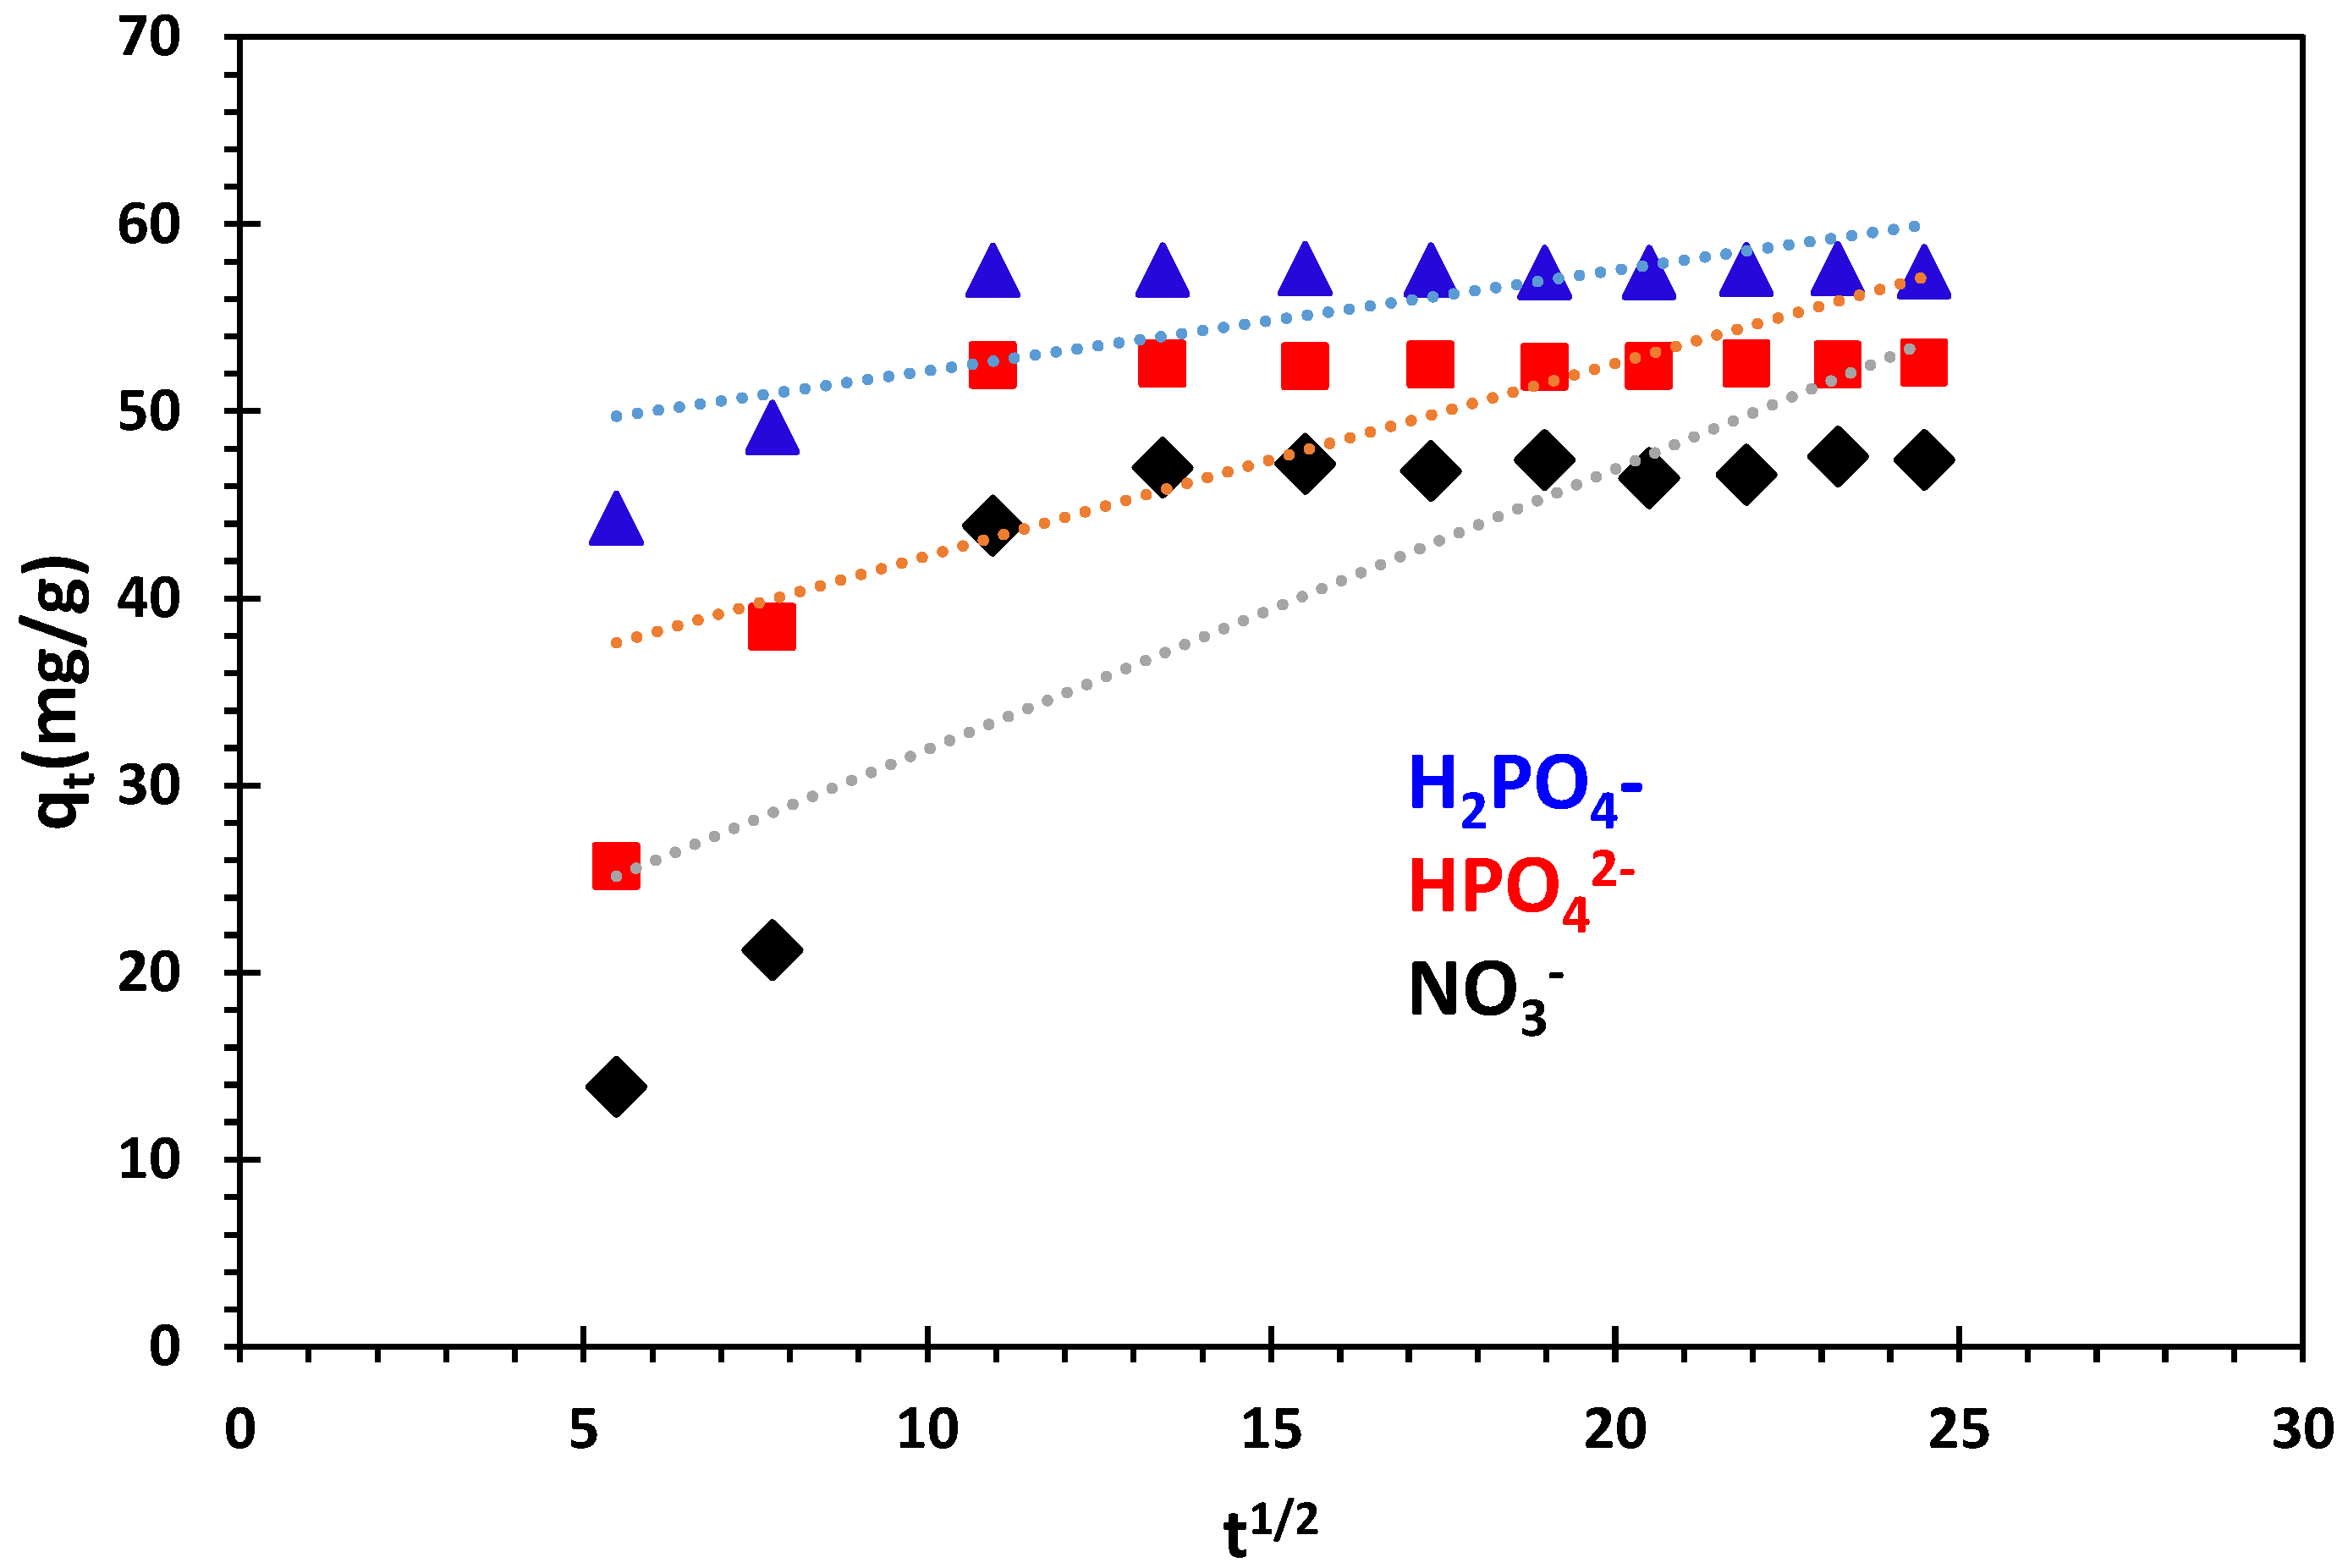
3.3.4. Intra-Particle Diffusion Kinetics Model

The intra-particle diffusion model is of significant interest because internal diffusion determines the adsorption rate in most liquid systems [13]. To calculate the initial rate of intra-particle diffusion, Equation (9) is linearized. In this equation, kp (mg−1·min1/2) represents the intra-particle diffusion rate constant; c (mg·g−1) is the concentration of H2PO4, HPO42−, and NO3 ions from the solution at equilibrium; and qt (mg·g−1) denotes the amount of orthophosphate and nitrate ions retained on a unit weight of the adsorbent, at contact time t (minutes). The graphical representation of this relationship is given in Figure 15.
q t = k p t 1 / 2 + c         l i n e a r   f o r m
where kp (mg·g−1· min1/2) is the intra-particle diffusion rate constant; c (mg·g−1) is the concentration of H2PO4, HPO42−, and NO3 ions from solution at equilibrium; and qt (mg·g−1) is the amount of H2PO4, HPO42−, and NO3 ions retained on weight unit of adsorbent, at contact time t (min). The values of intra-particle diffusion, kp, were obtained from the slope of the straight-line portions of plot of qt versus t1/2 for various temperatures of the solution. The correlation coefficients (R2) for the three anions studied are 0.568 for H2PO4, 0.554 for HPO42−, and 0.630 for NO3 at 25 °C. This correlation coefficient indicates that the intra-particle diffusion model is not suitable to describe the kinetics of H2PO4−, HPO42−, and NO3 ion adsorption from aqueous solutions on bio-nanocomposite beads. The values of kp and c calculated from the slopes and intercepts are summarized in Table 1.
The adsorption study of H2PO4, HPO42−, and NO3 ions by the bio-nanocomposite showed that the correlation coefficient (R2) values for the pseudo-second-order adsorption kinetic model were significantly high (around 0.99) for an initial concentration equal to 100 mg/L. Furthermore, the adsorption capacity calculated using the pseudo-second-order model closely matched the results found experimentally. It can be deduced that the pseudo-second-order adsorption model is considered the most appropriate choice for elucidating the kinetics of H2PO4, HPO42−, and NO3 ion adsorption by the nanocomposites used.

3.4. Isotherm Study

Adsorption isotherms are mathematical models that describe the distribution of adsorbed species between the solid and liquid phases and are significant data for studying the adsorption mechanism [55]. In this study, the Langmuir, Freundlich, Temkin, and Dubinin–Radushkevich (D–R) equations were used to describe the relationship between the adsorption of H2PO4, HPO42−, and NO3 ions on alginate–clay bio-nanocomposite. This study was performed by ranging the initial ion concentration from 100 to 600 mg/L at room temperature.

3.4.1. Langmuir Adsorption Isotherm

The Langmuir adsorption isotherm supposes that the solid surface has a finite number of identical sites, which shows homogeneous surfaces [13,55,56,57,58]. The Langmuir equation and its linearized form may be represented as follows:
q e = q L K L C e 1 + K L C e       ( n o n l i n e a r   f o r m )  
1 q e = 1 q L + 1 q L K L C e             ( l i n e a r   f o r m )      
where qe (mg/g) is the amount adsorbed at equilibrium concentration Ce (mg/L), qL (mg/g) is the Langmuir constant representing maximum monolayer capacity, and KL (L/mg) is the Langmuir constant related to the energy of adsorption.
The plots of 1/qefunction of 1/Ce for the adsorption of H2PO4, HPO42−, and NO3 ions are given in Figure 16. The values of the adsorption capacity (qL), the Langmuir constant (KL), and the correlation coefficient (R2) are presented in Table 3.
The Langmuir model is an indication of surface homogeneity of the adsorbent. The basic assumption of Langmuir adsorption isotherm is also based on monolayer coverage of the adsorbate on the surface of the adsorbent. The adsorption capacity of the adsorbent decreased as the temperature increased. The highest value of qL obtained at 25 °C was 625 mg/g for H2PO4, 909.09 mg/g for HPO42−, and 588.23 mg/g for NO3 ions (Table 3).
The essential feature of the Langmuir isotherm can be expressed by means of ‘RL, a dimensionless constant referred to as a separation factor or equilibrium parameter to predict whether an adsorption system is favorable or unfavorable. RL is calculated using Equation (12).
R L = 1 1 + K L C 0
where KL (L.mol−1) is the Langmuir constant, and C0 (mol.L−1) is the highest initial ion concentration.
The calculated values of parameter RL for this study were found to be between 0 and 1 (0.495 for H2PO4, 0.261 for HPO42−, and 0.270 for NO3), indicating that the adsorption of H2PO4, HPO42−, and NO3 ions onto bio-nanocomposite bead particles was favorable (Table 2).

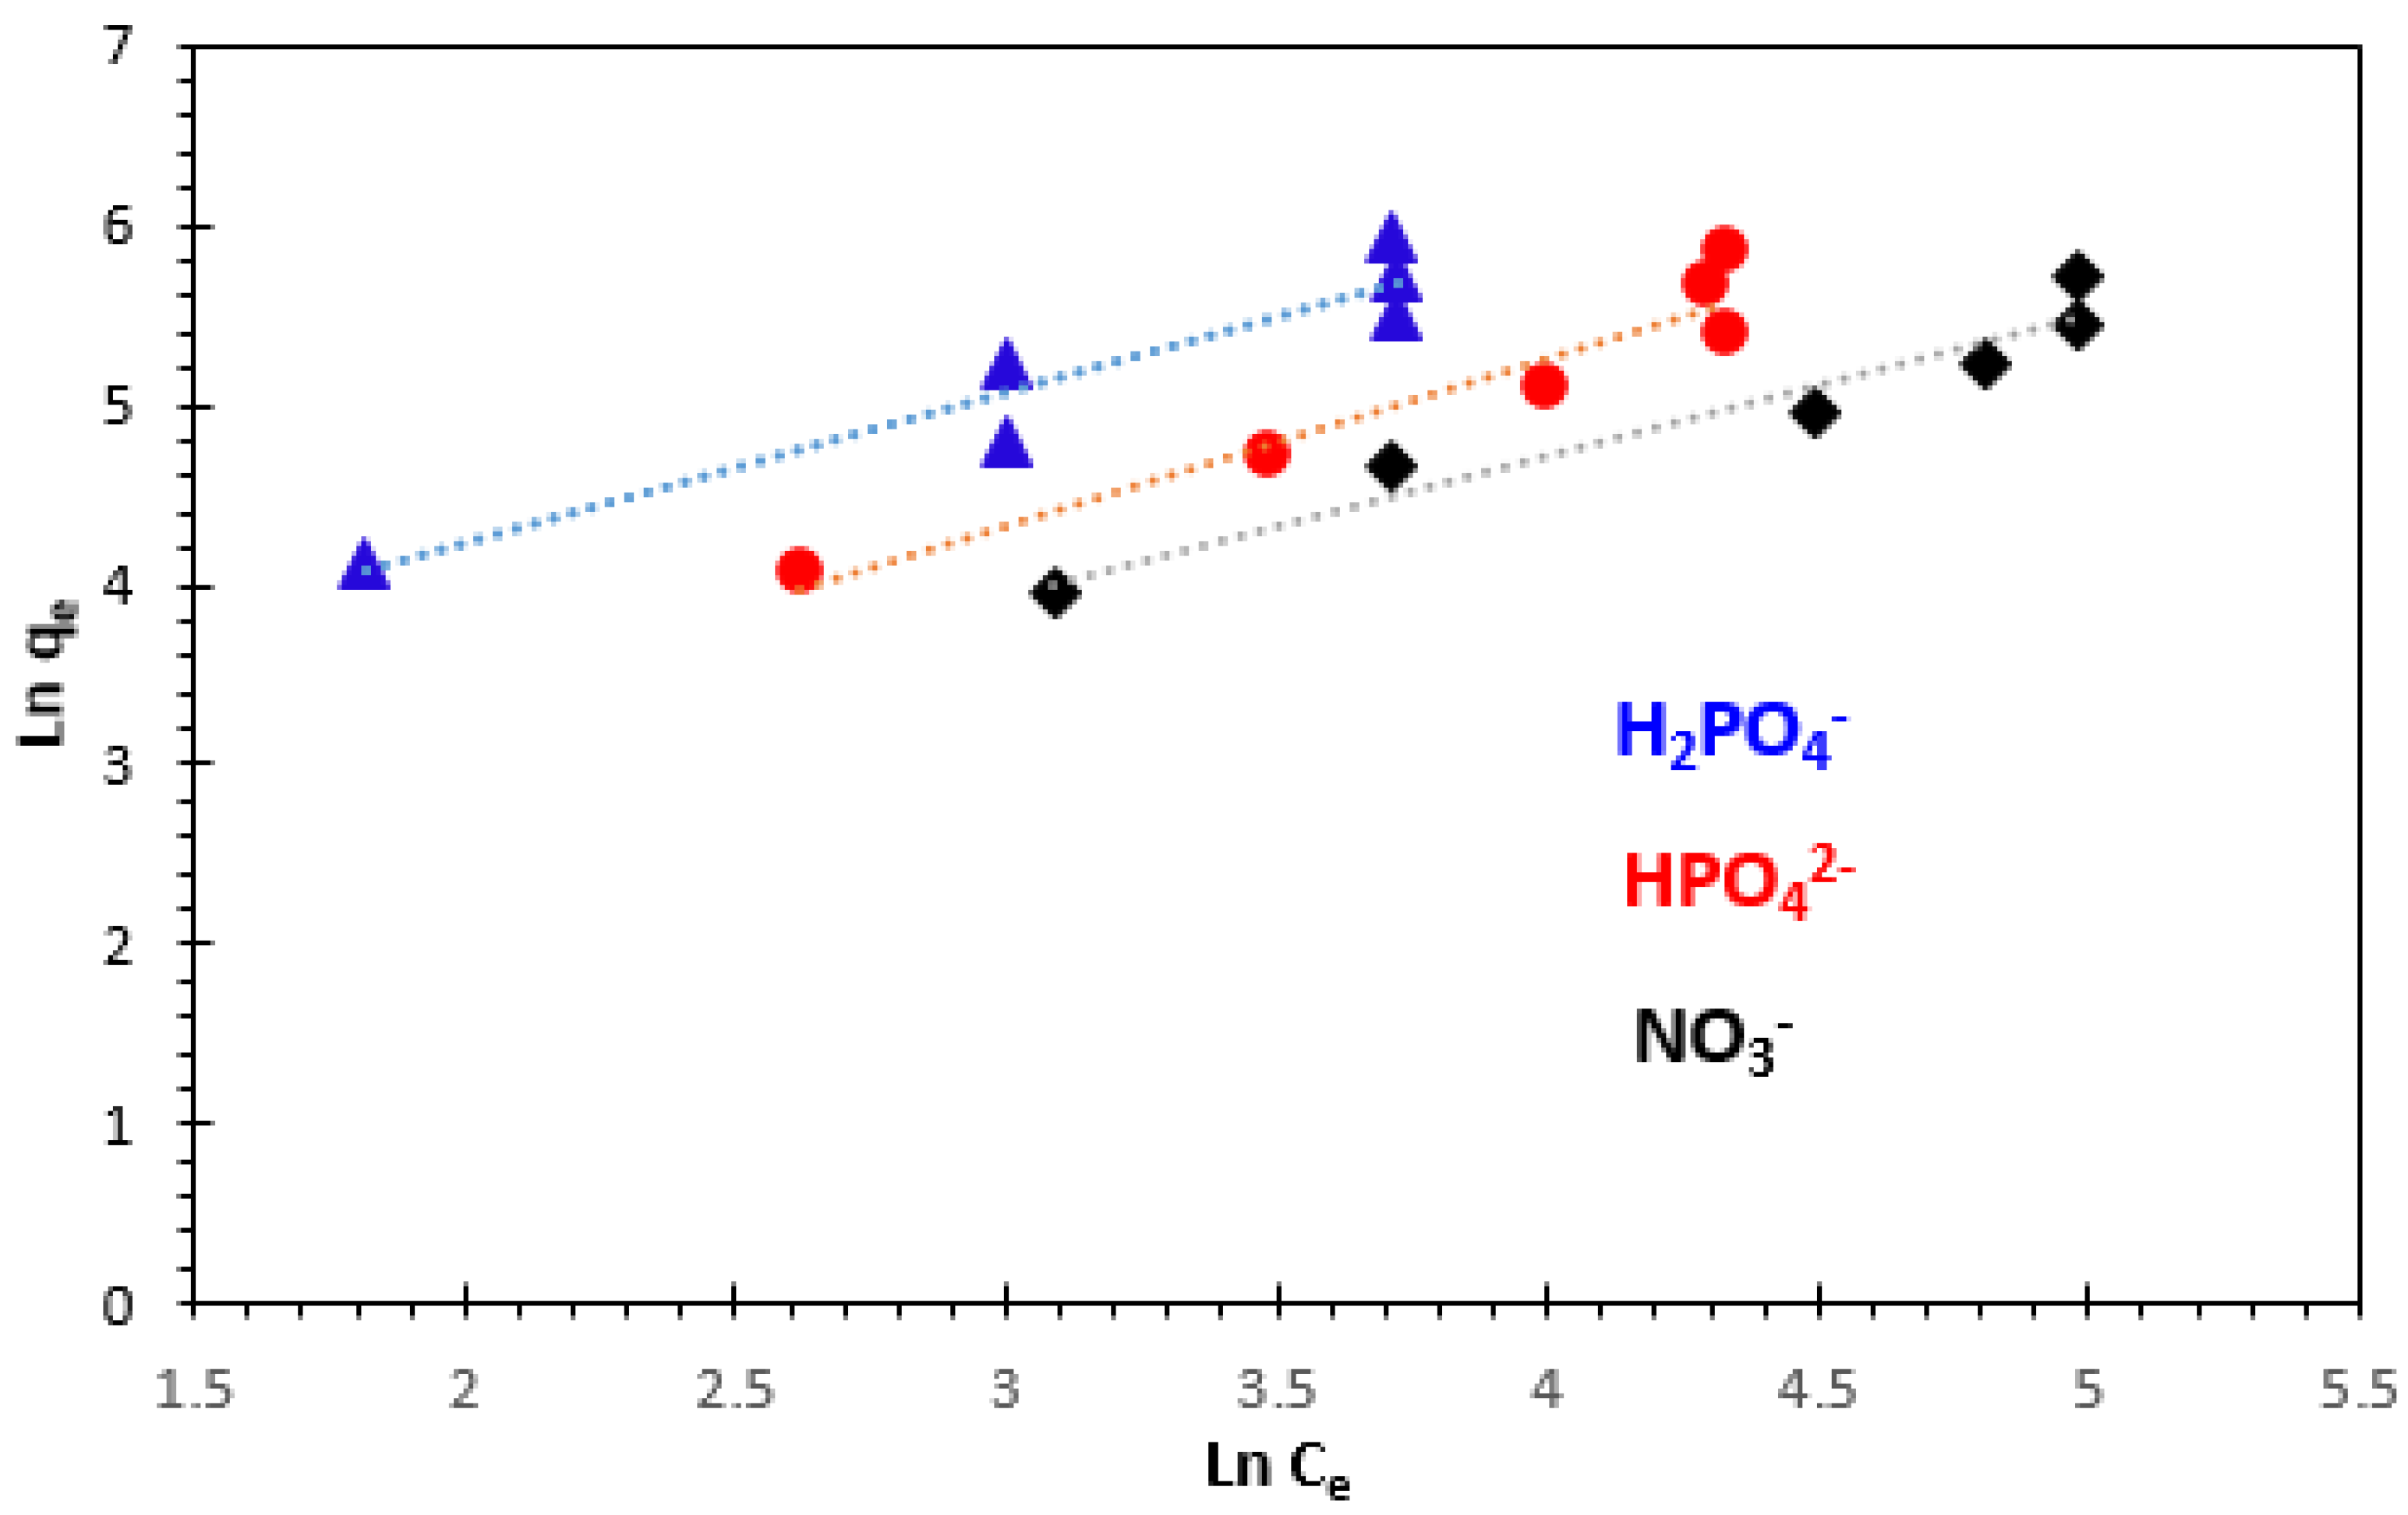
3.4.2. Freundlich Adsorption Isotherm

The Freundlich equation provides the most suitable adsorption data for heterogeneous natural adsorbents. The Freundlich adsorption isotherm equation and its linear form can be written as follows [13,55,56,57]:
q e = K F C e 1 / n                       n o n l i n e a r   f o r m
ln q e = ln K F + 1 n ln C e               l i n e a r   f o r m
where qe (mg/g) is the amount of H2PO4, HPO42−, and NO3 ions adsorbed per unit weight of adsorbent; Ce (mg/L) is the equilibrium concentration of solute in the bulk solution; KF (mg/g) is the Freundlich constant, which is a comparative measure of the adsorption capacity of the adsorbent; and n is an empirical constant related to heterogeneity of the adsorbent surface. The parameter n also indicates the nature of the adsorption process. The value of n lies between 0 and 1 for a favorable adsorption, while n > 1 represents an unfavorable adsorption, and n = 1 represents the linear adsorption, while the adsorption operation is irreversible if n = 0. The isotherm constants n and KF were calculated from the slope and intercept of the plot ln qe versus lnCe (Figure 17). The values for Freundlich constants and correlation coefficients (R2) for both temperatures are also presented in Table 3.
The Freundlich isotherm constants KF and n are constants incorporating all factors which influence the adsorption process such as adsorption capacity and intensity of adsorption. The constants KF and n were calculated from Equation (12). These experiments confirm the efficiency of the bio-nanocomposite used to remove H2PO4, HPO42−, and NO3 ions from aqueous solutions.

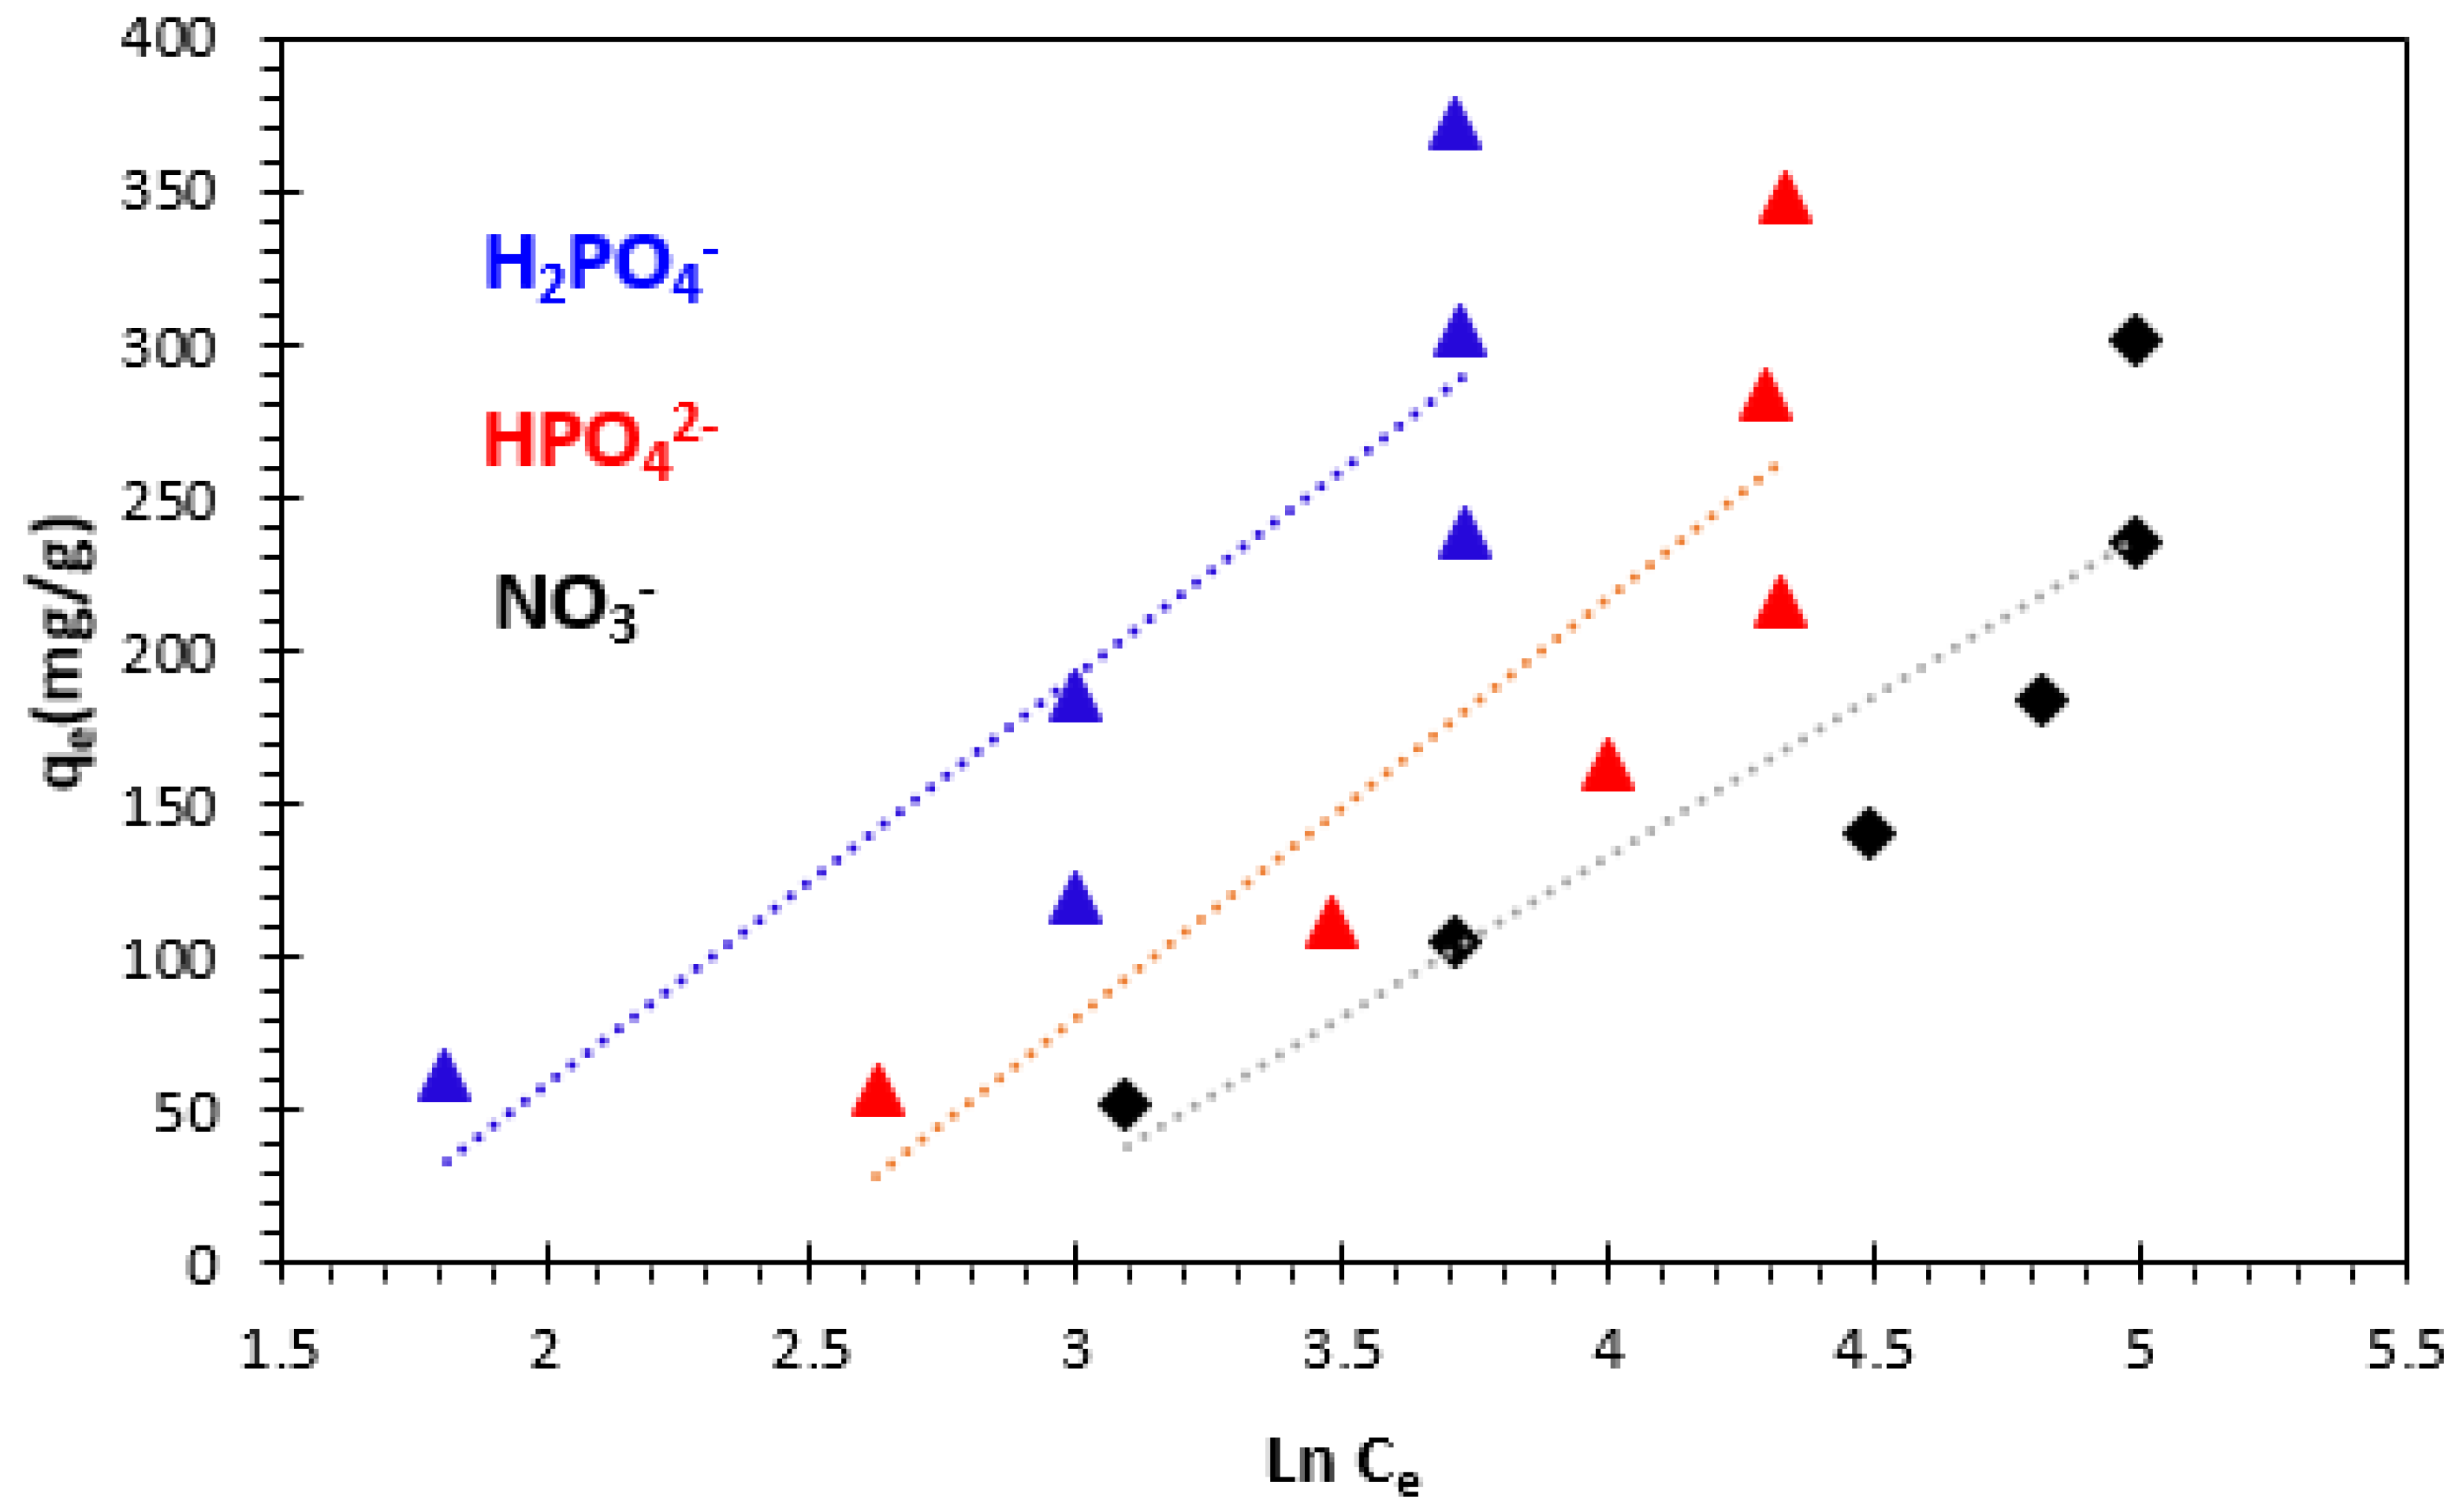
3.4.3. Temkin Isotherm

The Temkin adsorption isotherm model is based on the heat of ion adsorption, which is due to the interactions between the adsorbate and the adsorbent. The Temkin isotherm equation is given as follows [13,55]:
q e = R T b T ln K T C e     n o n l i n e a r   f o r m
q e = R T b T ln K T + R T b T ln C e   l i n e a r   f o r m
where T is absolute temperature in Kelvin, and R the universal gas constant (8.314 J.K−1.mol−1); bT (J.mol−1) is the Temkin isotherm constant related to the heat of adsorption; KT (L.mg−1) is the equilibrium binding constant corresponding to the maximum binding energy. The Temkin isotherm plot is presented in Figure 18, and the isotherm parameters are given in Table 3. The Temkin constants bT related to heat of adsorption of H2PO4, HPO42−, and NO3 ions at 25 °C were found to be 18.509 J.mol−1 for H2PO4, 15.92 J.mol−1 for HPO42−, and 23.73 J.mol−1 for NO3, respectively, at 25 °C (Table 3).
Linear regression of the data points showed rather low R2 values ranging from 0.757 to 0.813, indicating that the adsorption of H2PO4, HPO42−, and NO3 ions did not fully follow the Temkin isotherm.

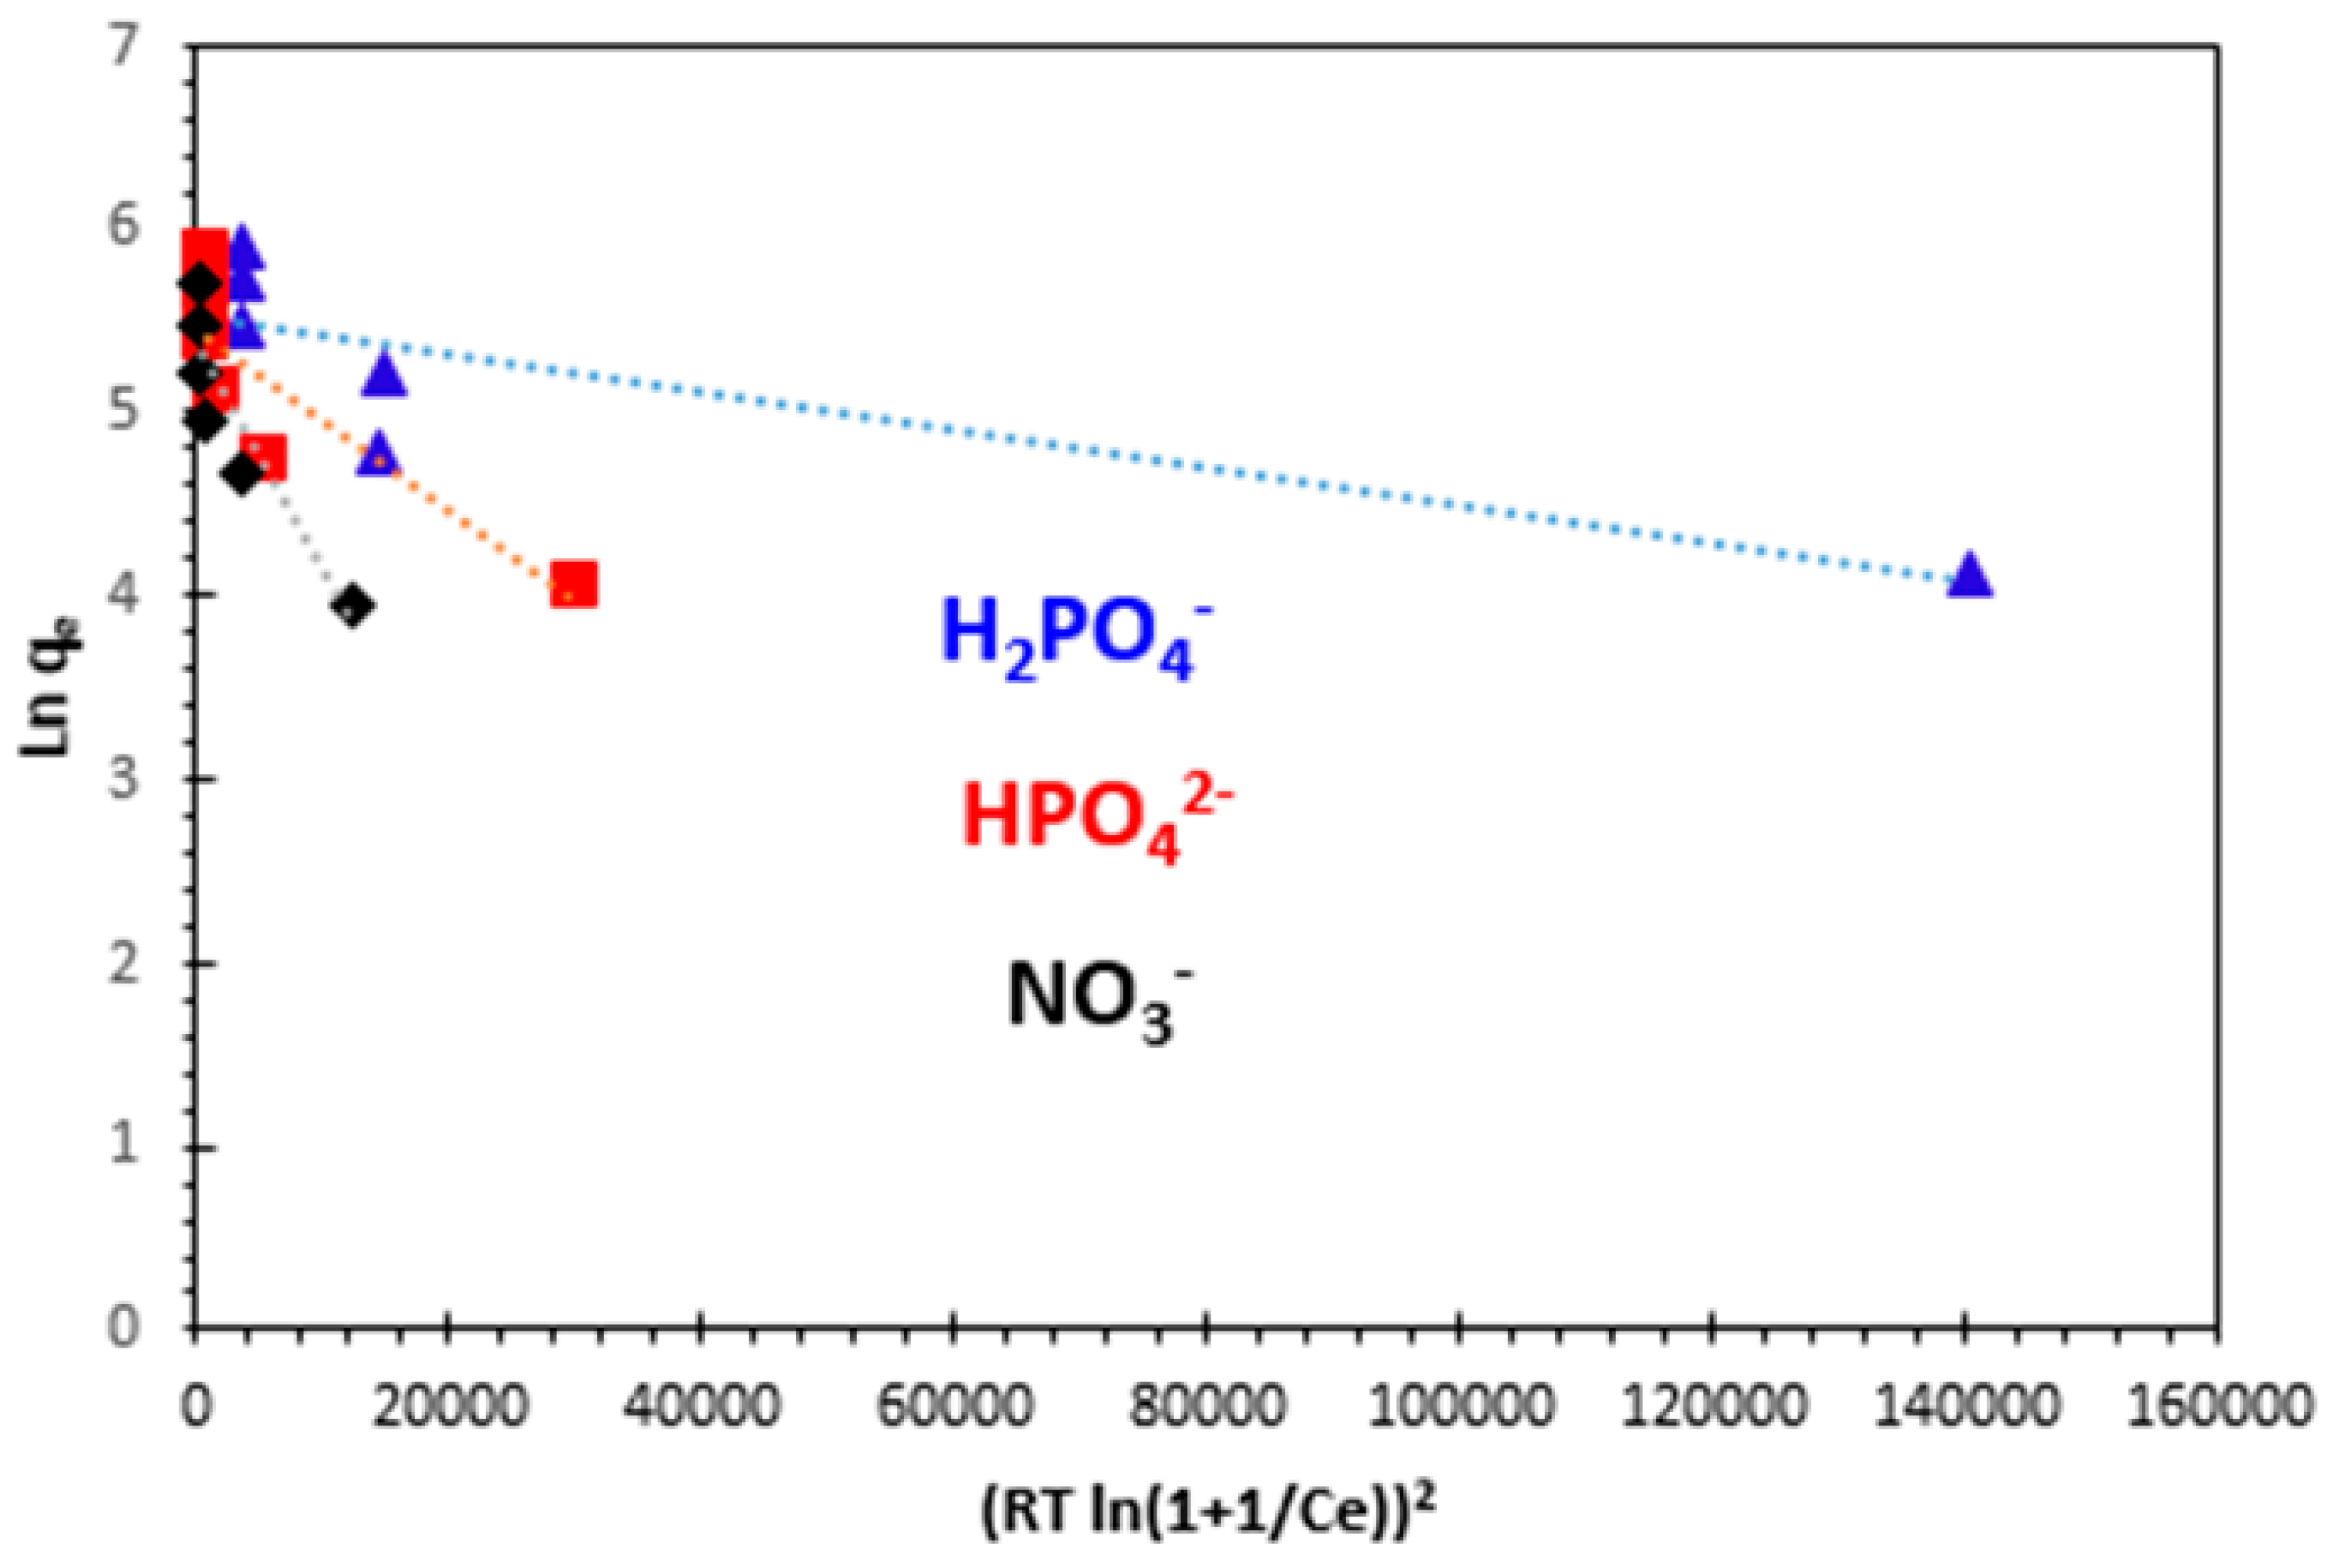
3.4.4. Dubinin–Radushkevich (D–R) Isotherm

Dubinin–Radushkevich isotherm is commonly used to express the adsorption mechanism with a Gaussian energy distribution onto a heterogeneous surface. It is not based on the assumption of a homogeneous surface or constant adsorption potential, but it is applied to estimate the mean free energy of adsorption (E). The non-linear and linear forms of the D–R equation can be written as follows [13]:
q e = q m e K p ε 2     n o n l i n e a r   f o r m
ln q e = ln q m K D ε 2     l i n e a r   f o r m            
where qm (mg/g) is the theoretical saturation capacity, and ε is the Polanyi potential that can be calculated from Equation (19):
ε = R T ln 1 + 1 C e
The constant KD (mol2/J2) gives an idea about the mean free energy E (kJ/mol) of adsorption per molecule of the adsorbate, when it is transferred to the surface of the solid from the bulk solution, and can be calculated from the KD value using the following relation (Equation (20)):
E = 1 2 K D 1 / 2
This parameter gives information on the adsorption mechanism if it is a chemical ion exchange or a physical adsorption. If the value of E is between 8 and 16 kJ/mol, the adsorption process is expected to be chemisorption, while for values of E < 8 kJ/mol, the adsorption process is physical in nature. The results are illustrated in Table 3. The slope of the plot of ln qe versus ε2 gives KD, and the intercept yields the adsorption capacity qm. As can be seen in Figure 19 and Table 3, the correlation coefficient values are 0.717 for H2PO4, 0.747 for HPO42−, and 0.821 for NO3, respectively, at 25 °C. The numerical value of adsorption of the mean free energy is of 223.60 J.mol−1 for H2PO4, 44.72 J.mol−1 for HPO42−, and 70.71 J.mol−1 for NO3 (Table 3), corresponding to a physisorption and the predominance of van der Waals forces.

3.5. Thermodynamic Study

The correlation between temperature and adsorption primarily relies on the specific adsorbent and adsorbate combination, making the determination of thermodynamic parameters crucial for understanding this relationship. In general, adsorption is always accompanied by a thermal effect, which can be either exothermic (ΔH° < 0) or endothermic (ΔH° > 0). The measurement of the heat change (ΔH°) serves as the primary criterion to distinguish between chemisorption and physisorption. Furthermore, assessing the standard Gibbs free energy change (ΔG°) allows us to predict the spontaneity of a process, while the standard entropy change (ΔS°) helps gauge the level of disorder within the adsorbate–adsorbent system [13,14,59,60].
These thermodynamic parameters were calculated from the following equations:
Δ G ° = R T l n K d
l n K d = Δ H ° R T + Δ S ° R
Δ G °   = Δ H ° T Δ S °
where T is the absolute temperature in Kelvin, and R is the universal gas constant (8.314 J/mol/K); Kd (L/mol) is the distribution coefficient. Table 4 presents the results for the thermodynamic parameters. The endothermic and physical nature of the adsorption is suggested by the positive values of ΔH°, which is consistent with experimental findings. The adsorption process is spontaneous, as evidenced by the negative ΔG° values. Positive ΔS° values indicate increased randomness at the solid/liquid interface during adsorption of ion-organic ions onto the engineered bio-nanocomposite.

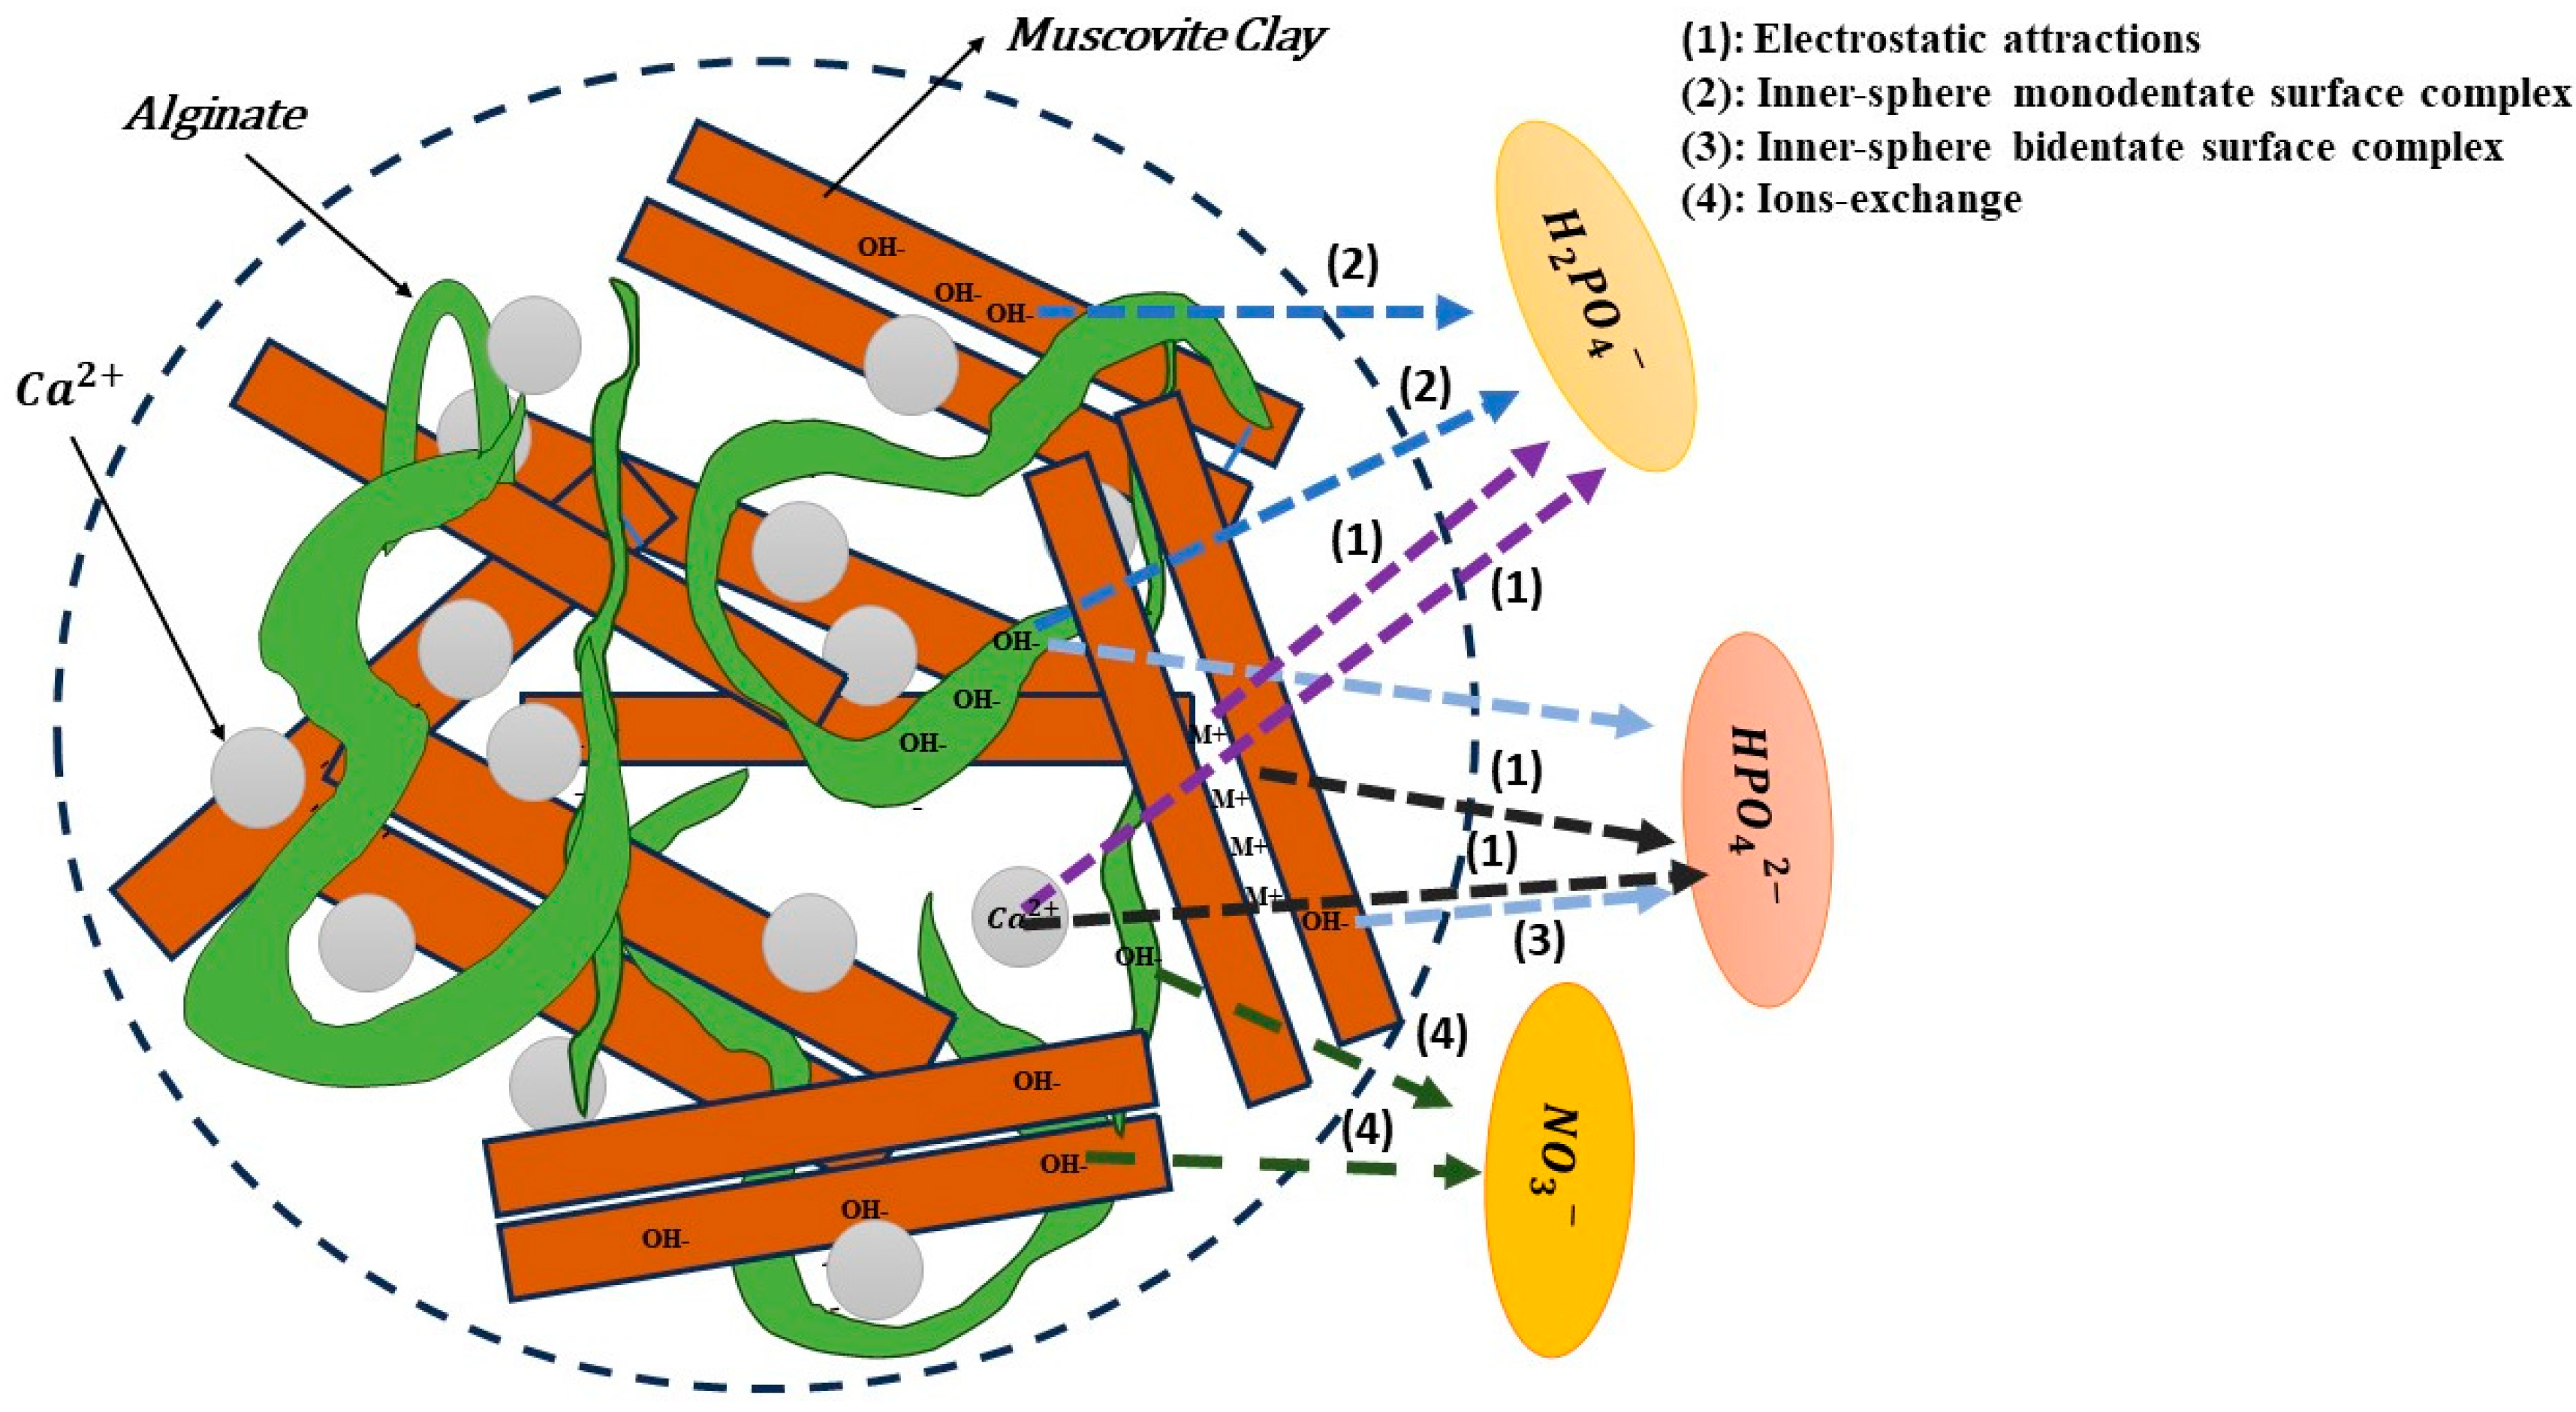
3.6. Adsorption Mechanisms

To enhance the production processes and optimize the practical applications of the bio-composite, it is essential to delve into the mechanisms of H2PO4, HPO42−, and NO3 ion adsorption. The majority of examined bio-composites belong to this category. As illustrated in Figure 20, the essential mechanisms involve electrostatic attractions, monodentate surface complexation within the inner-sphere, bidentate surface complexation within the inner-sphere, and ion exchange. These mechanisms are pivotal for understanding the adsorption of phosphate onto bio-composites [61]. Electrostatic attraction is almost always a necessary step between the anionic functions of negatively charged H2PO4, HPO42−, and NO3 ions and the protonated sites of the bio-nanocomposite surface. This observation is logical because cations contribute specifically Ca2+ and Al3+ [31]. The existence of inner-sphere surface complexes (M–O–P) indicates an interaction between phosphate ions and the bio-nanocomposite. This inference is drawn from observing that the surface hydroxyl groups (M–OH) of bio-nanocomposite could potentially undergo exchange with the adsorbed phosphate ions [62]. As the pH decreases below 7.5 (Figure 9), it is expected that surface complexes undergo protonation, causing a further asymmetry reduction in the phosphate adsorption complexes; at pH < 7.5, the complexes are likely to be protonated, bidentate binuclear complexes. There is a transformation of non-protonated bidentate binuclear complexes at pH > 6 into monoprotonated bidentate binuclear surface complexes as the pH decreases from 4 to 6, as suggested by Yuji and Sparks (2001) [63]. Exchangeable anions, such as chloride ions and OH ions, can adsorb nitrate through electrostatic forces of attraction, subsequently leading to ion exchange among exchangeable anions. Quaternized sites in the adsorbent frequently play a role in the anion-exchange mechanism, as illustrated in Figure 20. Additionally, nitrate can readily exchange with the interlayer OH ion of metal hydroxide [64].

3.7. Comparison with Published Data

In order to situate our adsorbent among those used to remove inorganic pollutants from aqueous solutions, the maximum experimental adsorption capacity of alginate–Moroccan clay bio-nanocomposite adsorbent was compared to the maximum uptakes (qm, mg/g) of other adsorbents reported in the literature.
The adsorption of inorganic pollutants on different adsorbents reported in the literature is presented in Table 5. The qm of this study was found to be comparable with those of other adsorbents. The results indicated that alginate–Moroccan clay adsorbent has a great potential to be used in the treatment of inorganic-pollutant-contaminated wastewater.

4. Conclusions

This research delved into the equilibrium and adsorption dynamics of H2PO4, HPO42−, and NO3 ions from aqueous solutions, employing the batch equilibration technique. The adsorption process was found to be significantly influenced by some environmental factors such as solution pH, contact time, and temperature. To study the kinetics of H2PO4, HPO42−, and NO3 ion adsorption on bio-composite beads, four kinetic models were applied. The pseudo-second-order model exhibited the most accurate correlation with the data in all cases, and the experimental values of qe,exp matched well with the theorical values. The pseudo-second-order kinetic model showed an excellent fit to the adsorption behavior of H2PO4, HPO42−, and NO3 ions on bio-nanocomposite beads at various initial ion concentrations. For the mathematical description of the adsorption equilibrium, the Langmuir, Freundlich, Temkin, and Dubinin–Radushkevich (D–R) adsorption models were studied. Among these models, the Langmuir adsorption isotherm best described the experimental data. The endothermic and physical nature of the adsorption is suggested by the positive values of ΔH°, which is consistent with experimental findings. The adsorption process is spontaneous, as evidenced by the negative ΔG° values. The positive ΔS° values indicate increased randomness at the solid/liquid interface during adsorption of ion-organic ions onto the engineered bio-nanocomposite. The obtained results showed that alginate-based bio-nanocomposites have a highly significant adsorption ability for the removal of H2PO4, HPO42−, and NO3 ions in aqueous settings, which is scientifically verified.

Author Contributions

Conceptualization, R.A. and D.S.S.; methodology, R.A. and D.S.S.; software, A.A.; validation, R.A., A.A., A.-M.C. and M.C.; formal analysis, R.A. and A.-M.C.; investigation, M.C.; resources, D.S.S.; data curation, A.-M.C.; writing—original draft preparation, R.A.; writing—review and editing, R.A. and D.S.S.; visualization, R.A., A.A. and M.C.; supervision, D.S.S. and A.-M.C.; project administration, D.S.S.; funding acquisition, D.S.S. All authors have read and agreed to the published version of the manuscript.

Funding

Association of Francophone Universities, AUF, for the «EUGEN IONESCU» BOURSE, 2022–2023. National University of Science and Technology Politehnica of Bucharest, Faculty of Chemical Engineering and Biotechnologies, for technical and scientifical support.

Institutional Review Board Statement

Not applicable.

Informed Consent Statement

Not applicable.

Data Availability Statement

Data are contained within the article.

Conflicts of Interest

The authors declare no conflict of interest.

References

  1. Hosni, K.; Ben Moussa, S.; Ben Amor, M.B. Conditions influencing the removal of phosphate from synthetic wastewater: Influence of the ionic composition. Desalination 2007, 206, 279–285. [Google Scholar] [CrossRef]
  2. Dévoyé, A.M.; Olayinka, K.; Olukomaiya, O.O.; Iwuchukwu, P.O. The removal of phosphates from laundry wastewater using alum and ferrous sulphate as coagulants. Int. J. Innov. Sci. Res. 2014, 8, 256–260. [Google Scholar]
  3. Usman, M.O.; Aturagaba, G.; Ntale, M.; Nyakairu, G.W. A review of adsorption techniques for removal of phosphates from wastewater. Water Sci. Technol. 2022, 86, 3113. [Google Scholar] [CrossRef]
  4. Owodunni, A.A.; Ismail, S.; Kurniawan, S.B.; Ahmad, A.; Imron, M.F.; Abdullah, S.R.S. A review on revolutionary technique for phosphate removal in wastewater using green coagulant. J. Water Process Eng. 2023, 52, 103573. [Google Scholar] [CrossRef]
  5. Rashid, M.; Price, N.T.; Pinilla, M.Á.G.; O’Shea, K.E. Effective removal of phosphate from aqueous solution using humic acid coated magnetite nanoparticles. Water Res. 2017, 123, 353–360. [Google Scholar] [CrossRef]
  6. Almanassra, I.W.; Kochkodan, V.; Mckay, G.; Atieh, M.A.; Al-Ansari, T. Review of phosphate removal from water by carbonaceous sorbents. J. Environ. Manag. 2021, 287, 112245. [Google Scholar] [CrossRef]
  7. Ownby, M.; Desrosiers, D.A.; Vaneeckhaute, C. Phosphorus removal and recovery from wastewater via hybrid ion exchange nanotechnology: A study on sustainable regeneration chemistries. npj Clean Water 2021, 4, 6. [Google Scholar] [CrossRef]
  8. Chiban, M.; Soudani, A.; Sinan, F.; Tahrouch, S.; Persin, M. Characterization and application of dried plants to remove heavy metals, nitrate, and phosphate ions from industrial wastewaters. CLEAN Soil Air Water 2011, 39, 376–383. [Google Scholar] [CrossRef]
  9. Abidar, F.; Morghi, M.; Abali, M.; Sinan, F.; Chiban, M.; Eddaoudi, H.; Zebret, M. Orthophosphate ion adsorption onto raw shrimp shells. Rev. Sci. l’eau 2016, 29, 197–211. [Google Scholar] [CrossRef]
  10. Öztürk, N.; Bektaş, T.E. Nitrate removal from aqueous solution by adsorption onto various materials. J. Hazard. Mater. 2004, 112, 155–162. [Google Scholar] [CrossRef]
  11. Barber, W.P.; Stuckey, D.C. Nitrogen removal in a modified anaerobic baffled reactor (ABR): 1, denitrification. Water Res. 2000, 34, 2413–2422. [Google Scholar] [CrossRef]
  12. Eltaweil, A.S.; Omer, A.M.; El-Aqapa, H.G.; Gaber, N.M.; Attia, N.F.; El-Subruiti, G.M.; Mohy-Eldin, M.S.; El-Monaem, E.M.A. Chitosan based adsorbents for the removal of phosphate and nitrate: A critical review. Carbohydr. Polym. 2021, 274, 118671. [Google Scholar] [CrossRef] [PubMed]
  13. Aziam, R.; Chiban, M.; Eddaoudi, H.; Soudani, A.; Zerbet, M.; Sinan, F. Kinetic modeling, equilibrium isotherm and thermodynamic studies on a batch adsorption of anionic dye onto eco-friendly dried Carpobrotus edulis plant. Eur. Phys. J. Spec. Top. 2017, 226, 977–992. [Google Scholar] [CrossRef]
  14. Aziam, R.; Chiban, M.; Eddaoudi, H.E.; Soudani, A.; Zerbet, M.; Sinan, F. Factors controlling the adsorption of acid blue 113 dye from aqueous solution by dried C. edulis plant as natural adsorbent. Arab. J. Geosci. 2016, 9, 659. [Google Scholar] [CrossRef]
  15. Klein, K.; Mandel, A.; Lilleoja, H.; Salmar, S.; Tenno, T. Assessment of enhanced biological phosphorus removal process inhibition. SN Appl. Sci. 2020, 2, 1489. [Google Scholar] [CrossRef]
  16. Bektaş, T.E.; Uğurluoğlu, B.K.; Tan, B. Phosphate removal by Ion exchange in batch mode. Water Pract. Technol. 2021, 16, 1343–1354. [Google Scholar] [CrossRef]
  17. Rajaniemi, K.; Hu, T.; Nurmesniemi, E.-T.; Tuomikoski, S.; Lassi, U. Phosphate and ammonium removal from water through electrochemical and chemical precipitation of struvite. Processes 2021, 9, 150. [Google Scholar] [CrossRef]
  18. Vikrant, K.; Kim, K.-H.; Ok, Y.S.; Tsang, D.C.; Tsang, Y.F.; Giri, B.S.; Singh, R.S. Engineered/designer biochar for the removal of phosphate in water and wastewater. Sci. Total Environ. 2018, 616, 1242–1260. [Google Scholar] [CrossRef]
  19. Sun, J.; Gao, A.; Wang, X.; Xu, X.; Song, J. Removal of phosphorus from wastewater by different morphological alumina. Molecules 2020, 25, 3092. [Google Scholar] [CrossRef] [PubMed]
  20. Mekonnen, D.T.; Alemayehu, E.; Lennartz, B. Fixed-bed column technique for the removal of phosphate from water using leftover coal. Materials 2021, 14, 5466. [Google Scholar] [CrossRef] [PubMed]
  21. Mohammadi, E.; Daraei, H.; Ghanbari, R.; Athar, S.D.; Zandsalimi, Y.; Ziaee, A.; Maleki, A.; Yetilmezsoy, K. Synthesis of carboxylated chitosan modified with ferromagnetic nanoparticles for adsorptive removal of fluoride, nitrate, and phosphate anions from aqueous solutions. J. Mol. Liq. 2019, 273, 116–124. [Google Scholar] [CrossRef]
  22. Barshad, I. Adsorptive and Swelling properties of clay-water system. Clays Clay Miner. 1952, 1, 70–77. [Google Scholar] [CrossRef]
  23. Amakrane, J.; El Hammouti, K.; Azdimousa, A.; El Halim, M.; El Ouahabi, M.; Lamouri, B.; Fagel, N. Mineralogical and physicochemical characterization of the Jbel Rhassoul clay deposit (Moulouya Plain, Morocco). J. Mater. Environ. Sci. 2018, 9, 2549–2557. [Google Scholar]
  24. Kevadiya, B.D.; Patel, H.A.; Joshi, G.V.; Abdi, S.H.R.; Bajaj, H.C. Montmorillonite-alginate composites as a drug delivery system: Intercalation and in vitro release of diclofenac sodium. Indian J. Pharm. Sci. 2010, 72, 732–737. [Google Scholar] [CrossRef] [PubMed]
  25. Ayouch, I.; Barrak, I.; Kassab, Z.; El Achaby, M.; Barhoun, A.; Draoui, K. Improved recovery of cadmium from aqueous medium by alginate composite beads filled by bentonite and phosphate washing sludge. Colloids Surfaces A Physicochem. Eng. Asp. 2020, 604, 125305. [Google Scholar] [CrossRef]
  26. Zahakifar, F.; Keshtkar, A.R.; Talebi, M. Performance evaluation of sodium alginate/polyvinyl alcohol/polyethylene oxide/ZSM5 zeolite hybrid adsorbent for ion uptake from aqueous solutions: A case study of thorium (IV). J. Radioanal. Nucl. Chem. 2020, 327, 65–72. [Google Scholar] [CrossRef]
  27. Zia, F.; Salman, M.; Ali, M.; Iqbal, R.; Rasul, A.; Najam-ul-Haq, M.; Asgher, M.; Zia, K.M. Alginate-based bionanocomposites. Bionanocomposites 2020, 173–205. [Google Scholar] [CrossRef]
  28. Zhao, J.; Dang, Z.; Muddassir, M.; Raza, S.; Zhong, A.; Wang, X.; Jin, J. A new Cd(II)-based coordination polymer for efficient photocatalytic removal of organic dyes. Molecules 2023, 28, 6848. [Google Scholar] [CrossRef]
  29. Barrak, I.; Ayouch, I.; Kassab, Z.; El Achaby, M.; Barhoun, A.; Draoui, K. Sodium alginate encapsulated Moroccan clay as eco-friendly and efficient adsorbent for copper ions from aqueous medium. Mater. Today Proc. 2022, 51, 2040–2046. [Google Scholar] [CrossRef]
  30. Wang, L.; Sun, W.; Hu, Y.-H.; Xu, L.-H. Adsorption mechanism of mixed anionic/cationic collectors in Muscovite—Quartz flotation system. Miner. Eng. 2014, 64, 44–50. [Google Scholar] [CrossRef]
  31. Aboussabek, A.; Aziam, R.; El Qdhy, S.; Boukarma, L.; Zerbet, M.; Sinan, F.; Chiban, M. Synthesis and characterization of hybrid clay@ Fe3O4 for acid blue113 sequestration using a fixed-bed adsorption column. Int. J. Environ. Sci. Technol. 2023. [Google Scholar] [CrossRef]
  32. Kausar, A.; Rehman, S.U.; Khalid, F.; Bonilla-Petriciolet, A.; Mendoza-Castillo, D.I.; Bhatti, H.N.; Ibrahim, S.M.; Iqbal, M. Cellulose, clay and sodium alginate composites for the removal of methylene blue dye: Experimental and DFT studies. Int. J. Biol. Macromol. 2022, 209, 576–585. [Google Scholar] [CrossRef] [PubMed]
  33. Banerjee, S.; Chattopadhyaya, M.C. Adsorption characteristics for the removal of a toxic dye, tartrazine from aqueous solutions by a low cost agricultural by-product. Arab. J. Chem. 2017, 10, S1629–S1638. [Google Scholar] [CrossRef]
  34. Chang, M.; Ma, X.; Fan, Y.; Dong, X.; Chen, R.; Zhu, B. Adsorption of different valence metal cations on kaolinite: Results from experiments and molecular dynamics simulations. Colloids Surfaces A Physicochem. Eng. Asp. 2023, 656, 130330. [Google Scholar] [CrossRef]
  35. Belachew, N.; Bekele, G. Synergy of magnetite intercalated bentonite for enhanced adsorption of congo red dye. Silicon 2020, 12, 603–612. [Google Scholar] [CrossRef]
  36. Bao, T.; Damtie, M.M.; Hosseinzadeh, A.; Frost, R.L.; Yu, Z.M.; Jin, J.; Wu, K. Catalytic degradation of P-chlorophenol by muscovite-supported nano zero valent iron composite: Synthesis, characterization, and mechanism studies. Appl. Clay Sci. 2020, 195, 105735. [Google Scholar] [CrossRef]
  37. Nouaa, S.; Aziam, R.; Benhiti, R.; Carja, G.; Iaich, S.; Zerbet, M.; Chiban, M. Synthesis of LDH/alginate composite beads as a potential adsorbent for phosphate removal: Kinetic and equilibrium studies. Chem. Pap. 2023, 77, 6689–6705. [Google Scholar] [CrossRef]
  38. Li, B.; Yin, H. Superior adsorption property of a novel green biosorbent yttrium/alginate gel beads for dyes from aqueous solution. J. Polym. Environ. 2020, 28, 2137–2148. [Google Scholar] [CrossRef]
  39. Ullah, A.; Zahoor, M.; Din, W.U.; Muhammad, M.; Khan, F.A.; Sohail, A.; Ullah, R.; Ali, E.A.; Murthy, H.C.A. Removal of methylene blue from aqueous solution using black tea wastes: Used as efficient adsorbent. Adsorpt. Sci. Technol. 2022, 2022, 5713077. [Google Scholar] [CrossRef]
  40. Hameed, K.S.; Muthirulan, P.; Sundaram, M.M. Adsorption of chromotrope dye onto activated carbons obtained from the seeds of various plants: Equilibrium and kinetics studies. Arab. J. Chem. 2017, 10, S2225–S2233. [Google Scholar] [CrossRef]
  41. Amrhar, O.; Berisha, A.; El Gana, L.; Nassali, H.; Elyoubi, M.S. Removal of methylene blue dye by adsorption onto Natural Muscovite Clay: Experimental, theoretical and computational investigation. Int. J. Environ. Anal. Chem. 2023, 103, 2419–2444. [Google Scholar] [CrossRef]
  42. Stefan, D.S.; Meghea, I. Mechanism of simultaneous removal of Ca2+, Ni2+, Pb2+ and Al3+ ions from aqueous solutions using Purolite® S930 ion exchange resin. Comptes Rendus Chim. 2014, 17, 496–502. [Google Scholar] [CrossRef]
  43. Zhang, X.; Lin, X.; He, Y.; Chen, Y.; Zhou, J.; Luo, X. Adsorption of phosphorus from slaughterhouse wastewater by carboxymethyl konjac glucomannan loaded with lanthanum. Int. J. Biol. Macromol. 2018, 119, 105–115. [Google Scholar] [CrossRef] [PubMed]
  44. Trinh, V.T.; Pham, T.T.H.; Van, H.T.; Trinh, M.V.; Thang, P.Q.; Vu, X.H.; Nguyen, V.Q.; Dang, T.T. Phosphorus removal from aqueous solution by adsorption using silver nanoparticles: Batch experiment. J. Hazard. Toxic Radioact. Waste 2020, 24, 04020038. [Google Scholar] [CrossRef]
  45. Chiban, M.; Zerbet, M.; Sinan, F. Low-cost materials for phosphate removal from aqueous solutions. In Phosphates: Sources, Properties and Applications; Nova Science Publishers Inc.: New York, NY, USA, 2012; pp. 1–43. [Google Scholar]
  46. Mandal, S.; Calderon, J.; Marpu, S.B.; Omary, M.A.; Shi, S.Q. Mesoporous activated carbon as a green adsorbent for the removal of heavy metals and Congo red: Characterization, adsorption kinetics, and isotherm studies. J. Contam. Hydrol. 2021, 243, 103869. [Google Scholar] [CrossRef]
  47. Morghi, M.; Abidar, F.; Soudani, A.; Zerbet, M.; Chiban, M.; Kabli, H.; Sinan, F. Removal of nitrate ions from aqueous solution using chitin as natural adsorbent. Int. J. Res. Environ. Stud. 2015, 2, 8–20. [Google Scholar]
  48. Elemile, O.O.; Akpor, B.O.; Ibitogbe, E.M.; Afolabi, Y.T.; Ajani, D.O. Adsorption isotherm and kinetics for the removal of nitrate from wastewater using chicken feather fiber. Cogent Eng. 2022, 9, 2043227. [Google Scholar] [CrossRef]
  49. Abidar, F.; Morghi, M.; Ait Ichou, A.; Soudani, A.; Chiban, M.; Sinan, F.; Zerbet, M. Removal of orthophosphate ions from aqueous solution using chitin as natural adsorbent. Desalination Water Treat. 2016, 57, 14739–14749. [Google Scholar] [CrossRef]
  50. Akram, M.; Xu, X.; Gao, B.; Wang, S.; Khan, R.; Yue, Q.; Duan, P.; Dan, H.; Pan, J. Highly efficient removal of phosphate from aqueous media by pomegranate peel co-doping with ferric chloride and lanthanum hydroxide nanoparticles. J. Clean. Prod. 2021, 292, 125311. [Google Scholar] [CrossRef]
  51. Sabzehmeidani, M.M.; Mahnaee, S.; Ghaedi, M.; Heidari, H.; Roy, V.A.L. Carbon based materials: A review of adsorbents for inorganic and organic compounds. Mater. Adv. 2021, 2, 598–627. [Google Scholar] [CrossRef]
  52. Photiou, P.; Koutsokeras, L.; Constantinides, G.; Koutinas, M.; Vyrides, I. Phosphate removal from synthetic and real wastewater using thermally treated seagrass residues of Posidonia oceanica. J. Clean. Prod. 2021, 278, 123294. [Google Scholar] [CrossRef]
  53. Wang, A.; Zhou, K.; Liu, X.; Liu, F.; Zhang, C.; Chen, Q. Granular tri-metal oxide adsorbent for fluoride uptake: Adsorption kinetic and equilibrium studies. J. Colloid Interface Sci. 2017, 505, 947–955. [Google Scholar] [CrossRef]
  54. Wu, C.; Li, L.; Zhou, H.; Ai, J.; Zhang, H.; Tao, J.; Wang, D.; Zhang, W. Effects of chemical modification on physicochemical properties and adsorption behavior of sludge-based activated carbon. J. Environ. Sci. 2021, 100, 340–352. [Google Scholar] [CrossRef]
  55. Kalam, S.; Abu-Khamsin, S.A.; Kamal, M.S.; Patil, S. Surfactant adsorption isotherms: A review. ACS Omega 2021, 6, 32342–32348. [Google Scholar] [CrossRef]
  56. Ahmadou, F.; Abahdou, F.Z.; Slimani, R.; El Hajjaji, S. Methylen blue removal by adsorption on Moringa oleifera pods powder and Moringa oleifera kernels powder: Kinetic, isotherm and thermodynamic studies. Moroc. J. Chem. 2023, 11, 11-1. [Google Scholar]
  57. Elsherif, K.M.; El-Dali, A.; Ewlad-Ahmed, A.M.; Treban, A.A.; Alqadhi, H.; Alkarewi, S. Kinetics and isotherms studies of safranin adsorption onto two surfaces prepared from orange peels. Moroc. J. Chem. 2022, 10, 10-4. [Google Scholar]
  58. Nguyen, V.T.; Nguyen, T.A.; Tran, T.H.; Le, T.N.; Nguyen, N.H. Batch and column adsorption of reactive dye by eggshell powder–chitosan gel core-shell material. Moroc. J. Chem. 2021, 9, 9-1. [Google Scholar]
  59. Gunasekar, V.; Ponnusami, V. Kinetics, equilibrium, and thermodynamic studies on adsorption of methylene blue by carbonized plant leaf powder. J. Chem. 2012, 2013, 415280. [Google Scholar] [CrossRef]
  60. Farch, S.; Yahoum, M.M.; Toumi, S.; Tahraoui, H.; Lefnaoui, S.; Kebir, M.; Zamouche, M.; Amrane, A.; Zhang, J.; Hadadi, A.; et al. Application of Walnut Shell Biowaste as an Inexpensive Adsorbent for Methylene Blue Dye: Isotherms, Kinetics, Thermodynamics, and Modeling. Separations 2023, 10, 60. [Google Scholar] [CrossRef]
  61. Kończak, M.; Huber, M. Application of the engineered sewage sludge-derived biochar to minimize water eutrophication by removal of ammonium and phosphate ions from water. J. Clean. Prod. 2022, 331, 129994. [Google Scholar] [CrossRef]
  62. Benhiti, R.; Ait Ichou, A.; Zaghloul, A.; Aziam, R.; Carja, G.; Zerbet, M.; Sinan, F.; Chiban, M. Synthesis, characterization, and comparative study of MgAl-LDHs prepared by standard coprecipitation and urea hydrolysis methods for phosphate removal. Environ. Sci. Pollut. Res. 2020, 27, 45767–45774. [Google Scholar] [CrossRef] [PubMed]
  63. Liu, Y.; Zhang, X.; Wang, J. A critical review of various adsorbents for selective removal of nitrate from water: Structure, performance and mechanism. Chemosphere 2022, 291, 132728. [Google Scholar] [CrossRef] [PubMed]
  64. Arai, Y.; Sparks, D. ATR–FTIR spectroscopic investigation on phosphate adsorption mechanisms at the ferrihydrite–Water interface. J. Colloid Interface Sci. 2001, 241, 317–326. [Google Scholar] [CrossRef]
  65. Chiban, M.; Soudani, A.; Sinan, F.; Persin, M. Single, binary and multi-component adsorption of some anions and heavy metals on environmentally friendly Carpobrotus edulis plant. Colloids Surfaces B Biointerfaces 2022, 82, 267–276. [Google Scholar] [CrossRef] [PubMed]
Figure 1. Formation of alginate–clay beads.
Polymers 15 04666 g001
Figure 2. X-ray diffraction of the natural clay (MUS) and alginate–clay bio-nanocomposite (ALG/MUS).
Polymers 15 04666 g002
Figure 3. pH at the point of zero charge (pHZPC) of the alginate–clay bio–nanocomposite.
Polymers 15 04666 g003
Figure 4. SEM images of clay microparticles (Muscovite) with magnification scale between 10,000 and 200, and scale bar between 10 µm and 500 µm. (A) SEM images for clay with magnification scale 10,000 and scale bar 10 µm. (B) SEM images for clay with magnification scale 5000 and scale bar 30 µm. (C) SEM images for clay with magnification scale 2000 and scale bar 50 µm. (D) SEM images for clay with magnification scale 500 and scale bar 300 µm. (E) SEM images for clay with magnification scale 200 and scale bar 500 µm. (F) SEM images for clay with magnification scale 200 and scale bar 500 µm.
Polymers 15 04666 g004aPolymers 15 04666 g004b
Figure 5. SEM images of alginate–clay bio-nanocomposite microparticles with magnification scale between 5000 and 100, and scale bar between 1 µm and 30 µm. (A) SEM images of alginate–clay bio-nanocomposite microparticles with magnification scale 200 and scale bar 500 µm. (B) SEM images of alginate–clay bio-nanocomposite microparticles with magnification scale 100 and scale bar 1 µm. (C) SEM images of alginate–clay bio-nanocomposite microparticles with magnification scale 5000 and scale bar 30 µm. (D) SEM images of alginate–clay bio-nanocomposite microparticles with magnification scale 5000 and scale bar 30 µm.
Polymers 15 04666 g005aPolymers 15 04666 g005b
Figure 6. Fourier-transform infrared spectroscopy (FTIR) spectrum: (a) natural clay; (b) alginate–clay bio-nanocomposite.
Polymers 15 04666 g006
Figure 7. Effect of adsorbent dose on the removal of H2PO4, HPO42−, and NO3 ions: C0 = 100 mg/L, T = 23 ± 2 °C, and Tc = 12 h.
Polymers 15 04666 g007
Figure 8. Effect of contact time on the removal of H2PO4, HPO42−, and NO3 ions onto bio-nanocomposite beads: m/V = 1.2 g/L and T = 23 °C.
Polymers 15 04666 g008
Figure 9. Effect of pH on the distribution of orthophosphate ions in solution.
Polymers 15 04666 g009
Figure 10. Effect of initial pH on adsorption of H2PO4, HPO42−, and NO3 ions: C0 = 100 mg/L, m/V = 1.2 g/L, and T = 23 ± 2 °C.
Polymers 15 04666 g010
Figure 11. Effect of temperature on adsorption of H2PO4, HPO42−, and NO3 ions by bio-nanocomposite beads: C0 = 100 mg/L and m/V = 1.2 g/L.
Polymers 15 04666 g011
Figure 12. Pseudo-first-order adsorption kinetics on adsorption of H2PO4, HPO42−, and NO3 ions by bio-nanocomposite beads.
Polymers 15 04666 g012
Figure 13. Pseudo-second-order kinetic model of H2PO4, HPO42−, and NO3 ion adsorption.
Polymers 15 04666 g013
Figure 14. Elovich kinetic model of H2PO4, HPO42−, and NO3 ion adsorption.
Polymers 15 04666 g014
Figure 15. Intra-particle diffusion kinetics model of H2PO4, HPO42−, and NO3 ion adsorption.
Polymers 15 04666 g015
Figure 16. Langmuir adsorption isotherm of H2PO4, HPO42−, and NO3 ions at 25 °C.
Polymers 15 04666 g016
Figure 17. Freundlich adsorption isotherm of H2PO4, HPO42−, and NO3 ions at 25 °C.
Polymers 15 04666 g017
Figure 18. Temkin adsorption isotherm of H2PO4, HPO42−, and NO3 ions at 25 °C.
Polymers 15 04666 g018
Figure 19. Dubinin−Radushkevich (D–R) adsorption isotherm of H2PO4, HPO42−, and NO3 ions at 25 °C.
Polymers 15 04666 g019
Figure 20. Adsorption mechanisms of for H2PO4, HPO42−, and NO3 ions on alginate–clay bio-nanocomposite.
Polymers 15 04666 g020
Table 1. Parameters of four kinetic models for H2PO4, HPO42−, and NO3 ion adsorption.
Kinetics ModelParametersPhosphate IonsNitrate Ions
H2PO4HPO42−NO3
Pseudo-first-order modelqe,exp (mg.g−1)62.3757.3051.85
K1 (min−1)0.01040.01780.0101
qe,cal (mg.g−1)6.8539.0798.584
R20.9160.8880.771
Pseudo-second-order modelqe,exp (mg.g−1)62.3757.3051.85
K2 (g.mg−1min−1)0.00300.00113.7 × 10−4
qe,the (mg.g−1)58.13954.6452.63
R20.9990.9980.986
Elovich modelqe,exp (mg.g−1)62.3757.3051.85
α91.4618.0550.06
β0.2460.1280.090
R20.7460.7370.794
Intra-particle diffusion KInt (mg.g−1min−1/2)0.5371.0271.488
CI46.7831.9916.94
R20.5680.5540.630
Table 2. Isotherm type for various RL values.
IonsOrthophosphatesNitrates
H2PO4HPO42−NO3
RL0.4950.2610.270
Table 3. Parameters of isotherm models for H2PO4, HPO42−, and NO3 ion adsorption.
ModelParametersOrthophosphate IonsNitrate Ions
H2PO4HPO42−NO3
LangmuirqL (mg/g)625909.09588.23
KL (L/mg)0.0170.00470.0045
R20.9400.9750.970
Freundlich1/n0.8350.9330.782
KF (mg·g−1)13.064.634.89
R20.8990.9250.937
TemkinKT (L.mg–1)0.2100.0900.065
bT (J.mol–1)18.50915.9223.73
R20.7570.7430.813
D–RKD (mol2J–1)10−55 × 10−50.0001
qm (mg·g−1)249.011235.003209.013
E (J.mol−1)223.6044.7270.71
R20.7170.7470.821
Table 4. Thermodynamic parameters for H2PO4, HPO42−, and NO3 ion adsorption.
IonΔG° (kJ/mol)ΔH° (kJ/mol)ΔS° (J/K/mol)
25 °C30 °C35 °C40 °C
H2PO4−17.089−18.436−20.140−25.038134.603506.40
HPO42−−14.85−16.167−17.178−18.23151.692223.45
NO3−12.359−14.138−16.938−21.291161.32581.45
Table 5. Comparison of maximum uptakes ( q m , mg/g) of various adsorbents to remove inorganic pollutants.
AdsorbentAnionsqm (mg/g)Reference
Raw shrimp shellsHPO42−92[9]
H2PO4133[9]
ChitinNO3200[47]
H2PO4336[49]
HPO42−110[49]
C. edulis plantH2PO426.1[65]
NO3141.1[65]
LDH/alginate compositePhosphate400[27]
Alginate–Moroccan clay bio-nanocompositeH2PO4625This study
HPO42−909.09
NO3588.23
Disclaimer/Publisher’s Note: The statements, opinions and data contained in all publications are solely those of the individual author(s) and contributor(s) and not of MDPI and/or the editor(s). MDPI and/or the editor(s) disclaim responsibility for any injury to people or property resulting from any ideas, methods, instructions or products referred to in the content.

