


Heat and Moisture Transfer Depending on 3D-Printed Thermoplastic Polyurethane and Ethylene-Vinyl Acetate Foam and the Presence of Holes for 3D Printing Clothing Development

Abstract
1. Introduction
2. Materials and Methods
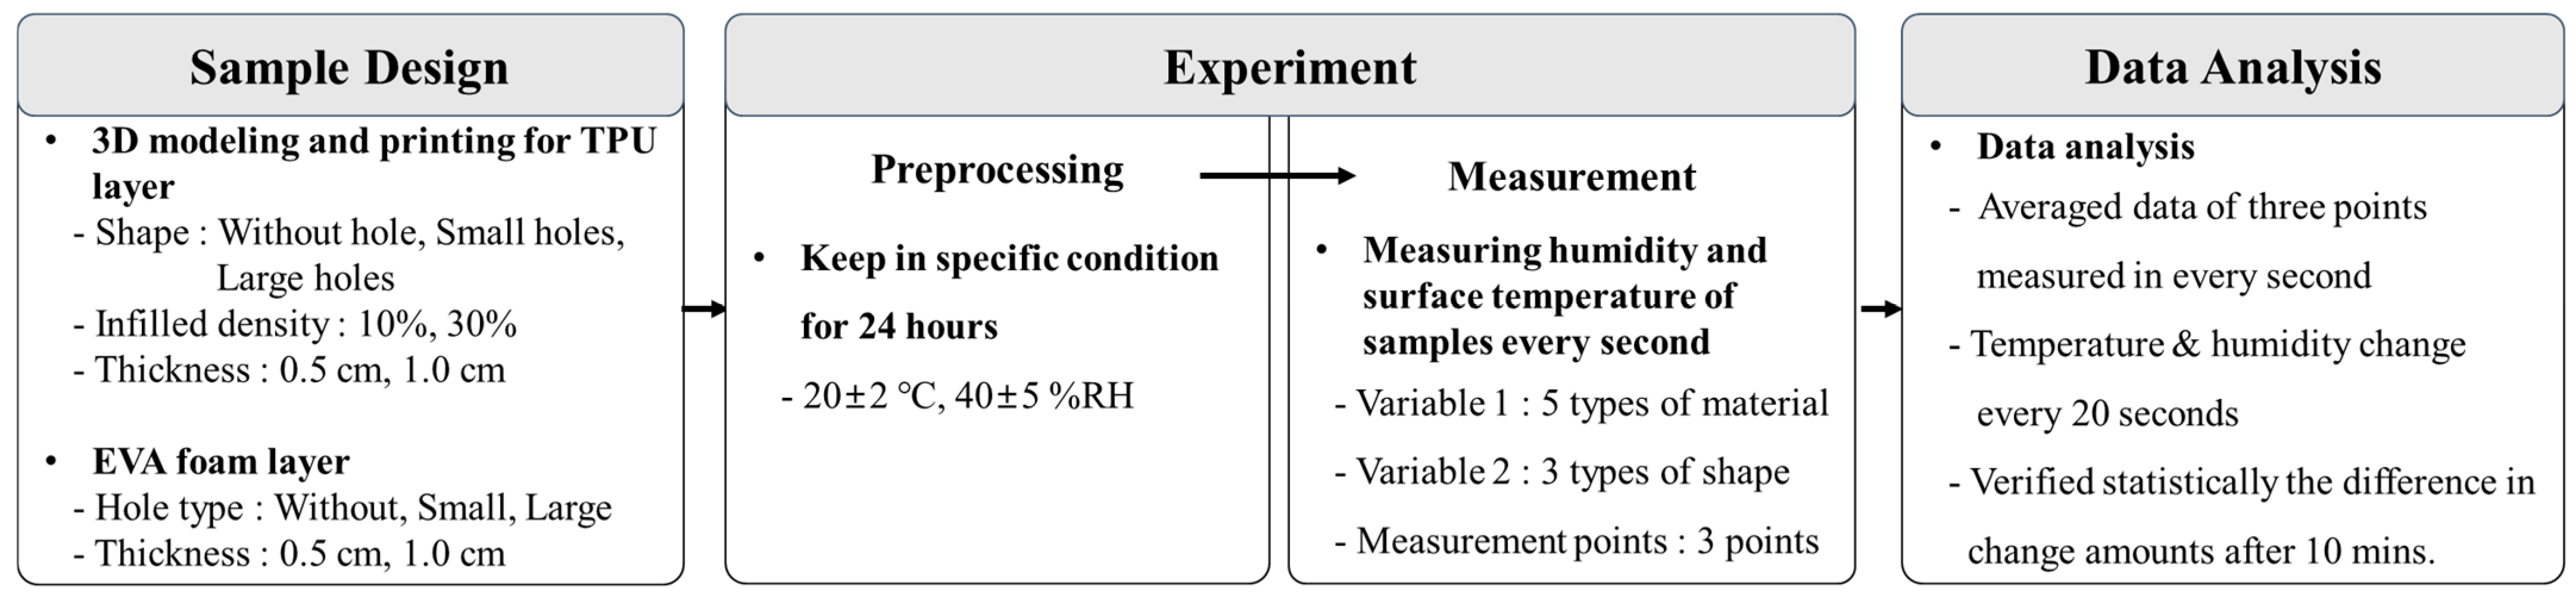
2.1. Experimental Variables and Samples
2.2. Experimental Equipment and Methods
3. Results
3.1. Heat and Humidity Transfer Based on Hole Size
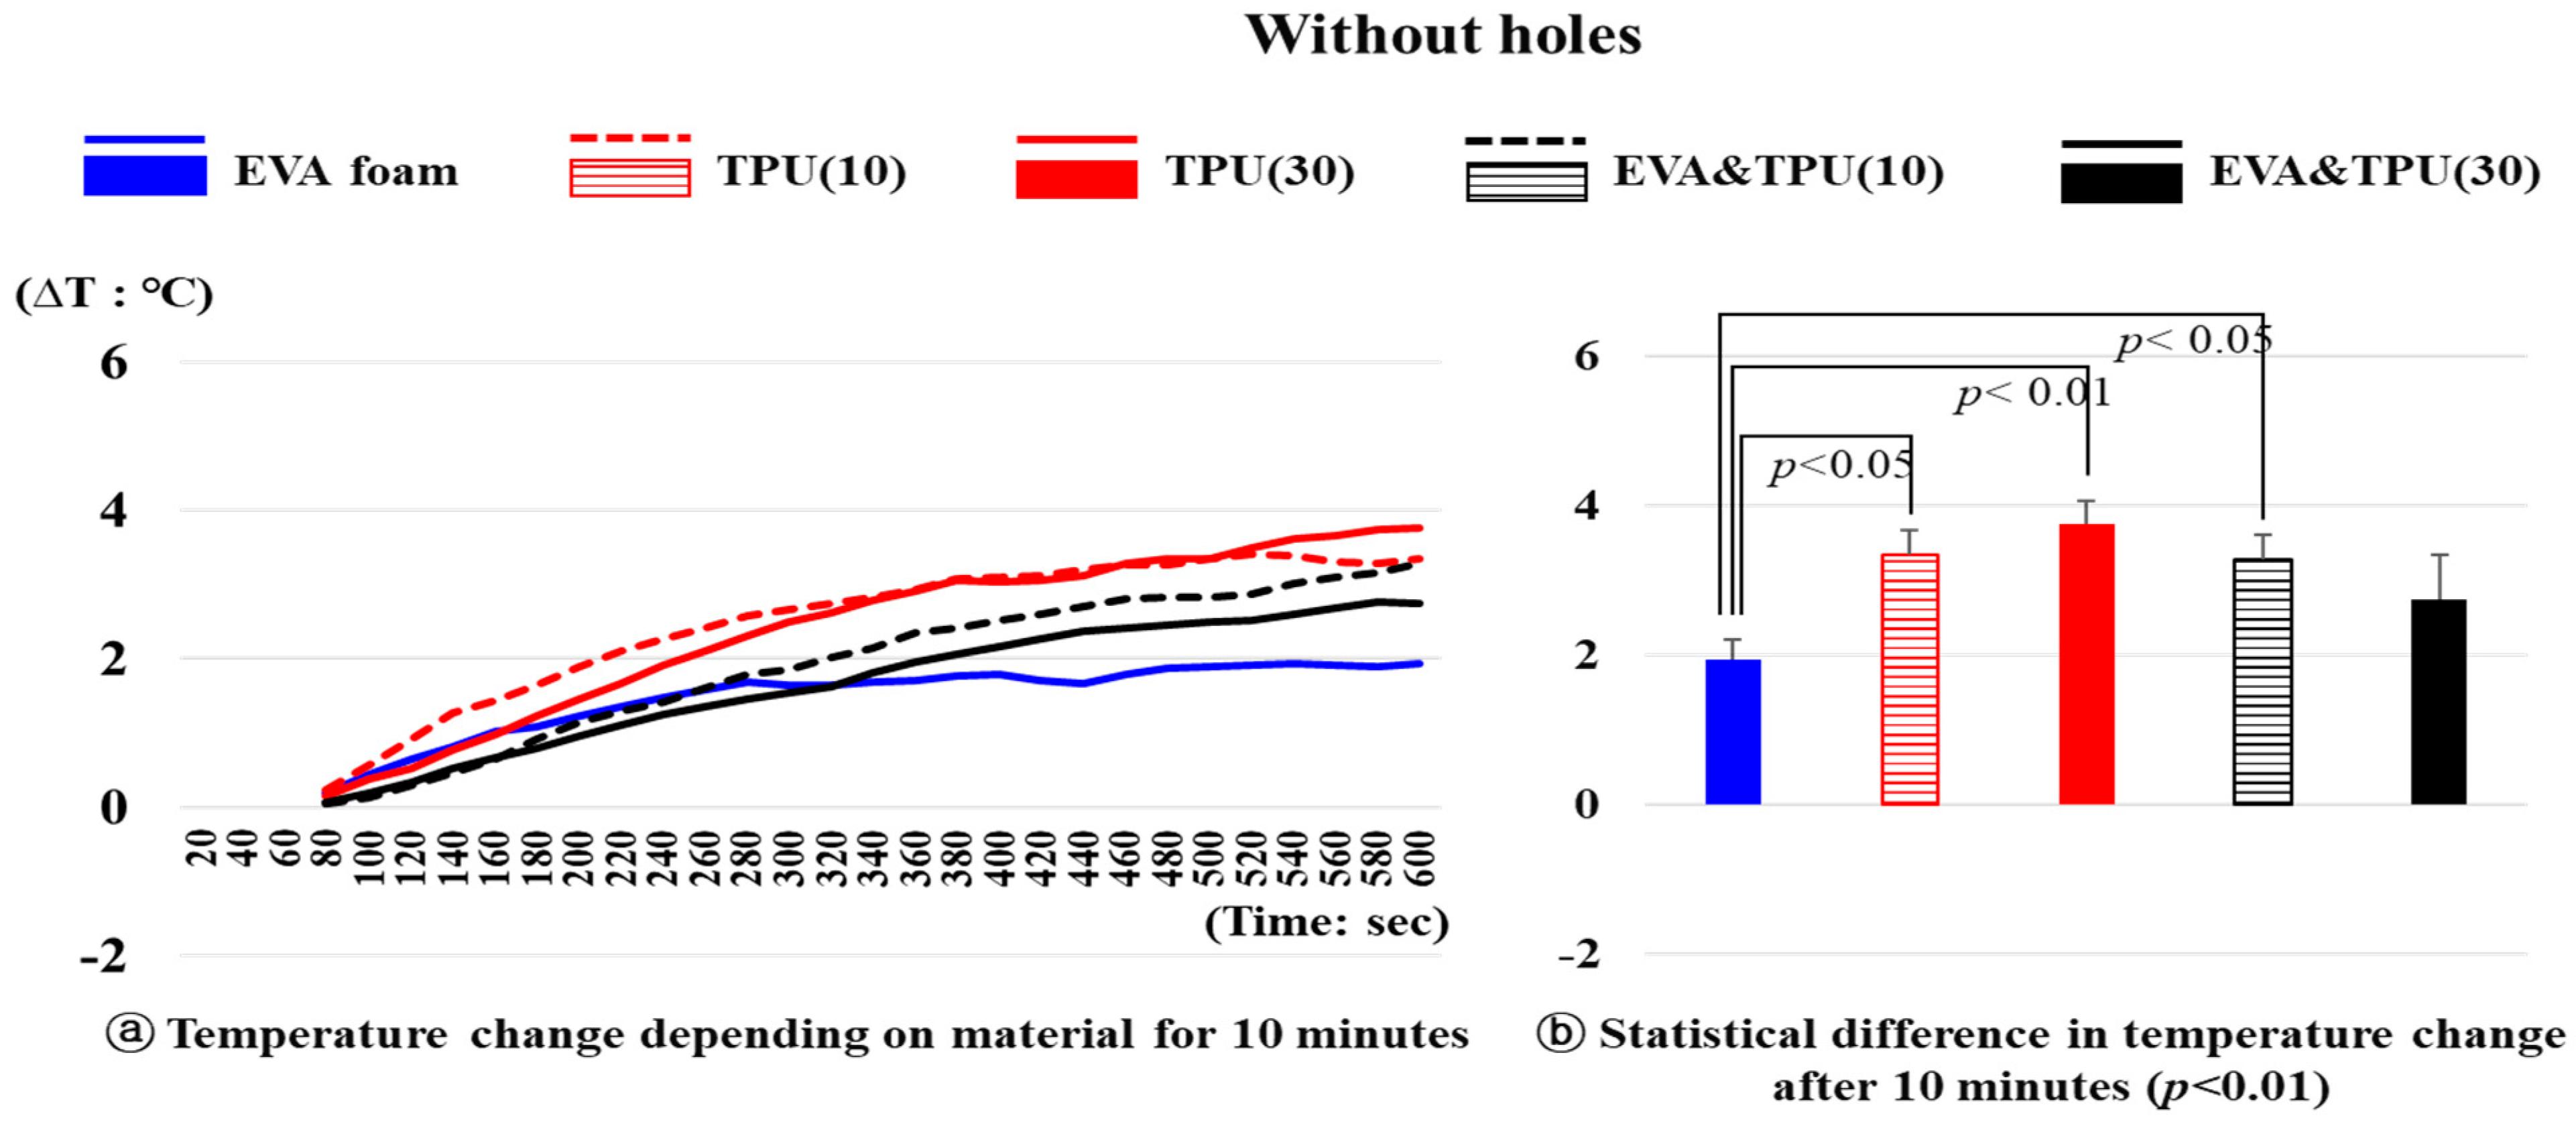
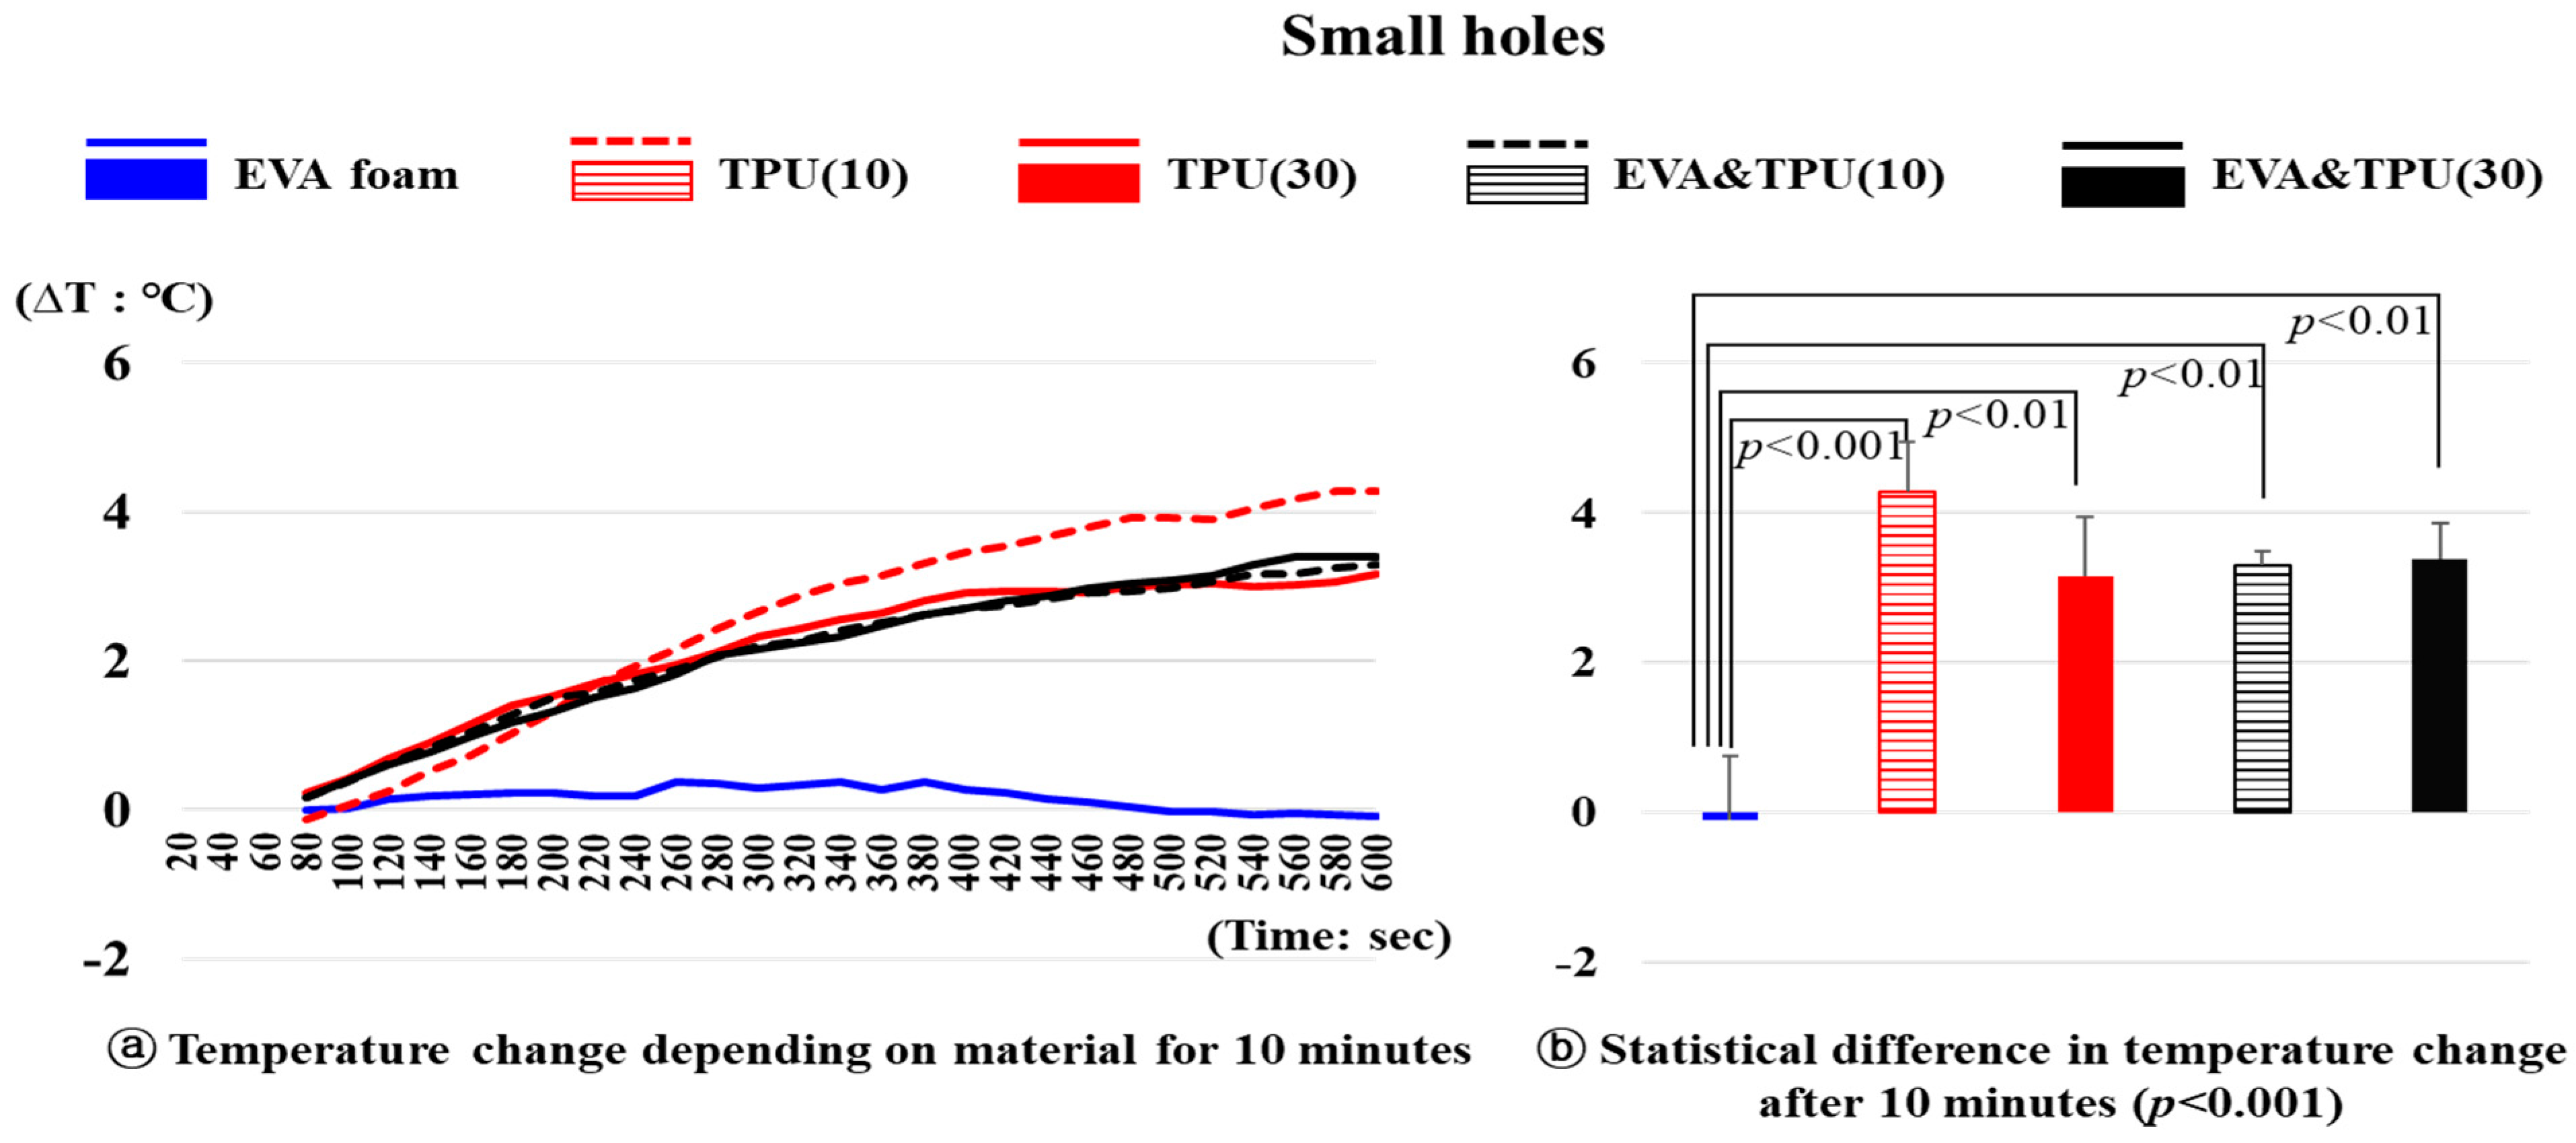
3.2. Temperature Change Depending on the Materials
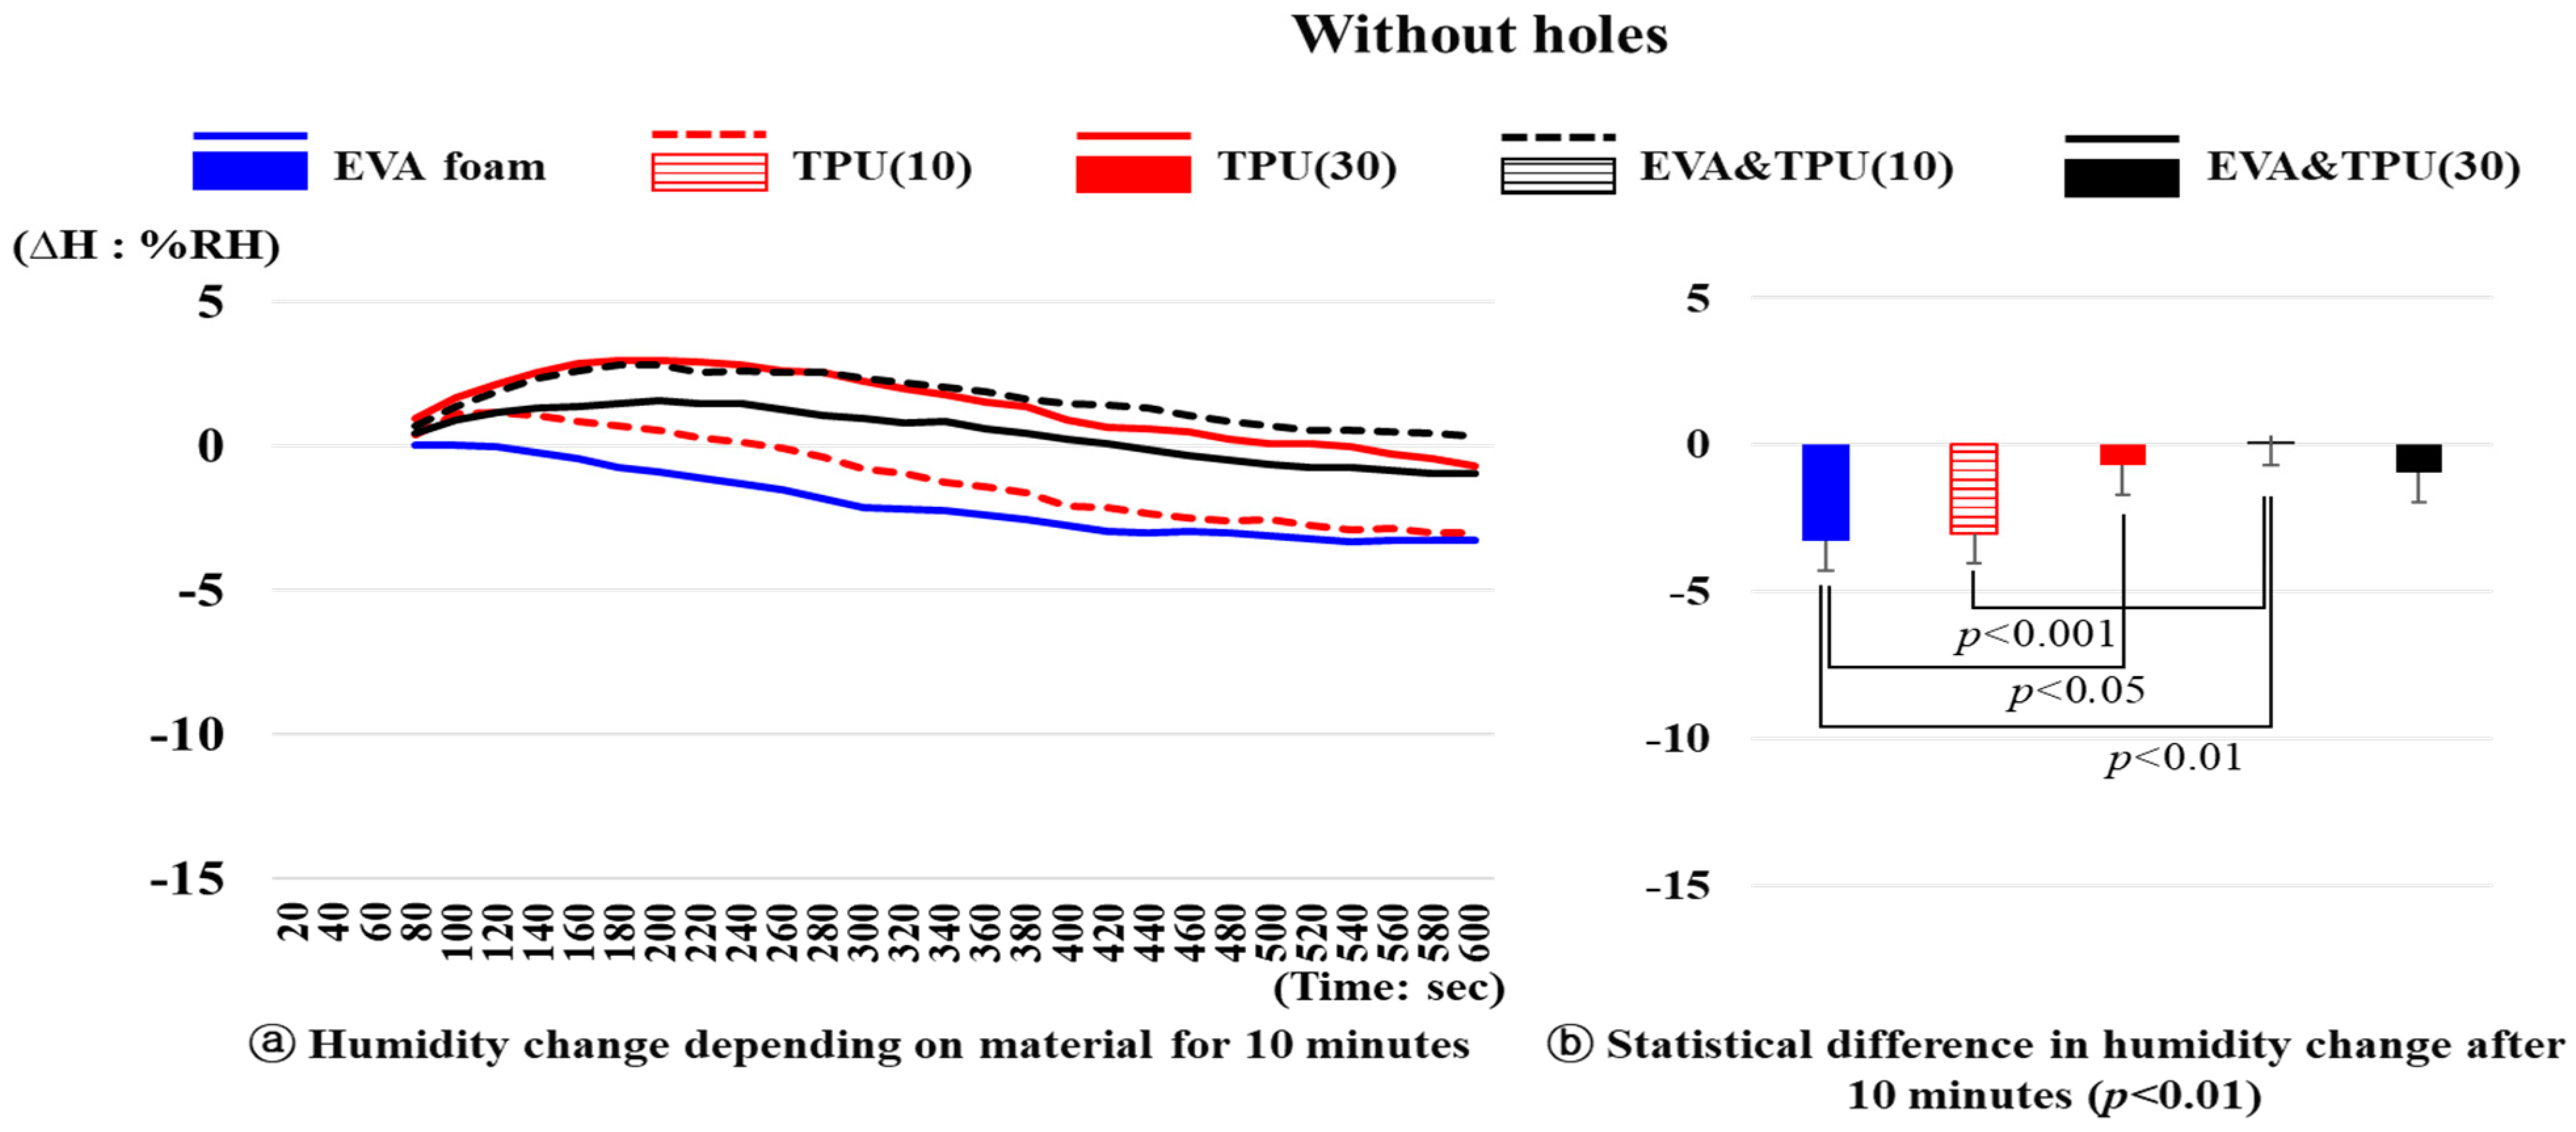
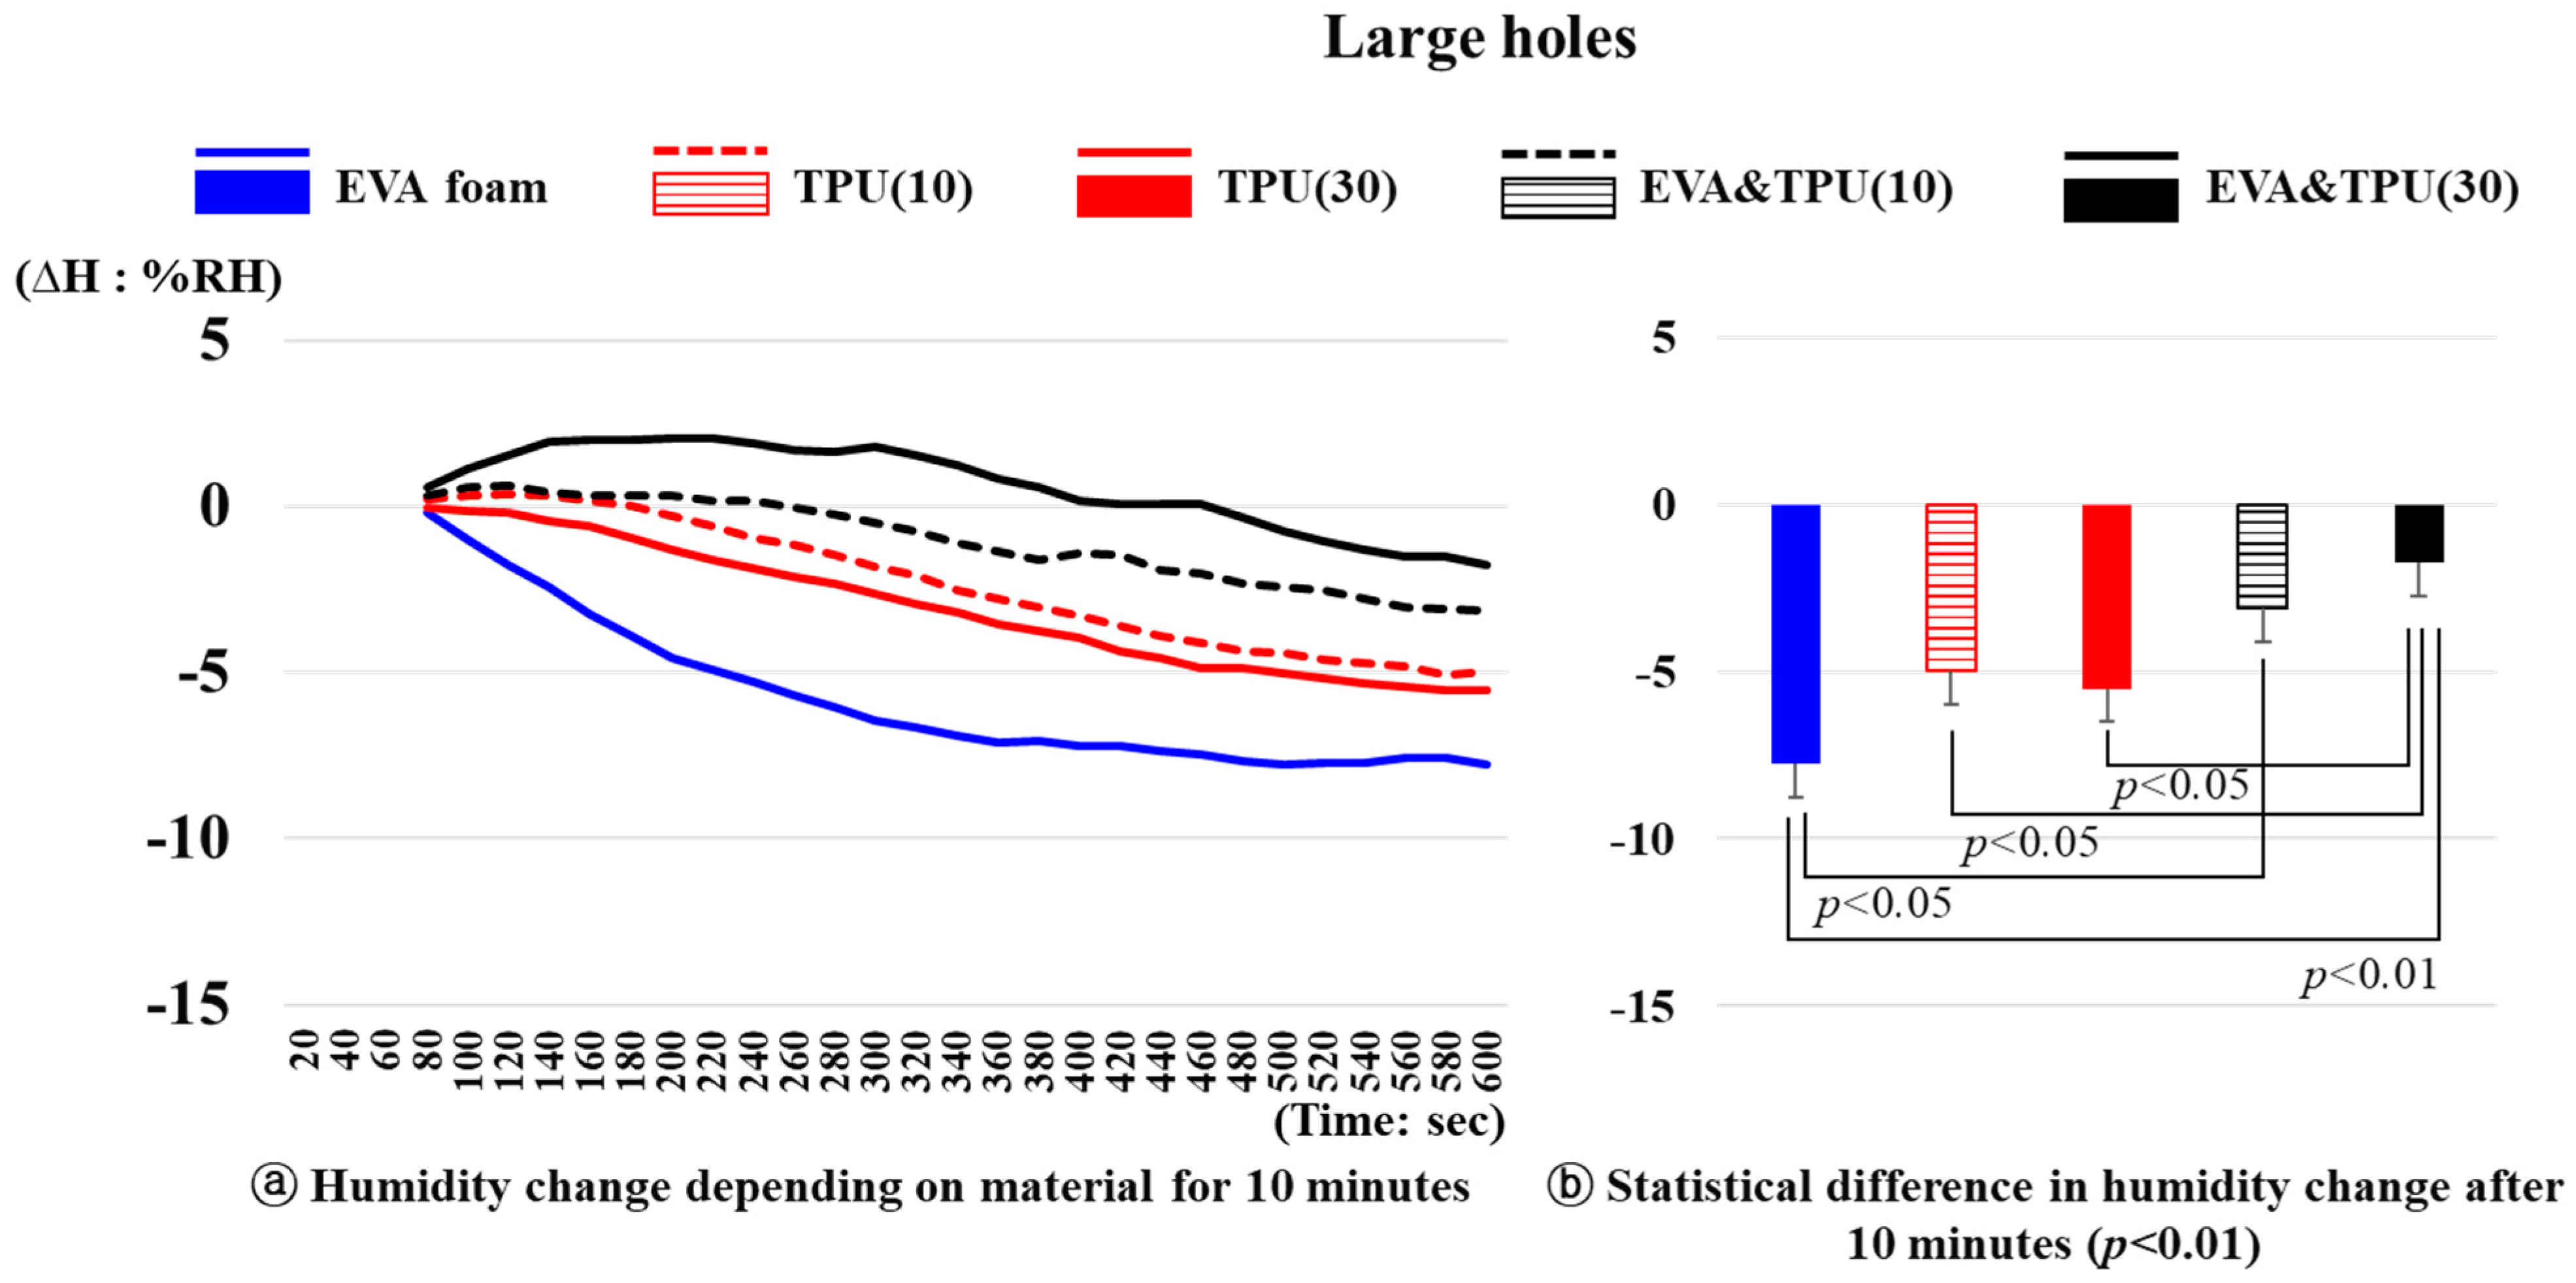
3.3. Humidity Change Depending on the Material
4. Discussion and Conclusions
Author Contributions
Funding
Institutional Review Board Statement
Informed Consent Statement
Data Availability Statement
Conflicts of Interest
References
- Bishop, P.; Balilonis, G.; Davis, J.; Zhang, Y. Ergonomics and comfort in protective and sport clothing: A brief review. J. Ergon. S 2013, 2, 1–7. [Google Scholar] [CrossRef]
- Ramsey, J.D.; Bishop, P.A. Hot and cold environments. In The Occupational Environment: Its Evaluation, Control and Management; American Industrial Hygiene Association: Falls Church, WV, USA, 2003. [Google Scholar]
- NFPA 1977; Standard on Protective Clothing and Equipment for Wildland Fire Fighting. National Fire Protection Association: Quincy, MA, USA, 2005.
- Li, Y. Perceptions of temperature, moisture and comfort in clothing during environmental transients. Ergonomics 2005, 48, 234–248. [Google Scholar] [CrossRef] [PubMed]
- Savini, A.; Savini, G.G. A short history of 3D printing, a technological revolution just started. In Proceedings of the ICOHTEC/IEEE Histelcon (International History of High-Technologies and Their Socio-Cultural Contexts Conference), Tel Aviv, Israel, 16–21 August 2015. [Google Scholar] [CrossRef]
- Li, Z. Research on creative clothing design based on 3D printing technology. In Proceedings of the 6th International Conference on Electronic, Mechanical, Information and Management Society, Shenyang, China, 1–3 April 2016. [Google Scholar] [CrossRef]
- Yan, Q.; Dong, H.; Su, J.; Han, J.; Song, B.; Wei, Q.; Shi, Y. A review of 3D printing technology for medical applications. Engineering 2018, 4, 729–742. [Google Scholar] [CrossRef]
- Perry, A. 3D-printed apparel and 3D-printer: Exploring advantages, concerns, and purchases. Int. J. Fash. Des. Technol. Educ. 2018, 11, 95–103. [Google Scholar] [CrossRef]
- Kim, S.; Seong, H.; Her, Y.; Chun, J. A study of the development and improvement of fashion products using a FDM type 3D printer. Fash. Text. 2019, 6, 9. [Google Scholar] [CrossRef]
- Koo, D.S.; Lee, J.R. The development of a wrist brace using 3D scanner and 3D printer. Fash. Text. Res. J. 2017, 19, 312–319. [Google Scholar] [CrossRef]
- Bayati, A.; Rahmatabadi, D.; Ghasemi, I.; Khodaei, M.; Baniassadi, M.; Abrinia, K.; Baghani, M. 3D printing super stretchable propylene-based elastomer. Mater. Lett. 2024, 361, 136075. [Google Scholar] [CrossRef]
- Hong, K.H.; Lee, H. Development of hip protectors for snowboarding utilizing 3D modeling and 3D printing. Fash. Text. 2020, 7, 39. [Google Scholar] [CrossRef]
- Jung, H.; Lee, H.; Chung, I.H. Development of the 3D knee protector for yoga. J. Korean Soc. Cloth. Text. 2022, 46, 657–671. [Google Scholar] [CrossRef]
- Milošević, P.; Bogović, S. 3D Technologies in individualized chest protector modelling. Text. Leather Rev. 2018, 1, 46–55. [Google Scholar] [CrossRef]
- Park, J.H.; Lee, J.R. Developing fall-impact protection pad with 3D mesh curved surface structure using 3D printing technology. Polymers 2019, 11, 1800. [Google Scholar] [CrossRef] [PubMed]
- Park, S.; Lee, H.; Lee, Y. Suggestion of crotch protector prototype for cyclewear based on 3D modeling and printing. Korean J. Hum. Ecol. 2019, 28, 147–157. [Google Scholar] [CrossRef]
- Mian, S.H.; Abouel Nasr, E.; Moiduddin, K.; Saleh, M.; Alkhalefah, H. An insight into the characteristics of 3D printed polymer materials for orthoses applications: Experimental study. Polymers 2024, 16, 403. [Google Scholar] [CrossRef] [PubMed]
- Ronca, A.; Abbate, V.; Redaelli, D.F.; Storm, F.A.; Cesaro, G.; De Capitani, C.; Sorrentino, A.; Colombo, G.; Fraschini, P.; Ambrosio, L. A Comparative study for material selection in 3D printing of scoliosis back brace. Materials 2022, 15, 5724. [Google Scholar] [CrossRef] [PubMed]
- Kim, S.G.; Kim, H.R. The recent tendency of fashion textiles by 3D printing. Fash. Text. Res. J. 2018, 20, 117–127. [Google Scholar] [CrossRef]
- Lee, S. Evaluation of mechanical properties and washability of 3D printed lace/voil composite fabrics manufactured by FDM 3D printing technology. Fash. Text. Res. J. 2018, 20, 353–359. [Google Scholar] [CrossRef]
- Bates, S.R.; Farrow, I.R.; Trask, R.S. 3D printed polyurethane honeycombs for repeated tailored energy absorption. Mater. Des. 2016, 112, 172–183. [Google Scholar] [CrossRef]
- ASTM D638; Standard Test Method for Tensile Properties of Plastics. ASTM International: West Conshohocken, PA, USA, 2014.
- ASTM D790-99; Standard Test Methods for Flexural Properties of Unreinforced and Reinforced Plastics and Electrical Insulating Materials. ASTM International: West Conshohocken, PA, USA, 2001.
- Fei, T.; Li, Y.; Liu, B.; Xia, C. Flexible polyurethane/boron nitride composites with enhanced thermal conductivity. High Perform. Polym. 2020, 32, 324–333. [Google Scholar] [CrossRef]
- Wondu, E.; Lule, Z.C.; Kim, J. Improvement of dielectric properties and thermal conductivity of TPU with alumina-encapsulated rGO. Polym. Test. 2021, 102, 107322. [Google Scholar] [CrossRef]
- Zhou, Z.M.; Wang, K.; Wang, Y.H. High performance of thermoplastic polyurethane-graphene oxide self-healing composite film. Coatings 2021, 11, 128. [Google Scholar] [CrossRef]
- Jeong, Y.S.; Choi, H.J.; Kim, K.W.; Choi, G.S.; Kang, J.S.; Yang, K.S. A study on the thermal conductivity of resilient materials. Thermochim. Acta 2009, 490, 47–50. [Google Scholar] [CrossRef]
- Lou, C.W.; Lu, C.T.; Lin, C.M.; Lee, C.H.; Chao, C.Y.; Lin, J.H. Process technology and performance evaluation of functional knee pad. Fibers Polym. 2010, 11, 136–141. [Google Scholar] [CrossRef]
- Kim, S.J.; Chae, C.S.; Choe, U.H.; Kim, D.H.; Kim, E.J. Analysis of the properties of domestic and foreign laminated high-performance moisture-permeable and waterproof fabrics. In Proceedings of the Korean Society of Dyers and Finishers Conference, Iksan-si, Republic of Korea, 3 November 2006. [Google Scholar]
- Mazari, F.B.; Chotebor, M.; Naeem, J.; Mazari, A.; Havelka, A. Effect of perforated polyurethane foam on moisture permeability for car seat comfort. Fibres Text. East. Eur. 2016, 6, 165–169. [Google Scholar] [CrossRef]
- ASTM E96; Standard Test Methods for Water Vapor Transmission of Materials. ASTM International: West Conshohocken, PA, USA, 2017.
- Eom, R.I.; Lee, H.; Lee, Y. Evaluation of thermal properties of 3D spacer technical materials in cold environments using 3D printing technology. Polymers 2019, 11, 1438. [Google Scholar] [CrossRef] [PubMed]
- Lee, H.; Kim, S.; Lee, Y.; Lee, O. Analysis of changes in temperature and humidity by material combination using 3D printing. Fash. Text. Res. J. 2022, 24, 127–137. [Google Scholar] [CrossRef]
- Girardin, B.; Fontaine, G.; Duquesne, S.; Försth, M.; Bourbigot, S. Characterization of Thermo-Physical Properties of EVA/ATH: Application to Gasification Experiments and Pyrolysis Modeling. Materials 2015, 8, 7837–7863. [Google Scholar] [CrossRef] [PubMed]
- Pinedo, B.; Hadfield, M.; Tzanakis, I.; Conte, M.; Anand, M. Thermal analysis and tribological investigation on TPU and NBR elastomers applied to sealing applications. Tribol. Int. 2018, 127, 24–36. [Google Scholar] [CrossRef]
- Lee, O.; Lee, H.; Kim, S.; Lee, Y. Evaluation of physical properties of material combination for fabricating protection pads for women’s army combat uniforms. J. Korean Soc. Cloth. Text. 2023, 47, 311–322. [Google Scholar] [CrossRef]
- Kang, D.-H.; Seo, M.-Y.; Gimm, H.; Kim, T.-W. Determination of shock absorption performance and shear modulus of rubbers by drop impact test. J. Korean Soc. Mech. Eng. 2009, 33, 321–328. [Google Scholar] [CrossRef]
- Park, J.H.; Lee, J.R. Prototype of fall impact protective pants for elderly women. J. Korean Soc. Costume 2016, 66, 45–60. [Google Scholar] [CrossRef]
- Park, J.H.; Lee, J.S.; Lee, J.R. Development and evaluation of fall impact protection pad. Fash. Text. Res. J. 2018, 20, 422–428. [Google Scholar] [CrossRef]


| Materials | EVA Foam | TPU(10)/TPU(30) | EVA&TPU(10)/ EVA&TPU(30) | Modeling | |
|---|---|---|---|---|---|
| Hole Sizes | |||||
| No holes | 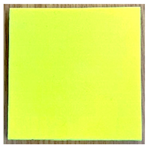 |  | 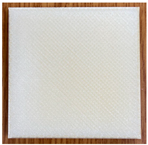 | 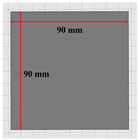 | |
| Small holes | 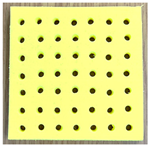 | 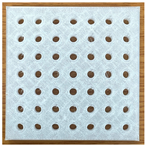 |  | 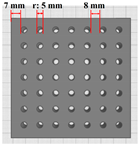 | |
| Large holes |  |  |  |  | |
| Side view | 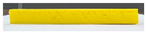 | 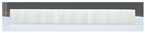 | 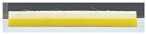 |  | |
| Materials | EVA Foam | TPU(10) | TPU(30) | EVA&TPU(10) | EVA&TPU(30) | ||||||
|---|---|---|---|---|---|---|---|---|---|---|---|
| Properties | without Holes | with Holes | without Holes | with Holes | without Holes | with Holes | without Holes | with Holes | without Holes | with Holes | |
| Tensile strength (MPa): ASTM D638(2014) (a) | 1.1 | 0.6 | 6.8 | 3.7 | 8.6 | 5.0 | 4.5 | 2.7 | 4.8 | 2.8 | |
| Flexural strength (MPa): ASTM D790-99 (b) | 4.1 | 3.9 | 25.4 | 24.1 | 30.5 | 28.1 | 13.6 | 13.5 | 13.6 | 13.0 | |
| Measurement Equipment | Measurement Locations | ||
|---|---|---|---|
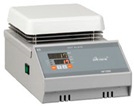 |  | 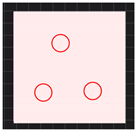 |  |
| <Hot plate> | <Surface temp. & humidity> | <Without holes> | <With holes> |
| without Holes | Small Holes | Large Holes | F | p | ||
|---|---|---|---|---|---|---|
| ∆T (Temperature change after 10 min, °C) | Mean | 3.0 | 2.8 | 3.5 | 1.389 | 0.261 |
| SD | 0.7 | 1.6 | 1.2 | |||
| ∆H (Humidity change after 10 min, %RH) | Mean | −1.5 c | −2.9 b | −4.4 a | 8.522 | 0.001 |
| SD | 1.6 | 1.8 | 2.2 | |||
Disclaimer/Publisher’s Note: The statements, opinions and data contained in all publications are solely those of the individual author(s) and contributor(s) and not of MDPI and/or the editor(s). MDPI and/or the editor(s) disclaim responsibility for any injury to people or property resulting from any ideas, methods, instructions or products referred to in the content. |
© 2024 by the authors. Licensee MDPI, Basel, Switzerland. This article is an open access article distributed under the terms and conditions of the Creative Commons Attribution (CC BY) license (https://creativecommons.org/licenses/by/4.0/).
Share and Cite
Kwon, S.; Kwon, S.; Lee, H.; Subramaniyam, M. Heat and Moisture Transfer Depending on 3D-Printed Thermoplastic Polyurethane and Ethylene-Vinyl Acetate Foam and the Presence of Holes for 3D Printing Clothing Development. Polymers 2024, 16, 1684. https://doi.org/10.3390/polym16121684
Kwon S, Kwon S, Lee H, Subramaniyam M. Heat and Moisture Transfer Depending on 3D-Printed Thermoplastic Polyurethane and Ethylene-Vinyl Acetate Foam and the Presence of Holes for 3D Printing Clothing Development. Polymers. 2024; 16(12):1684. https://doi.org/10.3390/polym16121684
Chicago/Turabian StyleKwon, Sunghyun, Sungeun Kwon, Heeran Lee, and Murali Subramaniyam. 2024. "Heat and Moisture Transfer Depending on 3D-Printed Thermoplastic Polyurethane and Ethylene-Vinyl Acetate Foam and the Presence of Holes for 3D Printing Clothing Development" Polymers 16, no. 12: 1684. https://doi.org/10.3390/polym16121684
APA StyleKwon, S., Kwon, S., Lee, H., & Subramaniyam, M. (2024). Heat and Moisture Transfer Depending on 3D-Printed Thermoplastic Polyurethane and Ethylene-Vinyl Acetate Foam and the Presence of Holes for 3D Printing Clothing Development. Polymers, 16(12), 1684. https://doi.org/10.3390/polym16121684