
Crystallization of the β-Form of Polypropylene from the Melt with Reduced Entanglement of Macromolecules


Abstract
:1. Introduction
2. Materials and Methods
3. Results and Discussion
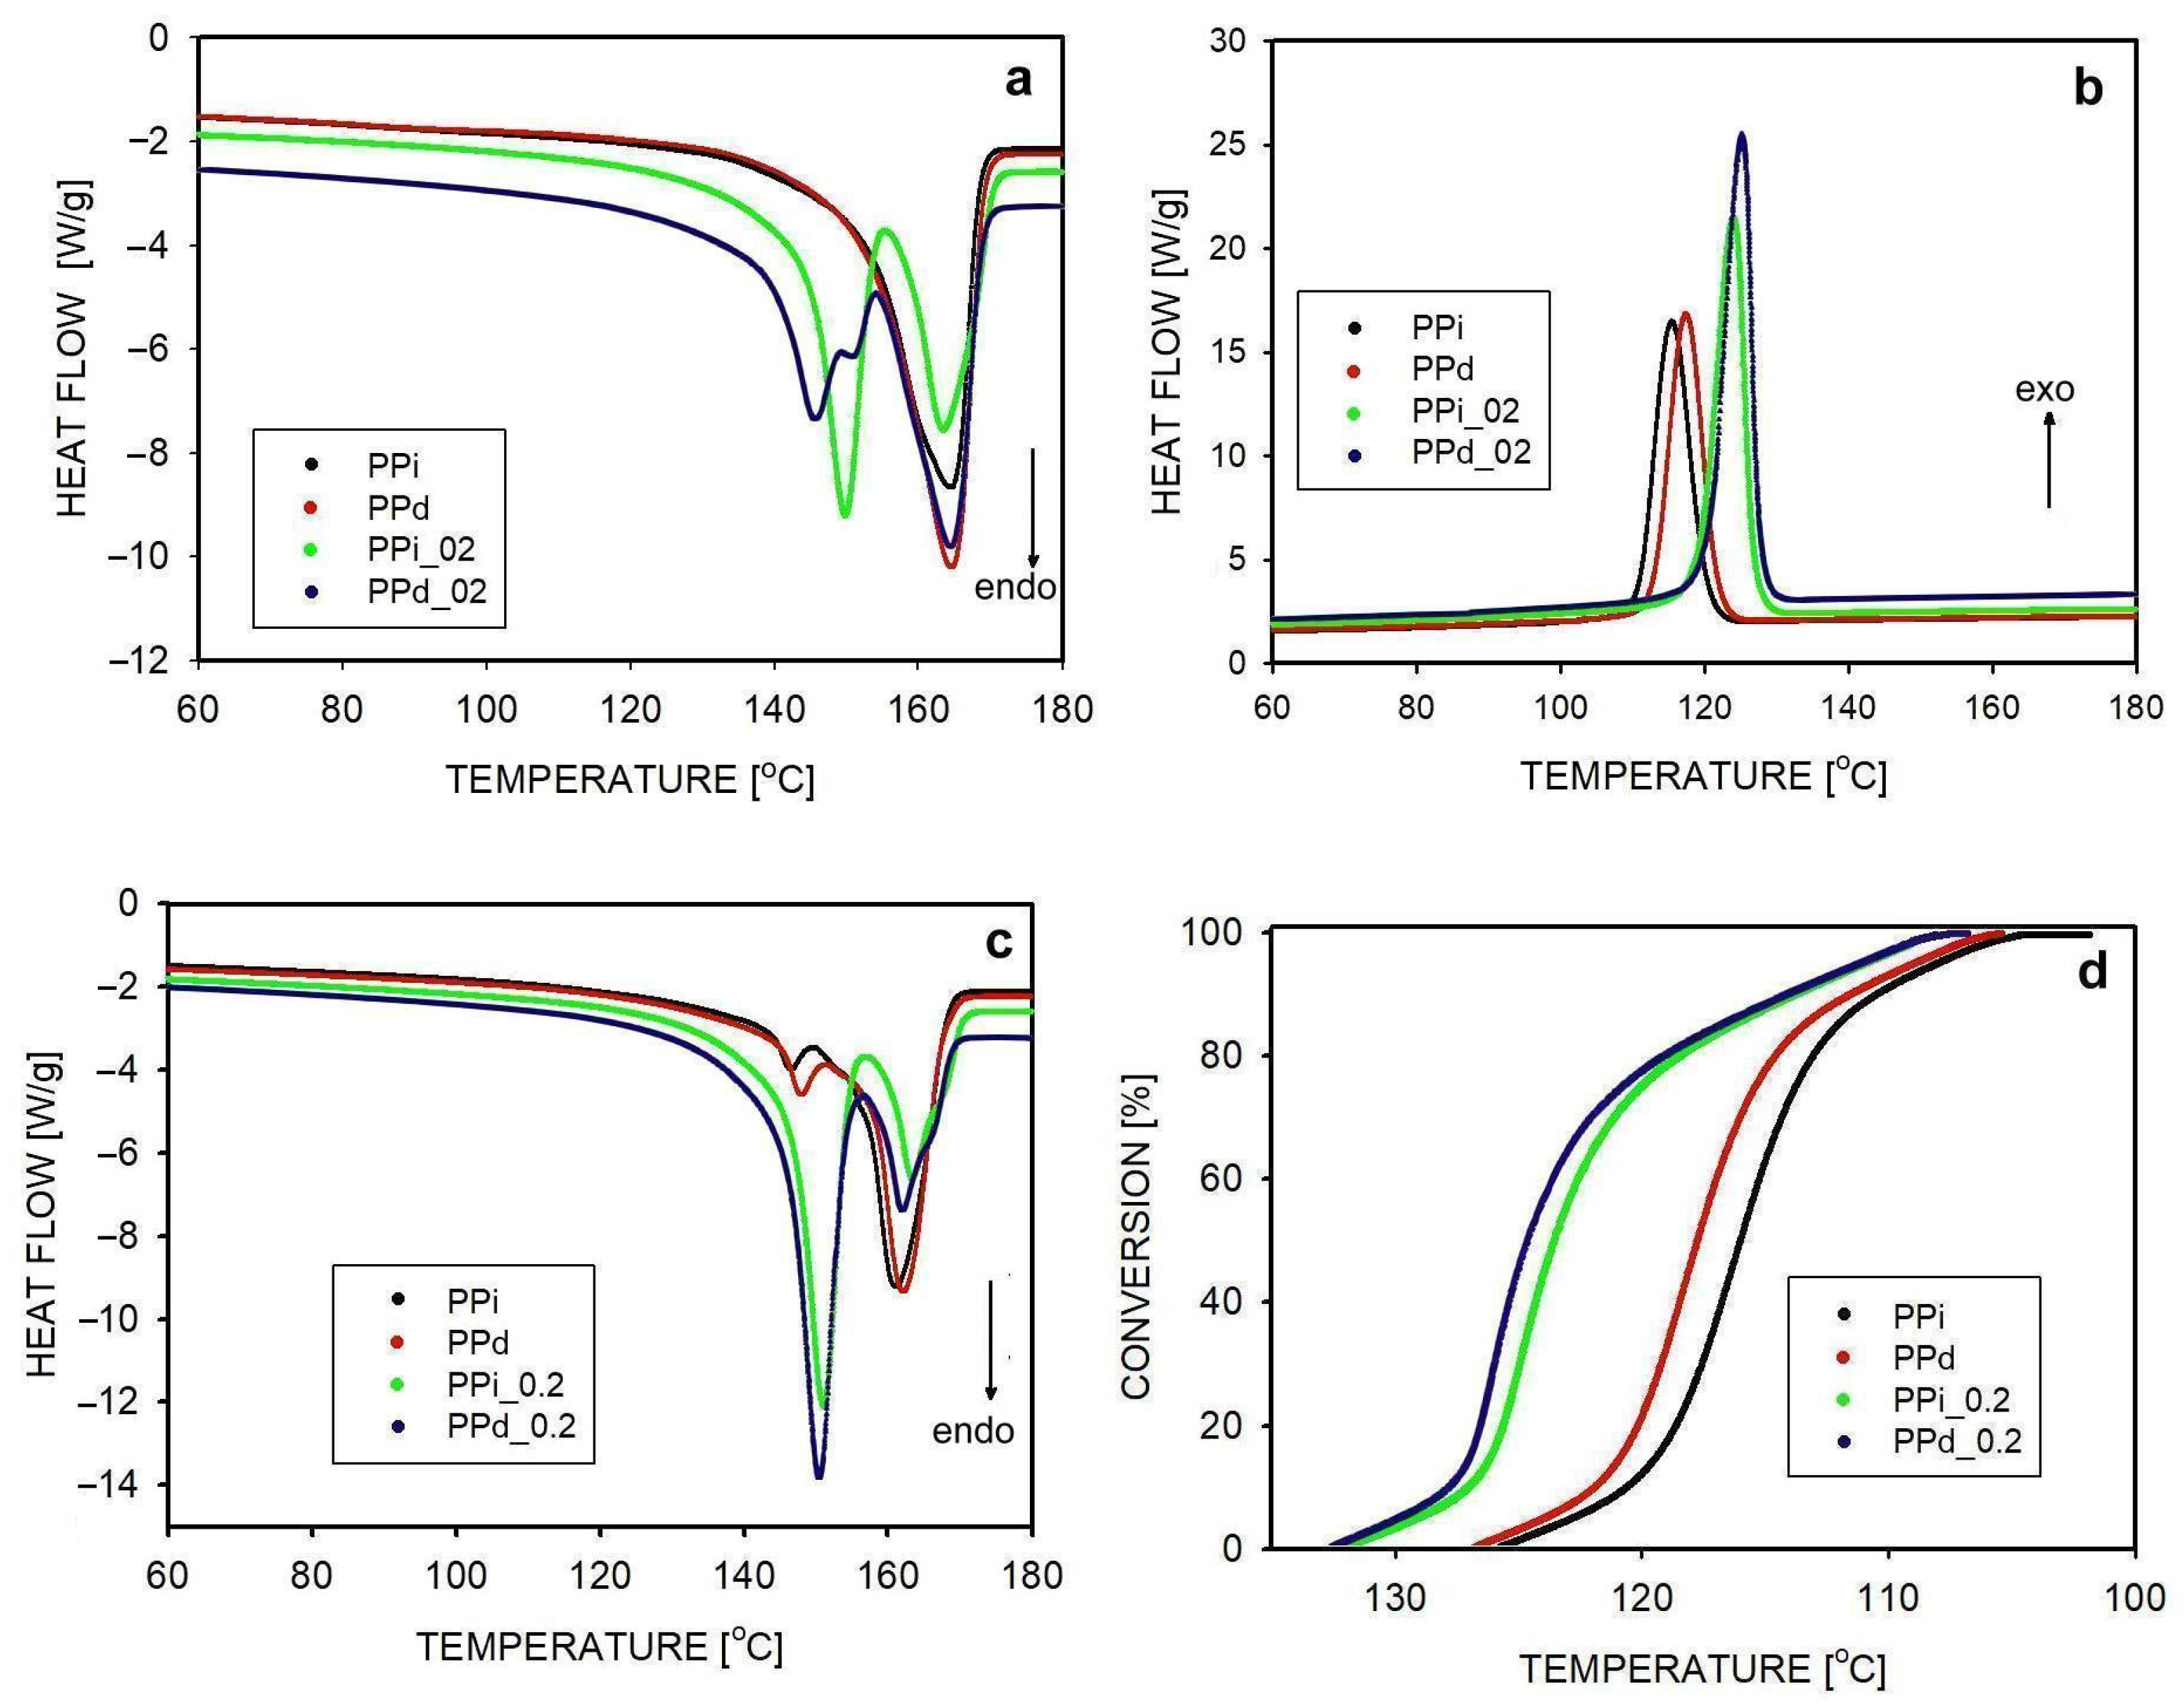
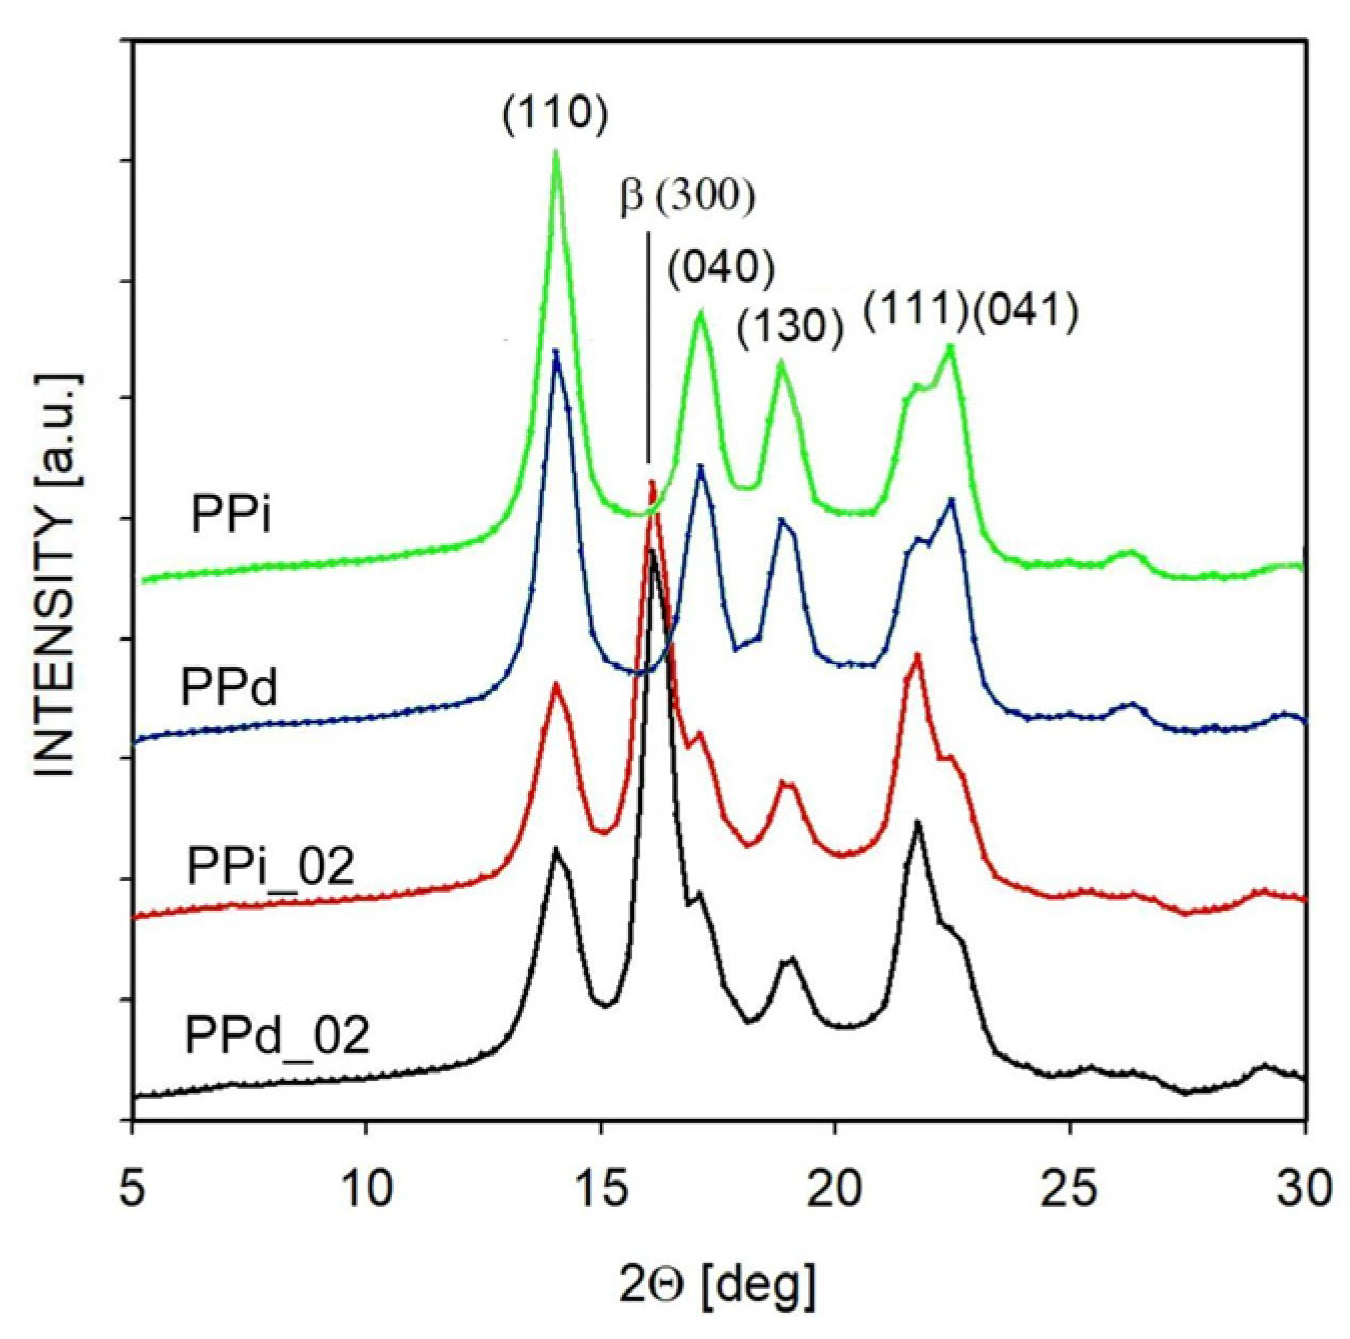
3.1. Non-Isothermal Crystallization
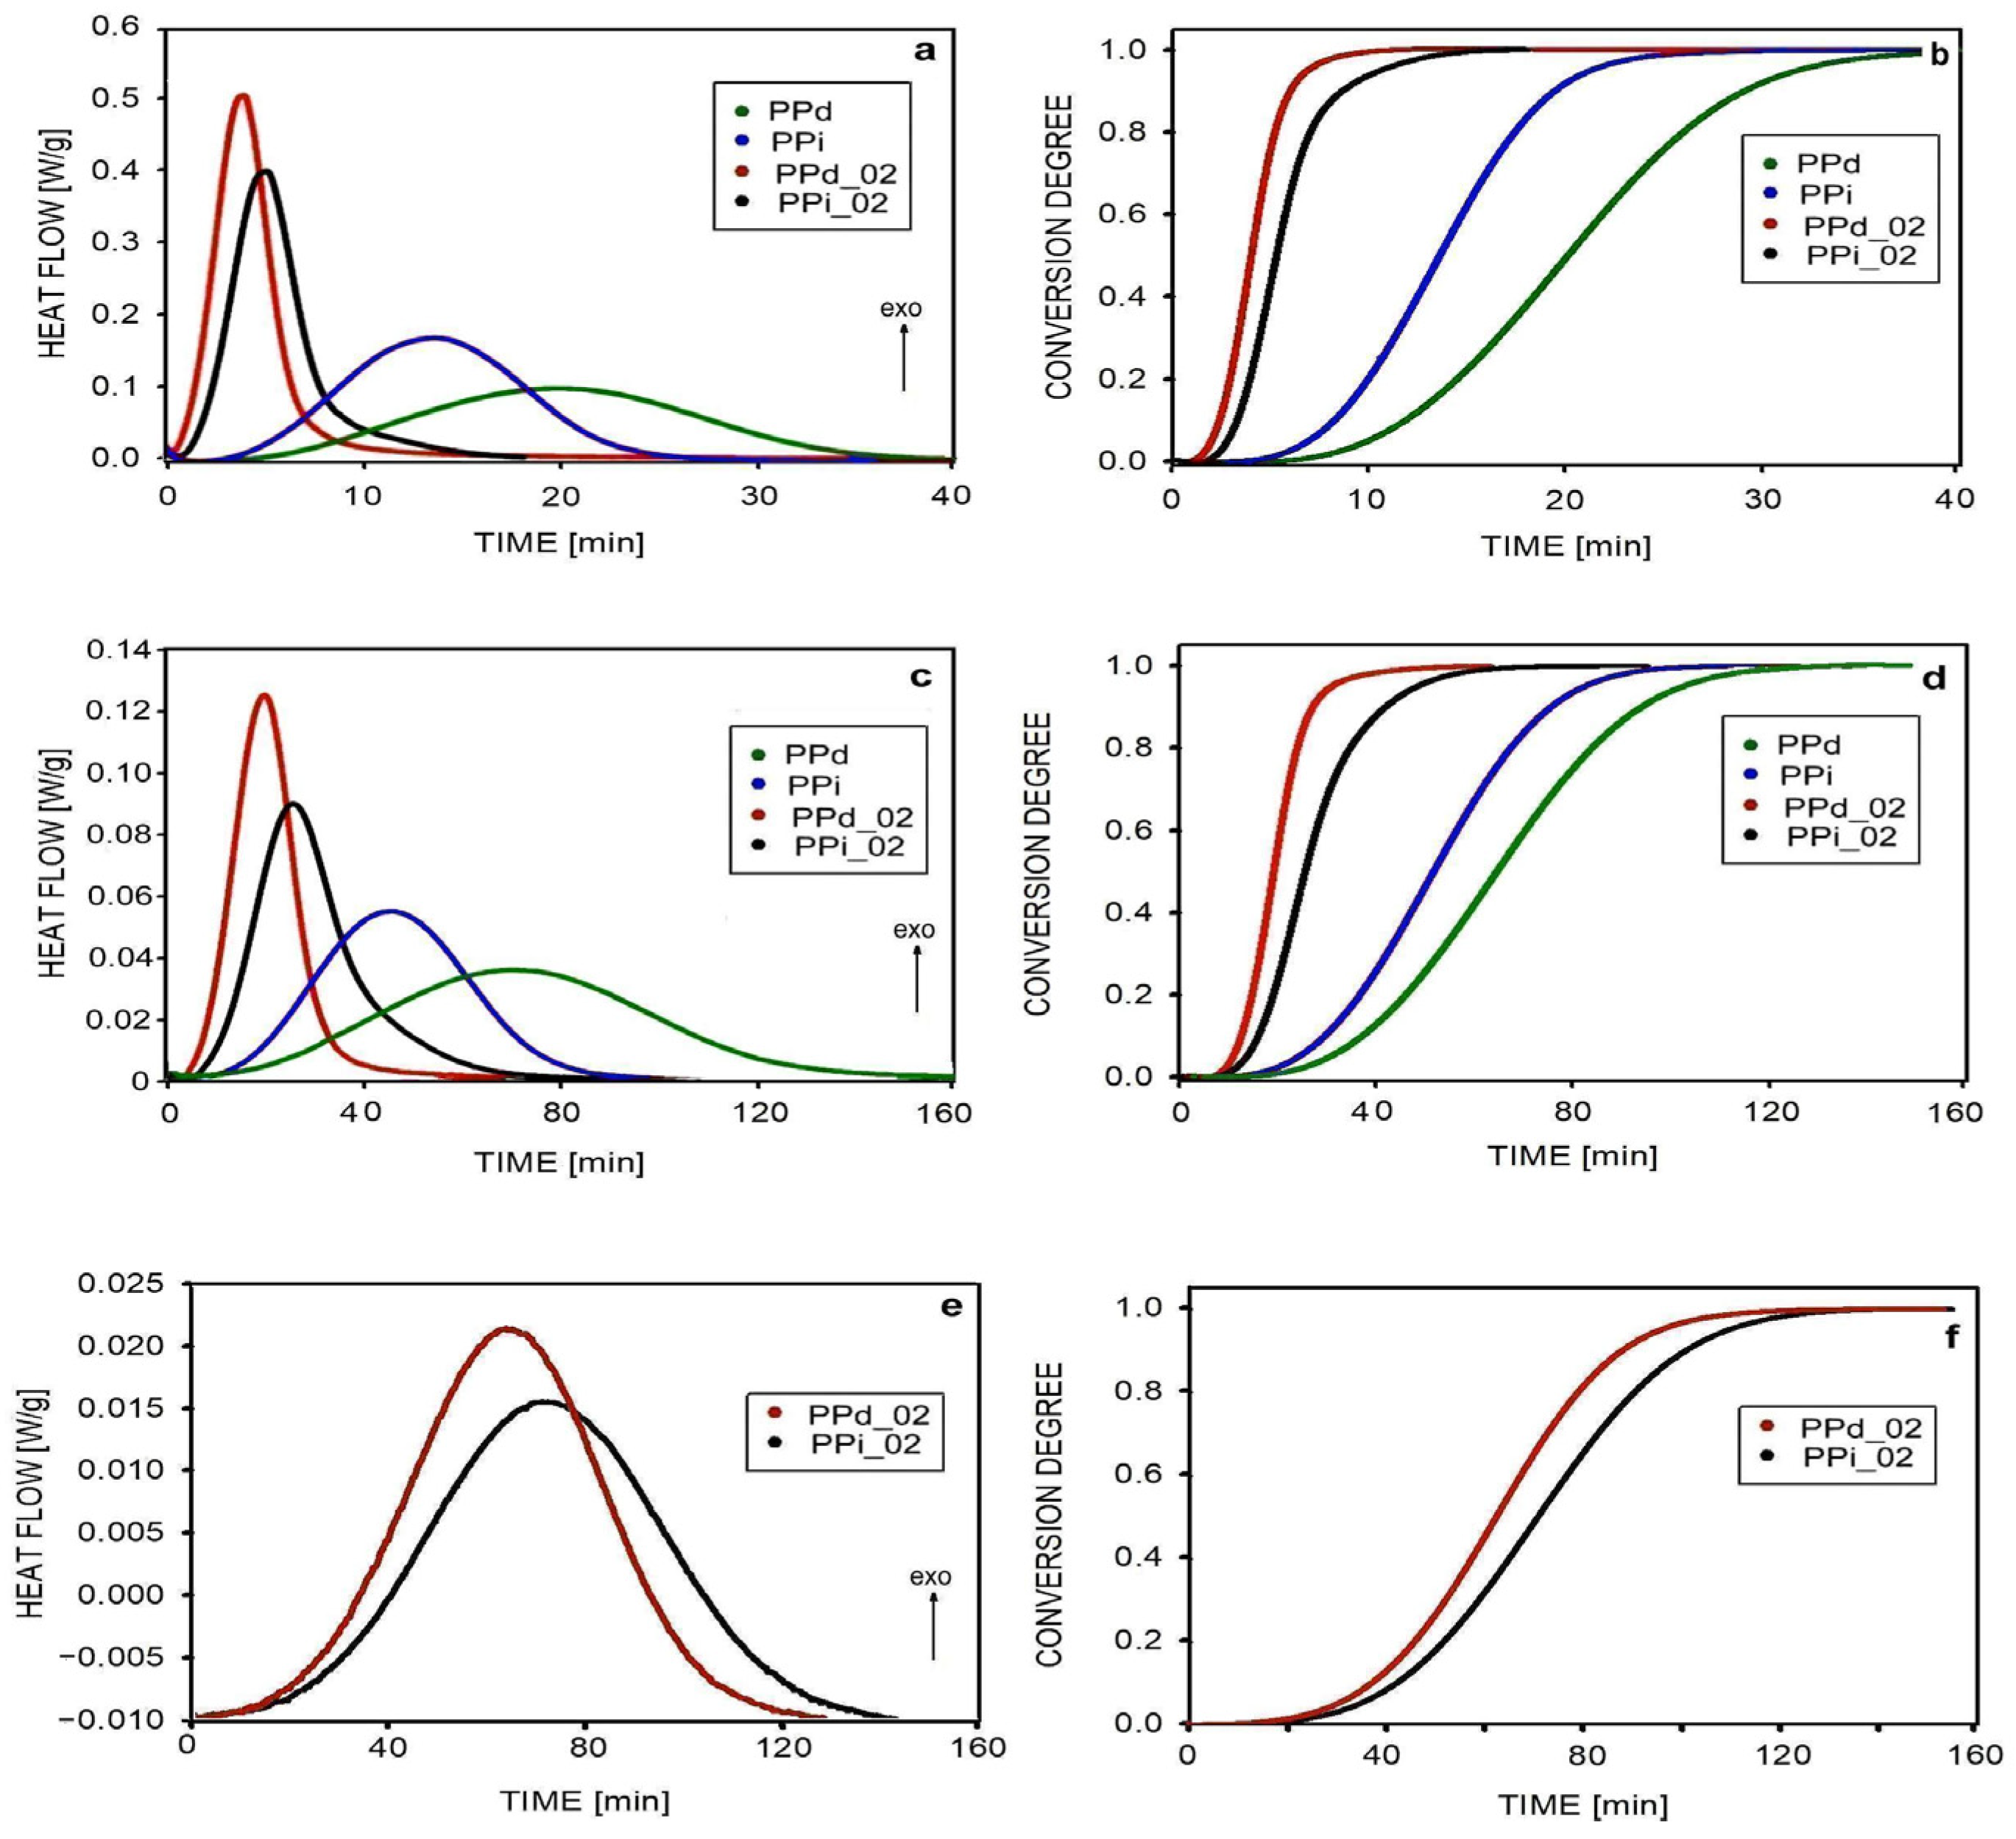
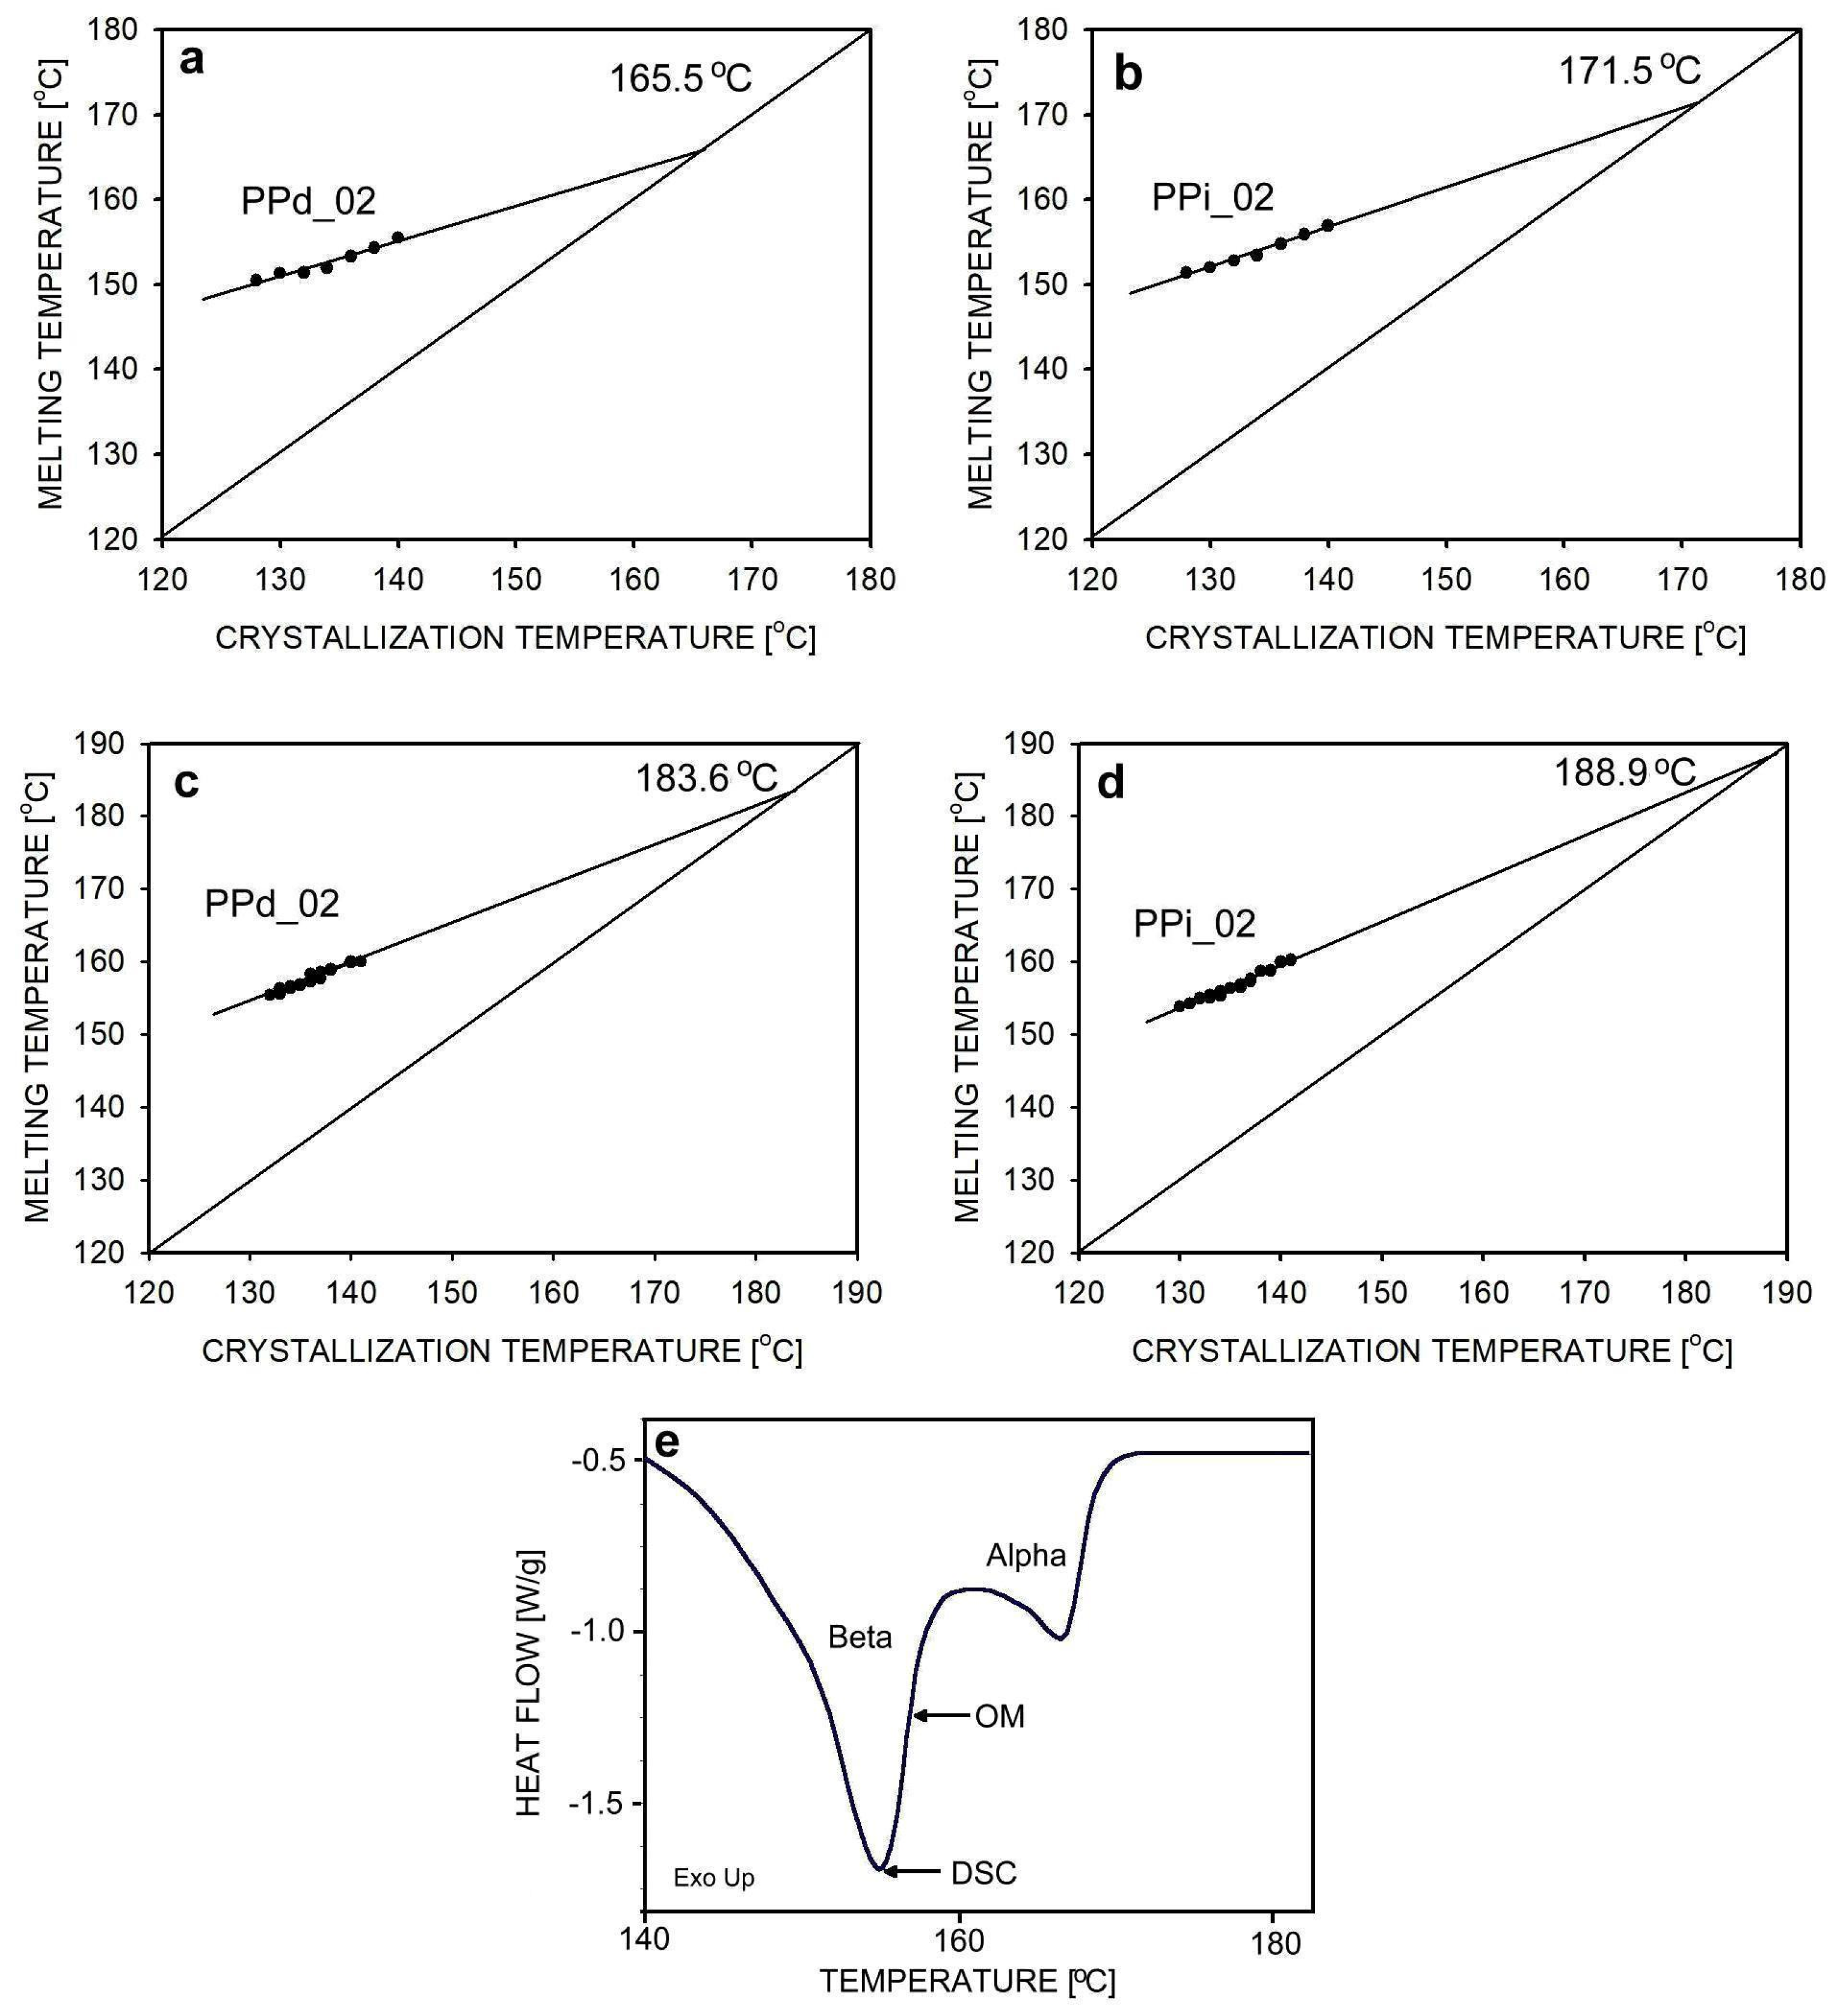
3.2. Isothermal Crystallization
4. Conclusions
Author Contributions
Funding
Institutional Review Board Statement
Data Availability Statement
Conflicts of Interest
References
- Varga, J. Crystallization, Melting and Supermolecular Structure of Isotactic Polypropylene. In Polypropylene: Structure, Blends and Composites; Karger-Kocsis, J., Ed.; Chapman and Hall: London, UK, 1994; Chapter 3; pp. 56–115. [Google Scholar]
- Zhou, P.-Z.; Zhang, Y.-F.; Lin, X.-F. Thermal stability of nucleation effect of different β-nucleating agents in isotactic polypropylene. J. Therm. Anal. Calorim. 2018, 132, 1845–1852. [Google Scholar] [CrossRef]
- Wu, B.; Zheng, X.; Xu, W.; Ren, Y.; Leng, H.; Liang, L.; Zheng, D.; Chen, J.; Jiang, H. β-Nucleated Polypropylene: Preparation, Nucleating Efficiency, Composite, and Future Prospects. Polymers 2023, 15, 3107. [Google Scholar] [CrossRef] [PubMed]
- Zeng, F.; Peng, H.; Chen, J.; Kang, J.; Yang, F.; Cao, Y.; Xiang, M. Investigation on the crystallization behavior and morphology of β-nucleated isotactic polypropylene/glass fiber composites. Soft Mater. 2017, 15, 229–240. [Google Scholar] [CrossRef]
- Yuan, Q.; Jiang, W.; An, L. Study of β-α recrystallization of the polypropylene. Colloid Polym. Sci. 2004, 282, 1236–1241. [Google Scholar] [CrossRef]
- Lotz, B. α and β phases of isotactic polypropylene: A case of growth kinetics ‘phase reentrency’ in polymer crystallization. Polymer 1998, 39, 4561–4567. [Google Scholar] [CrossRef]
- Li, J.X.; Cheung, W.L.; Jia, D. A study on the heat of fusion of β-polypropylene. Polymer 1990, 40, 1219–1222. [Google Scholar] [CrossRef]
- Lovinger, A.J.; Chua, J.O.; Gryte, C.C. Studies on the α- and β-forms of isotactic polypropylene by crystallization in temperature gradient. J. Polym. Sci. Polym. Phys. Ed. 1977, 15, 641–656. [Google Scholar] [CrossRef]
- Juhasz, P.; Varga, J.; Belina, K.; Marand, H. Determination of the equilibrium melting point of the β-form of polypropylene. J. Therm. Anal. Calorim. 2002, 69, 561–574. [Google Scholar] [CrossRef]
- Monasse, B.; Haudin, J.M. Growth transition and morphology change in polypropylene. Colloid Polym. Sci. 1985, 263, 822–831. [Google Scholar] [CrossRef]
- Varga, J.; Garzo, G. Isothermal crystallization of the β-modification of polypropylene. Acta Chim. Hung. Acad. Sci. 1991, 128, 303–317. [Google Scholar]
- Jiang, W.; Song, X.; Zhou, R.; Wu, Z.; Hu, B.; Zhang, Y.; Liang, Z.; Chen, Z.; Kanga, J.; Xiang, M. Influences of molecular structure on the isothermal crystallization behavior and mechanical properties of β-nucleated isotactic polypropylene. Polym. Plast. Technol. Mater. 2020, 59, 1724–1735. [Google Scholar] [CrossRef]
- Varga, J. Supermolecular structure of isotactic polypropylene. J. Mater. Sci. 1992, 27, 2557–2579. [Google Scholar] [CrossRef]
- Nakamura, K.; Shimizu, S.; Umemoto, S.; Thierry, A.; Lotz, B.; Okui, N. Temperature Dependence of Crystal Growth Rate for α and β Forms of Isotactic Polypropylene. Polym. J. 2008, 40, 915–922. [Google Scholar] [CrossRef]
- Mollova, A.; Androsch, R.; Mileva, D.; Gahleitner, M.; Funari, S.S. Crystallization of isotactic polypropylene containing beta-phase nucleating agent at rapid cooling. Eur. Polym. J. 2013, 49, 1057–1065. [Google Scholar] [CrossRef]
- Padden, F.J.; Keith, H.D. Spherulitic Crystallization in Polypropylene. J. Appl. Phys. 1959, 30, 1479–1484. [Google Scholar] [CrossRef]
- Gradys, A.; Sajkiewicz, P.; Minakov, A.A.; Adamovsky, S.; Schick, C.; Hashimoto, T.; Saijo, K. Crystallization of polypropylene at various cooling rates. Mater. Sci. Eng. A 2005, 413–414, 442–446. [Google Scholar] [CrossRef]
- Leugering, H.J.; Kirsch, G. β-Modification of Polypropylene and Its Two Component Systems. Angew. Makromol. Chem. 1973, 33, 17–23. [Google Scholar] [CrossRef]
- Pawlak, A.; Piorkowska, E. Crystallization of isotactic polypropylene in temperature gradient. Colloid Polym. Sci. 2001, 279, 939–946. [Google Scholar] [CrossRef]
- Zhang, Y.-F.; Xin, Z. Isothermal Crystallization Behaviors of Isotactic Polypropylene Nucleated with α/β Compounding Nucleating Agents. J. Polym. Sci. B Polym. Phys. 2007, 45, 590–596. [Google Scholar] [CrossRef]
- He, Z.; Zhang, Y.-F.; Li, Y. Dependence of β-crystal formation of isotactic polypropylene on crystallization conditions. J. Poym. Res. 2020, 27, 250. [Google Scholar] [CrossRef]
- Carmeli, E.; Ottonello, S.; Wang, B.; Menyhárd, A.; Müller, A.J.; Cavallo, D. Competing crystallization of α- and β-phase induced by β-nucleating agents in microdroplets of isotactic polypropylene. Cryst. Eng. Comm. 2022, 24, 1966–1978. [Google Scholar] [CrossRef]
- Papageorgiou, D.G.; Chrissafis, K.; Bikiaris, D.N. β-Nucleated Polypropylene: Processing, Properties and Nanocomposites. Polym. Rev. 2015, 55, 596–629. [Google Scholar] [CrossRef]
- Varga, J.; Murda, I.; Ehrenstein, G.W. Highly Active Thermally Stable β-Nucleating Agents for Isotactic Polypropylene. J. Appl. Polym. Sci. 1991, 74, 2357–2368. [Google Scholar]
- Zhao, S.; Xin, Z. Nucleation Characteristics of the a/b Compounded Nucleating Agents and Their Influences on Crystallization Behavior and Mechanical Properties of Isotactic Polypropylene. J. Polym. Sci. B Polym. Phys. 2010, 48, 653–665. [Google Scholar] [CrossRef]
- Philips, R.A.; Wolkowicz, M.D. Structure and Morphology. In Polypropylene Handbook; Moore, E.P., Jr., Ed.; Hanser Publishers: Munich, Germany, 1996; Chapter 3; pp. 134–138. [Google Scholar]
- Norton, D.R.; Keller, A. The spherulitic and lamellar morphology of melt-crystallized isotactic polypropylene. Polymer 1985, 26, 704–716. [Google Scholar] [CrossRef]
- Galeski, A. Nucleation in polypropylene. In Polypropylene: Structure, Blends and Composites; Karger-Kocsis, J., Ed.; Chapman and Hall: London, UK, 1994; pp. 25–49. [Google Scholar]
- Shi, G.; Zhang, X.; Qiu, Z. Crystallization kinetics of β-phase poly(propylene). Makromol. Chem. 1992, 193, 583–591. [Google Scholar] [CrossRef]
- Eckstein, A.; Suhm, J.; Friedrich, C.; Maier, R.; Sassmannshausen, J.; Bochmann, M.; Mulhaupt, R. Determination of Plateau Moduli and Entanglement Molecular Weights of Isotactic, Syndiotactic, and Atactic Polypropylenes Synthesized with Metallocene Catalysts. Macromolecules 1998, 31, 1335–1340. [Google Scholar] [CrossRef]
- Fetters, L.J.; Lohse, D.J.; Graessley, W.W. Chain dimensions and entanglement spacings in dnese macromolecular systems. J. Polym. Sci. B Polym. Phys. 1999, 37, 1023–1033. [Google Scholar]
- Krajenta, J.; Pawlak, A.; Galeski, A. Deformation of Disentangled Polypropylene Crystalline Grains into Nanofibers. J. Polym. Sci. B Polym. Phys. 2016, 54, 1983–1994. [Google Scholar] [CrossRef]
- Niu, H.; Wang, Y.; Liu, X.; Wang, Y.; Li, Y. Determination of plateau moduli and entanglement molecular weights of ultra-high molecular weight isotactic polypropylene synthesized by Ziegler-Natta catalyst. Polym. Test. 2017, 60, 260–265. [Google Scholar] [CrossRef]
- Pawlak, A. The Entanglements of macromolecules and Their Influence on the Properties of Polymers. Macromol. Chem. Phys. 2019, 220, 1900043. [Google Scholar] [CrossRef]
- Pawlak, A. Crystallization of Polymers with a Reduced Density of Entanglements. Crystals 2024, 14, 385. [Google Scholar] [CrossRef]
- Wang, X.H.; Liu, R.; Wu, M.; Wang, Z.; Huang, Y. Effect of chain disentanglement on melt crystallization behaviour of isotactic polypropylene. Polymer 2009, 50, 5824–5827. [Google Scholar] [CrossRef]
- Xiao, Z.; Sun, Q.; Xue, G.; Yuan, Z.; Dai, Q.; Hu, Y. Thermal behavior of isotactic polypropylene freeze-extracted from solutions with varying concentrations. Eur. Polym. J. 2003, 39, 927–931. [Google Scholar] [CrossRef]
- Pawlak, A.; Krajenta, J.; Galeski, A. The Crystallization of Polypropylene with Reduced Density of Entanglements. J. Polym. Sci. B Polym. Phys. 2017, 55, 748–756. [Google Scholar] [CrossRef]
- Wang, B.; Cavallo, D.; Zhang, X.; Zhang, B.; Chen, J. Evolution of chain entanglements under large amplitude oscillatory shear flow and its effect on crystallization of isotactic polypropylene. Polymer 2020, 186, 121899. [Google Scholar] [CrossRef]
- Liu, M.; Chen, J.; Luo, J.; Min, J.; Fu, Q.; Zhang, J. Investigating the disentanglement of long chain branched polypropylene under different shear fields. J. Appl. Polym. Sci. 2022, 139, 51642. [Google Scholar] [CrossRef]
- Krajenta, J.; Safandowska, M.; Pawlak, A. The re-entangling of macromolecules in polypropylene. Polymer 2019, 175, 215–226. [Google Scholar] [CrossRef]
- Lezak, E.; Bartczak, Z. Experimental study of the formation of β- and γ-phase isotactic polypropylene and estimation of the phase composition by wide-angle X-ray scattering. Fibres Text. East. Eur. 2005, 53, 51–56. [Google Scholar]
- Lezak, E.; Bartczak, Z.; Galeski, A. Plastic deformation behavior of β-phase isotactic polypropylene in plane-strain compression at room temperature. Polymer 2006, 47, 8562–8574. [Google Scholar] [CrossRef]
- Turner-Jones, A.; Aizlewood, J.M.; Beckett, D.R. Crystalline forms of isotactic polypropylene. Makromol. Chem. 1964, 75, 134–158. [Google Scholar] [CrossRef]
- Strobl, G. The Physics of Polymers; Springer: Berlin/Heidelberg, Germany, 2007; Chapter 5. [Google Scholar]
- Karatrantos, A.; Composto, R.J.; Winey, K.I.; Kroger, M.; Clarke, N. Modeling of Entangled Polymer Diffusion in Melts and nanocomposites: A review. Polymers 2019, 11, 876. [Google Scholar] [CrossRef]
- Vega, J.F.; Rastogi, S.; Peters, G.W.M.; Meijer, H.E.H. Rheology and reptation of linear polymers. Ultrahigh molecular weight chain dynamics in the melt. J. Rheol. 2004, 48, 663–678. [Google Scholar] [CrossRef]
- Avrami, M. Kinetics of phase change. I General theory. J. Chem. Phys. 1939, 7, 1103–1112. [Google Scholar] [CrossRef]
- Mao, J.J.; Jiang, Y.-Z.; Zhou, P.-Z.; Li, Y.; Zhang, Y.-F. Nucleus density and crystallization behavior of isotactic polypropylene nucleated with different α/β compound nucleating agents. J. Therm. Anal. Calorim. 2020, 140, 2275–2282. [Google Scholar] [CrossRef]
- Varga, J.; Stoll, K.; Menyhard, A.; Horvath, Z. Crystallization of Isotactic Polypropylene in the Presence of a β-Nucleating Agent Based on a Trisamide of Trimesic Acid. J. Appl. Polym. Sci. 2011, 121, 1469–1480. [Google Scholar] [CrossRef]
- Mandelkern, L. Crystallization of Polymers. Vol 2 Kinetics and Mechanisms, 2nd ed.; Cambridge University Press: Cambridge, UK, 2004; p. 19. [Google Scholar]
- Lorenzo, A.T.; Arnal, M.L.; Albuerne, J.; Muller, A.J. DSC isothermal polymer crystallization kinetics measurements and the use of the Avrami equation to fit the data: Guidelines to avoid common problems. Polym. Test. 2007, 26, 222–231. [Google Scholar] [CrossRef]
- Varga, J.; Ehrenstein, G.W. High-temperature hedritic crystallization of the β-modification of isotactic polypropylene. Colloid Polym. Sci. 1997, 275, 511–519. [Google Scholar] [CrossRef]
- Hussein, M.; Strobl, G. The Melting Line, the Crystallization Line, and the Equilibrium Melting Temperature of Isotactic Polystyrene. Macromolecules 2002, 35, 1672–1676. [Google Scholar] [CrossRef]
- Toda, A.; Taguchi, K.; Nozaki, K. Gibbs–Thomson, Thermal Gibbs–Thomson, and Hoffman–Weeks Plots of Polyethylene Crystals Examined by Fast-Scan Calorimetry and Small-Angle X-ray Scattering. Cryst. Growth Des. 2019, 19, 2493–2502. [Google Scholar] [CrossRef]
- Strobl, G. Crystallization and melting of bulk polymers: New observations, conclusions and a thermodynamic scheme. Prog. Polym. Sci. 2006, 31, 398–442. [Google Scholar] [CrossRef]
- Marand, H.; Xu, J.; Srinivas, S. Determination of the Equilibrium Melting Temperature of Polymer Crystals: Linear and Nonlinear Hoffman-Weeks Extrapolations. Macromolecules 1998, 31, 8219–8229. [Google Scholar] [CrossRef]
- Krajenta, J.; Polińska, M.; Lapienis, G.; Pawlak, A. The crystallization of poly(ethylene oxide) with limited density of macromolecular entanglements. Polymer 2020, 197, 122500. [Google Scholar] [CrossRef]
- Hoffman, J.D.; Davis, G.T.; Lauritzen, J.I., Jr. The Rate of crystallization of linear Polymers with Chain Folding. In Treatise on Solid State Chemistry. Volume 3. Crystalline and Noncrystalline Solids; Hannay, N.B., Ed.; Plenum Press: New York, NY, USA, 1976; pp. 497–614. [Google Scholar] [CrossRef]
- Clark, E.J.; Hoffman, J.D. Regime III Crystallization in Polypropylene. Macromolecules 1984, 17, 878–885. [Google Scholar] [CrossRef]
- Assouline, E.; Pohl, S.; Fulchiron, R.; Gerard, J.-F.; Lustiger, A.; Wagner, H.D.; Marom, G. The kinetics of α and β transcrystallization in fibre-reinforced polypropylene. Polymer 2000, 41, 7843–7854. [Google Scholar] [CrossRef]


| Abbreviation | Macromolecular Entanglement | Content of Nucleant, wt.% |
|---|---|---|
| PPi | initial, equilibrium entangled | 0 |
| PPi_02 | initial, equilibrium entangled | 0.2 |
| PPd | partially disentangled | 0 |
| PPd_02 | partially disentangled | 0.2 |
| Sample | I Heating | Cooling | II Heating | |||||
|---|---|---|---|---|---|---|---|---|
| Tm β [°C] | Tm α [°C] | Hm [J/g] | Tc [°C] | Hc [J/g] | Tm β [°C] | Tm α [°C] | Hm [J/g] | |
| Rate: 10 °C/min | ||||||||
| PPi | - | 165 ± 1 | 90 ± 2 | 116 ± 1 | 89 ± 2 | 147 ± 1 | 161 ± 1 | 87 ± 2 |
| PPd | - | 165 ± 1 | 103 ± 2 | 118 ± 1 | 89 ± 2 | 148 ± 1 | 162 ± 1 | 95 ± 2 |
| PPi_02 | 148 ± 1 | 165 ± 1 | 93 ± 2 | 124 ± 1 | 84 ± 2 | 151 ± 1 | 164 ± 1 | 93 ± 2 |
| PPd_02 | 146 ± 1 | 165 ± 1 | 94 ± 2 | 125 ± 1 | 89 ± 2 | 150 ± 1 | 162 ± 1 | 91 ± 2 |
| Rate: 30 °C/min | ||||||||
| PPi_02 | 158 ± 1 | 93 ± 2 | 115 ± 1 | 84 ± 2 | 154 ± 1 | 92 ± 2 | ||
| PPd_02 | 158 ± 1 | 95 ± 2 | 115 ± 1 | 92 ± 2 | 156 ± 1 | 93 ± 2 | ||
| Rate: 50 °C/min | ||||||||
| PPi_02 | 161 ± 1 | 93 ± 2 | 111 ± 1 | 83 ± 2 | 158 ± 1 | 90 ± 2 | ||
| PPd_02 | 162 ± 1 | 94 ± 2 | 112 ± 1 | 83 ± 2 | 156 ± 1 | 88 ± 2 | ||
| Material | Cooling Rates during Crystallization | ||
|---|---|---|---|
| 10 °C/min | 30 °C/min | 50 °C/min | |
| PPi | 0.02 ± 0.01 | 0.02 ± 0.01 | 0.02 ± 0.01 |
| PPd | 0.02 ± 0.01 | 0.05 ± 0.01 | 0.02 ± 0.01 |
| PPi_02 | 0.76 ± 0.02 | 0.81 ± 0.02 | 0.84 ± 0.03 |
| PPd_02 | 0.77 ± 0.02 | 0.81 ± 0.02 | 0.83 ± 0.02 |
| Sample | T = 135 °C | T = 140 °C | T = 145 °C |
|---|---|---|---|
| PPd_02 | 0.70 ± 0.02 | 0.61 ± 0.02 | 0.09 ± 0.01 |
| PPi_02 | 0.74 ± 0.02 | 0.62 ± 0.02 | 0.19 ± 0.02 |
| Sample | 135 °C | 140 °C | 145 °C | |||
|---|---|---|---|---|---|---|
| n | z | n | z | n | z | |
| PPd_02 | 3.0 | 3.0 × 10⁻² | 3.6 | 8.1 × 10⁻⁵ | 3.8 | 0.9 × 10⁻⁷ |
| PPi_0.2 | 3.4 | 5.3 × 10⁻³ | 3.4 | 4.3 × 10⁻⁵ | 3.6 | 1.3 × 10⁻⁷ |
| PPd | 2.9 | 5.3 × 10⁻⁴ | 3.5 | 0.8 × 10⁻⁶ | ||
| PPi | 3.1 | 6.8 × 10⁻⁴ | 3.7 | 1.5 × 10⁻⁶ | ||
| Sample | T = 135 °C | T = 140 °C | T = 145 °C | |||
|---|---|---|---|---|---|---|
| G′ [µm/min] | N [m−3] | G′ [µm/min] | N [m−3] | G′ [µm/min] | N [m−3] | |
| PPd_02 | 5.8 | 1.5 × 10¹⁴ | 1.8 | 1.4 × 10¹³ | 0.6 | 4.2 × 10¹¹ |
| PPi_02 | 5.1 | 4.0 × 10¹³ | 1.7 | 8.8 × 10¹² | 0.6 | 6.0 × 10¹¹ |
| PPd | 4.9 | 4.5 × 10¹² | 1.5 | 2.6 × 10¹¹ | ||
| PPi | 4.4 | 8.0 × 10¹² | 1.4 | 5.5 × 10¹¹ | ||
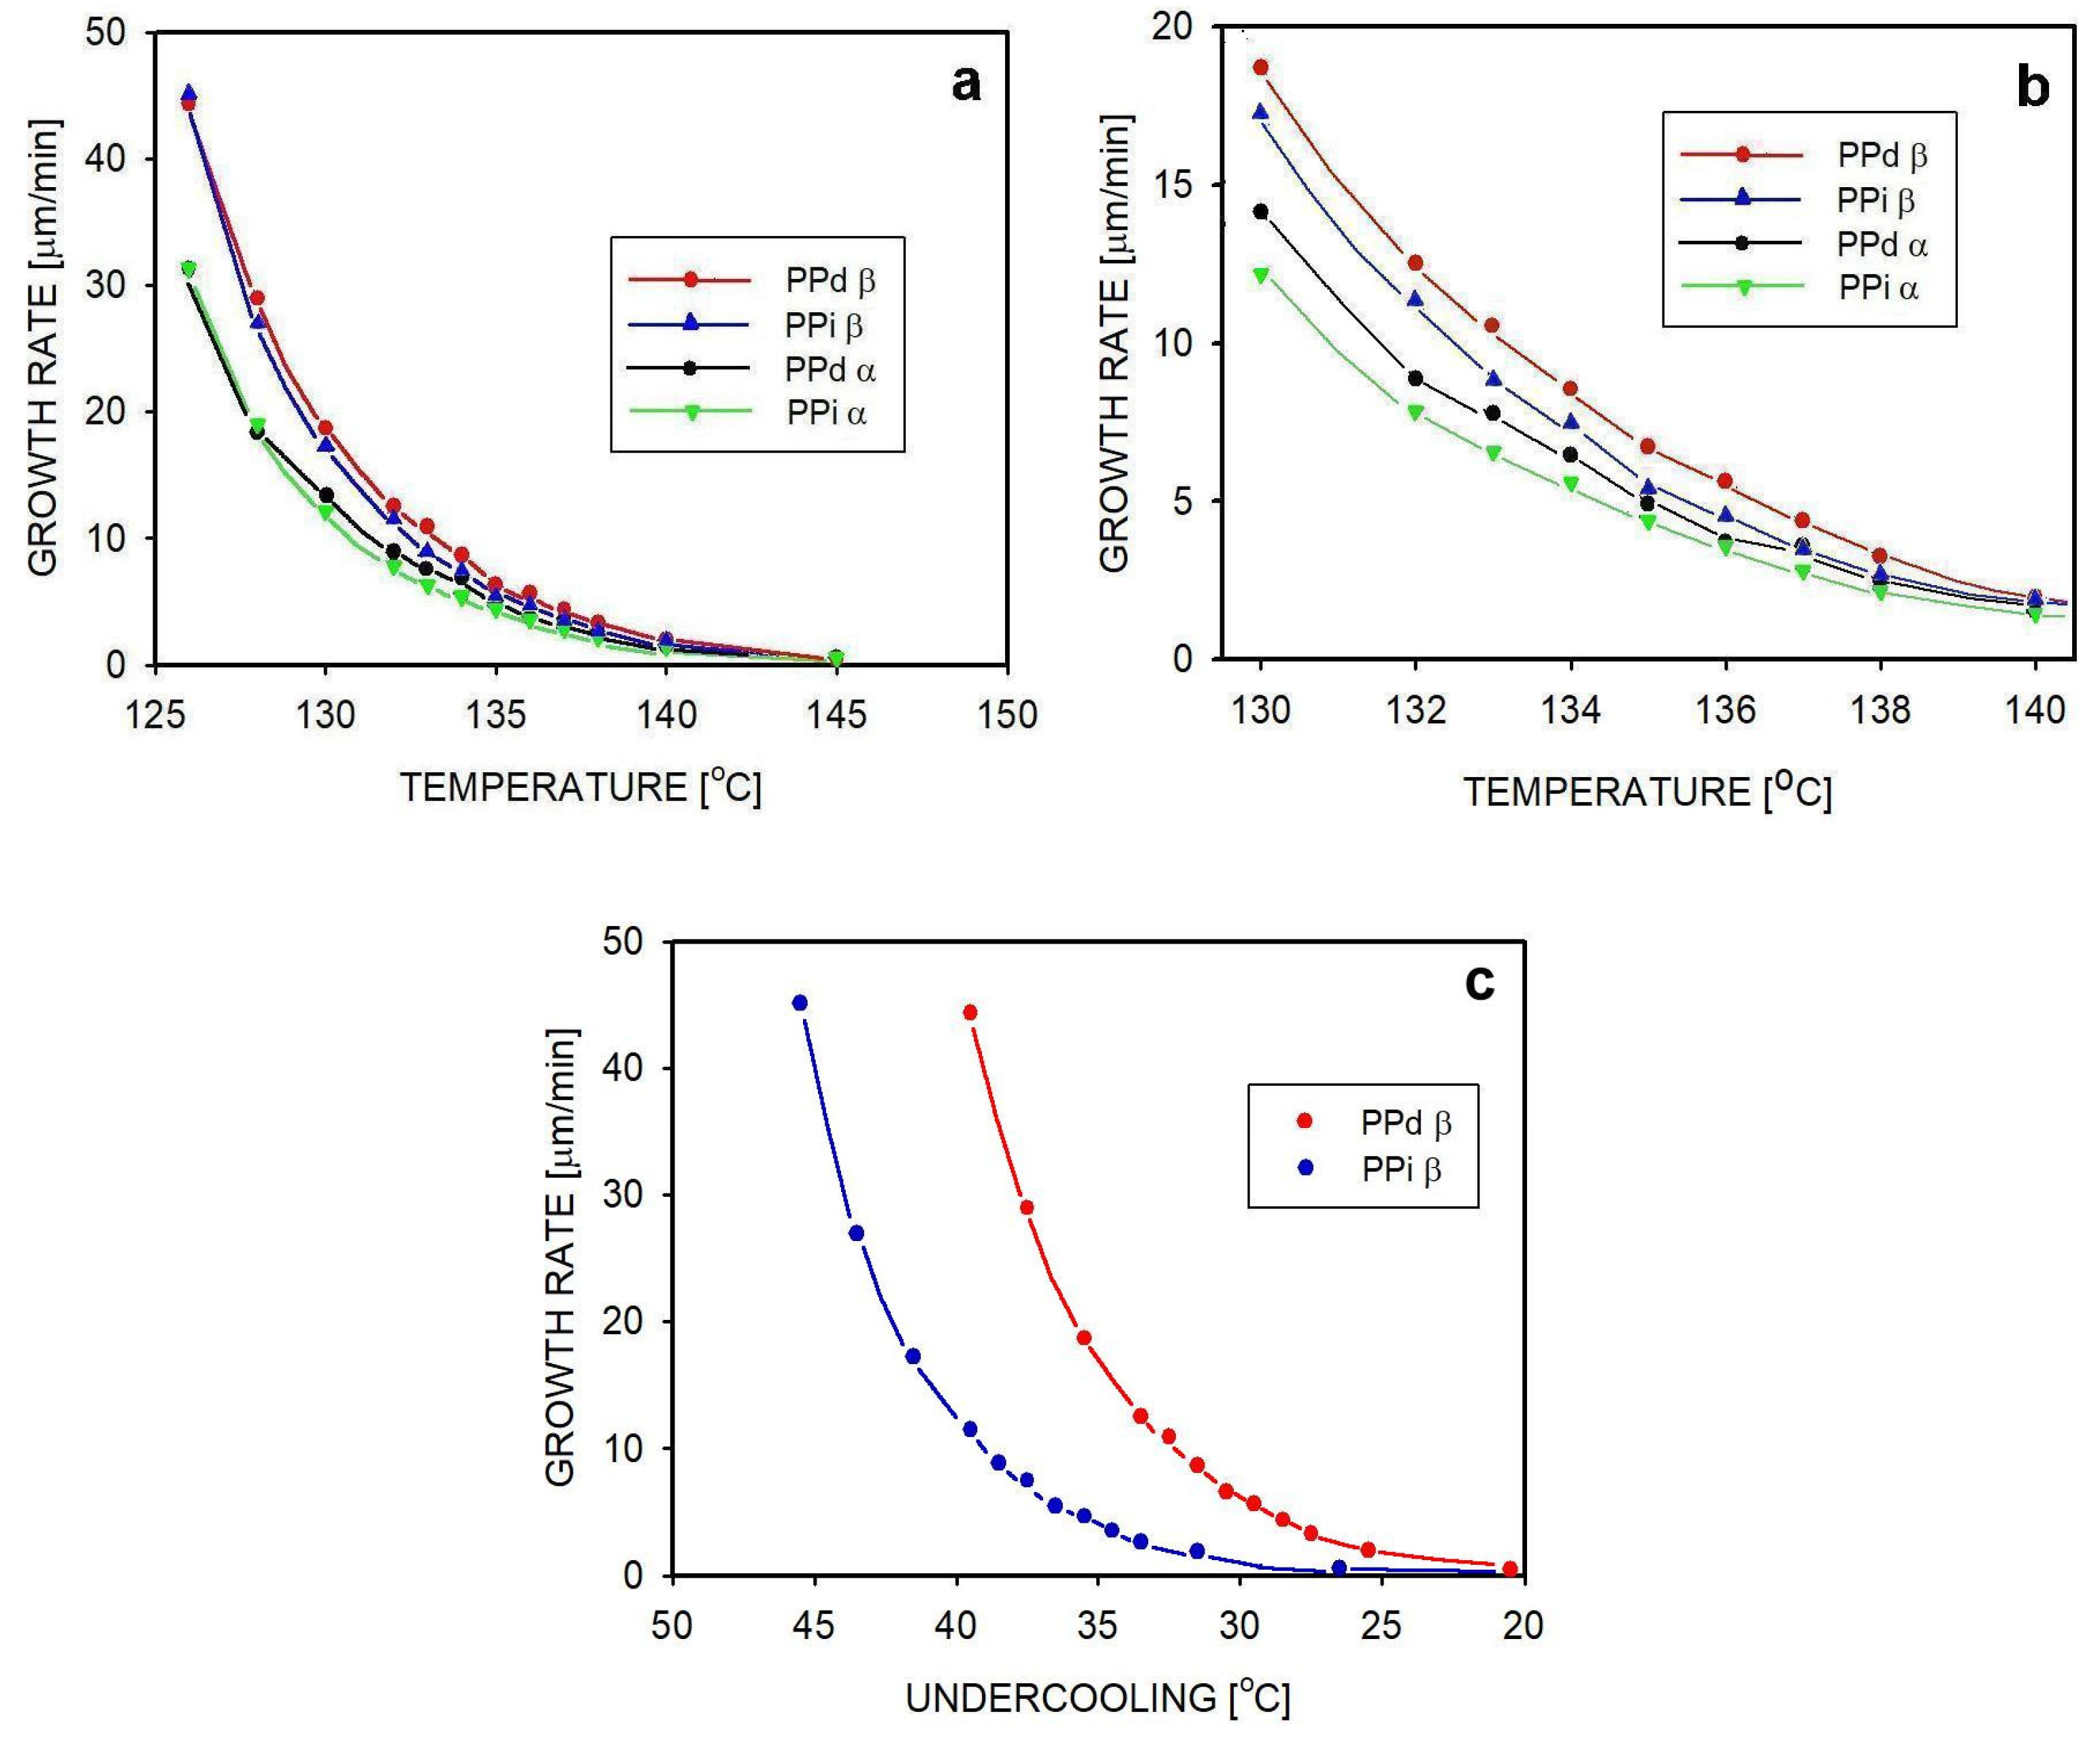
| Temperature [°C] | Gα [µm/min] | Gβ [µm/min] | ||
|---|---|---|---|---|
| PPi_02 | PPd_02 | PPi_02 | PPd_02 | |
| 126 | 31.3 ± 0.6 | 31.3 ± 0.7 | 45.1 ± 0.7 | 44.4 ± 0.8 |
| 130 | 12.2 ± 0.5 | 14.1 ± 0.6 | 17.2 ± 0.5 | 18.7 ± 0.6 |
| 135 | 4.4 ± 0.2 | 4.9 ± 0.4 | 5.4 ± 0.3 | 6.3 ± 0.4 |
| 140 | 1.4 ± 0.1 | 1.5 ± 0.1 | 1.9 ± 0.1 | 2.0 ± 0.2 |
| 145 | 0.6 ± 0.1 | 0.6 ± 0.1 | 0.6 ± 0.1 | 0.5 ± 0.1 |
Disclaimer/Publisher’s Note: The statements, opinions and data contained in all publications are solely those of the individual author(s) and contributor(s) and not of MDPI and/or the editor(s). MDPI and/or the editor(s) disclaim responsibility for any injury to people or property resulting from any ideas, methods, instructions or products referred to in the content. |
© 2024 by the authors. Licensee MDPI, Basel, Switzerland. This article is an open access article distributed under the terms and conditions of the Creative Commons Attribution (CC BY) license (https://creativecommons.org/licenses/by/4.0/).
Share and Cite
Krajenta, J.; Pawlak, A. Crystallization of the β-Form of Polypropylene from the Melt with Reduced Entanglement of Macromolecules. Polymers 2024, 16, 1710. https://doi.org/10.3390/polym16121710
Krajenta J, Pawlak A. Crystallization of the β-Form of Polypropylene from the Melt with Reduced Entanglement of Macromolecules. Polymers. 2024; 16(12):1710. https://doi.org/10.3390/polym16121710
Chicago/Turabian StyleKrajenta, Justyna, and Andrzej Pawlak. 2024. "Crystallization of the β-Form of Polypropylene from the Melt with Reduced Entanglement of Macromolecules" Polymers 16, no. 12: 1710. https://doi.org/10.3390/polym16121710