
Mechanical Properties of Additively Manufactured Polymeric Materials—PLA and PETG—For Biomechanical Applications

 ,
,  , , , , , , and
Abstract
:1. Introduction
2. Materials and Methods
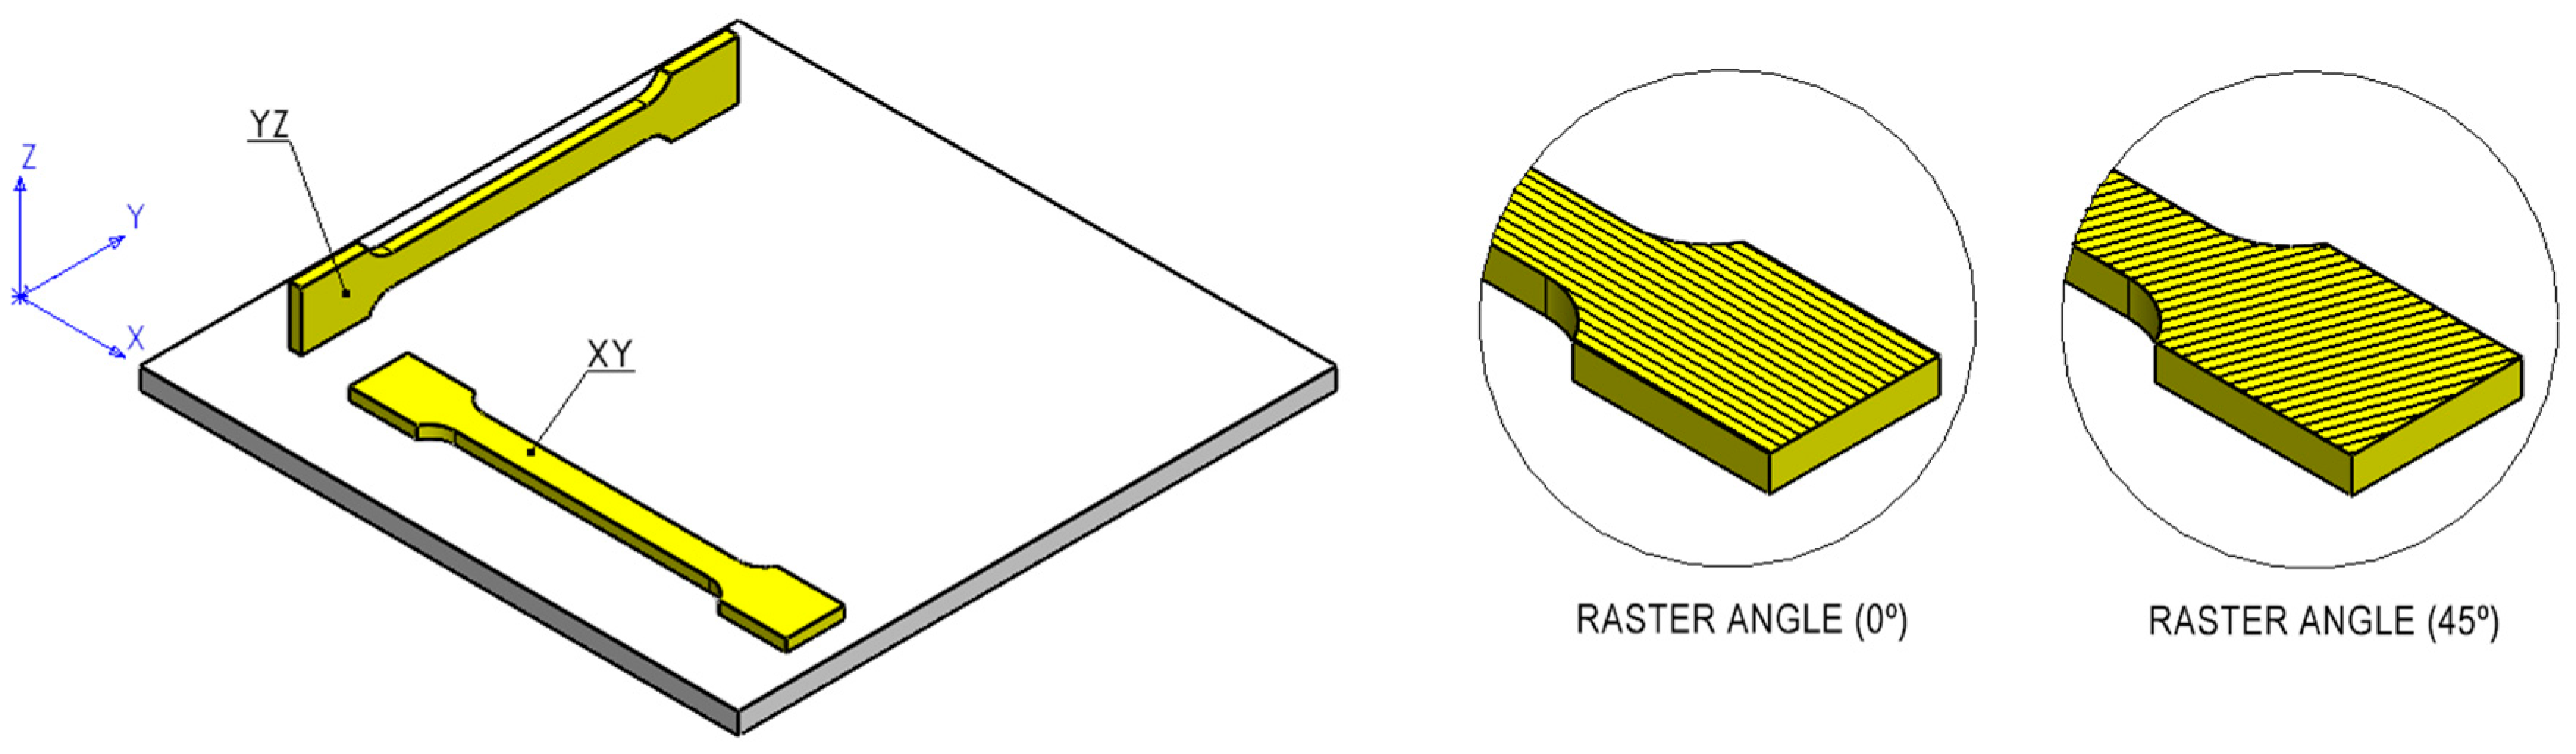
2.1. Uniaxial Tensile Tests and Fatigue Tests
2.2. TGA/DSC Samples
2.3. X-ray Computed Tomography (XCT)
2.4. SEM Images and Fractographic Analyses
3. Results and Discussion
3.1. Uniaxial Tensile Quasi-Static Tests
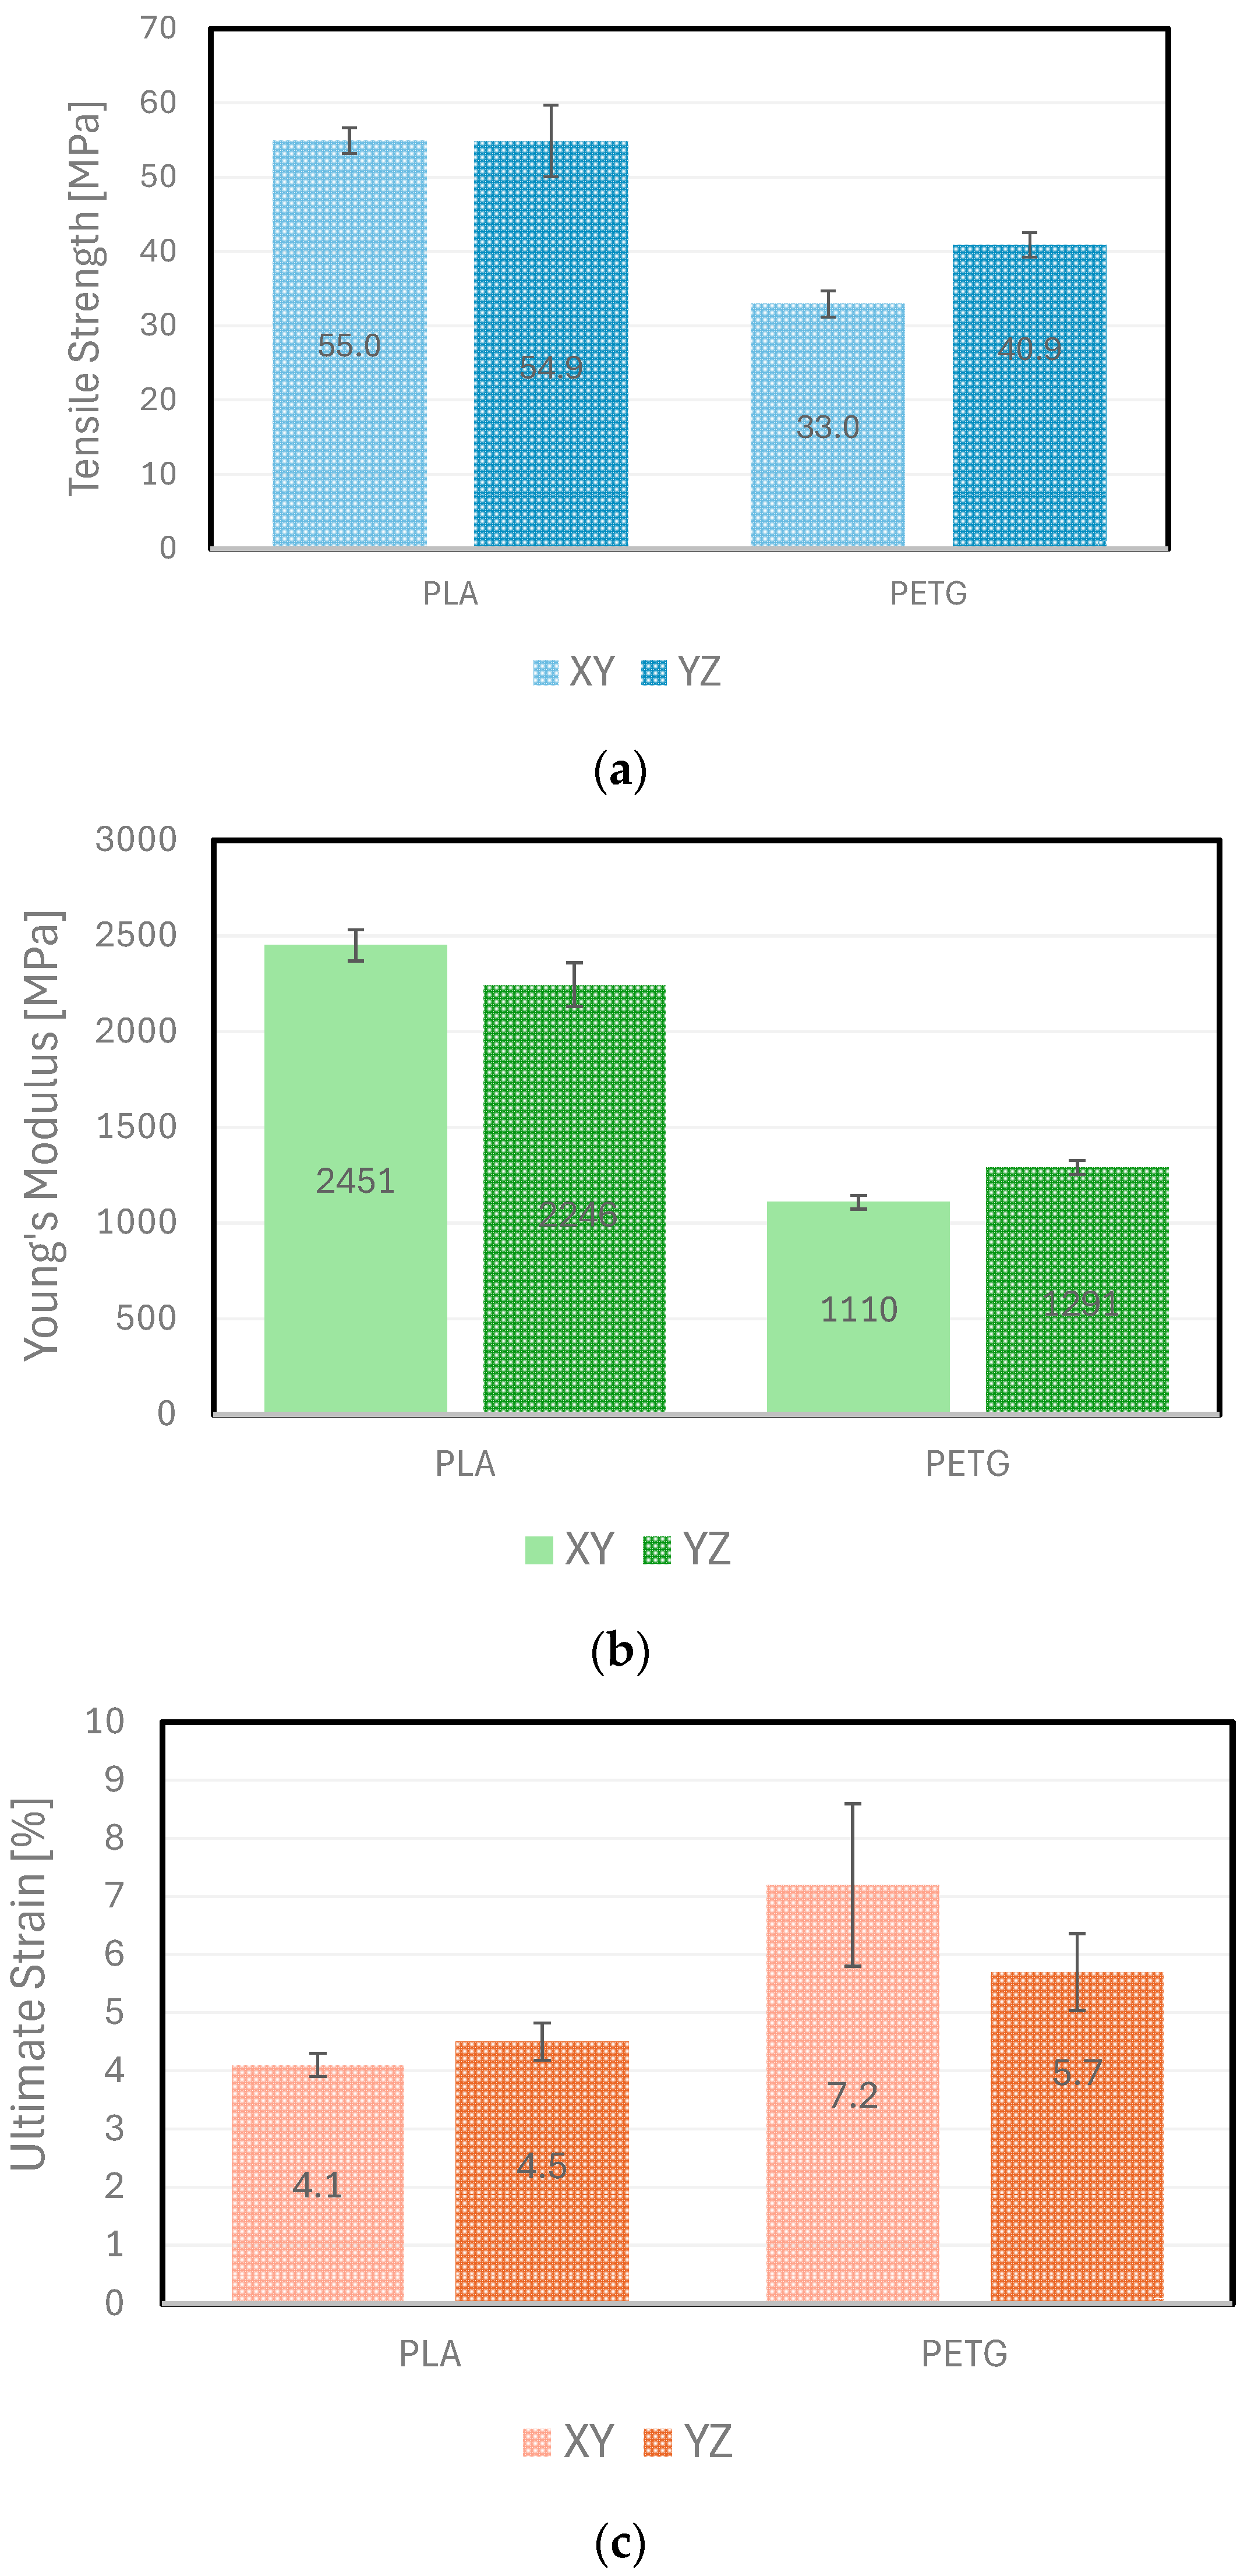
- For the XY and YZ printing directions, the Tensile Strength and Young’s Modulus (average values) obtained for PLA (55 MPa|2350 MPa) were higher than the corresponding values obtained for PETG (37 MPa|1200 MPa) by approximately 48% and 96%, respectively;
- PLA may, therefore, be used for components under induced stresses up to 55 MPa and when greater rigidity is required, as PLA revealed higher Young’s Modulus values (average value: 2300 MPa);
- PETG may be used for components under induced stresses up to 33 MPa and when higher deflections are allowed, since PETG revealed lower Young’s Modulus values (average value: 1200 MPa);
- The average ultimate strain values obtained for PLA and PETG, either printed along XY or YZ, were around 4.3% and 6.5%, respectively. Therefore, PETG showed more ductile behaviour than PLA;
- The experimental results obtained for PETG and PLA were in the same order of magnitude of the manufacturer’s specifications [17], with deviations of −18%, and +22%, respectively. However, it is important to stress that the manufacturer’s values are typically provided for the XZ orientation, while the tests were conducted in the XY and the YZ planes;
- Moreover, comparing the mechanical properties of PLA and PETG with other polymeric materials, the tensile strength value of ULTEM® 9085 was the highest of the common AM polymeric materials tested and was about 70 MPa [23]; a second group of materials—PC and PLA—demonstrated tensile strength values around 55 MPa [24,25]; a third group included ASA, PP, ABS, and PETG, with tensile strength values of approximately 35 MPa [24,25]; and a fourth group of materials included Nylon and Copolyester with tensile strength values of about 20 MPa [25]. Therefore, the experimental tensile strength results (Table 1 and Figure 3) compare well with the published data [23,24,25].
- The differences between the Young’s Moduli for the different polymeric materials referred to above were around 1500 MPa [24,25]. In fact, PLA revealed the highest Young’s Modulus values (around 2600 MPa [24,25], which were similar to the average value of 2350 MPa presented in Table 1 and Figure 3, and ASA/Nylon/Copolyester revealed the lowest (500 MPa) [25]. PETG Young’s Modulus was about 1500 MPa [25], which also compares reasonably well with the experimental data (1200 MPa, Table 1 and Figure 3).
3.2. Uniaxial Tensile Fatigue Tests
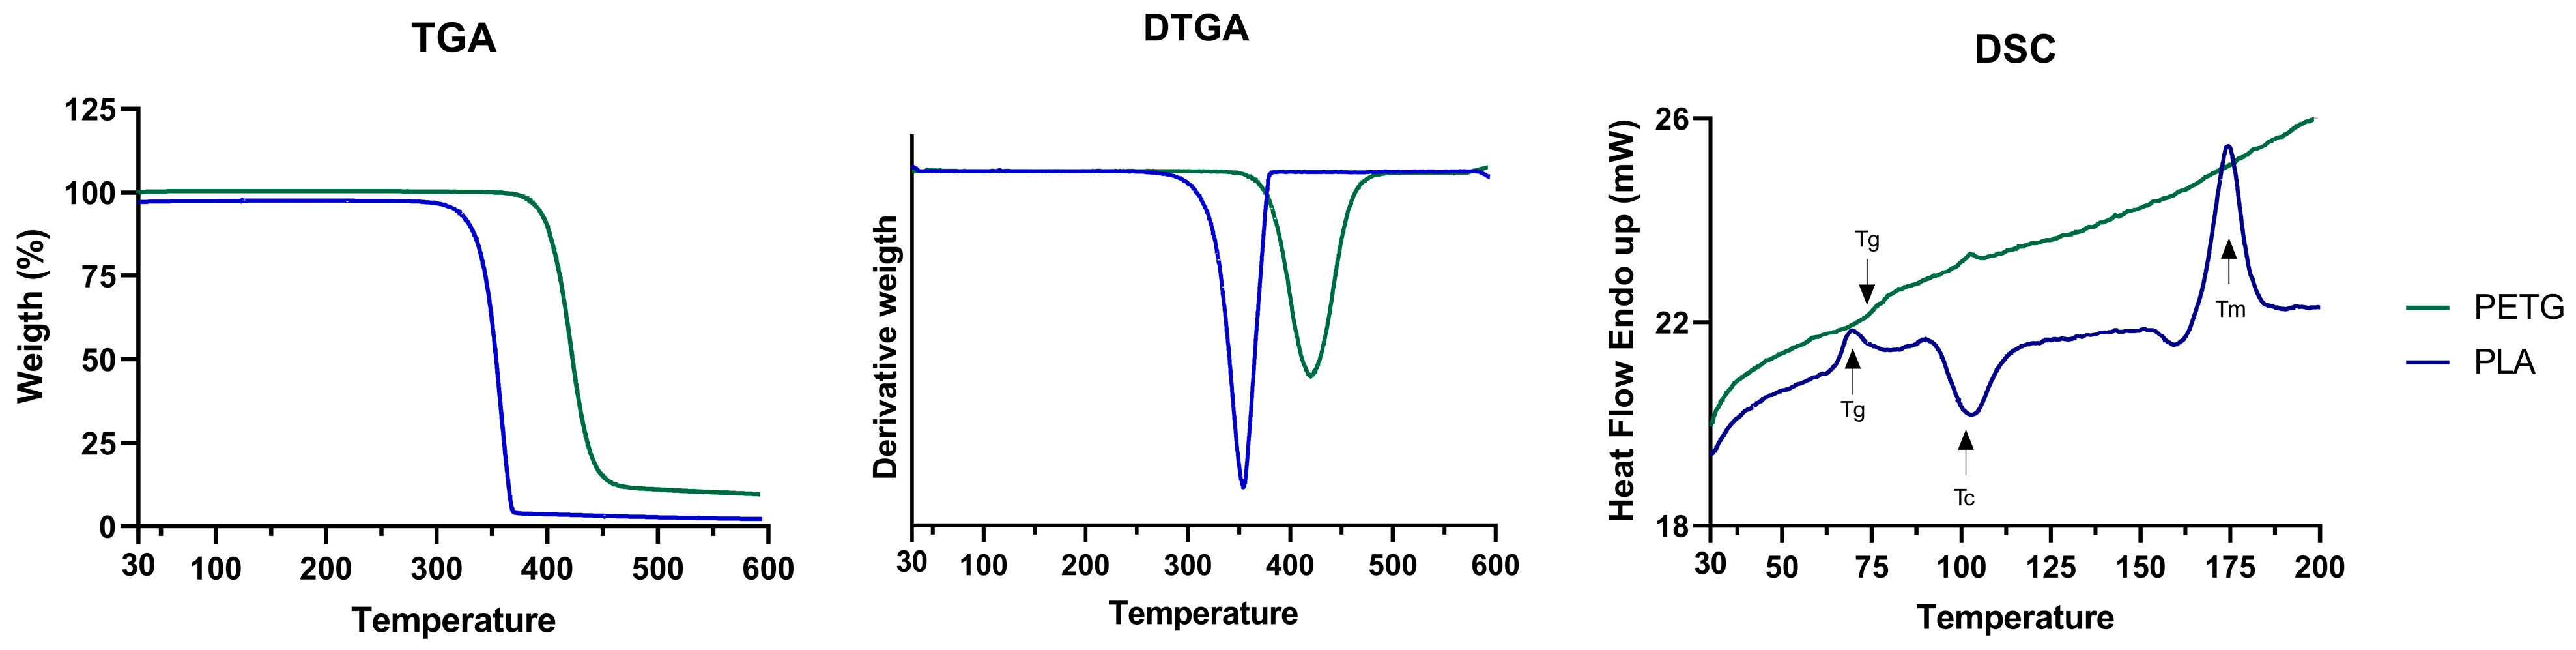
3.3. TGA/DSC Results
3.4. XCT Results
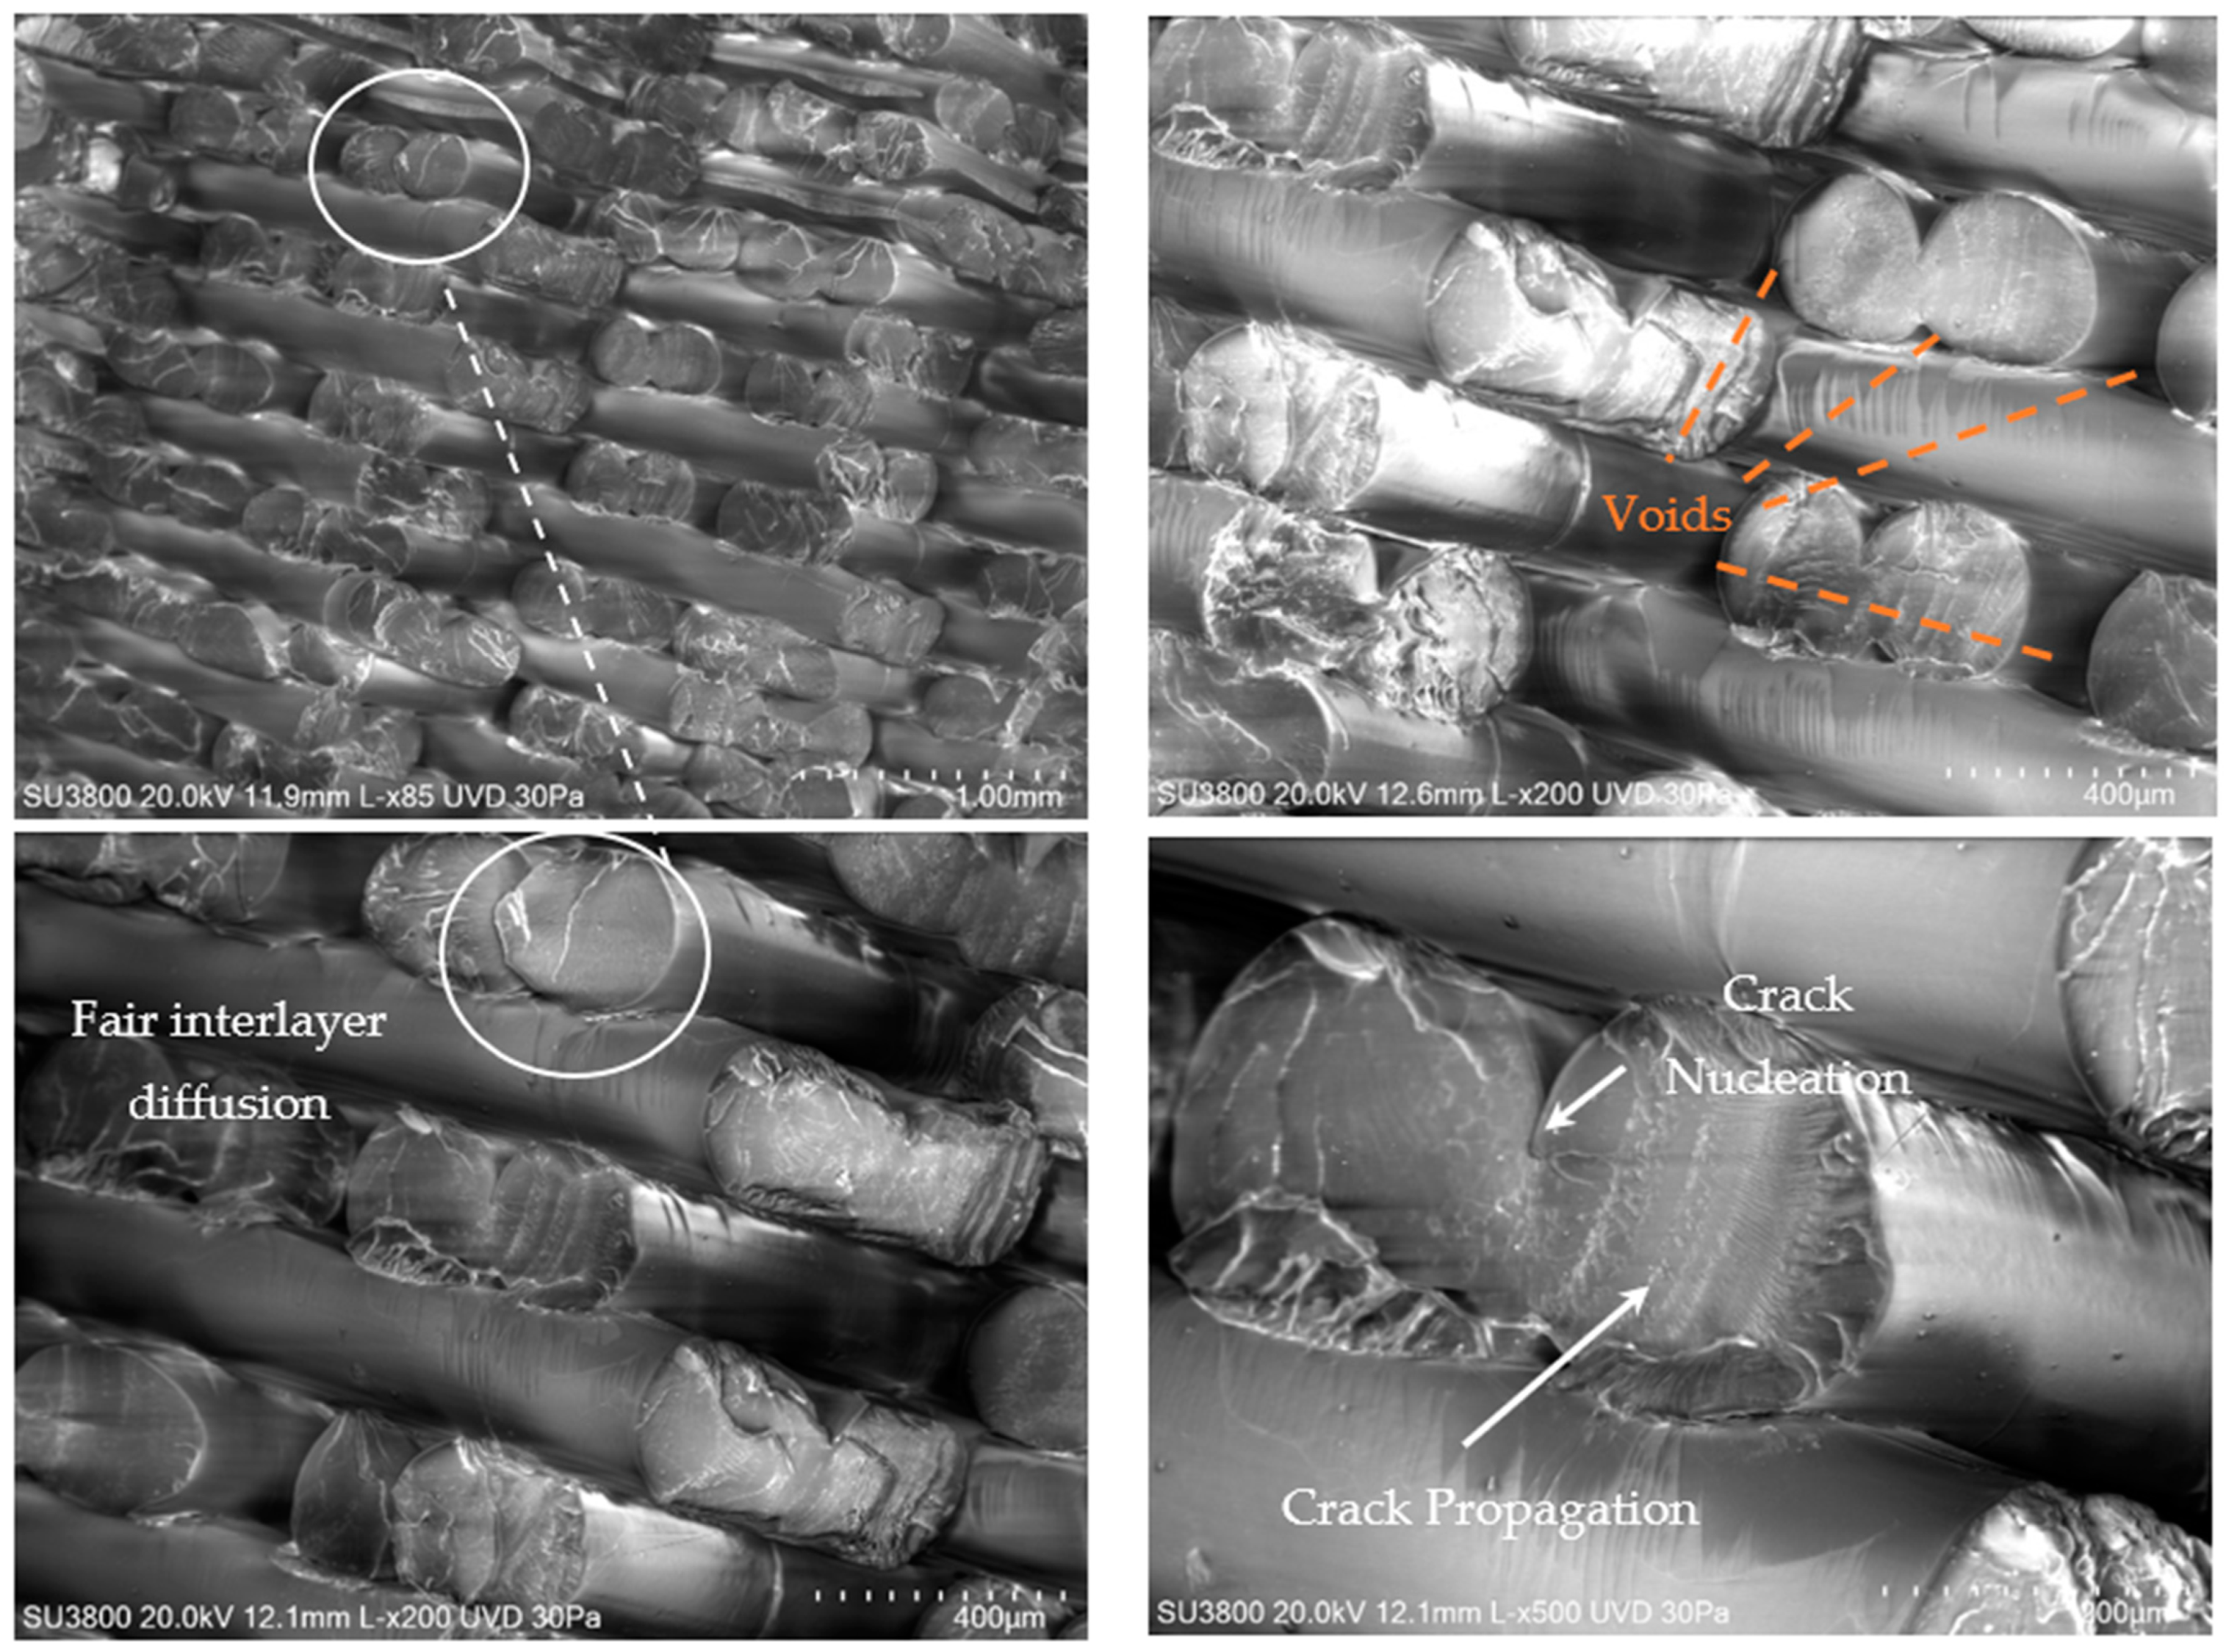
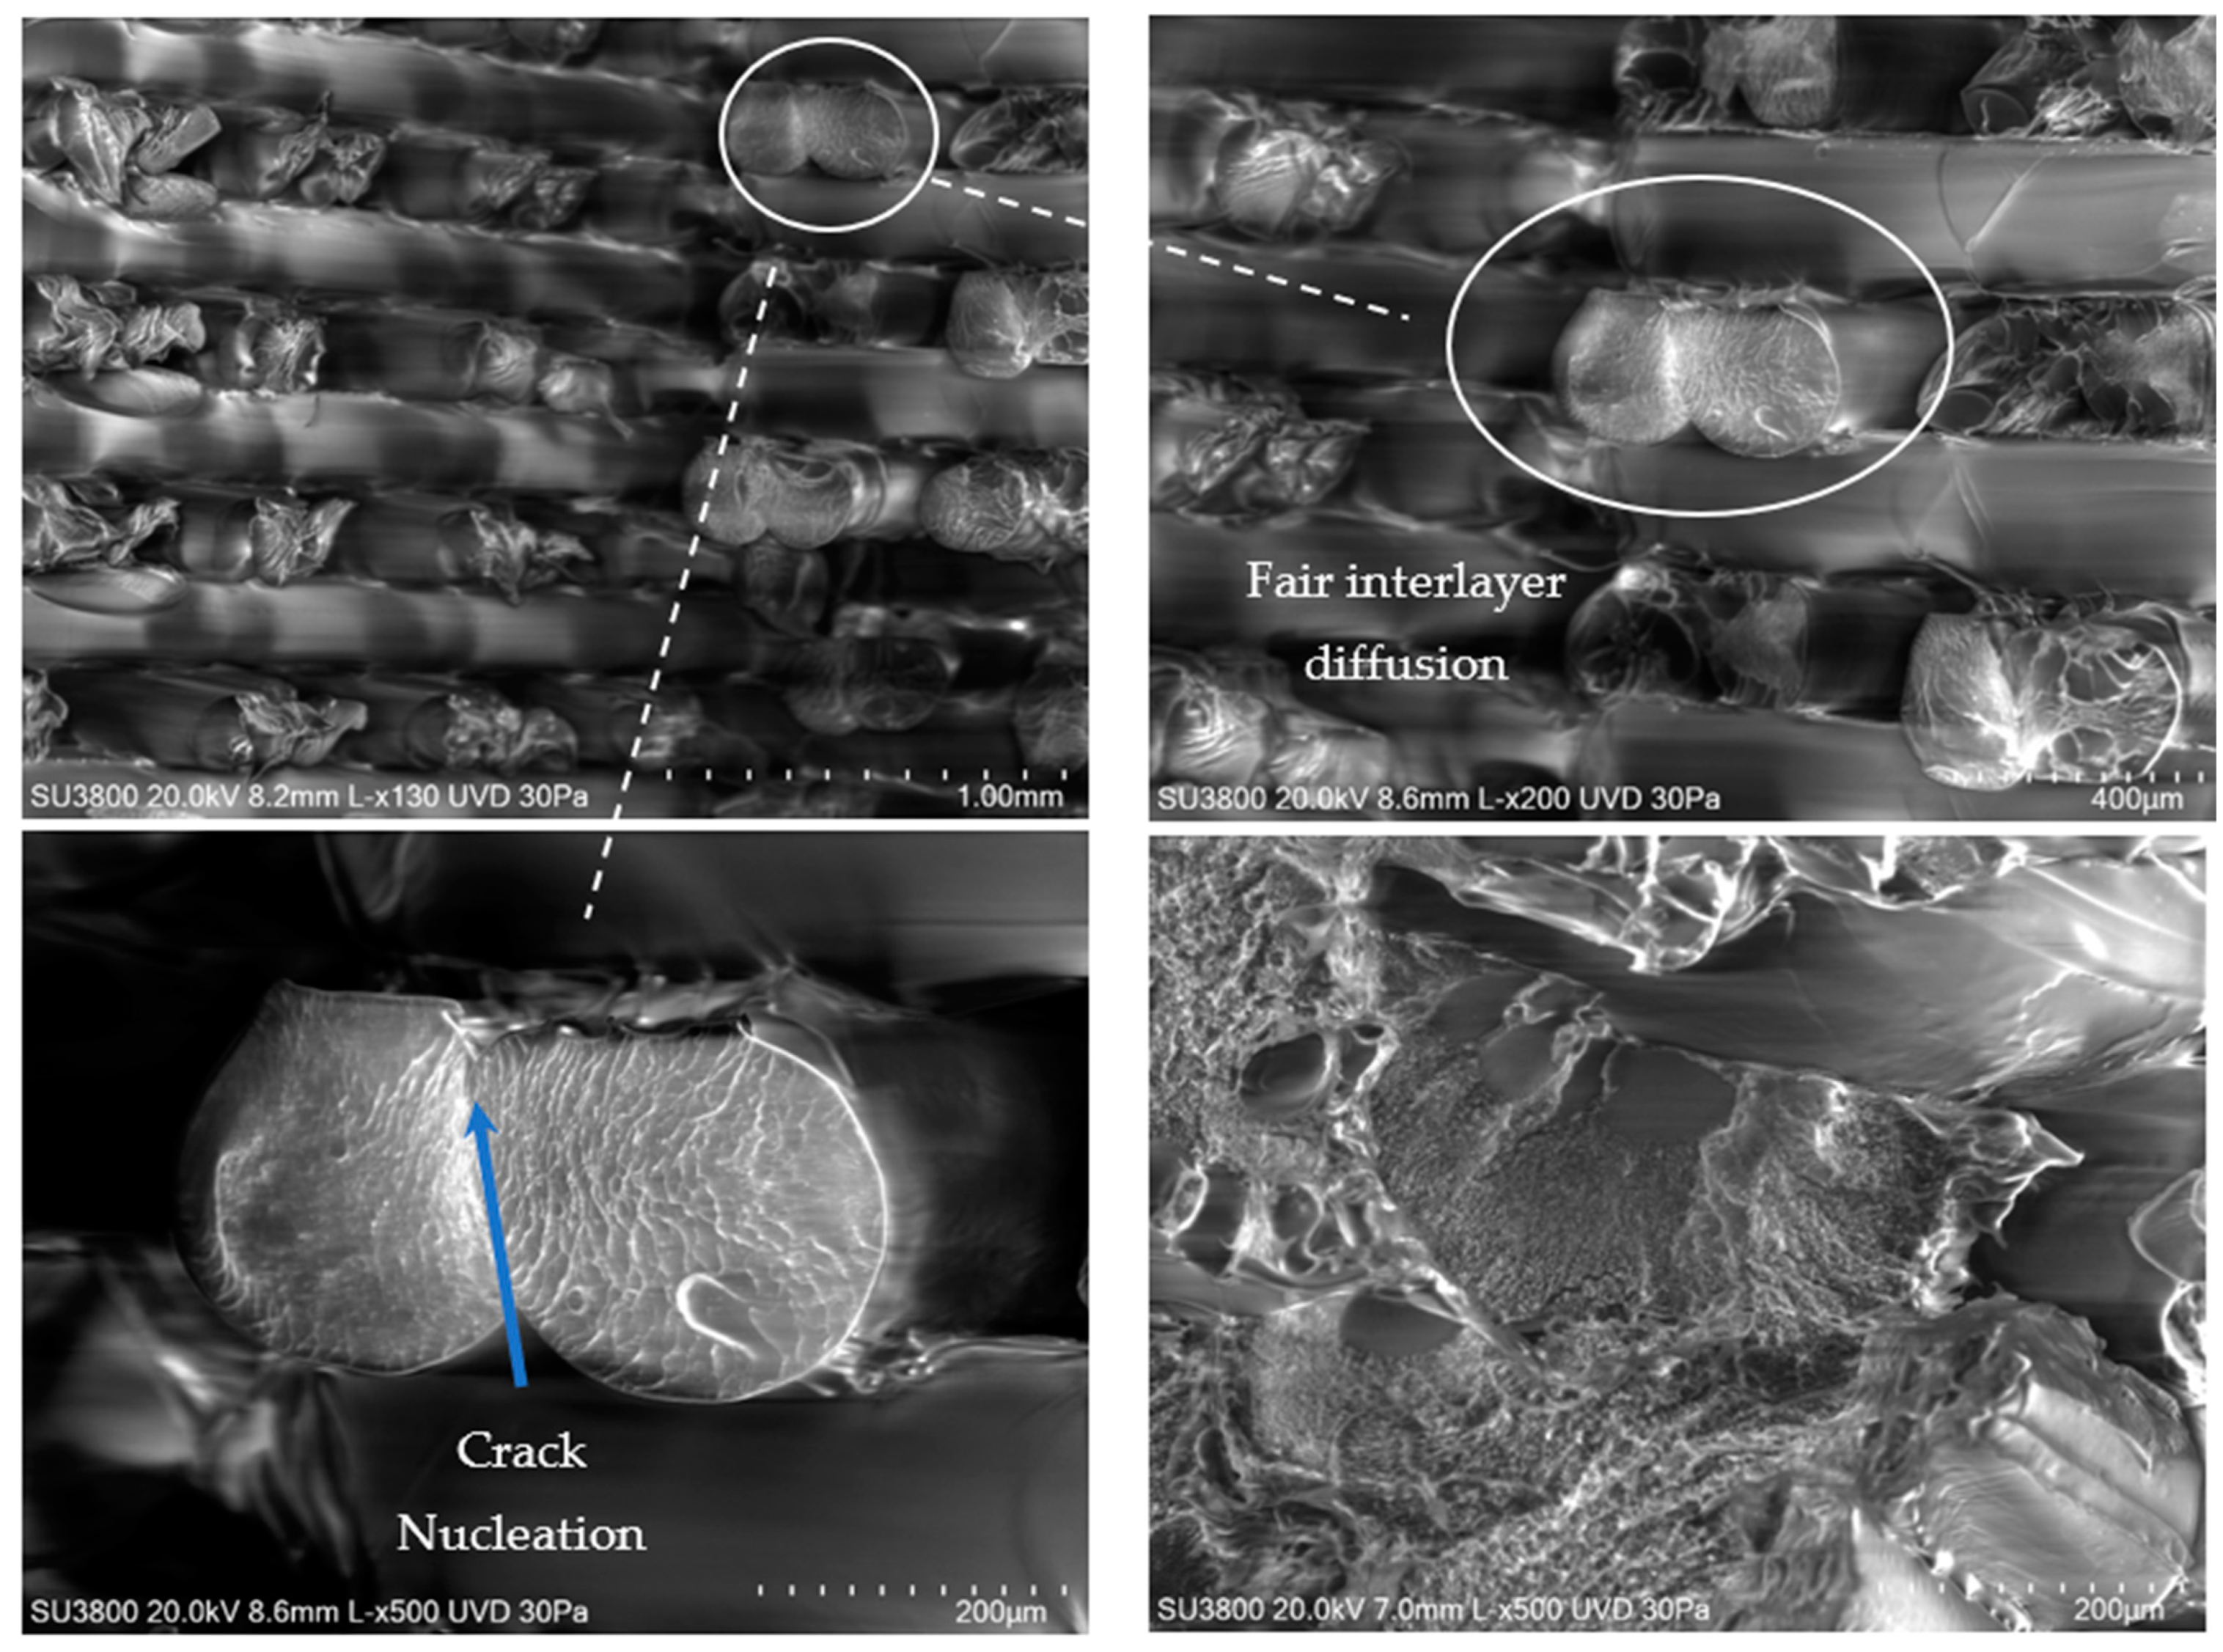
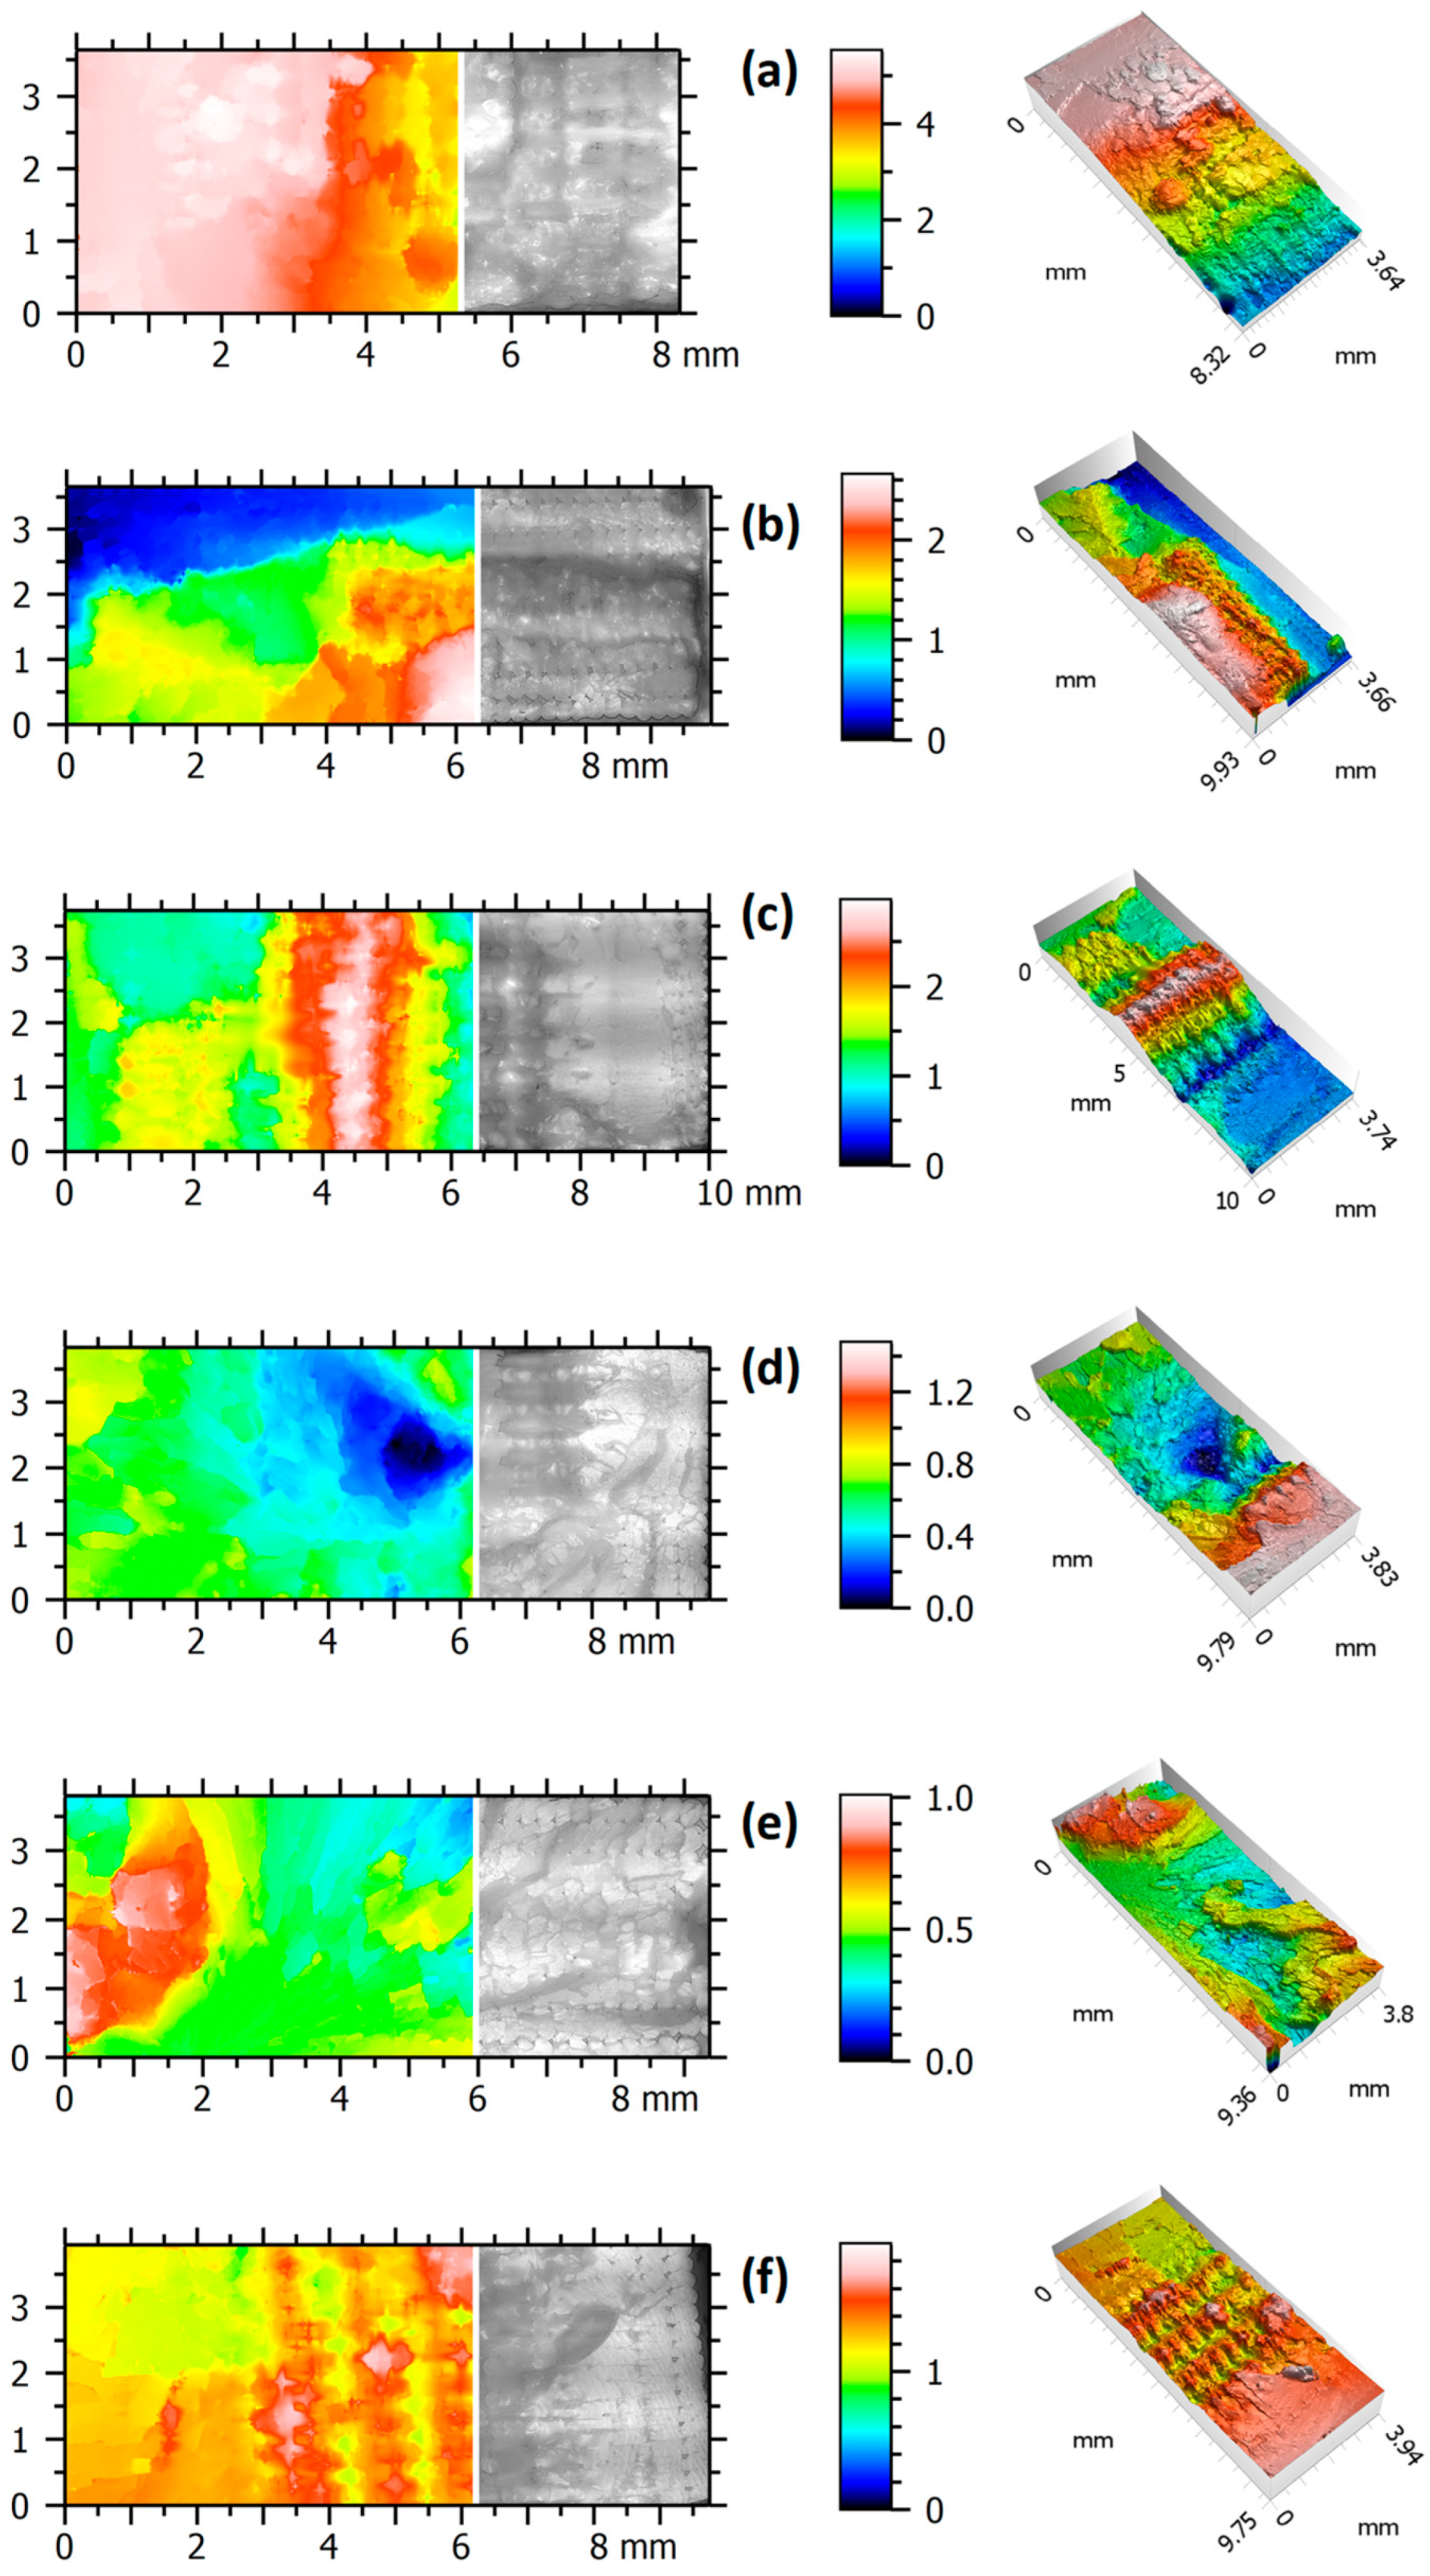
3.5. SEM and Fractography Results
4. Conclusions
- The uniaxial tensile tests yielded valuable data, including critical parameters, such as the maximum Tensile Strength, Young’s Modulus, and Ultimate Strain, for two printing orientations (XY and YZ). These results suggest that all materials studied exhibited promising mechanical characteristics suitable for general biomechanical use;
- For the XY and YZ printing directions, the Tensile Strength and Young’s Modulus (average values) obtained for PLA (55 MPa|2350 MPa) were higher than the corresponding values obtained for PETG (37 MPa|1200 MPa) by approximately 48% and 96%, respectively;
- PLA may, therefore, be used for components under induced stresses or up to 55 MPa and when greater rigidity is required, as PLA revealed higher Young’s Modulus values (around 2300 MPa);
- PETG may be used for components under induced stresses up to 33 MPa and when higher deflections are allowed, since PETG revealed lower Young’s Modulus values (around 1200 MPa);
- The average ultimate strain values obtained for PLA and PETG, either printed along XY or YZ, were around 4.3% and 6.5%, respectively. Therefore, PETG showed more ductile behaviour than PLA;
- In addition, uniaxial tensile fatigue testing (R = 0.2) under load control was conducted on the PLA and PETG materials at three stress levels, with the results depicted in the form of stress–life (S-N) curves. These curves may point to the suitability of these materials for continuous and durable use in biomechanical applications depending on the spectrum loading applied;
- XCT, SEM, and fractography analyses of the tested materials uncovered essential features, including fibre arrangements, compression issues related to interlayer adhesion and hatch distance, voids within fibre connections, and failure mechanisms;
- The surface topography parameters for the PETG specimens had higher values than PLA, irrespective of the printing direction or type of loading.
Author Contributions
Funding
Institutional Review Board Statement
Data Availability Statement
Conflicts of Interest
Abbreviations
| ASA | Acrylonitrile Styrene Acrylate |
| AM | Additive Manufacturing |
| FFF | Fused Filament Fabrication |
| HCF | High-cycle Fatigue |
| ME | Material Extrusion |
| PC | Polycarbonate |
| PETG | Polyethylene Terephthalate Glycol |
| PLA | Polylactic Acid |
| PP | Polypropylene |
| VOI | Volume-of-Interest |
References
- Özkaya, N.; Leger, D.; Goldsheyder, D.; Nordin, M. Fundamentals of Biomechanics: Equilibrium, Motion, and Deformation, 4th ed.; Springer: Cham, Switzerland, 2017. [Google Scholar] [CrossRef]
- Badiru, A.B.; Valencia, V.V.; Liu, D. Additive Manufacturing Handbook; CRC Press: Boca Raton, FL, USA, 2017. [Google Scholar] [CrossRef]
- Bergmann, G.; Graichen, F.; Rohlmann, A. Hip joint loading during walking and running, measured in two patients. J. Biomech. 1993, 26, 969–990. [Google Scholar] [CrossRef] [PubMed]
- Black, J. Biological Performance of Materials: Fundamentals of Biocompatibility, 2nd ed.; Marcel Dekker Inc.: New York, NY, USA, 1992; ISBN 10: 0824784391. [Google Scholar]
- Rendas, P.; Imperadeiro, A.; Martins, R.F.; Soares, B.A.R. High-Cycle Fatigue Behaviour of Polyetheretherketone (PEEK) Produced by Additive Manufacturing. Polymers 2024, 16, 18. [Google Scholar] [CrossRef] [PubMed]
- Camacho, J.; Martins, R.F.; Branco, R.; Raimundo, A.; Malça, C. The influence of printing strategies on fatigue crack growth behavior of an additively manufactured AISI 316L stainless steel. Fatigue Fract. Eng. Mater. Struct. 2023, 46, 3953–3965. [Google Scholar] [CrossRef]
- Martins, R.; Branco, C.M. A fatigue and creep study in austenitic stainless steel 316L used in exhaust pipes of naval gas turbines. Fatigue Fract. Eng. Mater. Struct. 2004, 27, 861–871. [Google Scholar] [CrossRef]
- Surmen, H.K.; Ortes, F.; Arslan, Y.Z. Fundamentals of 3D Printing and Its Applications in Biomedical Engineering. In 3D Printing in Biomedical Engineering; Singh, S., Prakash, C., Singh, R., Eds.; Materials Horizons: From Nature to Nanomaterials; Springer: Singapore, 2020. [Google Scholar] [CrossRef]
- ASTM F2792-12a:2012; Standard Terminology for Additive Manufacturing Technologies. ASTM International: West Conshohocken, PA, USA, 2012.
- Guo, N.; Leu, M.C. Additive manufacturing: Technology, applications and research needs. Front. Mech. Eng. 2013, 8, 215–243. [Google Scholar] [CrossRef]
- Weller, C.; Kleer, R.; Piller, F.T. Economic implications of 3D printing: Market structure models in light of additive manufacturing revisited. Int. J. Prod. Econ. 2015, 164, 43–56. [Google Scholar] [CrossRef]
- Holmström, J.; Partanen, J.; Tuomi, J.; Walter, M. Rapid manufacturing in the spare parts supply chain: Alternative approaches to capacity deployment. J. Manuf. Technol. Manag. 2010, 21, 687–697. [Google Scholar] [CrossRef]
- Berman, B. 3-D printing: The new industrial revolution. Bus. Horiz. 2012, 55, 155–162. [Google Scholar] [CrossRef]
- Štefčák, P.; Gajdoš, I.; Spišák, E. Robotics Large scale additive manufacturing with FGF technology. In Advanced Polymer Materials and Technologies: Recent Trends and Current Priorities-Lviv; Lviv Polytechnic National University: Lviv, Ukraine, 2022; pp. 217–226. ISBN 978-617-7506-62-0. [Google Scholar]
- Cojocaru, V.; Frunzaverde, D.; Miclosina, C.O.; Marginean, G. The Influence of the Process Parameters on the Mechanical Properties of PLA Specimens Produced by Fused Filament Fabrication—A Review. Polymers 2022, 14, 886. [Google Scholar] [CrossRef]
- ISO 527-2:2012; Plastics—Determination of Tensile Properties—Part 2: Test Conditions for Molding and Extrusion Plastics. International Organization for Standardization: Geneva, Switzerland, 2012.
- Materials, S. List of Stratasys Industrial 3D Printing Materials. Available online: https://www.stratasys.com/en/materials/materials-catalog/fdm-materials/ (accessed on 18 June 2024).
- ASTM D638-14; Standard Test Method for Tensile Properties of Plastics. ASTM International: West Conshohocken, PA, USA, 2015.
- ASTM E466-96(2002)e1; Standard Practice for Conducting Force Controlled Constant Amplitude Axial Fatigue Tests of Metallic Materials. ASTM International: West Conshohocken, PA, USA, 2002.
- Macek, W.; Branco, R.; Podulka, P.; Kopec, M.; Zhu, S.-P.; Costa, J.D. A brief note on entire fracture surface topography parameters for 18Ni300 maraging steel produced by LB-PBF after LCF. Eng. Fail. Anal. 2023, 153, 107541. [Google Scholar] [CrossRef]
- Podulka, P.; Macek, W.; Rozumek, D.; Żak, K.; Branco, R. Topography measurement methods evaluation for entire bending-fatigued fracture surfaces of specimens obtained by explosive welding. Measurement 2024, 224, 113853. [Google Scholar] [CrossRef]
- ISO 25178-600:2019; Geometrical Product Specifications (GPS)—Surface Texture: Areal—Part 600: Metrological Characteristics for Areal Topography Measuring Methods. Technical Committee: ISO/TC 213; ISO: New York, NY, USA, 2019.
- Kapluna, B.W.; Zhoua, R.; Jonesb, K.W.; Dunna, M.L.; Yakackia, C.M. Influence of orientation on mechanical properties for high-performance fused filament fabricated ULTEM 9085 and electro-statically dissipative polyetherketoneketone. Addit. Manuf. 2020, 36, 101527. [Google Scholar] [CrossRef]
- Ramírez-Revilla, S.; Camacho-Valencia, D.; Gonzales-Condori, E.G.; Márquez, G. Evaluation and comparison of the degradability and compressive and tensile properties of 3D printing polymeric materials: PLA, PETG, PC, and ASA. MRS Commun. 2023, 13, 55–62. [Google Scholar] [CrossRef]
- Guessasma, S.; Belhabib, S.; Nouri, H. Microstructure, thermal and mechanicalbehavior of 3D printed Acrylonitrile Styrene Acrylate. Macromol. Mater. Eng. 2019, 304, 1800793. [Google Scholar] [CrossRef]
- Tymrak, B.M.; Kreiger, M.; Pearce, J.M. Mechanical properties of components fabricated with open-source 3-D printers under realistic environmental conditions. Mater. Des. 2014, 58, 242–246. [Google Scholar] [CrossRef]
- Kajbič, J.; Klemenc, J.; Fajdiga, G. On the fatigue properties of material extrusion 3D-printed biodegradable composites reinforced with continuous flax fibers. Int. J. Fatigue 2023, 177, 107954. [Google Scholar] [CrossRef]
- Kiani, P.; Sedighi, M.; Kasaeian-Naeini, M.; Jabbari, A.H. High cycle fatigue behavior and thermal properties of PLA/PCL blends produced by fused deposition modeling. J. Polym. Res. 2023, 30, 264. [Google Scholar] [CrossRef]
- Ashraf Talesh, S.A.; Azadi, M. Impact of Corrosion in Simulated Body Fluid on Fatigue Characteristics of 3D-Printed Polylactic Acid-Coated AM60 Magnesium Alloys. Surfaces 2024, 7, 88–107. [Google Scholar] [CrossRef]
- Algarni, M. Fatigue Behavior of PLA Material and the Effects of Mean Stress and Notch: Experiments and Modeling. Procedia Struct. Integr. 2022, 37, 676–683. [Google Scholar] [CrossRef]
- Azadi, M.; Dadashi, A.; Dezianian, S.; Kianifar, M.; Torkaman, S.; Chiyani, M. High-cycle bending fatigue properties of additive-manufactured ABS and PLA polymers fabricated by fused deposition modeling 3D-printing. Forces Mech. 2021, 3, 100016. [Google Scholar] [CrossRef]
- Afrose, M.F.; Masood, S.H.; Iovenitti, P.; Nikzad, M.; Sbarski, I. Effects of part build orientations on fatigue behaviour of FDM-processed PLA material. Prog. Addit. Manuf. 2016, 1, 21–28. [Google Scholar] [CrossRef]
- Shuhua, W.; Qiaoli, X.; Fen, L.; Jinming, D.; Husheng, J.; Bingshe, X. Preparation and properties of cellulose-based carbon microsphere/poly (lactic acid) composites. J. Compos. Mater. 2014, 48, 1297–1302. [Google Scholar] [CrossRef]
- Kim, H.C.; Kim, D.Y.; Lee, J.E.; Park, K. Improvement of mechanical properties and surface finish of 3D-printed polylactic acid parts by constrained remelting. Adv. Mater. Lett. 2017, 8, 1199–1203. [Google Scholar] [CrossRef]
- Santana, L.; Alves, J.L.; Sabino Netto AD, C.; Merlini, C. A comparative study between PETG and PLA for 3D printing through thermal, chemical and mechanical characterization. Matéria 2018, 23, e12267. [Google Scholar] [CrossRef]
- Ronca, A.; Abbate, V.; Redaelli, D.F.; Storm, F.A.; Cesaro, G.; De Capitani, C.; Sorrentino, A.; Colombo, G.; Fraschini, P.; Ambrosio, L. A Comparative Study for Material Selection in 3D Printing of Scoliosis Back Brace. Materials 2022, 15, 5724. [Google Scholar] [CrossRef] [PubMed]
- Garcias, J.F.; Martins, R.F.; Branco, R.; Marciniak, Z.; Macek, W.; Pereira, C.; Santos, C. Quasistatic and fatigue behavior of an AISI H13 steel obtained by additive manufacturing and conventional method. Fatigue Fract. Eng. Mater. Struct. 2021, 44, 3384–3398. [Google Scholar] [CrossRef]
- Al-Maharma, A.Y.; Patil, S.P.; Markert, B. Effects of porosity on the mechanical properties of additively manufactured components: A critical review. Mater. Res. Express 2020, 7, 122001. [Google Scholar] [CrossRef]
- Gajdoš, I.; Slota, J.; Spišák, E.; Jachowicz, T.; Tor-Swiatek, A.A. Structure and tensile properties evaluation of samples produced by Fused Deposition Modeling. Open Eng. 2016, 6, 86–89. [Google Scholar] [CrossRef]


| XY | |||
| Tensile Strength [MPa] | Young’s Modulus [MPa] | Ultimate Strain [%] | |
| PLA | 54.9 ± 1.73 | 2451.4 ± 81.12 | 4.1 ± 0.17 |
| PETG | 32.9 ± 1.77 | 1109.6 ± 36.27 | 7.3 ± 1.38 |
| YZ | |||
| Tensile Strength [MPa] | Young’s Modulus [MPa] | Ultimate Strain [%] | |
| PLA | 54.9 ± 4.82 | 2245.7 ± 114.80 | 4.5 ± 0.32 |
| PETG | 40.9 ± 1.64 | 1290.7 ± 36.02 | 5.7 ± 0.66 |
| Spec. # | Thickness [mm] | Stress Level | σmax [MPa] | σmin [MPa] | Stress Range, ∆σ [MPa] | Fmax [N] | Fmin [N] | Fa [N] | Fmed [N] | Ncycles |
|---|---|---|---|---|---|---|---|---|---|---|
| 1 | 5.06 | 60% UTS | 20.4 | 4.08 | 16.31 | 1012.2 | 202.4 | 404.9 | 607.3 | 12,132 |
| 2 | 5.04 | 1008.3 | 201.7 | 403.3 | 604.9 | 12,496 | ||||
| 3 | 4.98 | 996.8 | 199.4 | 398.7 | 598.1 | 15,483 | ||||
| 4 | 7.10 | 45% UTS | 15.3 | 3.06 | 12.23 | 1064.6 | 212.9 | 425.8 | 638.7 | 17,040 |
| 5 | 5.06 | 758.5 | 151.7 | 303.4 | 455.1 | 41,250 | ||||
| 6 | 5.06 | 758.3 | 151.7 | 303.3 | 454.9 | 35,140 | ||||
| 7 | 7.13 | 30% UTS | 10.2 | 2.04 | 8.16 | 712.8 | 142.6 | 285.1 | 427.7 | 79,271 |
| 8 | 5.09 | 509.1 | 101.8 | 203.6 | 305.5 | 124,889 | ||||
| 9 | 5.14 | 514.1 | 102.8 | 205.7 | 308.5 | 193,323 |
| Spec. # | Thickness [mm] | Stress Level | σmax [MPa] | σmin [MPa] | Stress Range, ∆σ [MPa] | Fmax [N] | Fmin [N] | Fa [N] | Fmed [N] | Ncycles |
|---|---|---|---|---|---|---|---|---|---|---|
| 10 | 7.10 | 60% UTS | 32.4 | 6.48 | 25.92 | 2255.8 | 451.2 | 902.3 | 1353.5 | 2040 |
| 11 | 5.10 | 1619.9 | 323.9 | 647.9 | 971.9 | 1331 | ||||
| 12 | 5.13 | 1627.7 | 325.5 | 651.1 | 976.6 | 972 | ||||
| 13 | 5.08 | 45% UTS | 24.3 | 4.86 | 19.44 | 1209.2 | 241.8 | 483.7 | 725.5 | 6880 |
| 14 | 5.13 | 1221.5 | 244.3 | 488.6 | 732.9 | 5900 | ||||
| 15 | 5.15 | 1225.6 | 245.1 | 490.3 | 735.4 | 5380 | ||||
| 16 | 5.09 | 30% UTS | 16.2 | 3.24 | 12.96 | 807.6 | 161.5 | 323.1 | 484.6 | 43,600 |
| 17 | 5.13 | 814.4 | 162.9 | 325.8 | 488.7 | 48,893 | ||||
| 18 | 5.18 | 821.9 | 164.4 | 328.8 | 493.2 | 37,970 | ||||
| 19 | 5.16 | 20% UTS | 10.8 | 2.16 | 8.64 | 546.6 | 109.3 | 218.7 | 327.9 | 525,170 |
Disclaimer/Publisher’s Note: The statements, opinions and data contained in all publications are solely those of the individual author(s) and contributor(s) and not of MDPI and/or the editor(s). MDPI and/or the editor(s) disclaim responsibility for any injury to people or property resulting from any ideas, methods, instructions or products referred to in the content. |
© 2024 by the authors. Licensee MDPI, Basel, Switzerland. This article is an open access article distributed under the terms and conditions of the Creative Commons Attribution (CC BY) license (https://creativecommons.org/licenses/by/4.0/).
Share and Cite
Martins, R.F.; Branco, R.; Martins, M.; Macek, W.; Marciniak, Z.; Silva, R.; Trindade, D.; Moura, C.; Franco, M.; Malça, C. Mechanical Properties of Additively Manufactured Polymeric Materials—PLA and PETG—For Biomechanical Applications. Polymers 2024, 16, 1868. https://doi.org/10.3390/polym16131868
Martins RF, Branco R, Martins M, Macek W, Marciniak Z, Silva R, Trindade D, Moura C, Franco M, Malça C. Mechanical Properties of Additively Manufactured Polymeric Materials—PLA and PETG—For Biomechanical Applications. Polymers. 2024; 16(13):1868. https://doi.org/10.3390/polym16131868
Chicago/Turabian StyleMartins, Rui F., Ricardo Branco, Miguel Martins, Wojciech Macek, Zbigniew Marciniak, Rui Silva, Daniela Trindade, Carla Moura, Margarida Franco, and Cândida Malça. 2024. "Mechanical Properties of Additively Manufactured Polymeric Materials—PLA and PETG—For Biomechanical Applications" Polymers 16, no. 13: 1868. https://doi.org/10.3390/polym16131868