
Exploring the Equilibrium State Diagram of Maltodextrins across Diverse Dextrose Equivalents

 , , and
Abstract
:1. Introduction
2. Materials and Methods
2.1. Materials
2.2. Methods
2.2.1. Spray Drying
2.2.2. Sorption Isotherms
2.2.3. Antioxidant Activity (AA)
2.2.4. Physicochemical Characterization
3. Results
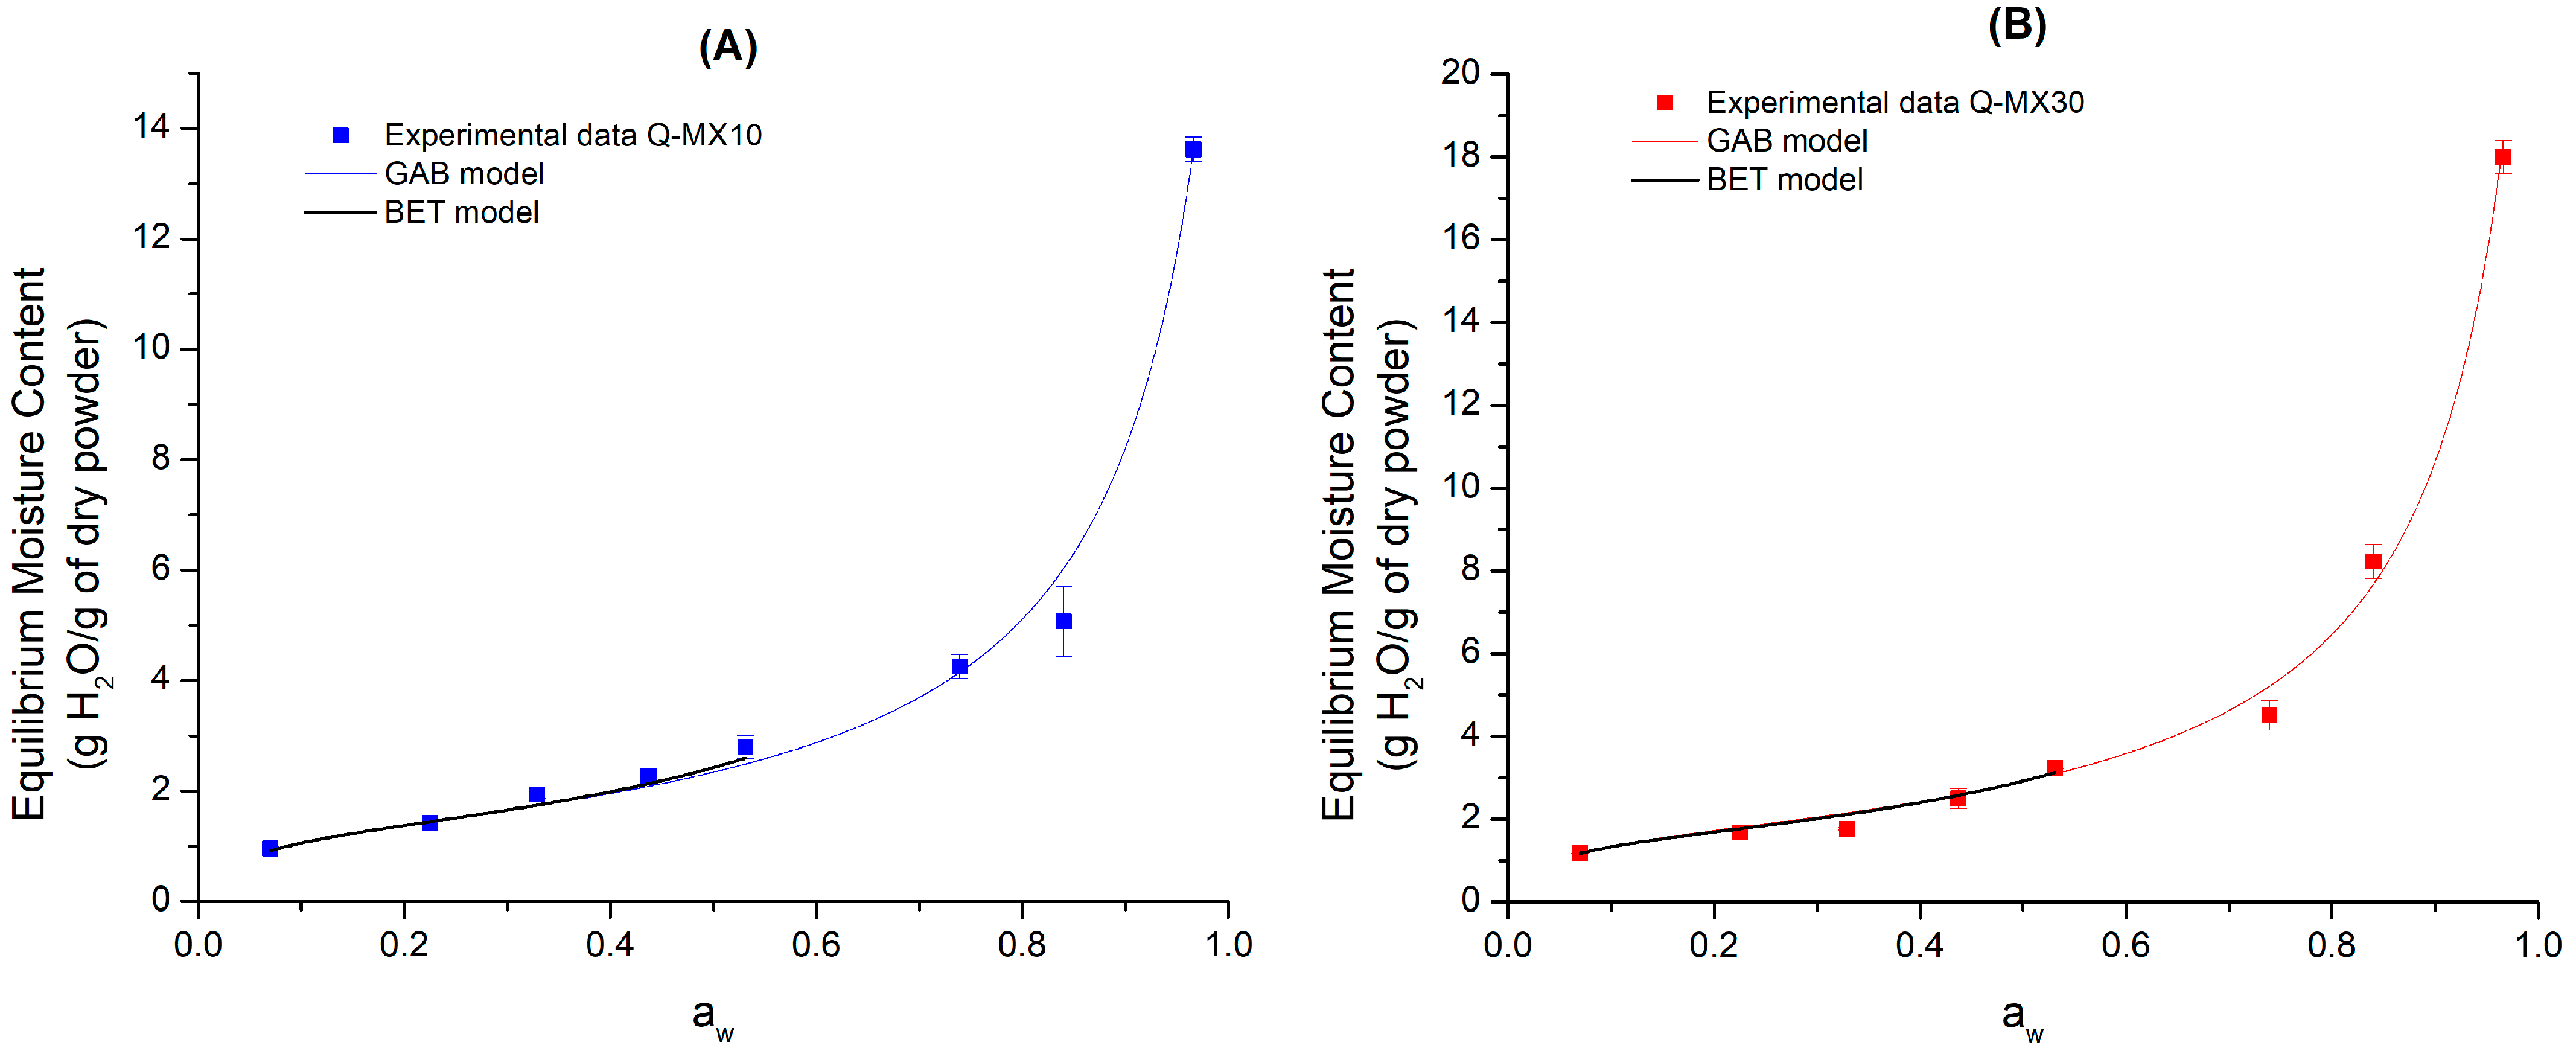
3.1. Sorption Isotherms at 25 °C
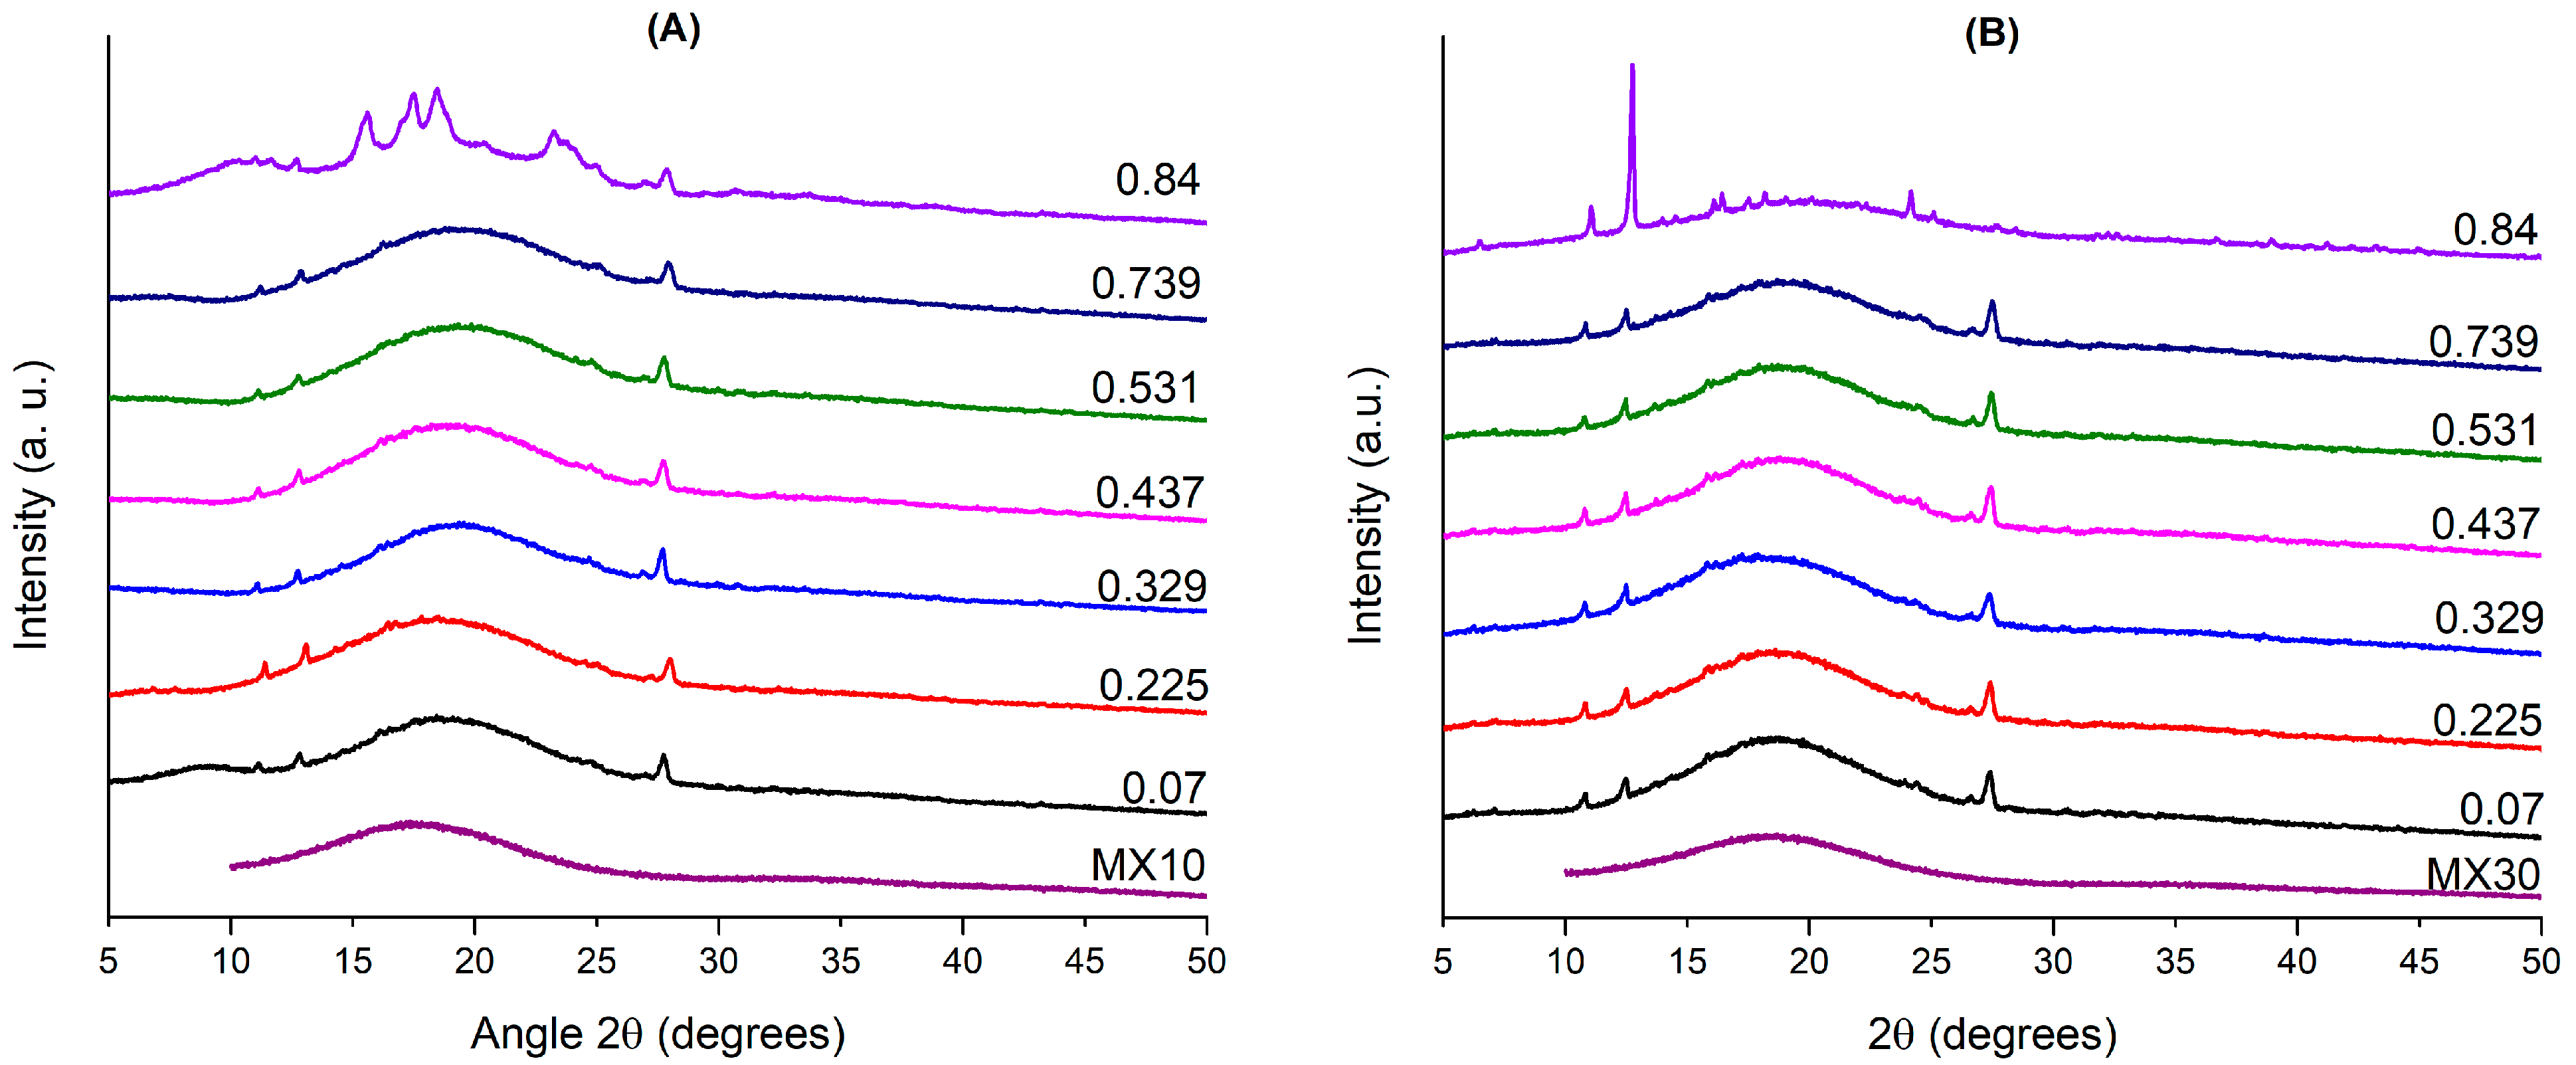
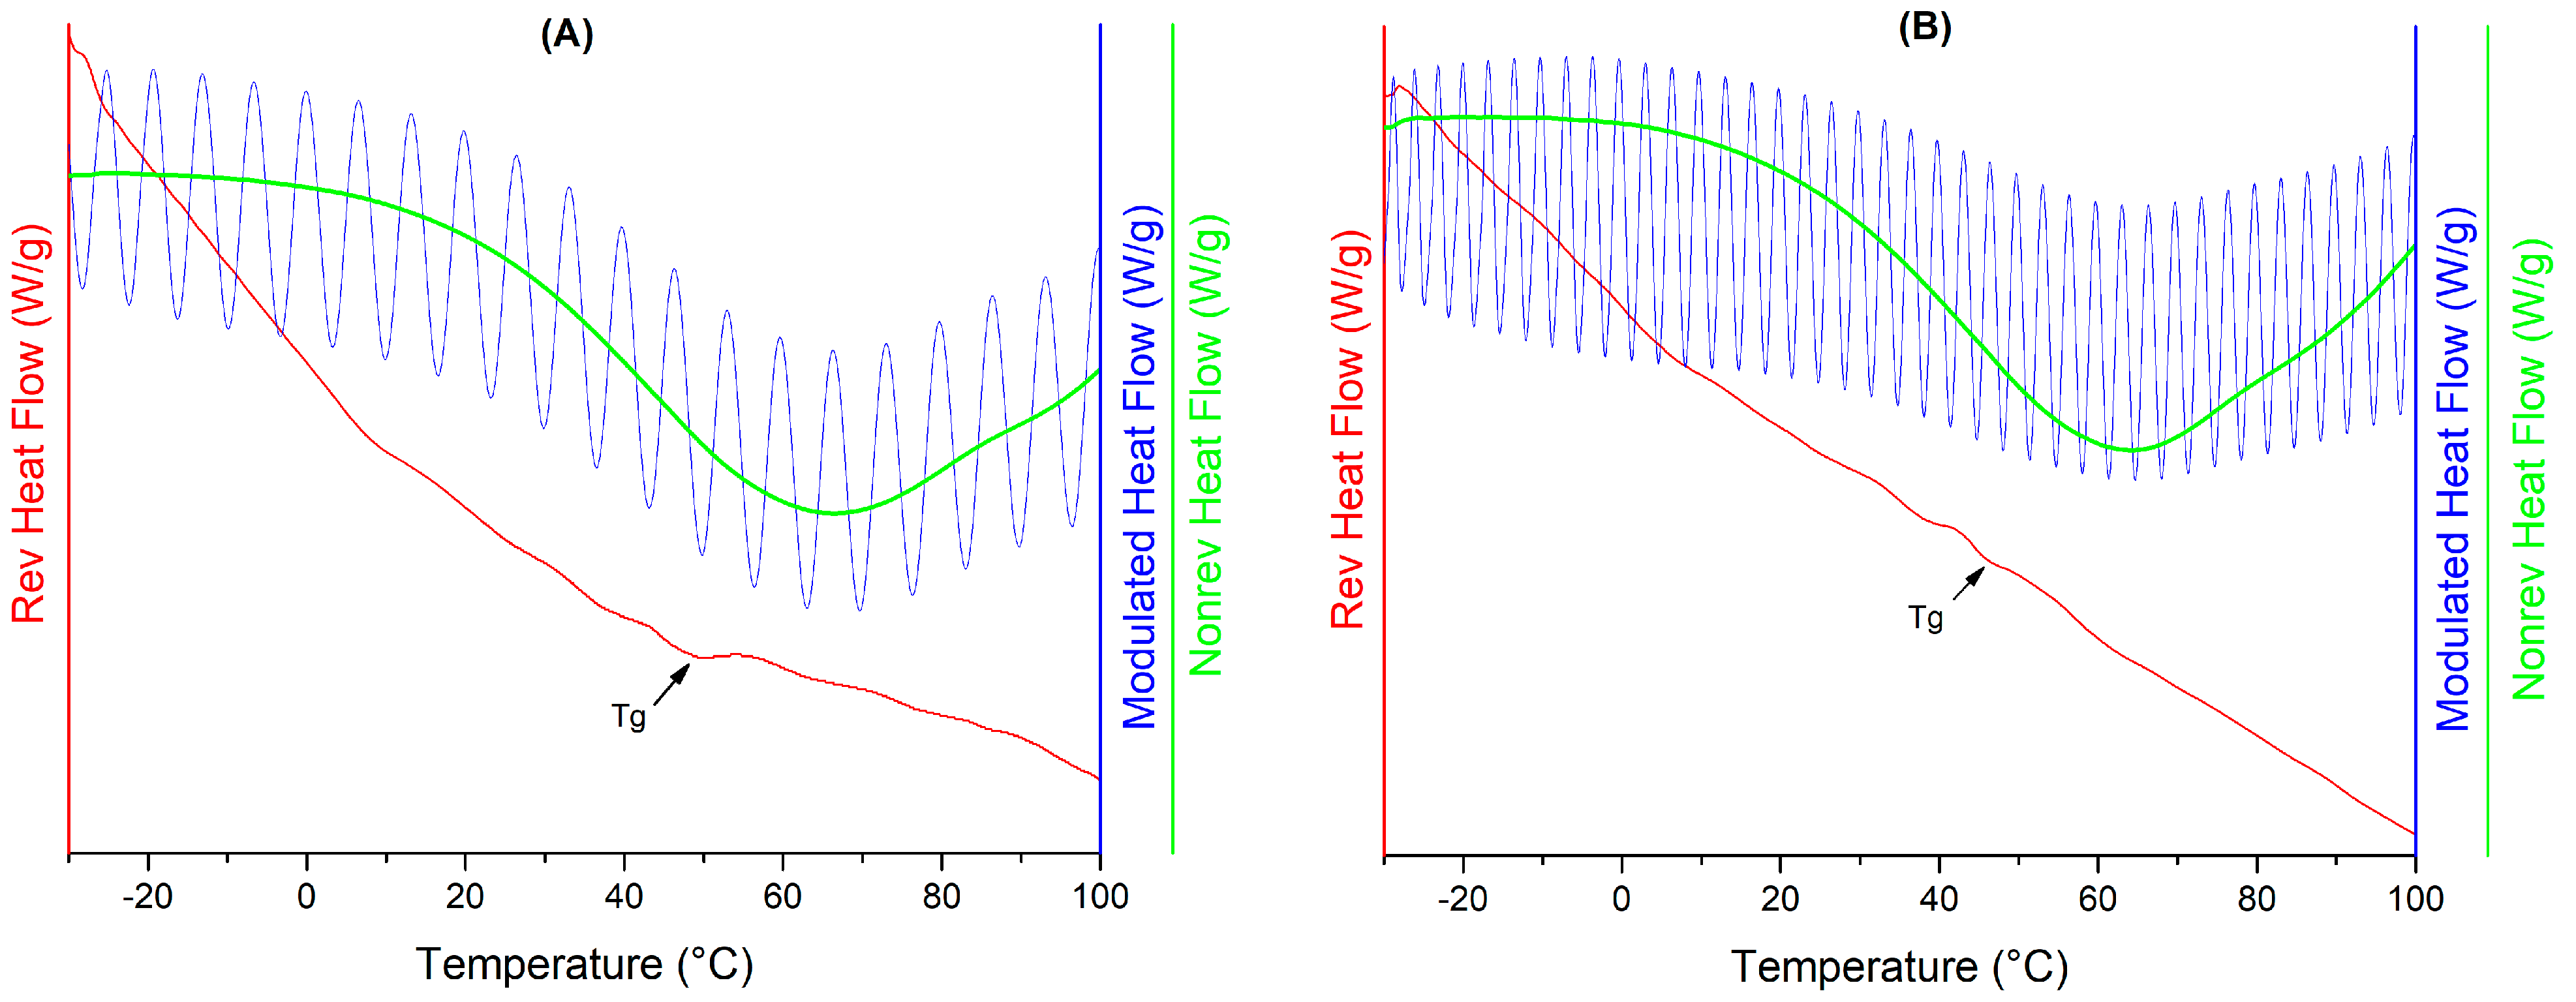
3.2. Physicochemical Characterization
3.3. Antioxidant Activity of the Functional Food
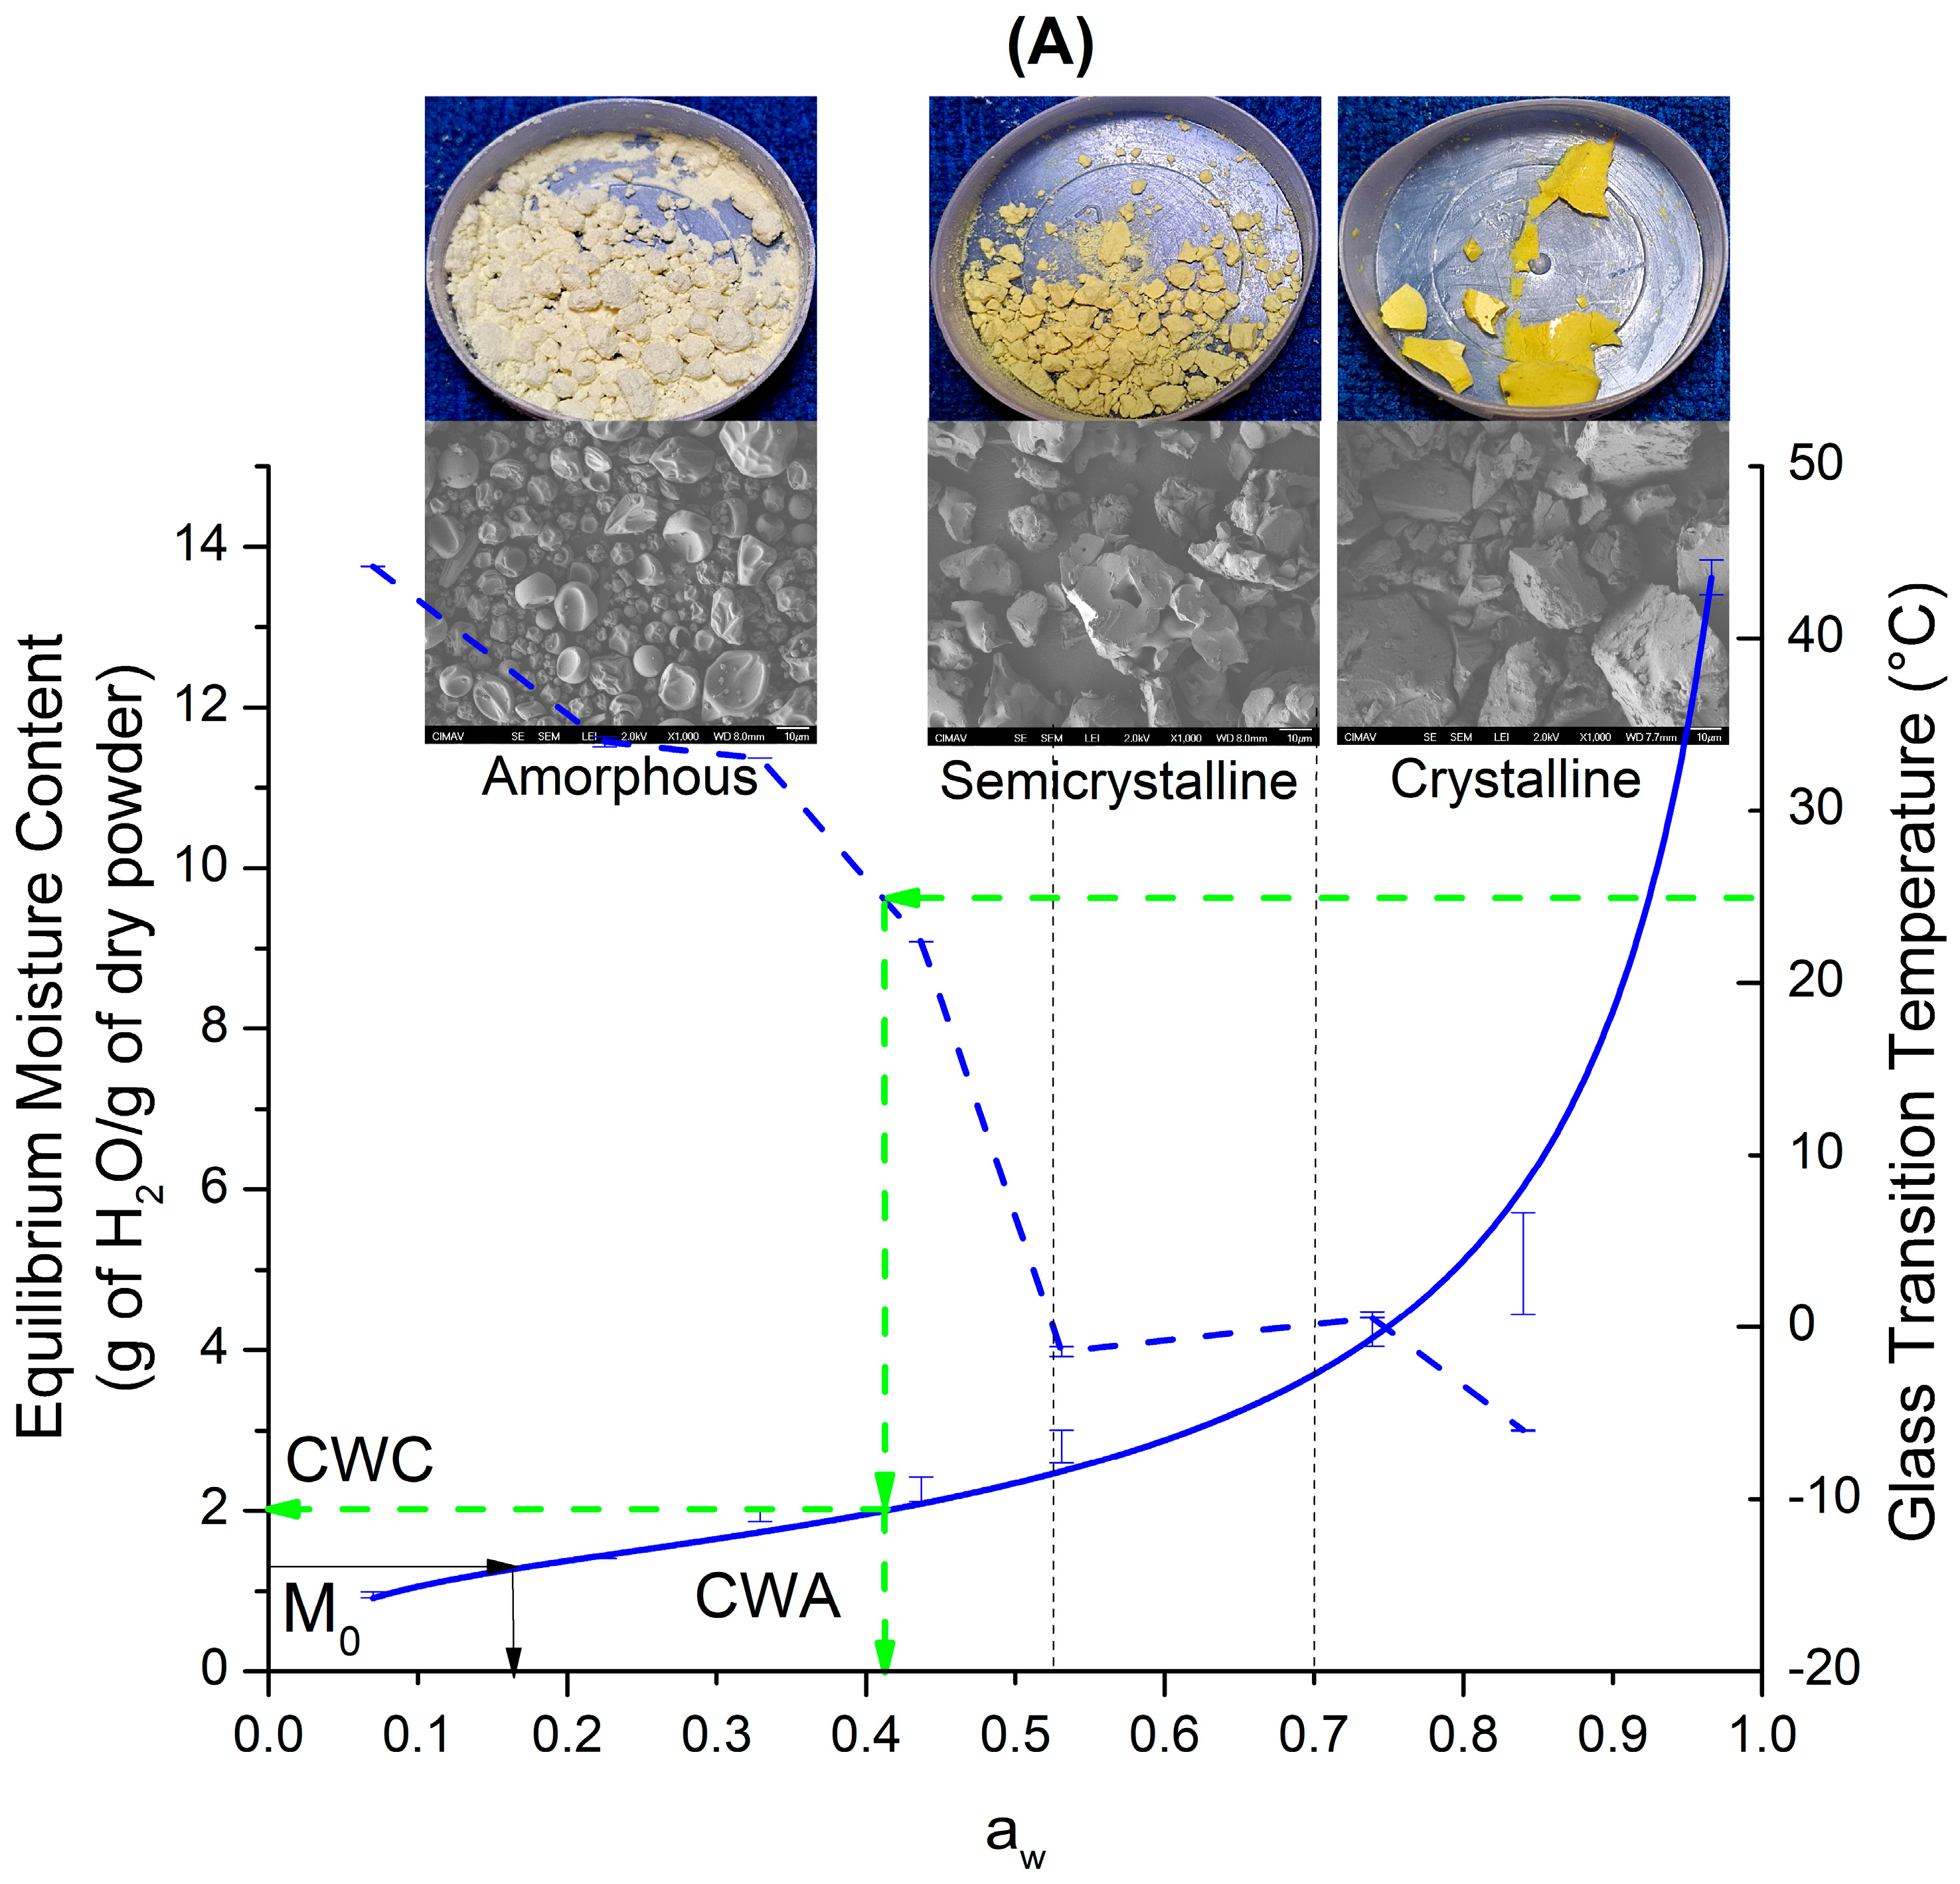
4. Discussion
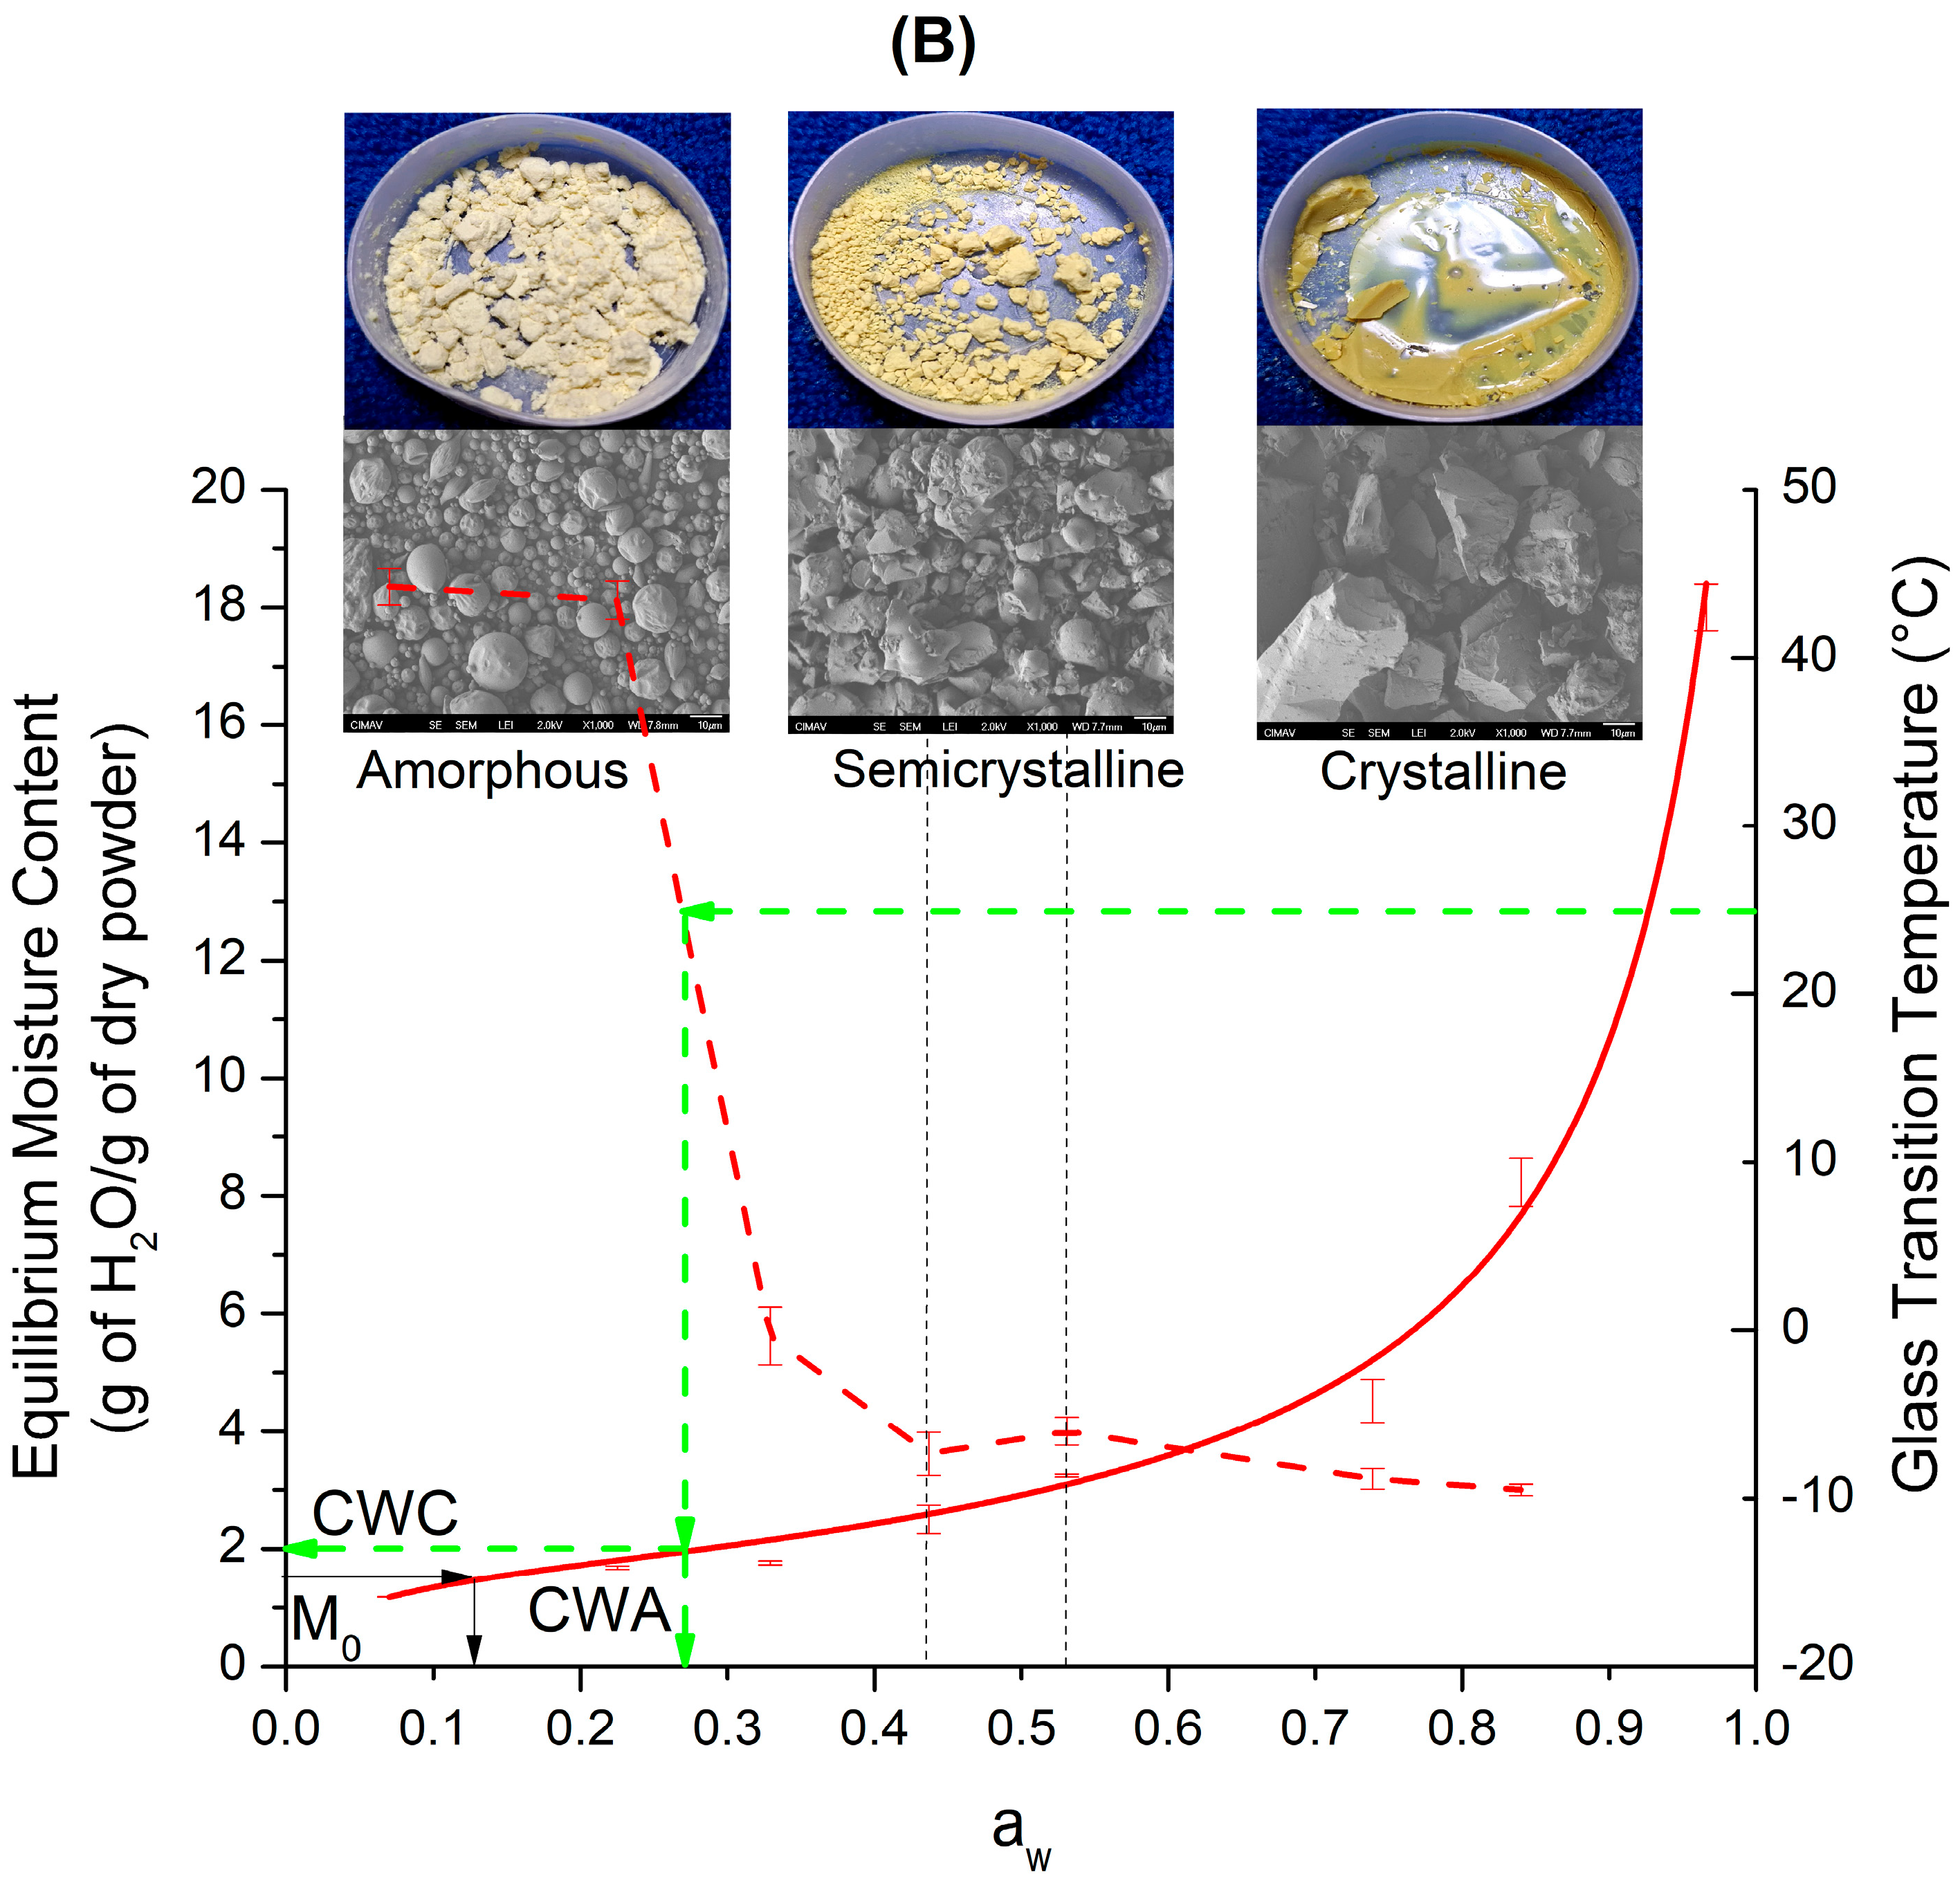
Equilibrium State Diagram
5. Conclusions
Author Contributions
Funding
Institutional Review Board Statement
Data Availability Statement
Acknowledgments
Conflicts of Interest
References
- Kouhi, M.; Prabhakaran, M.P.; Ramakrishna, S. Edible polymers: An insight into its application in food, biomedicine and cosmetics. Trends Food Sci. Technol. 2020, 103, 248–263. [Google Scholar] [CrossRef]
- Paliwal, R.; Palakurthi, S. Zein in controlled drug delivery and tissue engineering. J. Control. Release 2014, 189, 108–122. [Google Scholar] [CrossRef] [PubMed]
- Shahbaz, A.; Hussain, N.; Basra, M.A.R.; Bilal, M. Polysaccharides-based nano-Hybrid biomaterial platforms for tissue engineering, drug delivery, and food packaging applications. Starch-Stärke 2022, 74, 2200023. [Google Scholar] [CrossRef]
- Shit, S.C.; Shah, P.M. Edible polymers: Challenges and opportunities. J. Polym. 2014, 2014, 427259. [Google Scholar] [CrossRef]
- Ali, A.; Ahmed, S. Recent advances in edible polymer based hydrogels as a sustainable alternative to conventional polymers. J. Agric. Food Chem. 2018, 66, 6940–6967. [Google Scholar] [CrossRef] [PubMed]
- Shi, J.; Mazza, G.; Le Maguer, M. Biochemical and Processing Aspects. Functional Foods, 1st ed.; CRC Press: Boca Raton, FL, USA, 2016; Volume 2. [Google Scholar] [CrossRef]
- Essa, M.M.; Bishir, M.; Bhat, A.; Chidambaram, S.B.; Al-Balushi, B.; Hamdan, H.; Govindarajan, N.; Freidland, R.P.; Qoronfleh, M.W. Functional foods and their impact on health. J. Food Sci. Technol. 2021, 60, 820–834. [Google Scholar] [CrossRef] [PubMed]
- Granato, D.; Barba, F.J.; Bursać Kovačević, D.; Lorenzo, J.M.; Cruz, A.G.; Putnik, P. Functional foods: Product development, technological trends, efficacy testing, and safety. Annu. Rev. Food Sci. Technol. 2020, 11, 93–118. [Google Scholar] [CrossRef]
- Sablani, S.S.; Syamaladevi, R.M.; Swanson, B.G. A review of methods, data and applications of state diagrams of food systems. Food Eng. Rev. 2010, 2, 168–203. [Google Scholar] [CrossRef]
- Rahman, M.S. State diagram of foods: Its potential use in food processing and product stability. Trends Food Sci. Technol. 2006, 17, 129–141. [Google Scholar] [CrossRef]
- Al-Ghamdi, S.; Hong, Y.K.; Qu, Z.; Sablani, S.S. State diagram, water sorption isotherms and color stability of pumpkin (Cucurbita pepo L.). J. Food Eng. 2020, 273, 109820. [Google Scholar] [CrossRef]
- Caballero-Cerón, C.; Guerrero-Beltrán, J.A.; Mújica-Paz, H.; Torres, J.A.; Welti-Chanes, J. Moisture sorption isotherms of foods: Experimental methodology, mathematical analysis, and practical applications. In Water Stress in Biological, Chemical, Pharmaceutical and Food Systems; Food Engineering Series (FSES); Springer: New York, NY, USA, 2015; pp. 187–214. [Google Scholar] [CrossRef]
- Nurhadi, B.; Roos, Y.H.; Maidannyk, V. Propiedades físicas de la maltodextrina DE 10: Absorción de agua, plastificación del agua y relajación entálpica. Rev. Ing. Aliment. 2016, 174, 68–74. [Google Scholar] [CrossRef]
- Chronakis, I.S. On the molecular characteristics, compositional properties, and structural-functional mechanisms of maltodextrins: A review. Crit. Rev. Food Sci. Nutr. 1998, 38, 599–637. [Google Scholar] [CrossRef] [PubMed]
- Takeiti, C.Y.; Kieckbusch, T.G.; Collares-Queiroz, F.P. Morphological and physicochemical characterization of commercial maltodextrins with different degrees of dextrose-equivalent. Int. J. Food Prop. 2010, 13, 411–425. [Google Scholar] [CrossRef]
- Parikh, A.; Agarwal, S.; Raut, K. A review on applications of maltodextrin in pharmaceutical industry. Int. J. Pharm. Biol. Sci. 2014, 4, 64–67. [Google Scholar]
- Hofman, D.L.; Van Buul, V.J.; Brouns, F.J. Nutrition, health, and regulatory aspects of digestible maltodextrins. Crit. Rev. Food Sci. Nutr. 2016, 56, 2091–2100. [Google Scholar] [CrossRef] [PubMed]
- Buck, A.W. Resistant Maltodextrin Overview. In Dietary Fiber and Health, 1st ed.; CRC Press: Boca Raton, FL, USA, 2012; ISBN 9780429184239. [Google Scholar]
- Xiao, Z.; Xia, J.; Zhao, Q.; Niu, Y.; Zhao, D. Maltodextrin as wall material for microcapsules: A review. Carbohydr. Polym. 2022, 298, 120113. [Google Scholar] [CrossRef] [PubMed]
- Hendrawati, T.Y.; Sari, A.M.; Rahman MI, S.; Nugrahani, R.A.; Siswahyu, A. Microencapsulation techniques of herbal compounds for raw materials in food industry, cosmetics and pharmaceuticals. In Microencapsulation-Processes, Technologies and Industrial Applications; IntechOpen: London, UK, 2019; ISBN 978-1-83881-871-5. [Google Scholar] [CrossRef]
- Corrêa-Filho, L.C.; Moldão-Martins, M.; Alves, V.D. Advances in the application of microcapsules as carriers of functional compounds for food products. Appl. Sci. 2019, 9, 571. [Google Scholar] [CrossRef]
- Choudhury, N.; Meghwal, M.; Das, K. Microencapsulation: An overview on concepts, methods, properties and applications in foods. Food Front. 2021, 2, 426–442. [Google Scholar] [CrossRef]
- Piñón-Balderrama, C.I.; Leyva-Porras, C.; Terán-Figueroa, Y.; Espinosa-Solís, V.; Álvarez-Salas, C.; Saavedra-Leos, M.Z. Encapsulation of active ingredients in food industry by spray-drying and nano spray-drying technologies. Processes 2020, 8, 889. [Google Scholar] [CrossRef]
- Mehta, N.; Kumar, P.; Verma, A.K.; Umaraw, P.; Kumar, Y.; Malav, O.P.; Lorenzo, J.M. Microencapsulation as a noble technique for the application of bioactive compounds in the food industry: A comprehensive review. Appl. Sci. 2022, 12, 1424. [Google Scholar] [CrossRef]
- Saavedra-Leos, Z.; Leyva-Porras, C.; Araujo-Díaz, S.B.; Toxqui-Terán, A.; Borrás-Enríquez, A.J. Technological application of maltodextrins according to the degree of polymerization. Molecules 2015, 20, 21067–21081. [Google Scholar] [CrossRef]
- Araujo-Díaz, S.B.; Leyva-Porras, C.; Aguirre-Bañuelos, P.; Álvarez-Salas, C.; Saavedra-Leos, Z. Evaluation of the physical properties and conservation of the antioxidants content, employing inulin and maltodextrin in the spray drying of blueberry juice. Carbohydr. Polym. 2017, 167, 317–325. [Google Scholar] [CrossRef]
- Saavedra–Leos, M.Z.; Leyva-Porras, C.; Alvarez-Salas, C.; Longoria-Rodríguez, F.; López-Pablos, A.L.; González-García, R.; Pérez-Urizar, J.T. Obtaining orange juice–maltodextrin powders without structure collapse based on the glass transition temperature and degree of polymerization. CyTA-J. Food 2018, 16, 61–69. [Google Scholar] [CrossRef]
- Saavedra-Leos, M.Z.; Leyva-Porras, C.; López-Martínez, L.A.; González-García, R.; Martínez, J.O.; Compeán Martínez, I.; Toxqui-Terán, A. Evaluation of the spray drying conditions of blueberry juice-maltodextrin on the yield, content, and retention of quercetin 3-d-galactoside. Polymers 2019, 11, 312. [Google Scholar] [CrossRef]
- Leyva-Porras, C.; Saavedra-Leos, M.Z.; Cervantes-González, E.; Aguirre-Bañuelos, P.; Silva-Cázarez, M.B.; Álvarez-Salas, C. Spray drying of blueberry juice-maltodextrin mixtures: Evaluation of processing conditions on content of resveratrol. Antioxidants 2019, 8, 437. [Google Scholar] [CrossRef]
- Saavedra-Leos, M.Z.; Leyva-Porras, C.; Toxqui-Terán, A.; Espinosa-Solis, V. Physicochemical properties and antioxidant activity of spray-dry broccoli (Brassica oleracea var Italica) stalk and floret juice powders. Molecules 2021, 26, 1973. [Google Scholar] [CrossRef]
- Leyva-Porras, C.; Saavedra-Leos, M.Z.; López-Martinez, L.A.; Espinosa-Solis, V.; Terán-Figueroa, Y.; Toxqui-Terán, A.; Compeán-Martínez, I. Strawberry juice powders: Effect of spray-drying conditions on the microencapsulation of bioactive components and physicochemical properties. Molecules 2021, 26, 5466. [Google Scholar] [CrossRef]
- Saavedra-Leos, M.Z.; Román-Aguirre, M.; Toxqui-Terán, A.; Espinosa-Solís, V.; Franco-Vega, A.; Leyva-Porras, C. Blends of carbohydrate polymers for the co-microencapsulation of Bacillus clausii and quercetin as active ingredients of a functional food. Polymers 2022, 14, 236. [Google Scholar] [CrossRef]
- Leyva-Porras, C.; Saavedra-Leos, Z.; Román-Aguirre, M.; Arzate-Quintana, C.; Castillo-González, A.R.; González-Jácquez, A.I.; Gómez-Loya, F. An equilibrium state diagram for storage stability and conservation of active ingredients in a functional food based on polysaccharides blends. Polymers 2023, 15, 367. [Google Scholar] [CrossRef]
- Labuza, T.; Lomauro, C.; Bakashi, A. Moisture Transfer Properties of Dry and Semimoist Foods. J. Food Sci. 1985, 50, 397–400. [Google Scholar] [CrossRef]
- EUA. AOAC Official Methods of Analysis. Association of Official Analytical Chemists 2003. Available online: https://www.aoac.org/about-aoac-international/ (accessed on 1 October 2023).
- Saavedra-Leos, M.Z.; Alvarez-Salas, C.; Esneider-Alcalá, M.A.; Toxqui-Terán, A.; Pérez-García, S.A.; Ruiz-Cabrera, M.A. Towards an improved calorimetric methodology for glass transition temperature determination in amorphous sugars. CyTA-J. Food 2012, 10, 258–267. [Google Scholar] [CrossRef]
- Singh, P.C.; Singh, R.K. Application of GAB model for water sorption isotherms of food products 1. J. Food Process. Preserv. 1996, 20, 203–220. [Google Scholar] [CrossRef]
- Navia, D.; Ayala, A.; Villada, H. Modelación Matemática De Las Isotermas De Adsorción En Materiales Bioplásticos De Harina De Yuca. Vitae 2012, 19, 423–425. [Google Scholar]
- Talens Oliag, P. Caracterización del Comportamiento Reológico de un Alimento Fluido Tixotrópico. 2018. Available online: http://hdl.handle.net/10251/103382 (accessed on 15 February 2024).
- Cerviño, V.F.; Sosa, C.A.; Vergara, L.E.; Schmalko, M.E.; Sgroppo, S.C. Obtención y Modelado de Isotermas de Sorción de Caramelos ‘Gummy’ de Batatas. In Proceedings of the III Congreso Argentino de Ingeniería—IX Congreso de Enseñanza de La Ingeniería, Resistencia city, Argentina, 7 September 2016. [Google Scholar]
- Domínguez-Domínguez, S.; Domínguez-López, A.; González-Huerta, A.; Navarro-Galindo, S. Cinética de Imbibición e Isotermas de Adsorción de Humedad de La Semilla de Jamaica Hibiscus sabdariffa L. Rev. Mex. Ing. Química 2007, 6, 309–316. [Google Scholar]
- Pascual-Pineda, L.A.; Alamilla-Beltrán, L.; Gutiérrez-López, G.F.; Azuara, E.; Flores-Andrade, E. Condiciones De Almacenamiento De Alimentos Deshidratados a Partir De Una Isoterma De Adsorción De Vapor De Agua. Rev. Mex. Ing. Química 2017, 16, 207–220. [Google Scholar] [CrossRef]
- Brousse, M.M.; Nieto, A.; Linares, A.; Vergara, M. Cinética de adsorción de agua en purés deshidratados de mandioca (Manihot esculenta Crantz). Rev. Venez. Cienc. Y Tecnol. Aliment. 2012, 3, 3–096. [Google Scholar]
- Ballesteros, L.F.; Ramirez, M.J.; Orrego, C.E.; Teixeira, J.A.; Mussatto, S.I. Encapsulation of antioxidant phenolic compounds extracted from spent coffee grounds by freeze-drying and spray-drying using different coating materials. Food Chem. 2017, 237, 623–631. [Google Scholar] [CrossRef]
- Matsuura, T.; Ogawa, A.; Tomabechi, M.; Matsushita, R.; Gohtani, S.; Neoh, T.L.; Yoshii, H. Effect of dextrose equivalent of maltodextrin on the stability of emulsified coconut-oil in spray-dried powder. J. Food Eng. 2015, 163, 54–59. [Google Scholar] [CrossRef]
- Zhang, L.; Zeng, X.; Fu, N.; Tang, X.; Sun, Y.; Lin, L. Maltodextrin: A consummate carrier for spray-drying of xylooligosaccharides. Food Res. Int. 2018, 106, 383–393. [Google Scholar] [CrossRef]
- Navarro-Flores, M.J.; Ventura-Canseco LM, C.; Meza-Gordillo, R.; Ayora-Talavera, T.D.R.; Abud-Archila, M. Spray drying encapsulation of a native plant extract rich in phenolic compounds with combinations of maltodextrin and non-conventional wall materials. J. Food Sci. Technol. 2020, 57, 4111–4122. [Google Scholar] [CrossRef]
- Ferrari, C.C.; Marconi Germer, S.P.; Alvim, I.D.; de Aguirre, J.M. Storage stability of spray-dried blackberry powder produced with maltodextrin or gum arabic. Dry. Technol. 2013, 31, 470–478. [Google Scholar] [CrossRef]
- Costa-Ferreira LM, D.M.; Pereira, R.R.; Carvalho-Guimarães FB, D.; Remígio MS, D.N.; Barbosa WL, R.; Ribeiro-Costa, R.M.; Silva-Júnior JO, C. Microencapsulation by spray drying and antioxidant activity of phenolic compounds from Tucuma Coproduct (Astrocaryum vulgare Mart.) almonds. Polymers 2022, 14, 2905. [Google Scholar] [CrossRef]
- Kroh, L.W. Caramelisation in food and beverages. Food Chem. 1994, 51, 373–379. [Google Scholar] [CrossRef]
- Kawai, K.; Hagura, Y. Discontinuous and heterogeneous glass transition behavior of carbohydrate polymer–plasticizer systems. Carbohydr. Polym. 2012, 89, 836–841. [Google Scholar] [CrossRef]
- Georgetti, S.R.; Casagrande, R.; Souza, C.R.F.; Oliveira, W.P.; Fonseca MJ, V. Spray drying of the soybean extract: Effects on chemical properties and antioxidant activity. LWT-Food Sci. Technol. 2008, 41, 1521–1527. [Google Scholar] [CrossRef]
- Roos, Y. Thermal analysis, state transitions and food quality. J. Therm. Anal. Calorim. 2003, 71, 197–203. [Google Scholar] [CrossRef]
- Ruiz-Cabrera, M.A.; Rivera-Bautista, C.; Grajales-Lagunes, A.; González-García, R.; Schmidt, S.J. State diagrams for mixtures of low molecular weight carbohydrates. J. Food Eng. 2016, 171, 185–193. [Google Scholar] [CrossRef]
- Espinosa-Andrews, H.; Rodríguez-Rodríguez, R. Water state diagram and thermal properties of fructans powders. J. Therm. Anal. Calorim. 2018, 132, 197–204. [Google Scholar] [CrossRef]
- Braga, M.B.; Rocha SC, D.S.; Hubinger, M.D. Spray-Drying of Milk–Blackberry Pulp Mixture: Effect of Carrier Agent on the Physical Properties of Powder, Water Sorption, and Glass Transition Temperature. J. Food Sci. 2018, 83, 1650–1659. [Google Scholar] [CrossRef]
- Busch, V.M.; Pereyra-Gonzalez, A.; Šegatin, N.; Santagapita, P.R.; Ulrih, N.P.; Buera MD, P. Propolis encapsulation by spray drying: Characterization and stability. LWT 2017, 75, 227–235. [Google Scholar] [CrossRef]


| Model Name | Model and Describing Parameters |
|---|---|
| GAB | Xe = equilibrium water content (g H2O/g dry mass) Xm = equilibrium monolayer water content (g H2O/g dry mass) aw = water activity K and C = model constants |
| BET | Xe = equilibrium water content (g H2O/g dry mass) Xm = equilibrium monolayer water content (g H2O/g dry mass) aw = water activity C = model constant |
| Water Activity (aw) | Sample | |
|---|---|---|
| Q-MX10 Tg (°C) | Q-MX30 Tg (°C) | |
| 0.07 | 44.2 ± 0.04 | 44.22 ± 0.01 |
| 0.225 | 33.98 ± 0.02 | 43.43 ± 0.03 |
| 0.329 | 33.05 ± 0.07 | −0.34 ± 0.03 |
| 0.437 | 2.89 ± 0.15 | −7.35 ± 0.24 |
| 0.531 | −9.16 ± 0.2 | −6 ± 0.02 |
| 0.739 | −11.2 ± 0.21 | −8.83 ± 0.36 |
| 0.84 | −10.99 ± 0.63 | −9.5 ± 0.4 |
Disclaimer/Publisher’s Note: The statements, opinions and data contained in all publications are solely those of the individual author(s) and contributor(s) and not of MDPI and/or the editor(s). MDPI and/or the editor(s) disclaim responsibility for any injury to people or property resulting from any ideas, methods, instructions or products referred to in the content. |
© 2024 by the authors. Licensee MDPI, Basel, Switzerland. This article is an open access article distributed under the terms and conditions of the Creative Commons Attribution (CC BY) license (https://creativecommons.org/licenses/by/4.0/).
Share and Cite
Saavedra-Leos, Z.; Carrizales-Loera, A.; Lardizábal-Gutiérrez, D.; López-Martínez, L.A.; Leyva-Porras, C. Exploring the Equilibrium State Diagram of Maltodextrins across Diverse Dextrose Equivalents. Polymers 2024, 16, 2014. https://doi.org/10.3390/polym16142014
Saavedra-Leos Z, Carrizales-Loera A, Lardizábal-Gutiérrez D, López-Martínez LA, Leyva-Porras C. Exploring the Equilibrium State Diagram of Maltodextrins across Diverse Dextrose Equivalents. Polymers. 2024; 16(14):2014. https://doi.org/10.3390/polym16142014
Chicago/Turabian StyleSaavedra-Leos, Zenaida, Anthony Carrizales-Loera, Daniel Lardizábal-Gutiérrez, Laura Araceli López-Martínez, and César Leyva-Porras. 2024. "Exploring the Equilibrium State Diagram of Maltodextrins across Diverse Dextrose Equivalents" Polymers 16, no. 14: 2014. https://doi.org/10.3390/polym16142014