Article

Synthesis of Poly(L–lactide)–poly(ε–caprolactone)–poly(ethylene glycol) Terpolymer Grafted onto Partially Oxidized Carbon Nanotube Nanocomposites for Drug Delivery

by
Karla J. González-Iñiguez
1,
Edgar B. Figueroa-Ochoa
2,
Antonio Martínez-Richa
3,
Leonardo R. Cajero-Zul
4 and
Sergio M. Nuño-Donlucas
4,*
1
Centro Universitario de Ciencias Exactas e Ingenierías, Universidad de Guadalajara, Guadalajara 44430, Mexico
2
Departamento de Química, Centro Universitario de Ciencias Exactas e Ingenierías, Universidad de Guadalajara, Guadalajara 44430, Mexico
3
Departamento de Química, Universidad de Guanajuato, Guanajuato 36050, Mexico
4
Departamento de Ingeniería Química, Centro Universitario de Ciencias Exactas e Ingenierías, Universidad de Guadalajara, Guadalajara 44430, Mexico
*
Author to whom correspondence should be addressed.
Polymers 2024, 16(18), 2580; https://doi.org/10.3390/polym16182580
Submission received: 17 August 2024 / Revised: 3 September 2024 / Accepted: 5 September 2024 / Published: 12 September 2024
(This article belongs to the Special Issue Multifunctional Carbon-Based Polymer Nanocomposites)

Abstract

:
Nanocomposites prepared with a terpolymer of poly(L–lactide) (PLLA)–poly(ε–caprolactone) (PCL)–poly(ethylene glycol) (PEG) and partially oxidized carbon nanotubes (CNTspo) were synthesized and characterized to evaluate their ability to act as an effective nanocarrier of the anticancer drug methotrexate. The homopolymers of PLLA and PCL were synthesized through ring-opening polymerization (ROP) and characterized through gel permeation chromatography (GPC). The PLLA–PCL–PEG terpolymers were synthesized through a four-step chemical route using oxalyl chloride as a linker agent and analyzed with 1H–NMR, 13C–NMR, and FTIR spectroscopies. Additionally, the nanocomposites were characterized through FTIR, and X-ray photoelectron spectroscopy (XPS), as well as the differential scanning calorimetry (DSC) technique. XPS analysis revealed that PLLA–PCL–PEG terpolymer chains are grafted onto CNTspo. Moreover, evaluations through FTIR and DSC strongly suggest that the PCL-rich domains are preferentially oriented toward CNTspo. The release tests exhibited a “burst effect” profile, which was more evident in the terpolymers than in the nanocomposites. Five models were used to assess methotrexate’s in vitro release. For the nanocomposites, the best fit to the experimental data was obtained using the first-order model, whereas the results obtained from the Korsmeyer–Peppas model indicated that Fickian diffusion drives methotrexate’s release.

1. Introduction

The design of novel stimuli-responsive drug-delivery systems (DDSs) that improve the efficiency of conventional drug-delivery therapies responds to current demands in the medical field. DDSs have the ability to activate drug release as a response to external stimuli. Different responsive stimuli can trigger drug delivery. Among these stimuli, those due to changes in the chemical environment in an aqueous medium, such as changes in pH or conditions that favor the hydrolysis reaction [1], have gained special attention, as they can be considered as a reference in preparing a polymeric carrier sensitive to the typic processes of living organisms.
Biocompatible polymers can be utilized as smart or external stimuli-responsive systems. For drugs delivered via systemic routes, it is desirable to develop a polymer-based drug carrier that can transport the drug to the target site and start the drug’s delivery under an external stimulus. However, preparing a new chemical polymeric structure that acts as a sensitive carrier to external stimuli implies overcoming a difficult task due to the associated undesired effects because of their interaction with living matter [2]. The goal is to use a polymer that works like a macromolecular shield, protecting the drug in diverse biological environments that can affect the drug’s efficacy [3].
Among the biodegradable and biocompatible polymers that are capable of protecting adsorbed drugs from degradation induced via the enzymes of living bodies, three polymers can be highlighted: (i) polylactide (PLA; this abbreviation is typically used when stereoregularity is not declared), (ii) poly(ε–caprolactone) (PCL), and (iii) poly(ethylene glycol) (PEG) [4].
PLA is a biodegradable biopolymer derived from renewable sources, and it is commercially available, but it has limited mechanical properties and low thermal resistance [5]. This hydrophobic, aliphatic polyester is used in tissue engineering [6] and preparing implants, drug-delivery materials, and surgical sutures for the human body, owing to its hydrolyzable capacity [7]. At an industrial level, PLA is synthesized in bulk through the ring-opening polymerization (ROP) of lactide (LA), which is a cyclic dimer of lactic acid [8]. Due to the chemical structure of LA having two chiral centers, two optical isomers of LA exist: D,D–lactide (D–LA) and L,L–lactide (L–LA). The products of the polymerization of these isomers are named poly(D–lactide) (PDLA) and poly(L–lactide) (PLLA). As a consequence of their optical purity, they have different thermal properties [9].
PCL is a biocompatible, biodegradable, bioresorbable biopolymer; it is easy to synthesize and popular in the biomedical field. However, under physiological conditions, PCL experiments have shown its slow hydrolysis via the cleavage of its ester groups [10]. This thermoplastic polyester is increasingly used to prepare drug-release materials and regenerative medicine implants, as well as to develop new applications in the field of tissue engineering [11]. PCL is compatible with various drugs, such as antipsychotics, antibiotics, or anti-inflammatory agents [10]. Moreover, owing to its slow kinetic degradation and lack of bioactivity [12], it is suitable for the preparation of long-term DDSs [13]. Because of their hydrophobic nature, lipophilic drugs can be homogeneously distributed in their polymeric chains [14], which is a factor that contributes to achieving modulated drug release.
PEG is highly soluble in water, FDA-approved, and biocompatible. This polyether is widely available for preparing novel DDSs, owing to its low toxicity, non-immunogenicity, non-antigenicity, and biological inertness [15,16]. The covalent addition of PEG to one or more molecules, known as PEGylation, is an efficient chemical approach used for drug delivery [17]. Carriers not modified with hydrophilic polymers are susceptible to phagocytosis and the action of the reticuloendothelial system [3]. To prepare a “stealthy” system, PEGylation can be employed to protect a hydrophobic carrier from opsonization.
Amphiphilic block copolymers formed via hydrophobic and hydrophilic segments of biodegradable and biocompatible polymers have gained considerable attention in drug delivery [18]. PLA, PCL, and PEG have been widely used to prepare nanoparticles of segmented copolymers, and their capacity to act as effective nanocarriers that achieve controlled drug delivery has been investigated [19]. Special attention has been paid to the nanocarrier–architecture relationship and its impact on systems that enable stable and safe drug release [20]. Several studies have reported the efficacy of PLA, PCL, and PEG-based segmented copolymers for drug delivery. Thus, the delivery of drugs (such as doxorubicin, an anticancer drug) from the nanoparticles of PCL–PEG copolymers with a complex topology can be optimized by tuning the structure of these copolymers [21]. Poorly water-soluble drugs (such as silibinin, an anticancer agent) have been moderately incorporated into a PEG–PLA–poly(α–benzylcarboxylate–ε–caprolactone) (PBCL) block copolymer to achieve cancer tumor-targeted delivery [22]. Amphiphilic block copolymers can be prepared through two typical routes: (i) via ring-opening copolymerization [23] and (ii) via a linker agent [24]. In this sense, oxalyl chloride has been used as an efficient linker. Its chemical structure has two acyl chloride groups that easily react with hydroxyl groups. Therefore, acyl chloride-capped polymers can be obtained after adding an excess of oxalyl chloride to polymers with terminal hydroxyl groups. After this, other polymers with hydroxyl end groups can react with the acyl chloride end group to obtain a block copolymer [25].
Although copolymers prepared using PLA, PEG, and PCL have relevant advantages for drug delivery, they also have limitations such as an initial “burst release” induced via the high crystallinity of the PCL [26]. The “burst release” phenomenon occurs when a sensitive polymer used as a drug carrier delivers high concentrations of the transported substance after coming into contact with the release medium. After an initial high delivery, a stable release can be achieved [27]. Some positive and negative consequences of “burst release” are known. For example, using modern antimicrobial drugs is desirable to achieve an “impact” dose in the initial stage, in which a high drug concentration is delivered to reduce bacterial growth in the shortest time possible. After this, in the second stage, it is necessary to obtain a gradual release rate [28]. However, to achieve a long-term optimal release, it is necessary to adjust the initial amount of drug released by reducing the “burst release” [29].
Carbon nanotubes (CNTs) are emerging DDSs suitable for cancer treatment [30]. Owing to their large surface and cavity structures, CNTs can load high amounts of drugs [31]. Although they have outstanding properties, pristine CNTs are cytotoxic; to overcome this drawback, it is necessary to achieve adequate chemical functionalization [32]. Functionalized CNTs (f–CNTs) show suitable biocompatibility, and living organisms can excrete them [33]. Furthermore, f–CNTs have the potential for use in the synthesis of polymer nanocomposites that can serve as nanocarriers. For this, the “grafting to” approach (in which the f–CNTs are attached to a well-defined polymer previously presynthesized [34]) is suitable for the preparation of a polymeric nanocarrier with excellent physicochemical properties. In fact, CNTs are a valuable alternative to other nanostructures, such as boron nitride nanotubes (BNNTs), which also have high potential for use in the preparation of polymer-based nanocarriers [35].
Here, the synthesis and characterization of nanocomposites prepared with f–CNTs obtained from partially oxidized CNTs (in which hydroxyl and carboxyl groups were inserted) and a terpolymer of PLLA, PCL, and PEG, prepared using oxalyl chloride as a linker agent, are reported. These nanocomposites were synthesized to investigate their capacity to act as sensitive nanocarriers. Accordingly, a series of PLLAs and PCLs were synthesized through ROP and characterized using gel permeation chromatography (GPC). Pure PEG and the synthesized PLLAs and PCLs were studied using differential scanning calorimetry (DSC). The PLLA–PCL copolymers and PLLA–PCL–PEG terpolymers were synthesized using oxalyl chloride as a linker agent and characterized through the following spectroscopic techniques: Fourier-transform infrared (FTIR), proton nuclear magnetic resonance (1H–NMR), and 13carbon nuclear magnetic resonance (13C–NMR), as well as DSC. The PLLA–PCL–PEG terpolymers and their nanocomposites were analyzed using X-ray photoelectron spectroscopy (XPS). The characterization of the nanocomposites was completed through FTIR and DSC. The capacity of releasing methotrexate (an anticancer drug) from the PLLA–PCL–PEG terpolymers and their nanocomposites was evaluated through ultraviolet–visible spectroscopy (UV–vis), and various mathematical models were used to fit the experimental data. Moreover, the ability of the nanocomposites to reduce the “burst release” phenomenon detected on the release tests of the pure PLLA–PCL–PEG terpolymers was assessed.

2. Materials and Methods

2.1. Materials

L–Lactide (L–LA) ((3S)–cis–3,6–dimethyl–1,4–dioxane–2,5–dione) (98%), ε–caprolactone (ε–CL) (97%), tin(II) 2–ethylhexanoate (stannous octoate, SnOct2) (96%), 1,4–butanediol (BD) (99%), calcium hydride (>90%), triethylamine (ET3N) (99.5%), toluene (ACS reagent) (99.5%), methanol (ACS reagent) (99.8%), dichloromethane anhydrous (99.8%), oxalyl chloride (OxCl) (98%), tetrahydrofuran (THF) (ACS grade), poly(ethylene glycol) (PEG) (Mn = 10,000), phosphate-buffered saline (PBS) at pH 7.4, methotrexate (4–amino–10–methylfolic acid) MW = 454.44 g/mol, and ethanol (ACS reagent) were purchased from Sigma–Aldrich (Saint Louis, MO). Alumina boats were obtained from Alfa Aesar (Tewksbury, MA). Ethanol absolute (99.5%), hydrochloric acid (ACS reagent), and ferric nitrate nonahydrate (Fe(NO3)3∙9H2O) were acquired from Golden Bell (Guadalajara, Mexico). Petroleum ether (ACS reagent) (distillation range: 20 °C (293.15 K)–60 °C (333.15 K)) was purchased from Almacen de Drogas la Paz (Guadalajara, Mexico). Nitrogen gas (99.99%) was obtained from INFRA (Guadalajara, Mexico). Argon gas (99.998%) was provided by Linde (Guadalajara, Mexico). Deionized and bi-distilled water was purchased from Productos Selectropura (Guadalajara, Mexico). The chemical reagents mentioned above were used without purification, except for ε–CL, which was dried with calcium hydride under constant stirring for 48 h before use. The flask in which the mixture of ε–CL/calcium hydride was deposited was connected to a Schlenk line under a nitrogen atmosphere. Then, an exhaustive refilling process was repeated three times to separate the wet calcium hydride from the dry ε–CL. The dry ε–CL was deposited into a container and placed in a desiccator until use. The amount of water contained in unpurified BD was determined using the Karl Fischer method, resulting in 16.3 wt.%. The measurement was repeated three times. Therefore, the BD used in this work was named wet BD.

2.2. Preparation, Purification, and Chemical Modification of the Prepared CNTs

The CNTs were synthesized using the chemical vapor deposition (CVD) method with Fe as a catalyst and ethanol as a carbon source. A detailed description of the synthesis procedure was previously reported by our research group elsewhere [36]. The prepared CNTs were purified using a solution of HNO3 (37.5 wt.%) in water (1:3 v/v). The purified CNTs were repeatedly washed with bi-distilled water until a pH of 7 was achieved and then oven-dried at 50 °C (323.15 K). The detailed purification pathway was previously reported elsewhere [37]. The purified CNTs were named CNTspuri. CNTspuri were chemically functionalized through an oxidation process. For this, 1 g of CNTspuri was deposited into a 250-mL glass container of Soxhlet extraction equipment. Subsequently, 140 mL of 4 M nitric acid solution was aggregated. The mixture was heated until the boiling point was reached and maintained under reflux for 5 h. The product (partially oxidized CNTs) was named CNTspo, and it was recovered through centrifugation. Finally, the CNTspo were washed with bi-distilled water several times until a pH of 7 was obtained and then oven-dried at 50 °C (323.15 K) for 72 h. The dry CNTspo were stored in a desiccator until use. For this way, carbonyl, hydroxyl, and carboxyl chemical groups were inserted on the walls of the CNTspo.

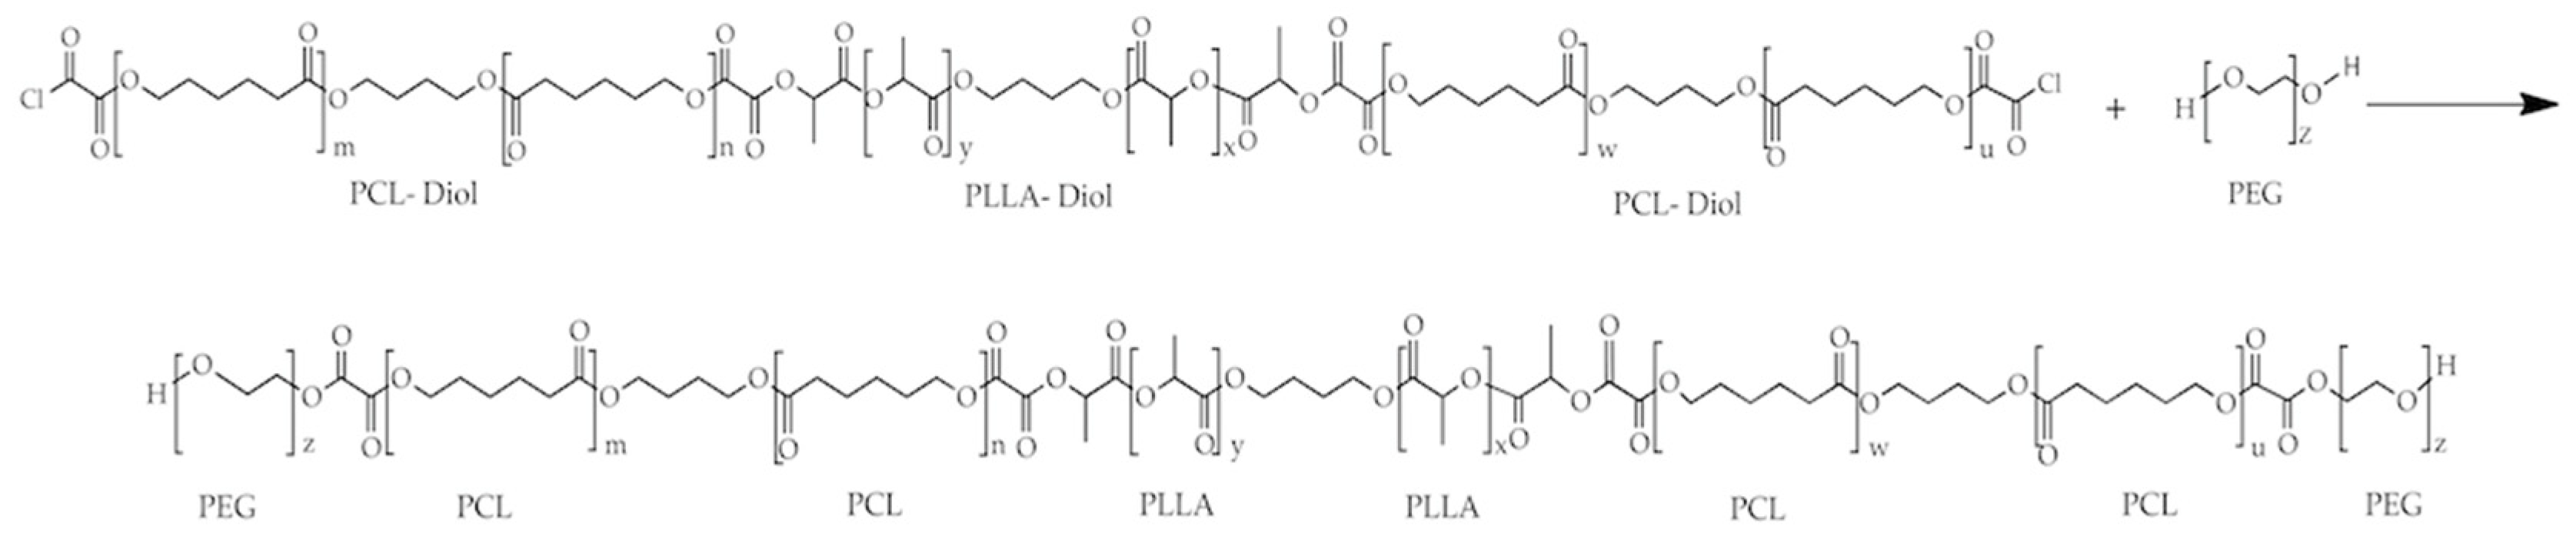
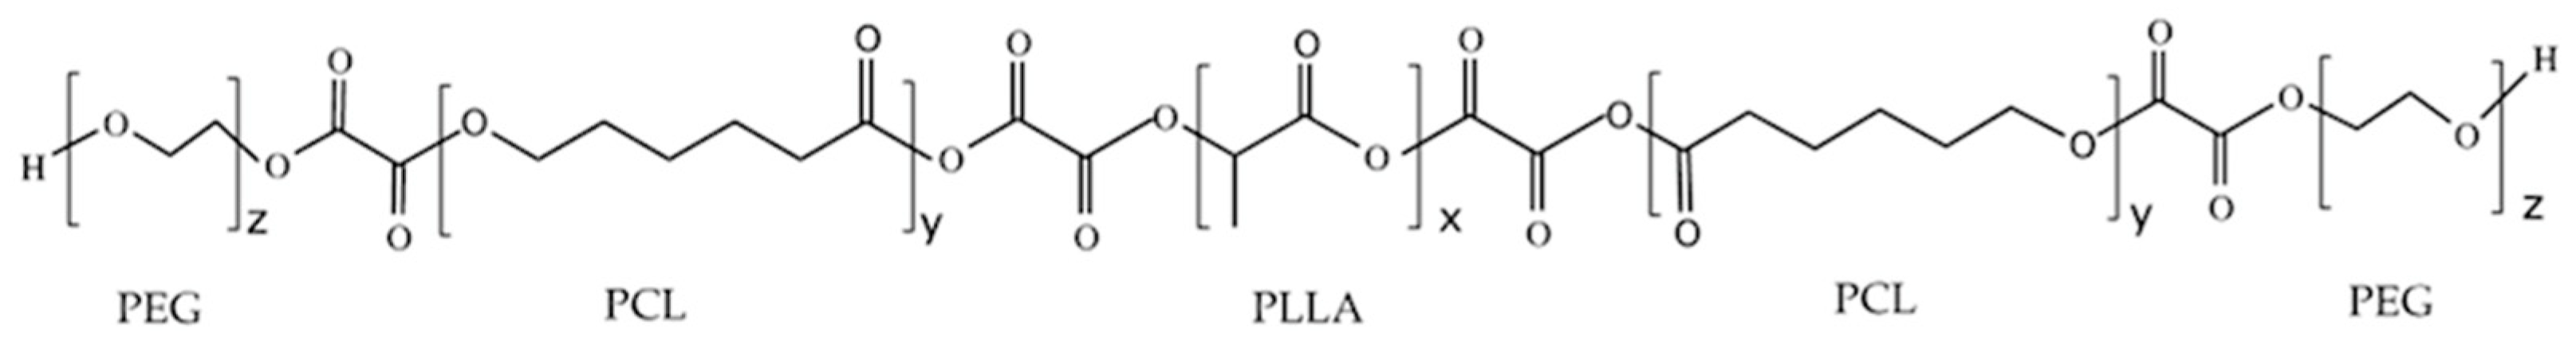
2.3. Synthesis of PLLA–PCL–PEG Terpolymers

PLLA–PCL–PEG terpolymers were synthesized following a chemical path of four steps. First, a PLLA homopolymer was synthesized through ROP using wet BD as an initiator and SnOct2 as a catalyst. The polymerization reaction was carried out in a 150-mL two-neck, round-bottom glass flask previously dried at 60 °C (333.15 K) for 24 h. L–LA (15 g), wet BD, and SnOct2 at specific amounts, as well as a stirring bar (previously dried at 50 °C (323.15 K) for 24 h), were placed into the flask and connected to a reflux condenser. The flask was partially submerged in an oil bath maintained at 110 °C (383.15 K). Polymerization was performed under a nitrogen atmosphere with stirring for 1 h. After the reaction was completed, the flask was cooled to room temperature. To purify the prepared product, it was dissolved in 20 mL of dichloromethane and poured dropwise into 60 mL of petroleum ether to induce precipitation. The product was maintained at room temperature for 3 h, and the precipitate was recovered through centrifugation. Subsequently, it was washed with methanol and dried at 45 °C (318.15 K) until a constant weight was reached. Four lineal PLLAs were synthesized at the same molar ratio of [L–LA]/[SnOct2] = 300/1 but at four different molar ratios of [L–LA]/[wet BD], which were named as follows: (i) PLLA 1, obtained at [L–LA]/[wet BD] = 30/1; (ii) PLLA 2, prepared at [L–LA]/[wet BD] = 40/1; (iii) PLLA 3, synthesized at [L–LA]/[wet BD] = 50/1; and (iv) PLLA 4, manufactured at [L–LA]/[wet BD] = 60/1. The expected product of this synthesis is PLLA–diol. Second, a series of PCLs were synthesized through ROP again. For this, 10 g of dry ε–CL and a dry stirring bar were placed in a previously dried, 150-mL two-neck, round-bottom glass flask. Then, specific amounts of wet BD and SnOct2, as well as a dry stirring bar, were added, and the flask was partially submerged in an oil bath at 110 °C (383.15 K). The reaction was carried out, maintaining constant nitrogen bubbling with stirring for 1 h. After the reaction was completed, the flask was cooled to room temperature. The reaction product was purified by dissolving it in 20 mL of dichloromethane and then precipitated by adding 60 mL of petroleum ether. The prepared PCL was recovered through centrifugation. Thereafter, the prepared PCL was oven-dried at 45 °C (318.15 K) until a constant weight was reached. Four lineal PCLs were prepared, maintaining the same molar ratio [ε–CL]/[SnOct2] = 300/1 but different molar ratios of [ε–CL]/[wet BD]. The synthesized PCLs were named PCL 1, PCL 2, PCL 3, and PCL 4, and they were synthesized at [ε–CL]/[wet BD] = 30/1, 40/1, 50/1, and 60/1, respectively. Following this procedure, PCL diol species were synthesized. Third, the linear segmented copolymers of PLLA–PCL were synthesized using OxCl as a linker agent, following a two-stage procedure. The four prepared PCLs and the PLLA 1 were chosen to synthesize the PLLA–PCL copolymers. In the first stage, a sample of PLLA 1 reacted with OxCl to prepare a prepolymer. The synthesis was performed in a two-neck, round-bottom glass flask with a septum inlet of 50 mL previously dried at 50 °C (323.15 K) for 12 h. One neck was connected to a reflux condenser, and on the other neck, a septum was adjusted. A steel cannula was inserted into the septum to bubble nitrogen. A certain mass of PLLA 1 was dissolved in 10 mL of dichloromethane, and the dissolution was placed in the flask, which was partially submerged in an oil bath at 35 °C (308.15 K). Then, 30 μL of ET3N dissolved in 5 mL of dichloromethane was added to this flask. Separately, 70 μL of OxCl dissolved in 5 mL of dichloromethane was added dropwise. The mixture was maintained under continuous agitation and with nitrogen bubbling for 1 h. Under these conditions, a chemical reaction between the hydroxyl groups of PLLA 1 and chloride acyl groups of OxCl could be carried out to obtain a prepolymer. In the second step, the synthesis of PLLA–PCL copolymers was carried out. For this, immediately after finishing the first stage, a certain mass of one PCL dissolved in 5 mL of dichloromethane was added to the mass of the prepolymer, and the copolymerization reaction started. The reaction was carried out for 1 h. The masses of PLLA 1 and the PCL used were calculated, maintaining a ratio of two moles of the end groups of PCL to one mole of the end groups of PLLA 1. After the reaction time had elapsed, the reaction mixture was cooled to room temperature, allowed to stand for 24 h, and then purified. For this, a mixture of 15 mL of dichloromethane and 15 mL of toluene was added to dissolve the PCL that did not react. The mixture was stirred for 15 min, filtrated, and then oven-dried at 45 °C (318.15 K) until a constant weight was achieved. Subsequently, the dry solid was dissolved in 15 mL of dichloromethane and precipitated with the addition of 45 mL of petroleum ether. The solid obtained (purified PLLA–PCL copolymer) was recovered and oven-dried until a constant weight was achieved. Four PLLA–PCL copolymers were synthesized: (i) PLLA–PCL 1, prepared with PLLA 1 and PCL 1; (ii) PLLA–PCL 2, obtained with PLLA 1 and PCL 2; (iii) PLLA–PCL 3, manufactured with PLLA 1 and PCL 3; and (iv) PLLA–PCL 4, synthesized with PLLA 1 and PCL 4. Fourth, the PLLA–PCL–PEG terpolymers were obtained through a chemical reaction between the PLLA–PCL copolymers and PEG. Again, a chemical route of two stages was followed. OxCl was used as a linker agent. In the first stage, a certain mass of the PLLA–PCL copolymer was treated with OxCl to synthesize a precursor of the terpolymer. To perform the synthesis, a 50-mL two-neck, round-bottom glass flask immersed in an oil bath at 35 °C (308.15 K) was used. Initially, a certain mass of one PLLA–PCL copolymer was dissolved in 10 mL of dichloromethane, and the dissolution was deposited in the flask. Then, 30 μL of ET3N dissolved in 5 mL of dichloromethane was added. Another solution of 70 μL of OxCl dissolved in 5 mL of dichloromethane was added. The mixture was reacted for 1 h under a nitrogen atmosphere. In this way, the hydroxyl end groups of the PLLA–PCL copolymer can react with one acyl chloride group of OxCl. In the second stage, the complete preparation of the terpolymers was achieved. After the reaction time of the first stage had elapsed, a certain mass of PEG dissolved in 5 mL of dichloromethane was added to the precursor, and the mixture was maintained under nitrogen bubbling for 1 h. The mass of PEG added was calculated to maintain a molar ratio of two moles of the end groups of PEG by one mole of the end groups of the PLLA–PCL copolymer, under the assumption that this copolymer has a chemical structure composed of three segments: PCL–PLLA–PCL. The reaction product was cooled to room temperature and then purified after 24 h. Purification was carried out by washing the product prepared with methanol to dissolve the PEG that did not react. Then, the purified product (PLLA–PCL–PEG terpolymer) was oven-dried at 45 °C (318.15 K) until constant weight was reached. The prepared terpolymers were named PLLA–PCL–PEG 1, PLLA–PCL–PEG 2, PLLA–PCL–PEG 3, and PLLA–PCL–PEG 4, which were synthesized via the chemical reaction between PLLA–PCL 1, PLLA–PCL 2, PLLA–PCL 3, and PLLA–PCL 4 with PEG, respectively. Scheme 1 shows the expected chemical reaction for the preparation of PLLA–PCL–PEG terpolymers from the PLLA–PCL copolymer, as described above.

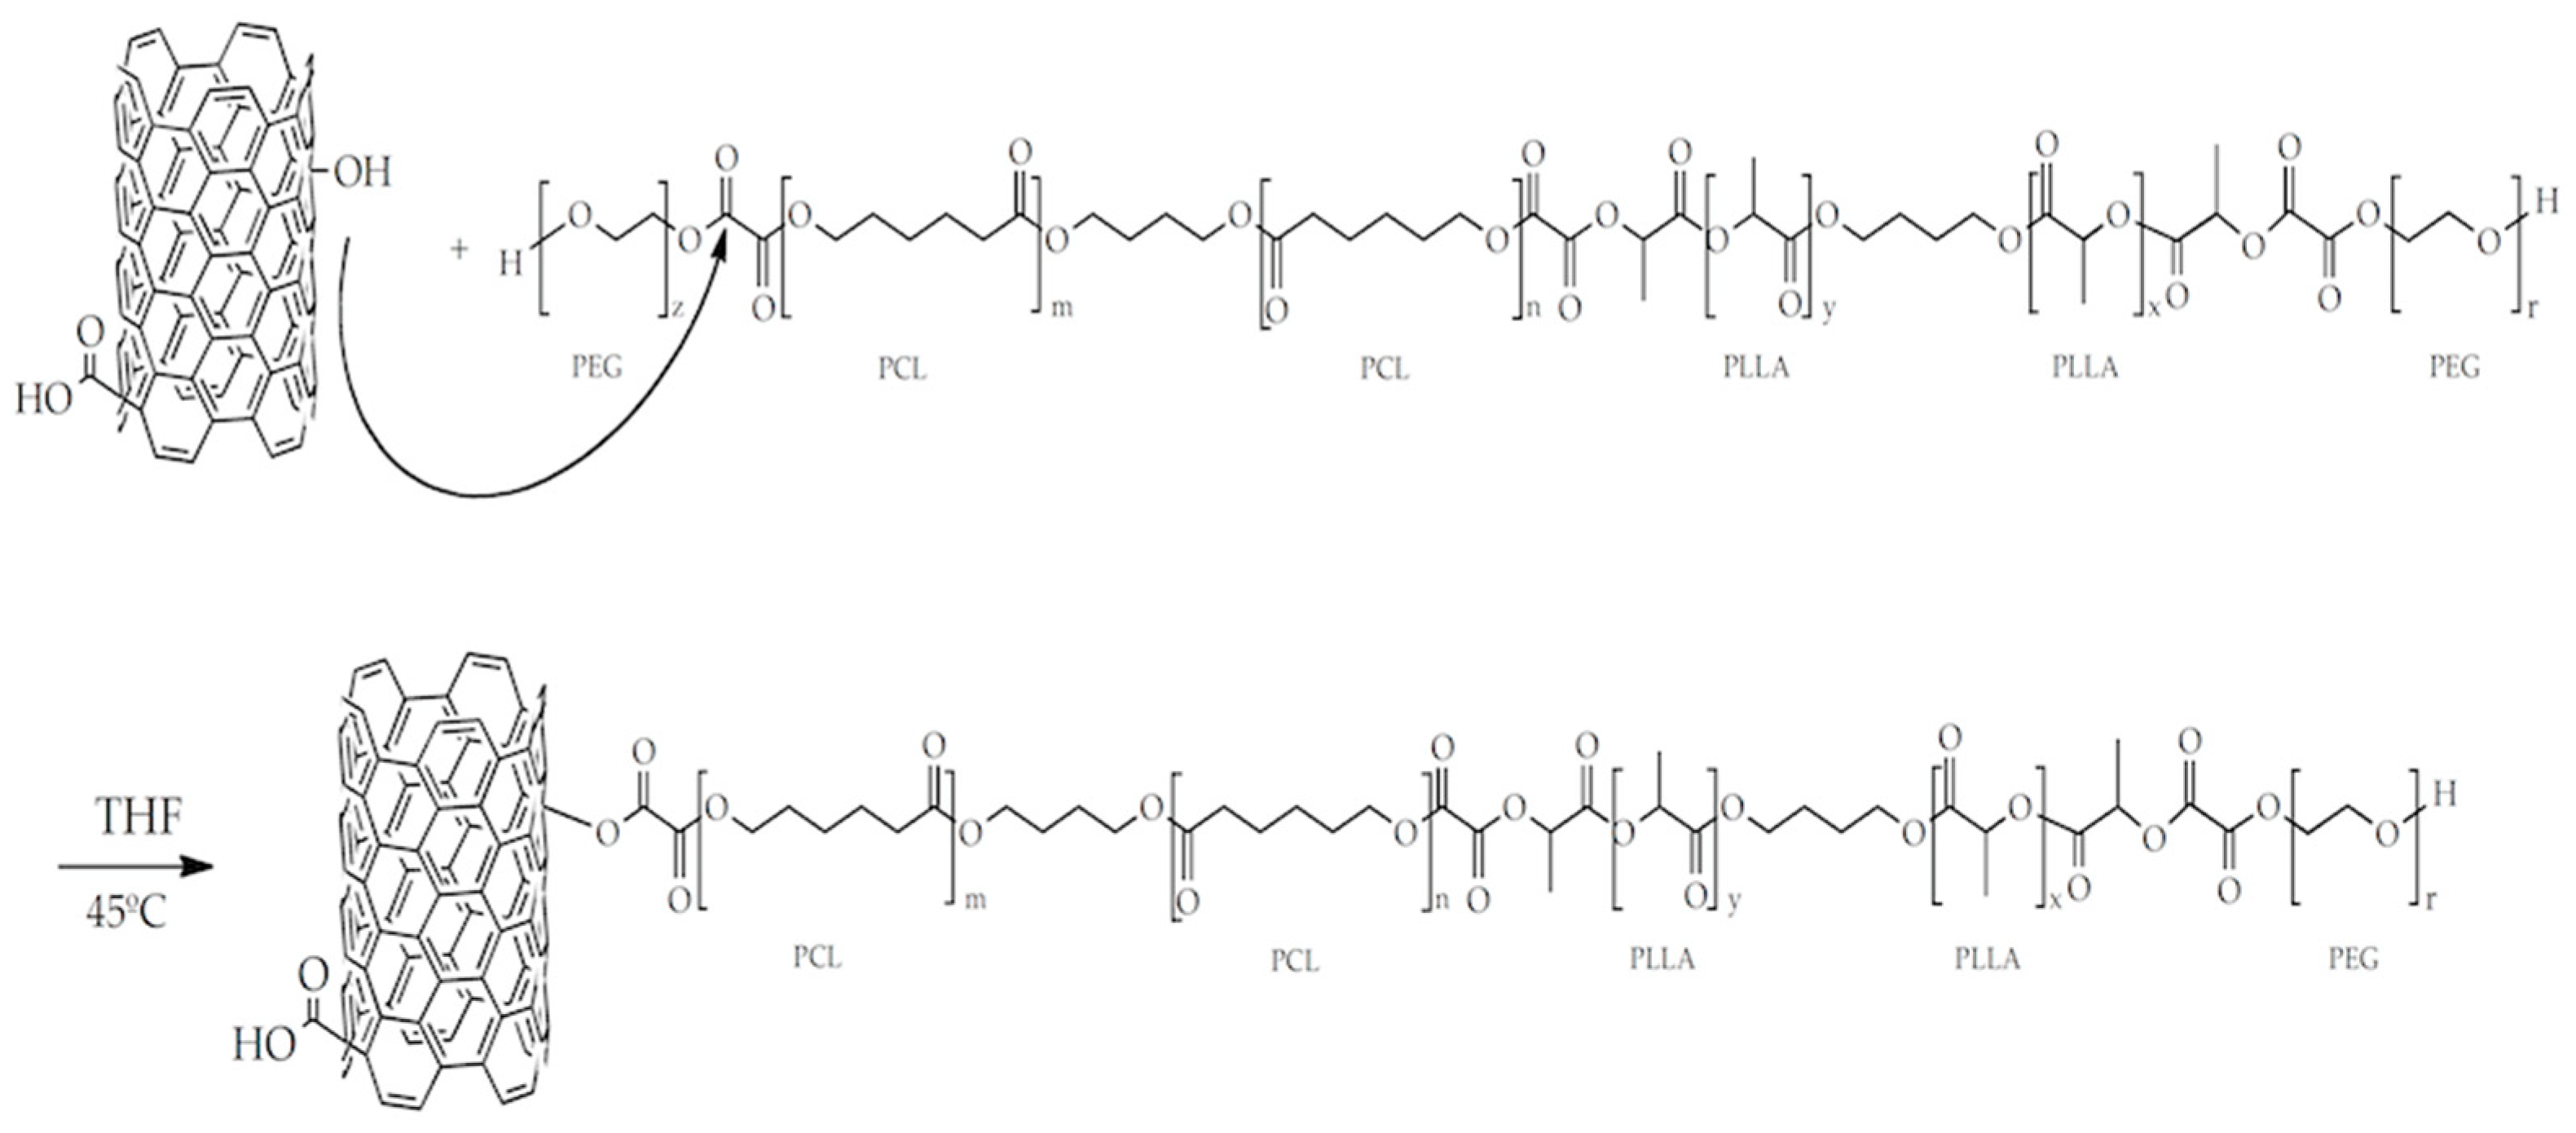
2.4. Synthesis of PLLA–PCL–PEG/CNTpo Nanocomposites

To prepare the PLLA–PCL–PEG/CNTpo nanocomposites, a certain mass of each PLLA–PCL–PEG terpolymer was dissolved in THF. In this solution, 1.0 wt.% or 0.5 wt.% of CNTspo was added. The dispersion obtained was placed in a Petri dish and sonicated in model 3510R–MTH Bransonic Ultrasonic Cleaner (Danbury, USA) (using an amplitude of 42 KHz ±   6 % , and a power of 100 W) for at least 30 min at 40 °C (313.15 K) until the solvent evaporated. The Petri dish was heated in an oven at 45 °C (318.15 K) to eliminate the solvent residual. Subsequently, the prepared and dried nanocomposites were stored in a desiccator. Table 1 lists the names of the PLLA–PCL–PEG terpolymers used as polymer matrices of the prepared PLLA–PCL–PEG/CNTpo nanocomposites and the contents (in wt.%) of CNTspo of each nanocomposite.

2.5. Characterization of CNTspo, PLLA–PCL–PEG Terpolymers, and PLLA–PCL–PEG/CNTpo Nanocomposites

The prepared CNTspo, synthesized PLLA and PCL homopolymers, homopolymer PEG, synthesized PLLA–PCL copolymers, and PLLA–PCL–PEG terpolymers, as well as the obtained PLLA–PCL–PEG/CNTpo nanocomposites, were characterized using the techniques described as follows.

2.5.1. Characterization of the Functionalized CNTs

The amount of carboxyl and hydroxyl groups inserted on the walls of the CNTspo was determined using two methods reported elsewhere [36,38]. Both methods were based on the back-titration of a hydrochloric acid solution. This solution reacts with the excess of a sodium hydroxide solution to determine the amount of hydroxyl groups, or with an excess of a sodium bicarbonate solution to calculate the amount of carboxyl groups. The determinations were conducted based on the mass of CNTspo.

2.5.2. GPC

GPC was employed to determine the molar masses of the synthesized polymers and their molar mass distributions. For this, dilute solutions of each sample were prepared. These solutions were prepared by dissolving 10 mg of the sample in 2 mL of THF. Subsequently, they were filtered through a 0.45-mm-pore and 13-mm-diameter filter (GHP Acrodisc Gelman (St. Louis, MO, USA)). The measurements were made in a Waters model 2414 chromatograph provided with Waters Styragel columns, which cover the range of 500–300,000 Da, and a refraction index detector. All tests were conducted using THF as an eluent (1.0 mL/min) at 30 °C (303.15 K). Calibration was performed using polystyrene standards. The data treatment was performed using the Empower software (version 2).

2.5.3. Proton and Carbon–13 Nuclear Magnetic Resonance (1H– and 13C–NMR)

The 1H– and 13C–NMR spectra of the PLLA–PCL copolymers and the PLLA–PCL–PEG terpolymers were recorded at room temperature using Bruker Avance III 500 (MHz) (Billerica, USA). Chemical shifts (ppm) were relative to the remaining nondeuterated chloroform signal (from CDCl3) and used as an internal reference for 1H NMR spectroscopy. The peaks for PLLA moiety appeared at 1.60 and 5.2 ppm due to the (–CH3) and (–CH–) groups, respectively, in all samples. The peaks for PCL appeared at 4.0 ppm [–(CH2)4CH2OC(O)–]n, 2.3 ppm (–(CH2)4CH2COO–), 1.6 ppm (–(CH2CH2CH2CH2CH2COO–), and 1.35 ppm (–CH2CH2CH2CH2CH2COO–). The end groups due to the PLLA methine end group (–CH3CHOH) were seen at 4.4 ppm. This peak was superimposed with other peaks. The peaks for the ε–CL end group –CH2OH appeared at ca. 3.65 ppm, whereas those for PEG methylene (OCH2CH2) appeared at ca. 3.60 ppm.
The 13C–NMR spectra were also recorded using a Bruker Avance III 500 MHz spectrometer (Billerica, USA). The peaks for PLLA moiety appeared at 16.7, 69.1, and 169.6 ppm due to the (–CH3), (–CH–), and (C=O) groups, respectively, in all samples. The peaks for PCL appeared at 64.2 ppm [–(CH2)4CH2OC(O)–]n, 34.1 ppm (–(CH2)4CH2COO–), 28.3 ppm (–(CH2CH2CH2CH2CH2COO–), 24.5 ppm (–(CH2CH2CH2CH2CH2COO–), 25.5 ppm (–CH2CH2CH2CH2CH2COO–), and 173.6 ppm for ester carbonyl. The signal peak for PEG methylene (OCH2CH2) was seen at 70.5 ppm.

2.5.4. Fourier-Transform Infrared Spectroscopy (FTIR)

The vibrational behaviors of the CNTpo, PLLA, PCL, and PEG homopolymers, PLLA–PCL–PEG terpolymers, and PLLA–PCL–PEG/CNTpo nanocomposites were analyzed using FTIR. For this, a Perkin Elmer Spectrum One spectrophotometer was used. To obtain the spectra, all samples were dried in a vacuum oven at 50 °C (323.15 K) until a constant weight was achieved. Similarly, KBr was dried in a vacuum oven at 100 °C (373.15 K) for 24 h. Then, dry samples were mixed with dry KBr (1 mg of sample by 200 mg of KBr), and pellets were obtained via compression. The spectra were recorded from 4000 to 450 cm−1, averaging 50 scans to reduce the signal/noise ratio, and they were obtained at a resolution of 2 cm−1.

2.5.5. XPS

The PLLA–PCL–PEG terpolymers and PLLA–PCL–PEG/CNTpo nanocomposites were investigated through XPS. The analysis was conducted in a system formed via an XR 50M monochromatic Al 1 ( = 1468.7 eV) X-ray source and a Phoibos 150 spectrometer, which was equipped with a 1D–DLD one-dimensional detector provided by SPECS (Berlin, Germany). For the measurements, the samples were mounted onto a steel sample holder with double-sided copper tape to avoid interference from carbon tape, and they were then dried in a vacuum oven for 24 h. Then, the samples were placed into the prechamber. The measurements were recorded at a base pressure of 4.2 × 10⁻¹⁰ mbar, an electron takeoff angle of 90° at 150 W, a pass energy of 10 eV, and a step size of 0.1 eV. A flood gun was used to compensate for the charge on the samples. The recorded XPS spectra were shifted using the reference of the C–C-binding energy position.

2.5.6. DSC

Thermal characterization of the PLLA, PCL, and PEG homopolymers, PLLA–PCL–PEG terpolymers, and PLLA–PCL–PEG/CNTpo nanocomposites was performed using a Q–100 calorimeter (TA Instruments). DSC thermograms were obtained with a dynamic heating program in a temperature range of −70 °C (203.15 K) to 200 °C (473.15 K) following a heating rate of 10 °C (10 K)/min. An inert atmosphere was maintained by feeding nitrogen at a flow rate of 50 mL/min to the sample camera. The masses of the samples were in the range of 5 to 5.5 mg. Aluminum pans were used to encapsulate the samples. Two scans were recorded, and the second scan was reported. The glass-transition temperature (Tg) of all the analyzed materials was determined using the mid-point criteria.

2.5.7. Ultraviolet–Visible (UV–vis) Spectroscopy

UV–vis spectroscopy was employed to assess the in vitro methotrexate release from the tablets of the PLLA–PCL–PEG 2 and PLLA–PCL–PEG 4 terpolymers, as well as the NC 1, NC 2, NC 3, and NC 4 nanocomposites. For this, an Evolution 220 spectrometer (Thermo Fisher Scientific, Waltham, MA, USA) was utilized. The tablets were prepared by compression-mixing a certain mass of the terpolymers or the mentioned nanocomposites with the methotrexate. The total masses of the tablets were in the range of 50 to 85 mg. The mass ratio of terpolymer or nanocomposite to methotrexate was 10/1. The obtained tablets had a thickness of 4 mm. Each prepared tablet was introduced in a dialysis membrane (SpectraPor, MWCO 3500 Da) and deposited in a 500-mL beaker. After this, 200 mL of PBS buffer at pH 7.4 was added. Then, 4 mL of ethanol was added to inhibit the formation of aggregates of the drug methotrexate [39]. The obtained mixture deposited in the beaker was placed in a dark chamber to protect the methotrexate (a photosensitive substance) from visible light at 37 °C (310.15 K). The mixture was maintained under constant stirring at 250 rpm. Samples (1 mL) of this mixture were taken in the range of 0 to 96 h. After each volumetric sample was withdrawn, the same volume of PBS buffer was added. The evolution of methotrexate release was evaluated by determining the methotrexate concentration and evaluating the absorbance at 302 nm as a function of the time using a calibration curve prepared with solutions of methotrexate in PBS. Each release test was repeated twice.

3. Results and Discussion

3.1. Characterization of the Prepared and Functionalized CNTs

Due to the methodology used to prepare the CNTs in this study being the same as the one already reported by our research group in previous works, some physical characteristics of these nanostructures are known. In this sense, an analysis via high-resolution transmission electron microscopy (HR–TEM) demonstrated that the synthesized CNTs were preferentially multi-walled carbon nanotubes (MWCNTs). Their outer tube diameters ranged from 10 to 45 nm, the graphene sheet numbers ranged from 10 to 40, and the spacing between sheets was ca. 0.34 nm, as was reported elsewhere [40]. Moreover, an analysis using high-resolution scanning electron microscopy (HR–SEM) showed that the population of the purified CNTs (CNTspuri) consists of both straight cylindrical CNTs and helically coiled CNTs, as was reported previously [36].
Concerning functionalized CNTs, the quantification of the hydroxyl and carboxyl groups inserted on the walls of the CNTspo was performed using the aforementioned experimental methods. The carboxyl groups represent 33 wt.% per gram of CNTspo, whereas the hydroxyl groups represent 15 wt.% per gram of CNTspo.

3.2. Characterization via GPC of the Homopolymers of PLLA and PCL

The GPC results of the homopolymerization of L–LA and ε–CL and the yield of both polymerizations are listed in Table 2. These results were obtained from the GPC patterns of the synthesized PLLA and PCL. A high yield ( 90 % ) of all homopolymerization reactions was obtained. As expected, the weight–average molar mass (Mw) of both linear PLLAs and PCLs increased as the molar ratio [L–LA]/[wet BD] and [ε–CL]/[wet BD] reached higher values. The polydispersity index (PDI = Mw/Mn) of the synthesized PLLAs had values close to 1.0, whereas the PDI of the prepared PCLs had slightly larger values.

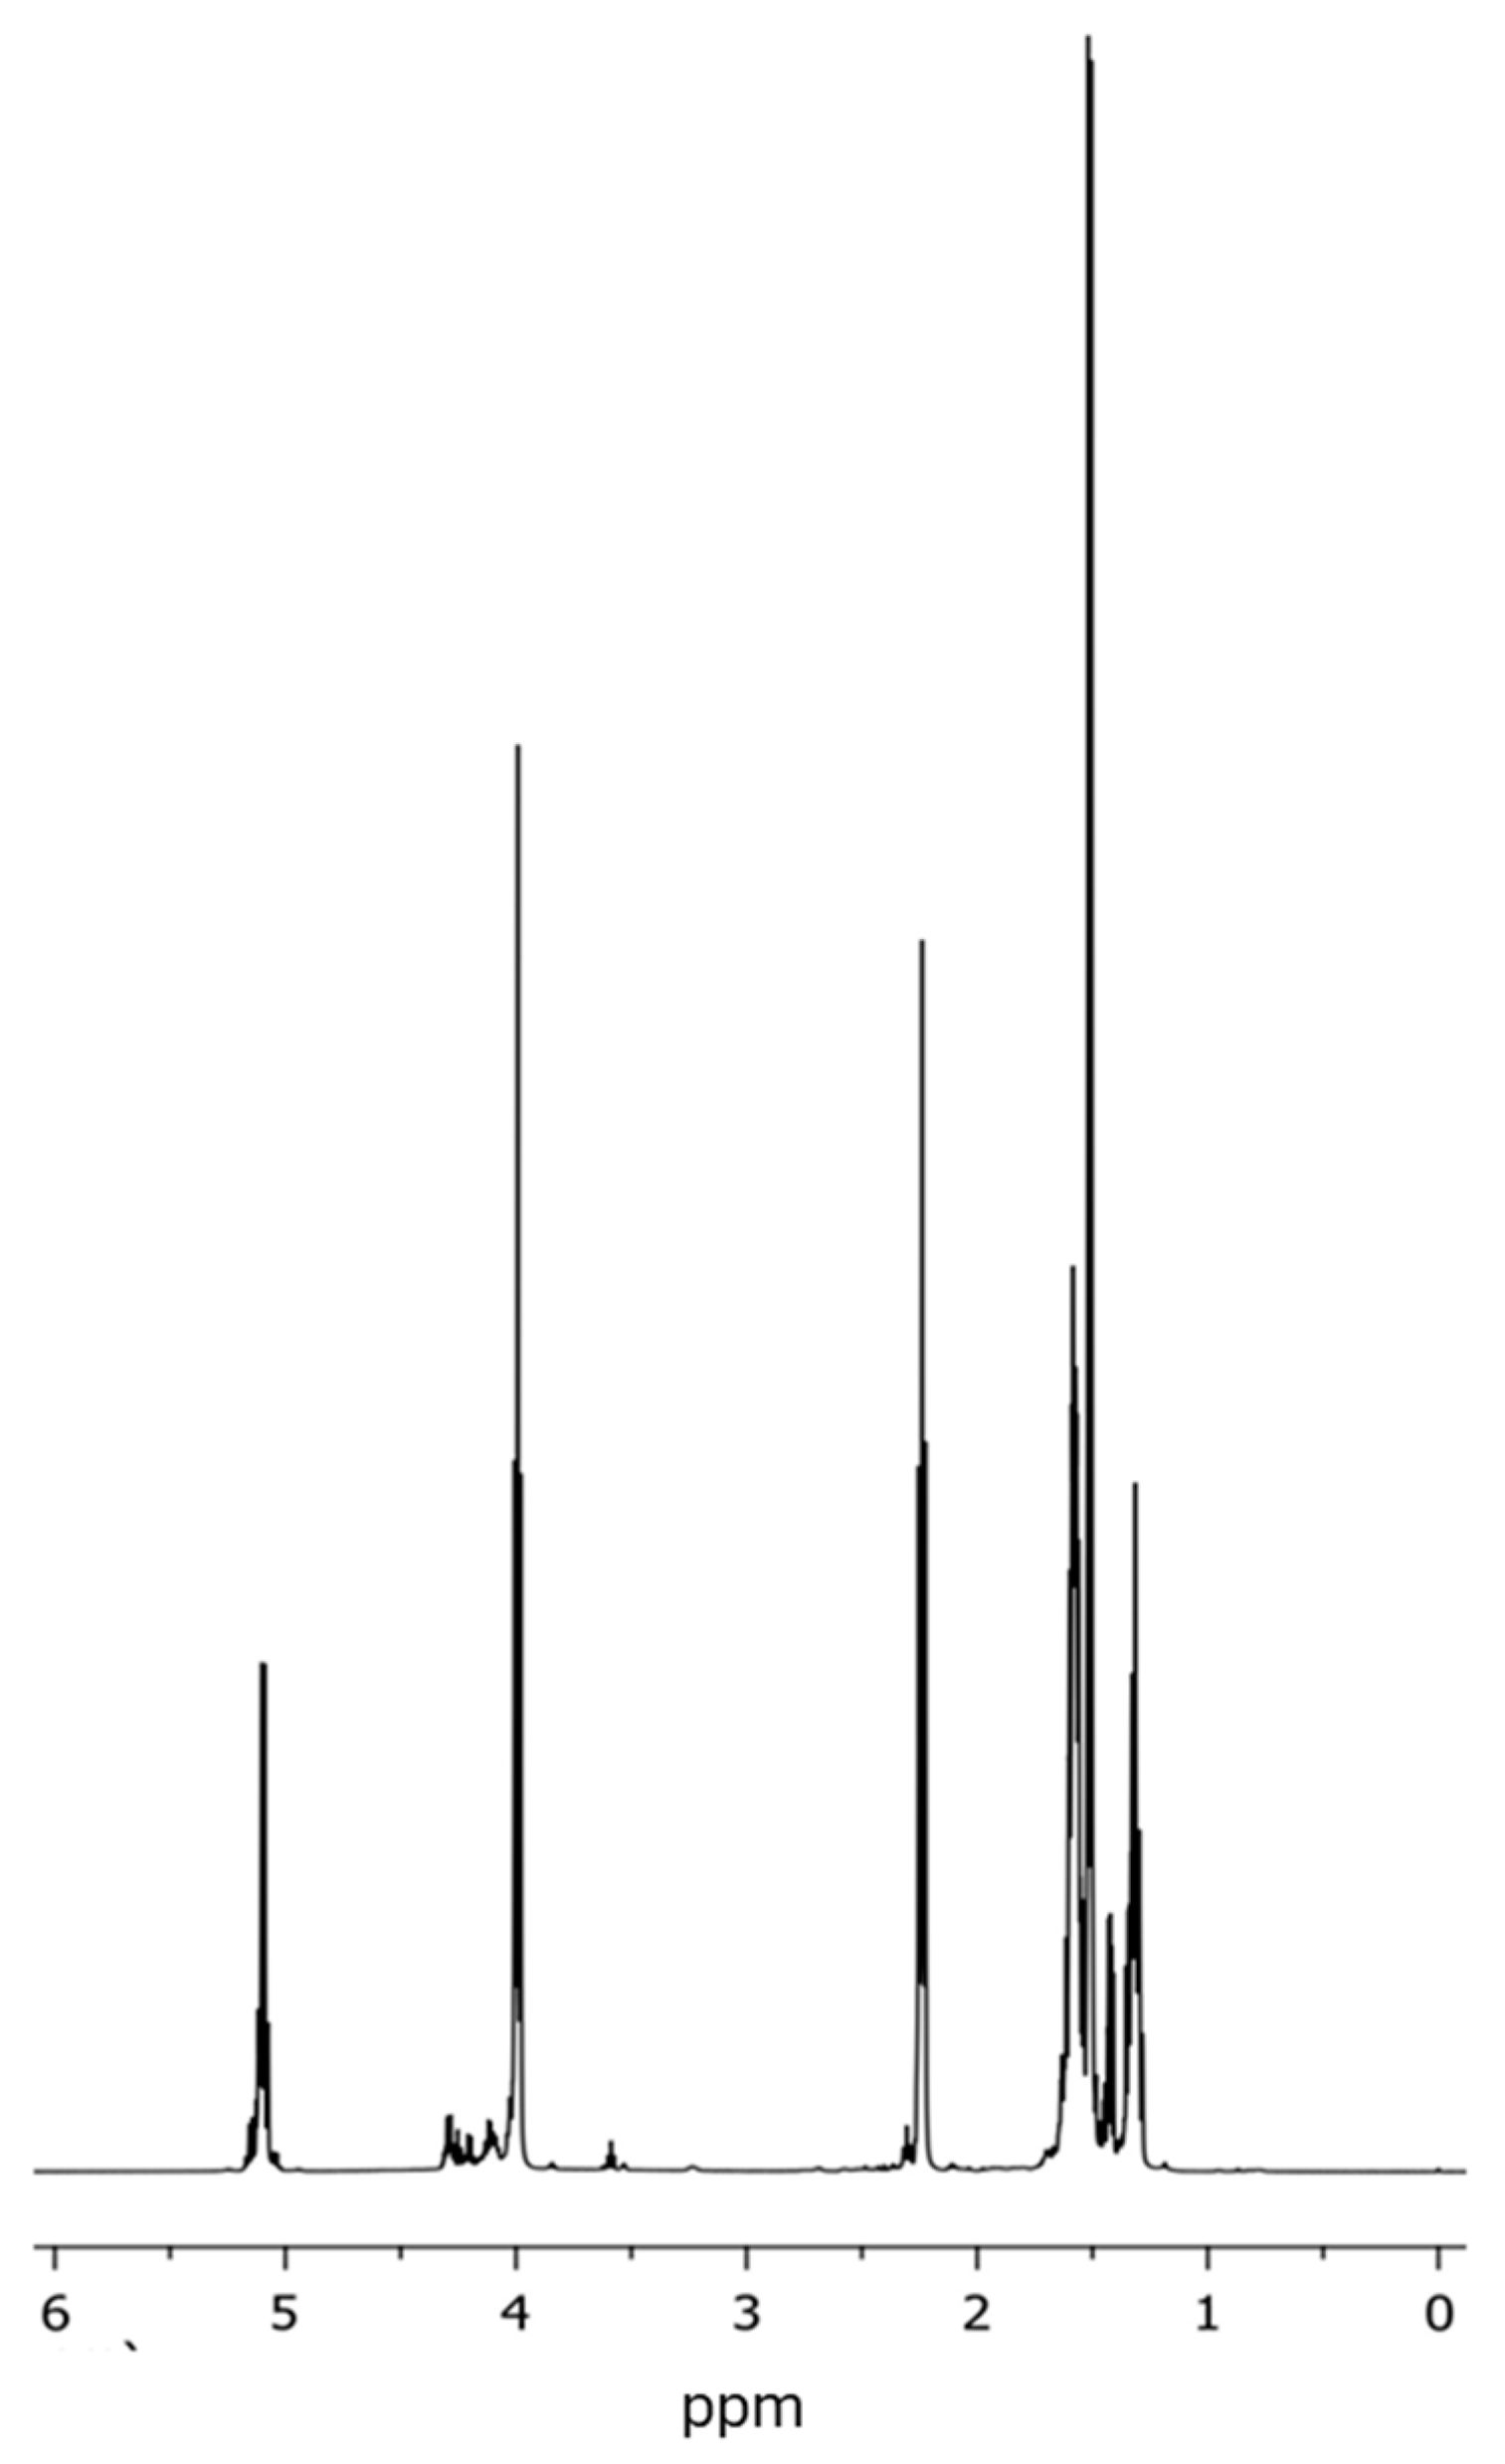
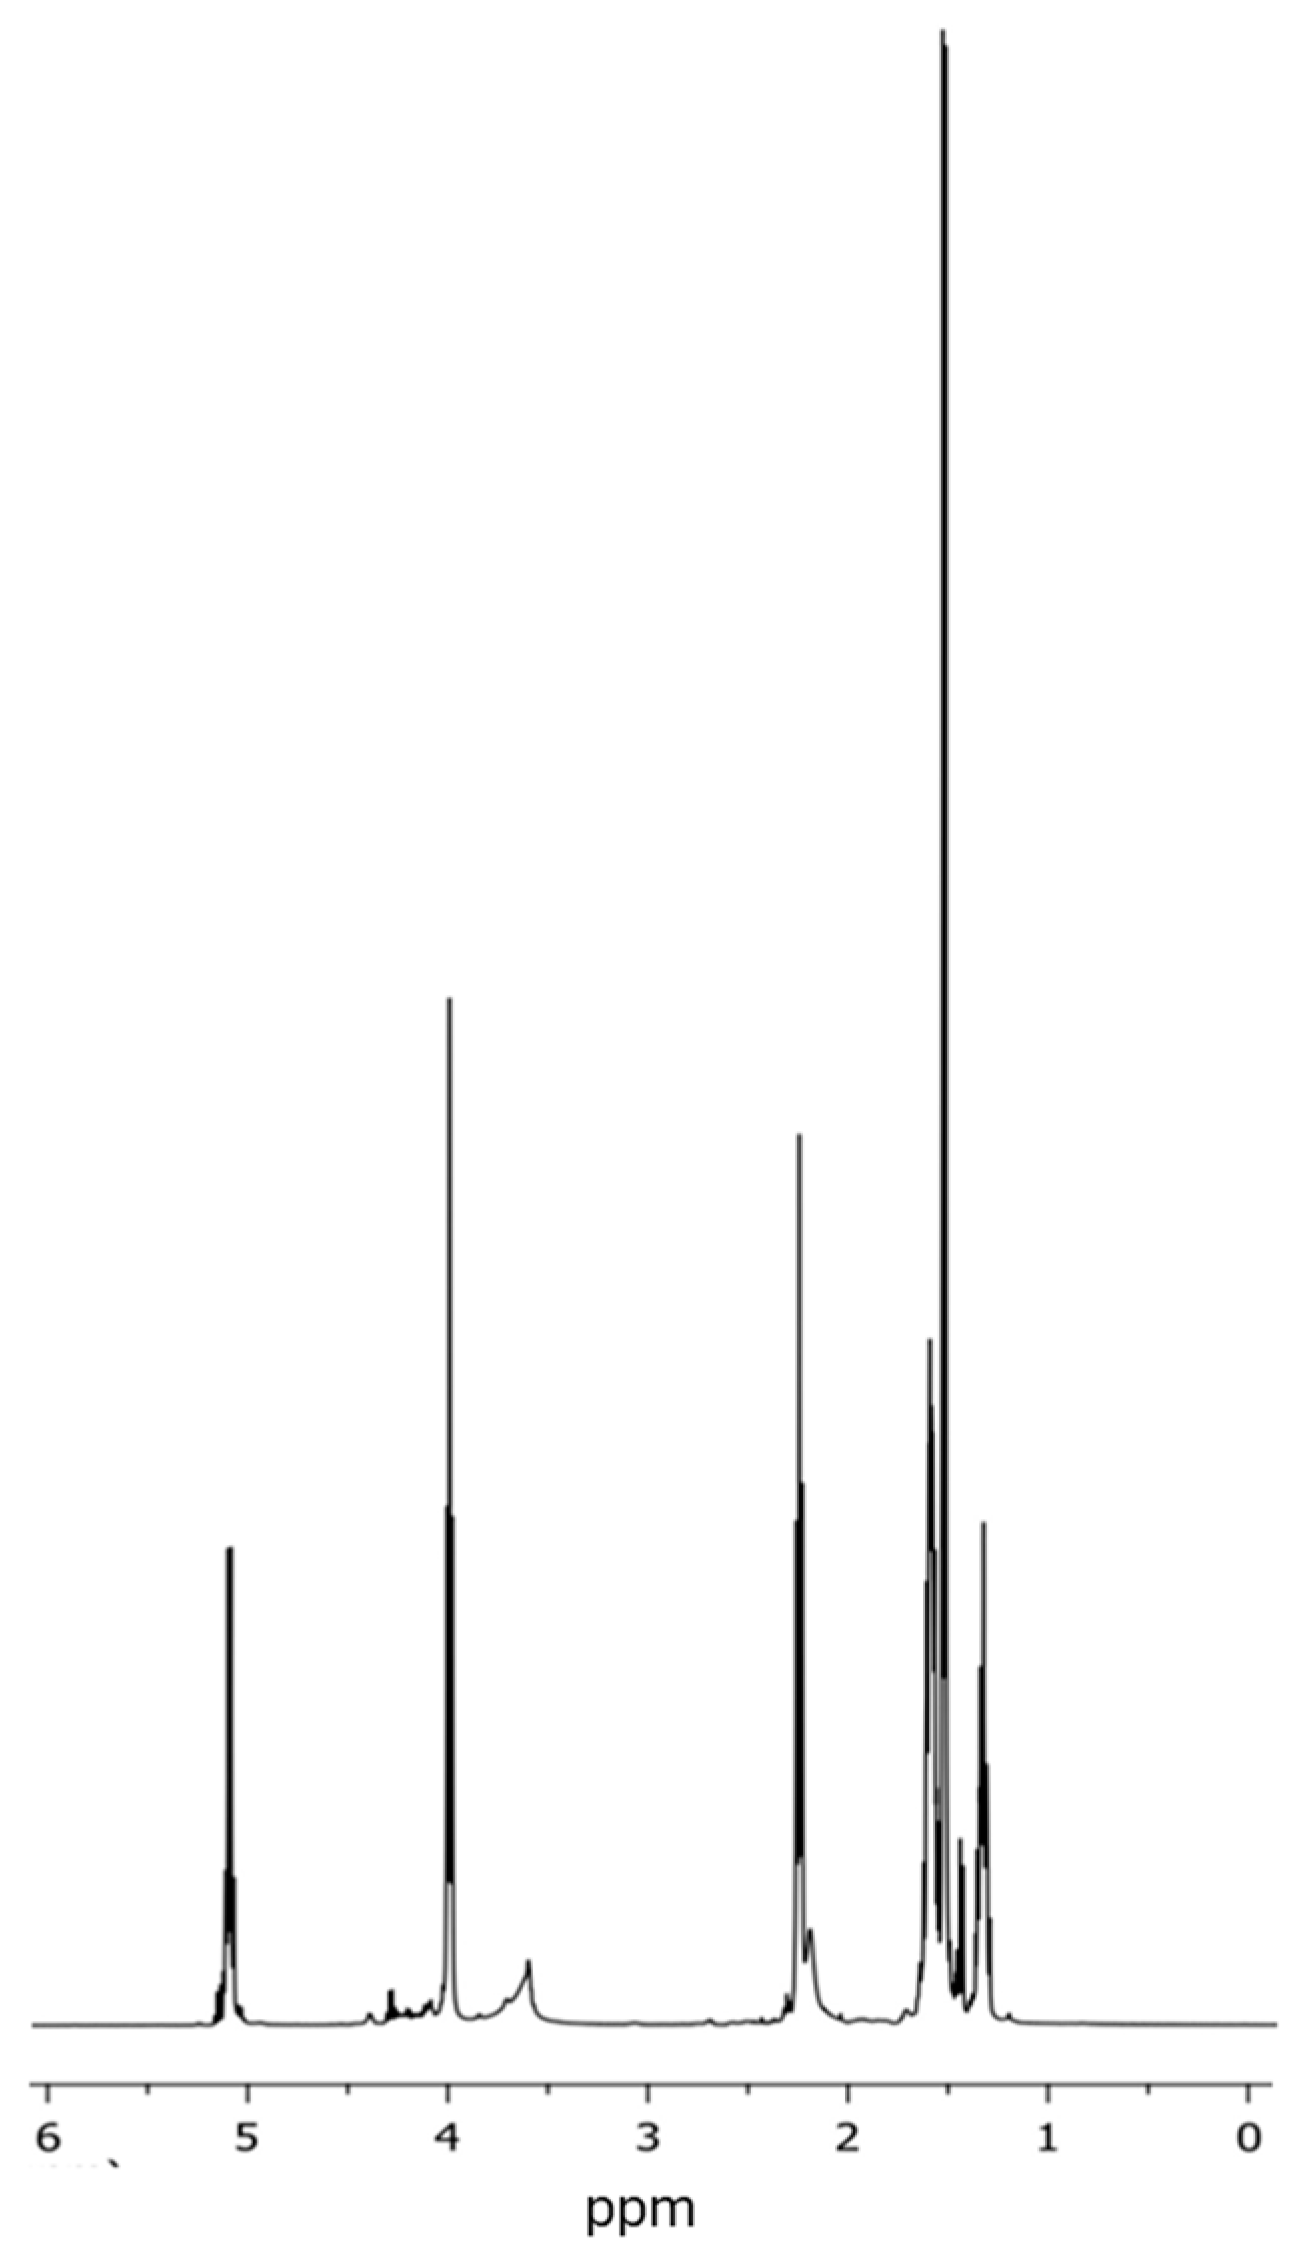
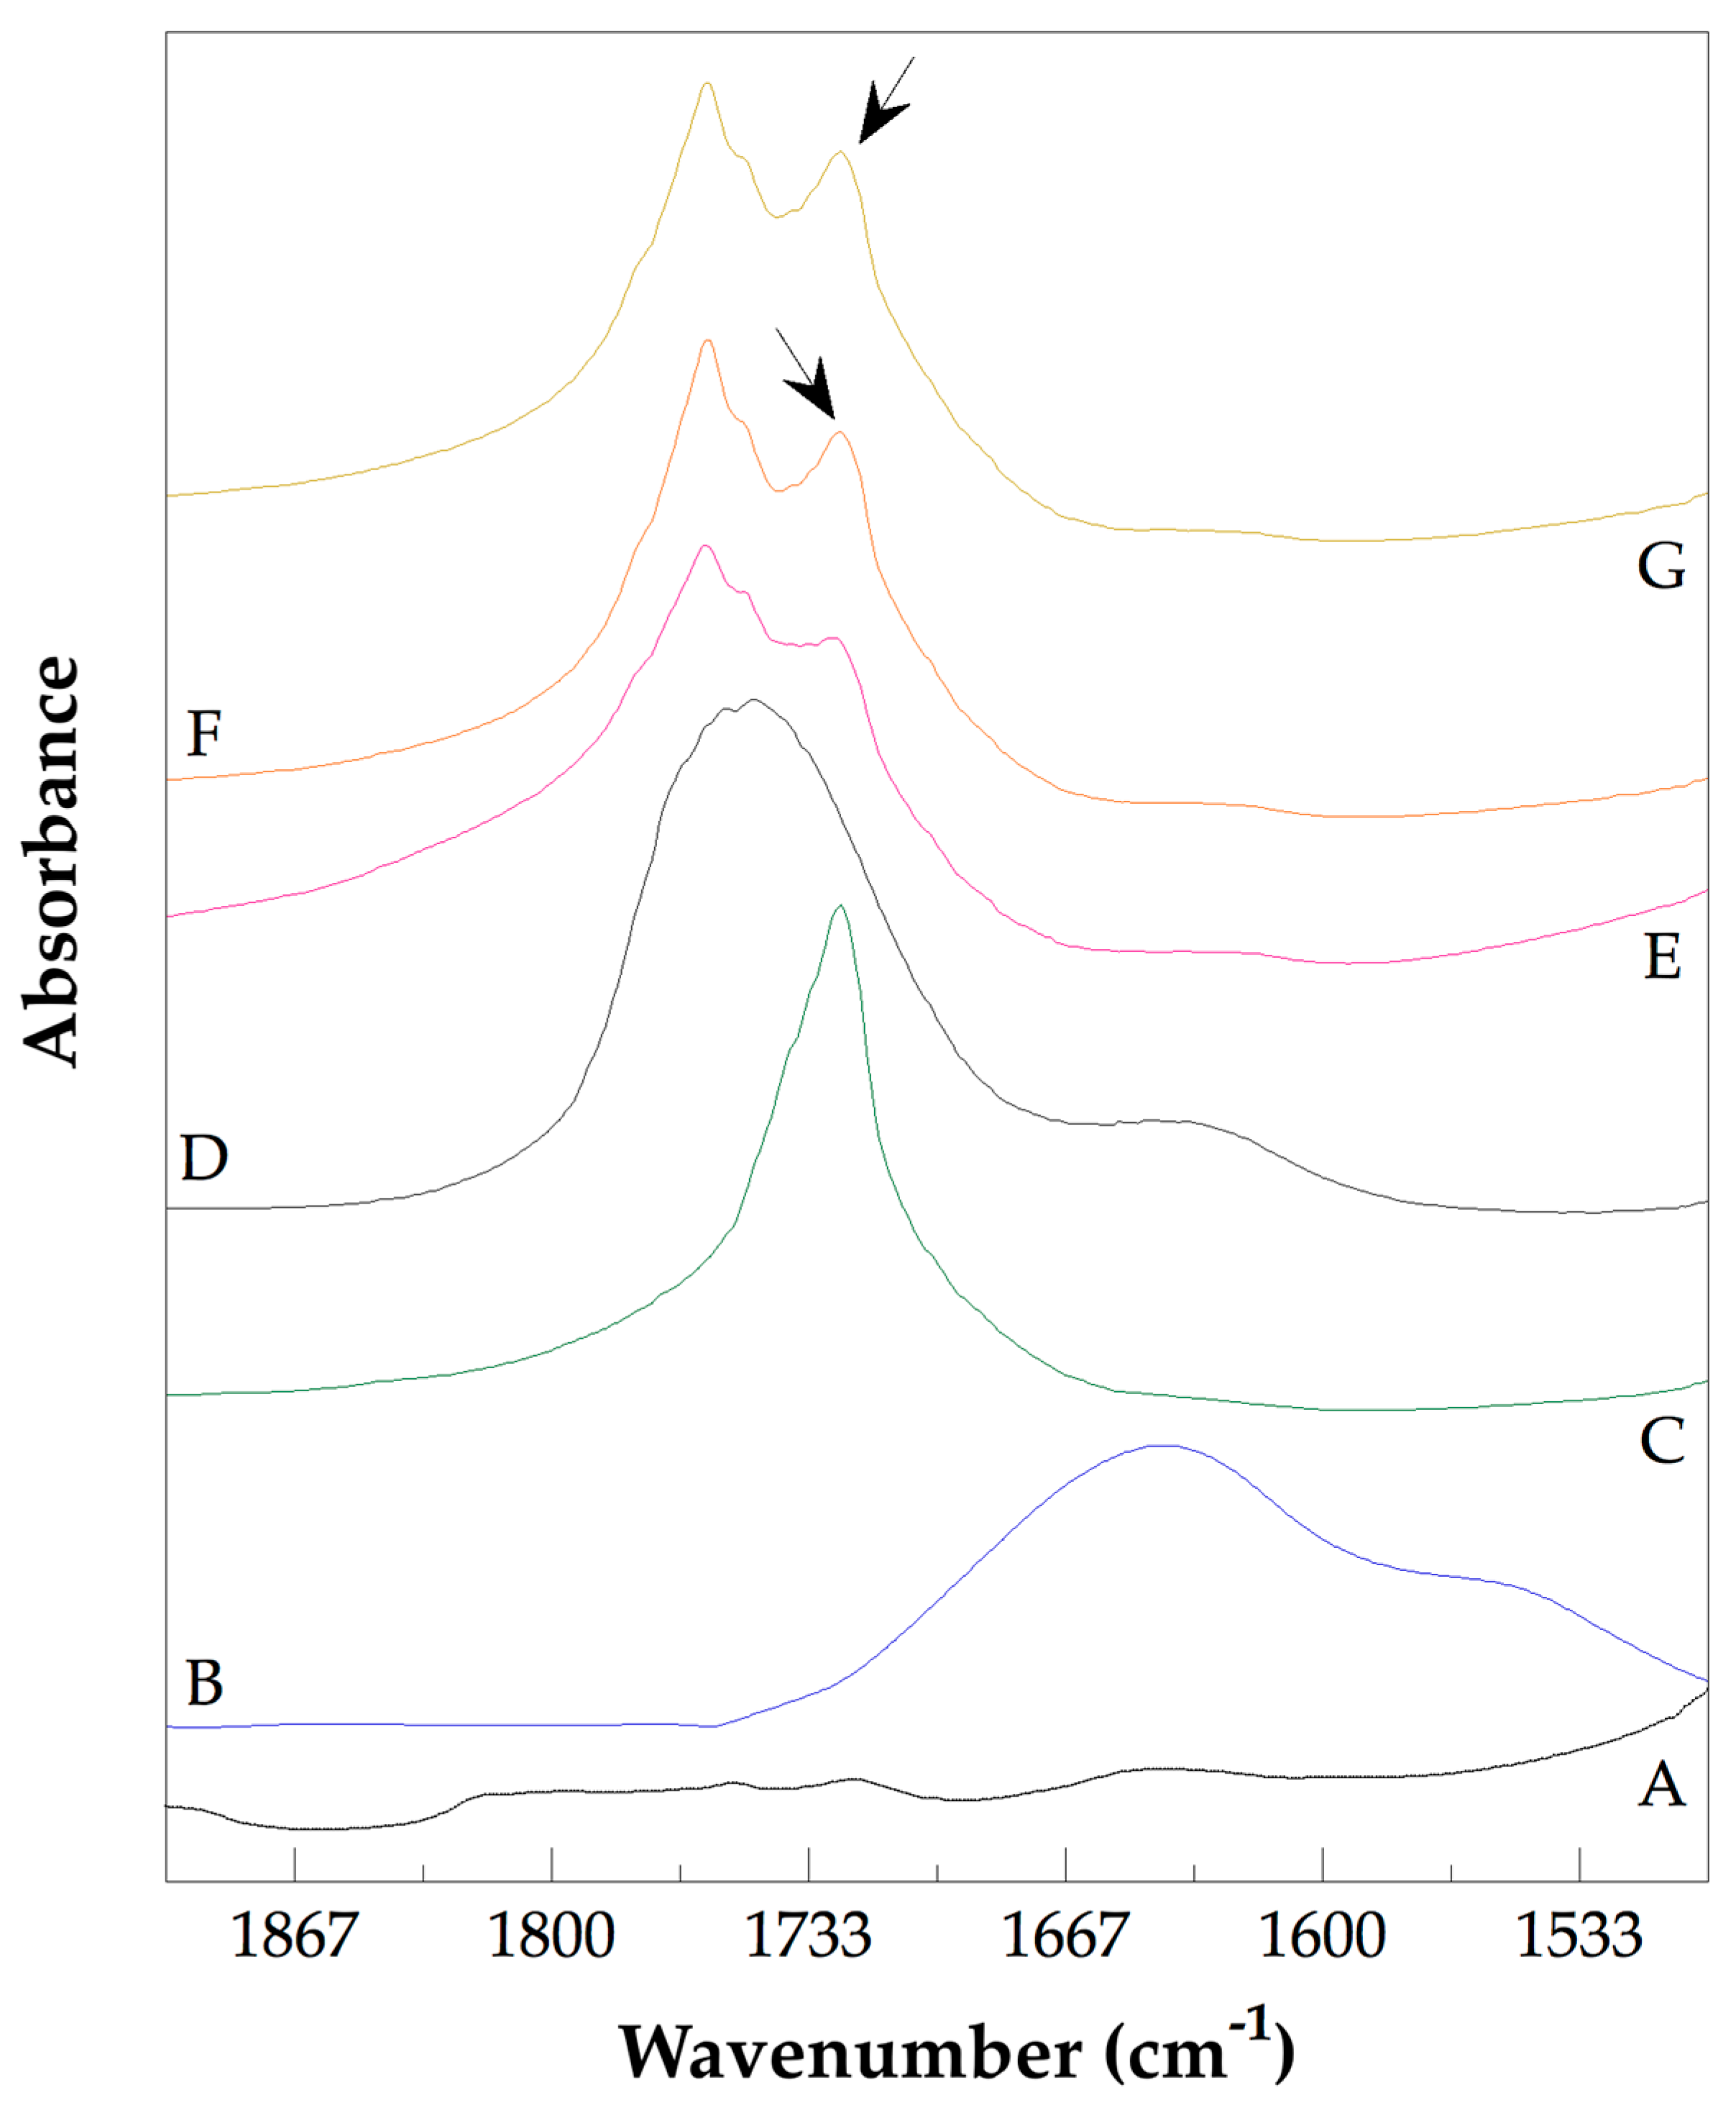
3.3. Analysis of the Chemical Structure of the PLLA–PCL Copolymers, PLLA–PCL–PEG Terpolymers, and PLLA–PCL–PEG/CNTpo Nanocomposites

The 1H–NMR spectrum of the PLLA–PCL 2 copolymer is shown in Figure 1. The PLLA/PCL ratio was determined through 1H NMR spectroscopy using the integral values for the signal assigned to the repeating groups in the synthesized copolyesters. In the case of PLLA, the methine group at δ = 5.2 ppm was used, whereas for PCL, the ε–methylene group at δ = 4.0 ppm was used.
The compositions in mol% of the synthesized PLLA–PCL copolymers are listed in Table 3. All copolymers are richer in PLLA. These results strongly suggest that a certain amount of PLLA end groups was not acylated during the treatment with OxCl. This means that not all PLLA chains possess terminal acyl chloride functionality. Therefore, in some PLLA chains, the hydroxyl terminal functionality remained and was able to react as the synthesis time was extended.
The 1H–NMR spectrum of the PLLA–PCL–PEG 3 terpolymer is shown in Figure 2. For the PLLA–PCL–PEG terpolymers, the integral for the signal at around 3.6 ppm (after deconvolution of the end group for PCL) was used to record the amount of PEG.
The 13C–NMR spectrum of the PLLA–PCL–PEG 2 terpolymer is shown in Figure 3. The signals expected for the three repeating units (PLA, PCL, and PEG) are present. The detection of all signals indicated that the PLLA–PCL–PEG terpolymers were successfully synthesized.
The compositions in mol% of the PLLA–PCL–PEG terpolymers are listed in Table 4. As expected, the composition of the prepared terpolymers was richer in the PLLA segments. In these PLLA–PCL–PEG terpolymers, the PEG blocks were included in low amounts (9.4–14 mol%). Nevertheless, the presence of PEG conferred a certain hydrophilic character to the hydrophobic PLLA–PCL copolymers, which was a desirable outcome for obtaining a nanocarrier sensitive to living matter. In this study, the PLLA–PCL–PEG 2 and PLLA–PCL–PEG 4 terpolymers are of special interest, owing to their high PCL content, as the hydrolysis of PCL has a strong influence on the drug-release behavior of a polymer prepared with PCL.
A series of partial IR spectra of PEG, CNTspo, PCL 4, PLLA 1, PLLA–PCL–PEG 2, NC 2, and NC 1, presented in the region from 1500 to 1900 cm−1, are shown in Figure 4. The spectrum of pure PEG (Figure 4A) did not present a vibrational signal in the region analyzed. Contrarily, in the spectrum of CNTspo (Figure 4B), a wide band at 1640 cm−1 was detected. This band was assigned to a stretching vibration of the C=C bond conjugated to the carbonyl group. Carbonyl functionality was introduced onto the CNTpo walls as a consequence of the oxidation process. Furthermore, the band extending to approximately 1730 cm−1 was attributed to the stretching vibrations of carboxyl groups, which self-associate to form dimers at approximately 1700 cm−1 and carboxyl-free groups at approximately 1720 cm−1. This helps resolve the wide band. The spectrum of PCL 4 (Figure 4C) exhibited a sharp peak at 1725 cm−1, which was caused by the stretching vibration of the ester carbonyl groups. For PLLA 1 (Figure 4D), the stretching vibration of the carbonyl groups of ester functionality produced a wide band at 1748 cm−1. In the spectrum of PLLA–PCL–PEG 2 (Figure 4E), a complex and wide band from 1650 cm−1 to ca. 1860 cm−1 was recorded. The vibrational movements of a high population of carbonyl groups were the cause of this wide band. At 1760 cm−1, the most intense contribution was detected. A weak shoulder of this band appeared as another band at 1750 cm−1. Subsequently, a well-resolved contribution at 1727 cm−1 was observed. Based on the IR spectral behavior of the pure homopolymers PCL 4 and PLLA 1 described above, two assignations were made. The weak band resolved at 1750 cm−1 was produced via the stretching vibration of the ester carbonyl groups of the segments of PLLA 1, whereas the band detected at 1727 cm−1 was caused by the stretching vibration of the ester carbonyl groups of the segments of PCL 4. Moreover, as shown in Scheme 1, the well-known chemical reaction between the hydroxyl groups (located on the terminal chains on PLLA, PCL, and PEG blocks) and the acyl chloride groups of the OxCl was expected to occur, forming the ester groups. As the vibrations of the carbonyl groups included in ester functionality resolve in the range of 1750 to 1715 cm−1 and the signal caused by the vibrations of dicarbonyl groups appears in the range of 1720 to 1705 cm−1, it is evident that the intense band detected at 1760 cm−1 originates from the vibrations of chemical groups different to ester carbonyl groups. Therefore, the band at 1760 cm−1 was assigned to the antisymmetric stretching vibration of the carbonyl groups of anhydride functionality. This assignation was confirmed by the fact that, in the range of 1500 to 500 cm−1 (region not shown), the most intense band was a double band resolved at 1212 and 1191 cm−1. This double band was caused by the symmetric and antisymmetric stretching vibrations of the carbonyl bonds of anhydride functionality. Anhydride functionality can be produced via the chemical reaction between the carboxyl and acyl chloride groups. Because wet BD was used in this synthesis, water moieties could act as effective alternative initiators on the homopolymerization of the PLLAs and PCLs prepared in steps 1 and 2 of the chemical procedure used in this study. A previous study reported that the homopolymerization of ε–CL initiated using water produced linear PCL chains with one carboxyl end group and one hydroxyl end group, whereas when dry BD was used as an initiator, the linear PCL synthesized contained two hydroxyl end groups [41]. Scheme 2 shows the chemical structure of the PLLA–PCL–PEG terpolymer obtained when water acted as an effective initiator of the series of prepared PLLAs and PCLs. In the IR spectra of NC 2 (Figure 4F) and NC 1 (Figure 4G), the spectral behavior was similar to that of the PLLA–PCL–PEG 2. Thus, in the IR spectra of both nanocomposites, three spectral contributions in 1760, 1750, and 1725 cm−1 were resolved. The bands detected at 1760 and 1750 cm−1 appeared at the same frequencies as those observed in the spectrum of PLLA–PCL–PEG 2 (Figure 4E) and were caused by the vibrations of the chemical groups already described. Instead, the band detected at 1725 cm−1 (marked on the spectra with an arrow) was resolved to a lower frequency and at a higher intensity than the one observed in the spectrum of PLLA–PCL–PEG 2. These changes could be attributed to the formation of intermolecular hydrogen bonds created between the carboxyl groups inserted on the walls of CNTspo and the carbonyl groups of ester functionality of the PCL chains. The formation of hydrogen bonds in nanocomposites that were prepared with CNTs functionalized with carboxyl groups and a polymer containing carbonyl groups has been previously reported [42,43].
Figure 5 shows the partial spectra of CNTspo, PCL 4, PLLA 1, PEG, PLLA–PCL–PEG 2, NC 2, and NC 1 centered in the 3050-to-3900 cm−1 region. In the spectrum of CNTspo (Figure 5A), a broad band at 3527 cm−1 due to the stretching vibration of the hydroxyl groups was detected. A similar broad band assigned to the stretching vibration of the hydroxyl groups on the FTIR spectrum of a sample of multiwalled carbon nanotubes (MWCNTs) has been reported elsewhere [44]. In the spectrum of PCL 4 (Figure 5B), a broad band with two peaks was detected. The first peak was sharp, and it was detected at 3438 cm−1, whereas the second peak was wide, and it appeared at 3536 cm−1. This broad band was due to the stretching vibration of the hydroxyl groups. For polymers that contain hydroxyl and carbonyl groups, the summation of the vibrations of several chemical bonds produces this band. From the lower to the higher frequencies, vibrations of different types of hydroxyl groups occurred: (i) self-associated hydroxyl groups forming dimers, trimers, etc.; (ii) hydrogen bonded to carbonyl groups; and (iii) free hydroxyl groups [45]. The vibrations of the free hydroxyl groups produced weak and sharp bands above 3615 cm−1 [46]. Therefore, we considered that the peak at 3438 cm−1 was caused by hydroxyl–hydroxyl self-associated movements, whereas the peak at 3536 cm−1 was due to hydroxyl–carbonyl vibrations. Concerning the PLLA 1 and PEG homopolymers, it is evident that their vibrational behaviors are similar. In the spectrum of PLLA (Figure 5C), only one band at 3479 cm−1 was detected, whereas in the spectrum of PEG (Figure 5D), also one band at 3470 cm−1 was observed. Both spectral contributions were assigned to the stretching vibration of the hydroxyl groups. Contrarily, in the spectrum of PLLA–PCL–PEG 2 (Figure 5E), three spectral contributions were detected. At 3649 cm−1, a weak sharp band assigned to vibrations of the free hydroxyl groups appeared. Moreover, a broad band at 3500 cm−1 with a shoulder at 3460 cm−1 was detected. The stretching vibration of the hydroxyl groups produced this broad band. In the spectra of NC 2 (Figure 5F) and NC 1 (Figure 5G), three bands were also detected. However, the band corresponding to vibrations of free hydroxyl groups (indicated by an arrow) was detected at lower frequencies, appearing in both spectra at 3637 cm−1. Meanwhile, the stretching vibration of the hydroxyl groups produced a broad band at 3502 cm−1 with shoulders at 3436 cm−1 (indicated by an arrow) (Figure 5F) and 3437 cm−1 (indicated by an arrow) (Figure 5G). The fact that these shoulders appeared at lower frequencies compared to the band detected at 3438 cm−1 in the spectrum of PCL 4 suggests that hydrogen bonds formed between the ester carbonyl groups of PCL 4 and the hydroxyl groups of the CNTspo inserted in NC 2 and NC 1. These results, along with the results obtained from the analysis of the spectra shown in Figure 4E–G, suggest that the PCL 4 blocks develop a preferential orientation toward the CNTspo.
The C1s core-level normalized spectra of the PLLA–PCL–PEG 4 terpolymer, NC 4, and NC 3 are presented in Figure 6. The active background approach, as implemented in the Analyzer v. 1.33 software, was used to make the peaks fit [47]. The spectra were adjusted using the respective shift according to the C–C bond position at 285.0 eV. The C1s core-level normalized spectrum of the PLLA–PCL–PEG 4 terpolymer (Figure 6A) shows components at four positions: at 285.0 eV (C–C/C–H bonds) [48], 286.2 eV (C–O–C groups of PEG/–(C=O)–O–CH2– functionality of PCL) [49], 287.1 eV (–CH–(CH3)–(C=O)–O– functionality of PLLA) [49], and 289.1 eV ((–CH–(CH3)–(C=O)–O– functionality of the PLLA/–CH2–(C=O)–O–) groups of PCL) [49]. The calculated atomic concentrations of the mentioned groups were 36.4%, 14.7%, 7.8%, and 12.7%, respectively. In the C1s core-level normalized spectra of NC 4 and NC 3, components at four positions were also detected. The components and their calculated atomic concentrations detected in the spectrum of NC 4 (Figure 6B) were 285.0 eV (C–C/C–H bonds) [48] (46.0%), 286.3 eV (C–O–C groups of PEG/–(C=O)–O–CH2– functionality of PCL) [49] (9.1%), 287.0 eV (–CH–(CH3)–(C=O)–O– functionality of PLLA) [49] (6.8%), and 289.1 eV ((–CH–(CH3)–(C=O)–O– functionality of PLLA/–CH2–(C=O)–O–) groups of PCL) [49] (12.6%). For a similar analysis of the spectrum of NC 3 (Figure 6C), the results were 285.0 eV (C–C/C–H bonds) [48] (59.7%), 286.3 eV (C–O–C groups of PEG/–(C=O)–O–CH2– functionality of PCL) [49] (11.4%), 287.0 eV (–CH–(CH3)–(C=O)–O– functionality of PLLA) [49] (7.8%), and 289.1 eV ((–CH–(CH3)–(C=O)–O– functionality of PLLA/–CH2–(C=O)–O–) groups of PCL) [49] (14.9%). As previously reported, ester groups are sensitive nucleophilic substitution reactions [50]. The PLLA–PCL–PEG terpolymers are rich in ester groups. The nanocomposites were prepared in an aprotic solvent (THF). There are hydroxyl groups on the walls of the CNTspo. The hydroxyl group is nucleophilic and highly reactive. Moreover, in the chemical structure of the PLLA–PCL–PEG terpolymers, dicarbonyl groups exist. Because of the higher reactivity of the dicarbonyl groups compared to the carbonyl groups, it is possible that they are more sensitive to a chemical attack from the hydroxyl groups of the CNTspo. The decrease in the molar concentration of ester groups in the NC 3 and NC 4 nanocomposites (also detected in the O1s core-level normalized spectra of both nanocomposites (not shown)) compared to that in the PLLA–PCL–PEG 4 spectrum strongly suggests that a nucleophilic substitution reaction was performed. This implies that the chains of the PLLA–PCL–PEG 4 are grafted onto the walls of the CNTspo. Scheme 3 shows the aforementioned chemical reaction, in which the nucleophilic substitution on a carbonyl group of the dicarbonyl functionality is exemplified.

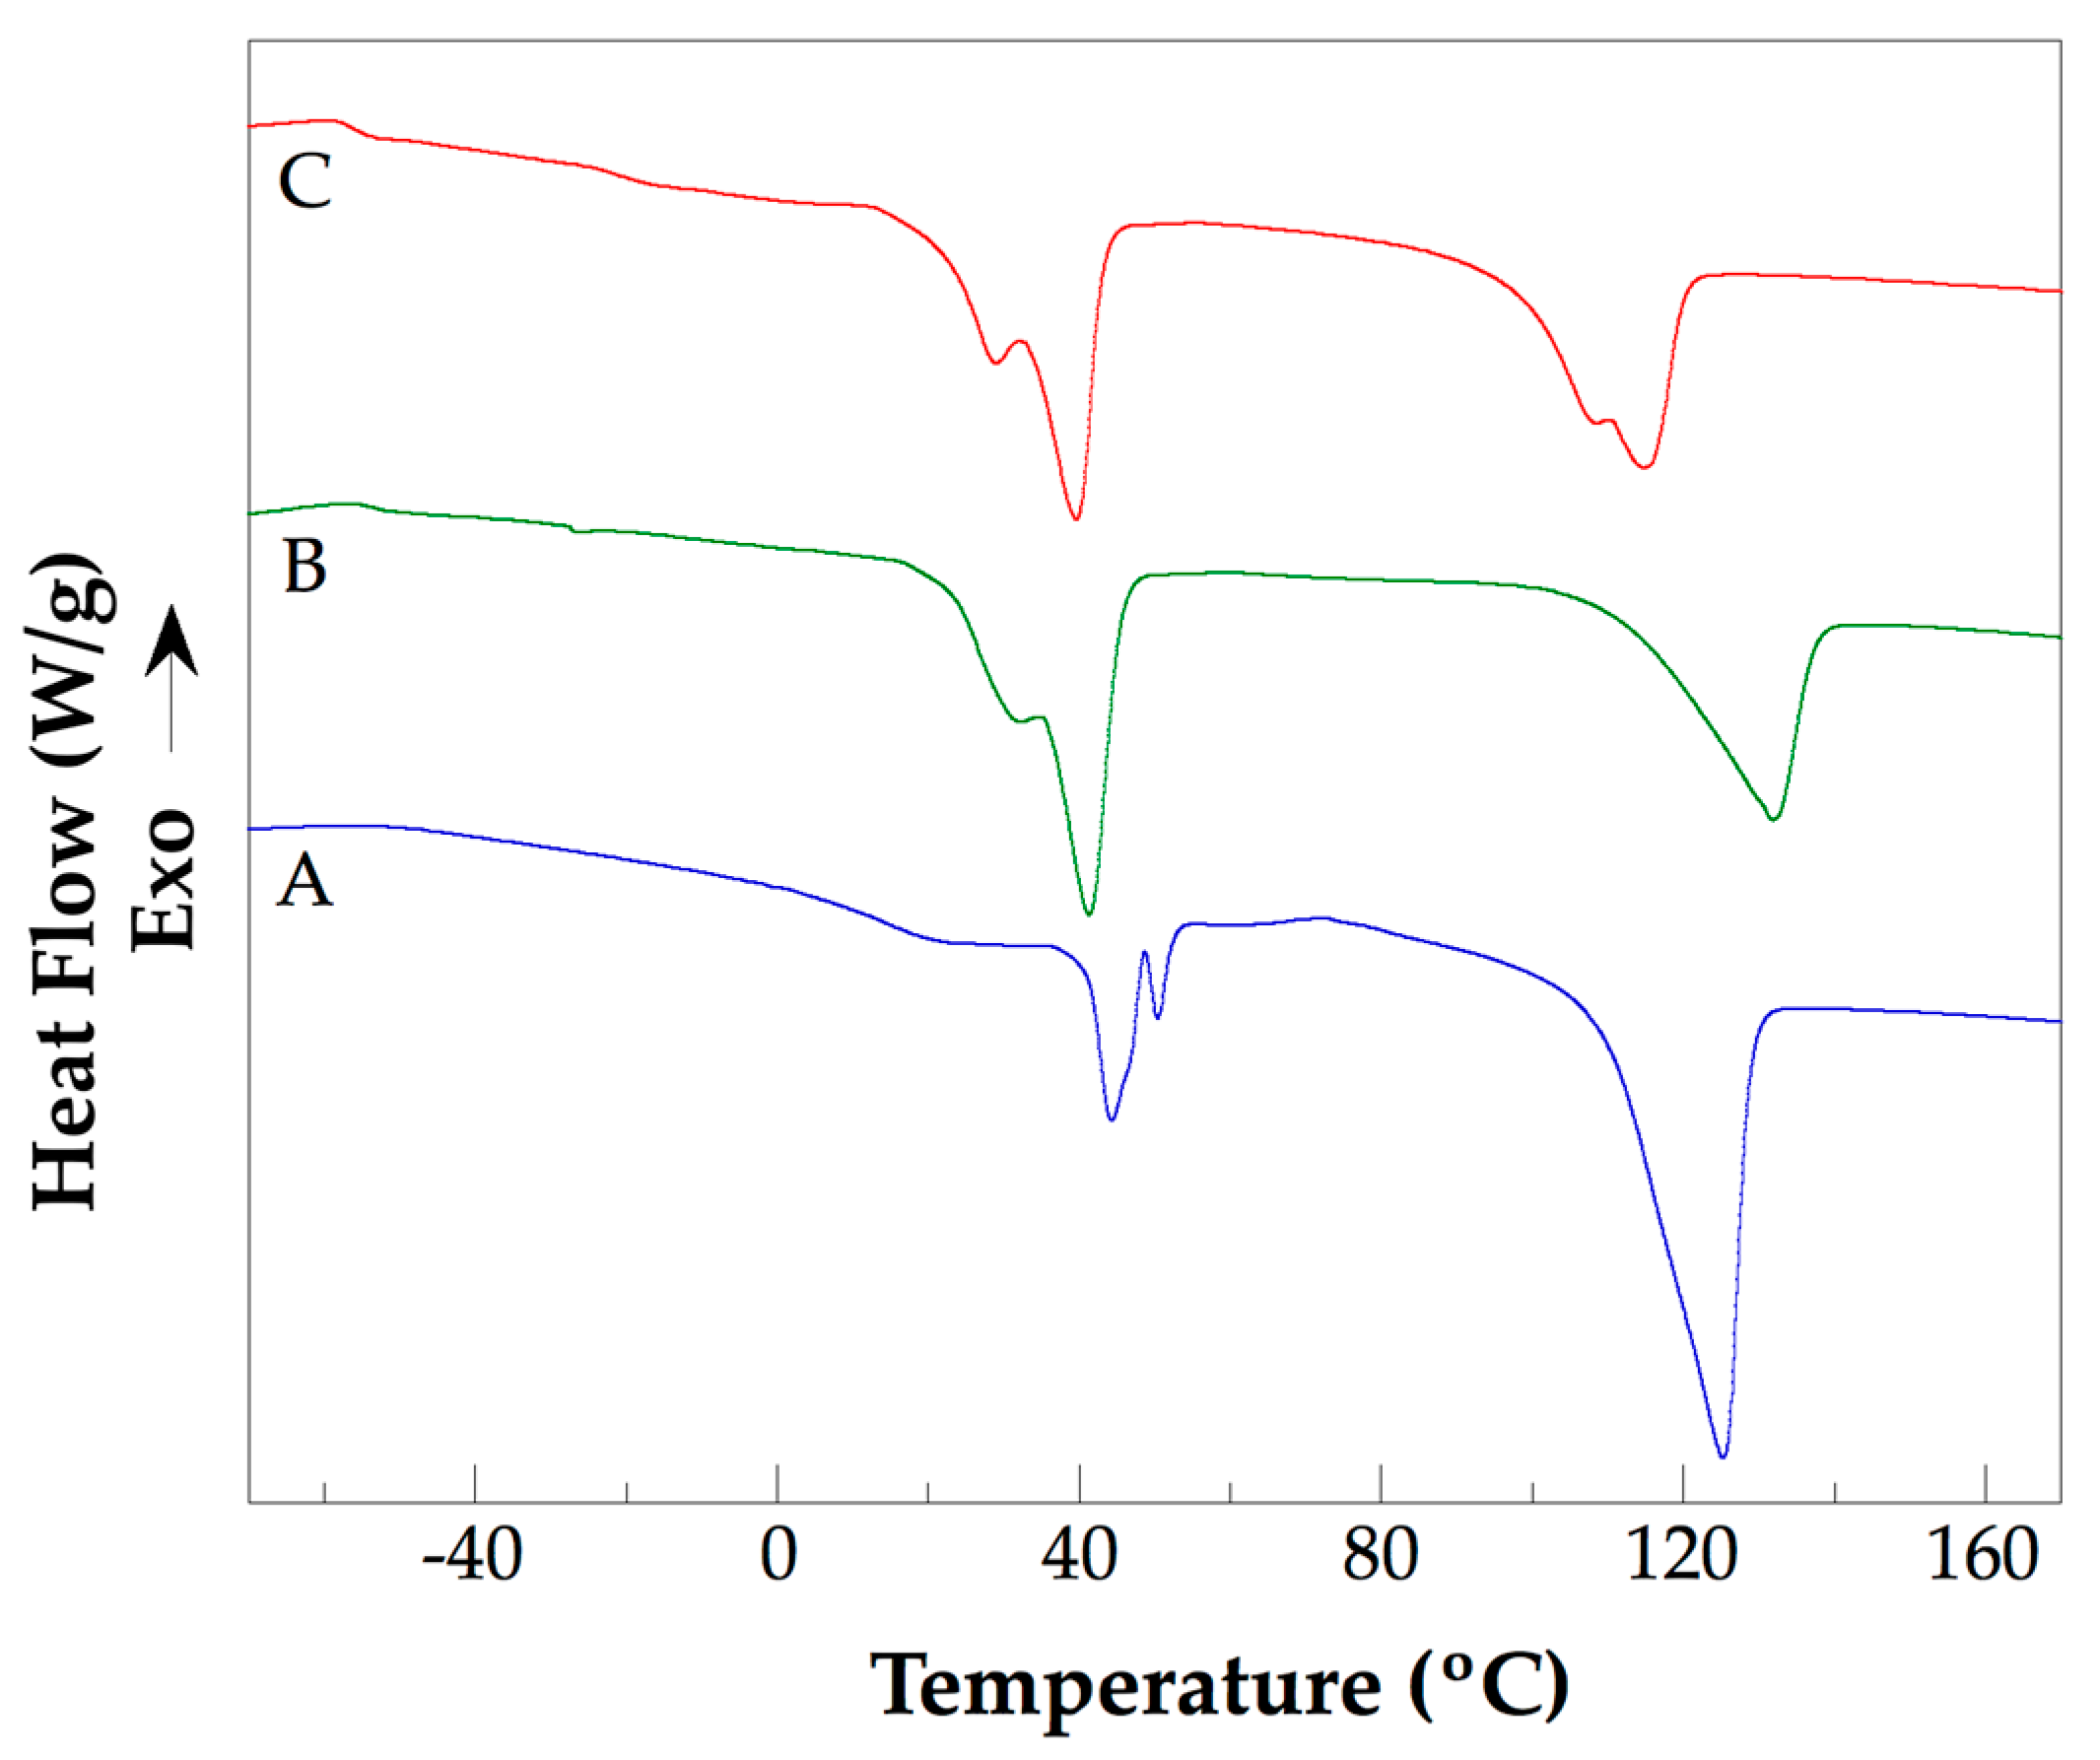
3.4. Thermal Analysis of the PLLA–PCL–PEG Terpolymers and PLLA–PCL–PEG/CNTpo Nanocomposites

Figure 7 presents the DSC thermograms of PLLA–PCL–PEG 4, NC 3, and NC 4. The DSC results obtained from the analysis of the thermograms of PLLA–PCL–PEG 2, PLLA–PCL–PEG 4, NC 1, NC 2, NC 3, and NC 4 are summarized in Table 5. The Supplementary Material shows the DSC thermograms of the homopolymers PEG, PCL 4, and PLLA 4. The DSC thermal behavior of the pure homopolymers is described below. In the DSC thermogram of PEG, a glass-transition relaxation (TgPEG = −13 °C (260.15K)) and a melting endotherm (TmPEG = 61.0 °C (334.15 K), ΔHmPEG = 60.8 J/g) were detected. In the DSC thermogram of PCL 4, a glass-transition temperature (TgPCL 4 = −59 °C (214.15 K)) and a melting endotherm (TmPCL 4 = 55.0 °C (328.15 K), ΔHm PCL 4 = 77.7 J/g) were detected. Furthermore, in the DSC thermogram of PLLA 1, a glass-transition temperature (TgPLLA 1 = 50 °C (323.15 K)), a crystallization exotherm (TcPLLA 1 = 111.6 °C (384.75 K), ΔHcPLLA 1 = 49.1 J/g), and a melting endotherm (TmPLLA 1 = 151.4 °C (424.55 K), ΔHmPLLA 1 = 42.6 J/g) were observed. Based on these results, the DSC thermogram of the PLLA–PCL–PEG 4 terpolymer was analyzed. In the DSC thermogram of PLLA–PCL–PEG 4 (Figure 7A), two glass-transition relaxations and two melting endotherms were detected. Tg1 = −50 °C (223.15 K) was assigned to the relaxations in the amorphous phase of the PCL 4 chains, whereas Tg2 = 14 °C (287.15 K) was assigned to domains rich in PEG chains. These thermal relaxations were detected at a higher temperature than those recorded in the thermograms of the pure homopolymers of PCL 4 and PEG, indicating that the crystalline phases detected in the thermogram of the terpolymer limited the relaxations in the amorphous phase. The first melting endotherm was resolved in a range of temperatures from 35 °C (308.15 K) to 55 °C (328.15 K) and exhibited two peaks. In this temperature range, relaxation in the amorphous phase of PLLA 1 chains, the melting of the PCL 4 chains, and the melting of the PEG chains occurred. The first peak, Tm1 = 44.3 °C (317.45 K), is intense, while the second peak, Tm2 = 50.4 °C (323.55 K), is weak. When a melted block copolymer is quenched below the melting temperature, microphase separation and crystallization occur simultaneously. Competition in the crystallization of the blocks is developed. Several studies have focused on the melting behavior of the PCL–PEG diblock copolymer. A study about PCL–PEG diblock copolymers with Mn = 20,000–30,000 prepared with PCL weight fractions ranging from 68 to 85% concluded that PCL blocks crystallize first, which induces an imperfect crystallization of PEG blocks [51,52]. Another study on the crystallization of synthesized PCL–PEG diblock copolymers with a PCL weight fraction of 34% to 67% concluded that PCL chains crystallize first. After this, the crystallization of PEG chains occurs [53]. Xu et al. studied the crystallization of PCL–PEG copolymers with Mn,PEG = 5000 and concluded that PCL blocks disfavor the crystallization of PEG blocks, and vice versa [54]. This explains the small value of ΔHm1 (shown in Table 5) for both PLLA–PCL–PEG 4 and PLLA–PCL–PEG 2. Furthermore, in another study of a PEG–PCL diblock copolymer prepared with PEG (Mn = 5000) and PCL (Mn = 9200), two melting peaks were observed in the melting endotherm detected through DSC, which were assigned to the melting of the PEG (first peak) domains and melting of the PCL (second peak) domains. XRD measurements support this analysis [55]. Similar results were recorded in a study of segmented PCL/PEG-based poly(urethane urea) copolymers prepared with a PCL/PEG weight ratio of 80/20 and Mw of 67000. On the melting endotherm, two melting peaks were detected. The first peak was caused by the melting of the PEG domains and the second peak by the melting of the PCL domains [56]. Therefore, it is reasonable to consider that, in the DSC endotherm of PLLA–PCL–PEG 4, the first peak (Tm1 = 44.3 °C (317.45 K)) was caused by the melting of the PEG domains, and the second peak (Tm2 = 50.4 °C (323.55 K)) was due to the melting of the PCL 4 domains. In some cases, in the endotherm of the PCL–PEG copolymers, only one Tm has been detected, as reported elsewhere [57]. As shown in Table 5, for PLLA–PCL–PEG 2, only one melting temperature (Tm1 = 44.3 °C (317.45 K)) was detected, indicating the simultaneous crystallization of PCL and PEG blocks. Additionally, the second endotherm in the DSC thermogram of the PLLA–PCL–PEG 4 terpolymer was detected in the temperature range from approximately 100 °C (373.15 K) to 135 °C (408.15 K), in which Tm3 = 125.4 °C (398.55 K) was detected, attributed to the melting of the PLLA 1 domains. Evidently, this melting temperature was detected to a lower temperature than the melting temperature of the pure PLLA 1. This means that the complex morphology of the PLLA–PCL–PEG 4 terpolymer has a strong influence on the melting of the PLLA 1 domains.
Regarding the thermal behavior of the nanocomposites, although two glass-transition relaxations and two melting endotherms were observed in their DSC thermograms (Figure 7B for NC 3 and Figure 7C for NC 4), significant changes were detected compared to those observed in the thermograms of their pure polymer matrices. Thus, (i) for all nanocomposites, Tg1 due to the glass transition of the PCL 4 chains was detected at lower temperatures than those observed for their pure polymeric matrix; (ii) for NC 2 and NC 4 (both prepared with 0.5 wt.% CNTspo), Tg2 caused by the glass-transition relaxation of the PEG chains was detected at a lower temperature than that of pure PEG. Contrarily, for NC 1 and NC 3 (both prepared with 1.0 wt.% CNTspo), Tg2 was detected at a higher temperature. The increase in the value of the glass-transition temperature of nanocomposites prepared with CNTs has been explained as a consequence of the reduction in the mobility of the polymer chains. This reduction is induced via the physical and chemical interactions formed between the chemical groups inserted on the walls of the CNTspo and the chemical groups of the polymer chains of the polymeric matrices of the studied nanocomposites. Similar results for the nanocomposites of PMMA and amino-functionalized CNTs have been reported elsewhere [58]. Our results indicate that the reduction in the mobility of polymer chains depends on the amount of CNTspo used in the preparation of the studied nanocomposites. Contrarily, the decrease in the glass-transition temperature has been explained as a consequence of the high dispersion of CNTs and the formation of a nanoscale thin film of confined polymer between CNTs, as reported in a study of nanocomposites prepared with polycarbonate (as the polymer matrix) and functionalized MWCNTs previously published [59]. The small amount of CNTspo used to prepare the NC 2 and NC 4 favors achieving a high dispersion of CNTspo. Moreover, the presence of CNTspo in the studied nanocomposites has a different influence on the melting of domains rich in PEG/PCL 4 chains or domains rich in PLLA 1 chains. Thus, a clear change is observed in the first endotherm of the DSC thermograms of all the prepared nanocomposites. Unlike the DSC thermogram of the PLLA–PCL–PEG 4 terpolymer, where the most intense peak is the first, corresponding to the melting of PEG chains, for the nanocomposites NC 3 and NC 4, the most intense peak is the second. This second peak is produced through the melting of the PCL chains. Furthermore, the ΔHm1 of all the nanocomposites is larger than those of their polymer matrices (PLLA–PCL–PEG 2 and PLLA–PCL–PEG 4). These results indicate that CNTspo act as nucleation sites of the PCL 4 chains. The role of CNTs (functionalized with the hydroxyl and carboxyl groups) as nucleating agents in nanocomposites prepared with a semicrystalline polymer has been previously reported [60]. Contrarily, for the second endotherm, the ΔHm2 (associated with the melting of PLLA 1 chains) of all the nanocomposites decreased compared to the second endotherm observed in the DSC thermograms of the pure polymer matrices. In this case, CNTspo act as antinucleating agents. The thermal behavior observed in the melting of the prepared nanocomposites strongly suggests that the PCL 4 chains are preferentially oriented to CNTspo.

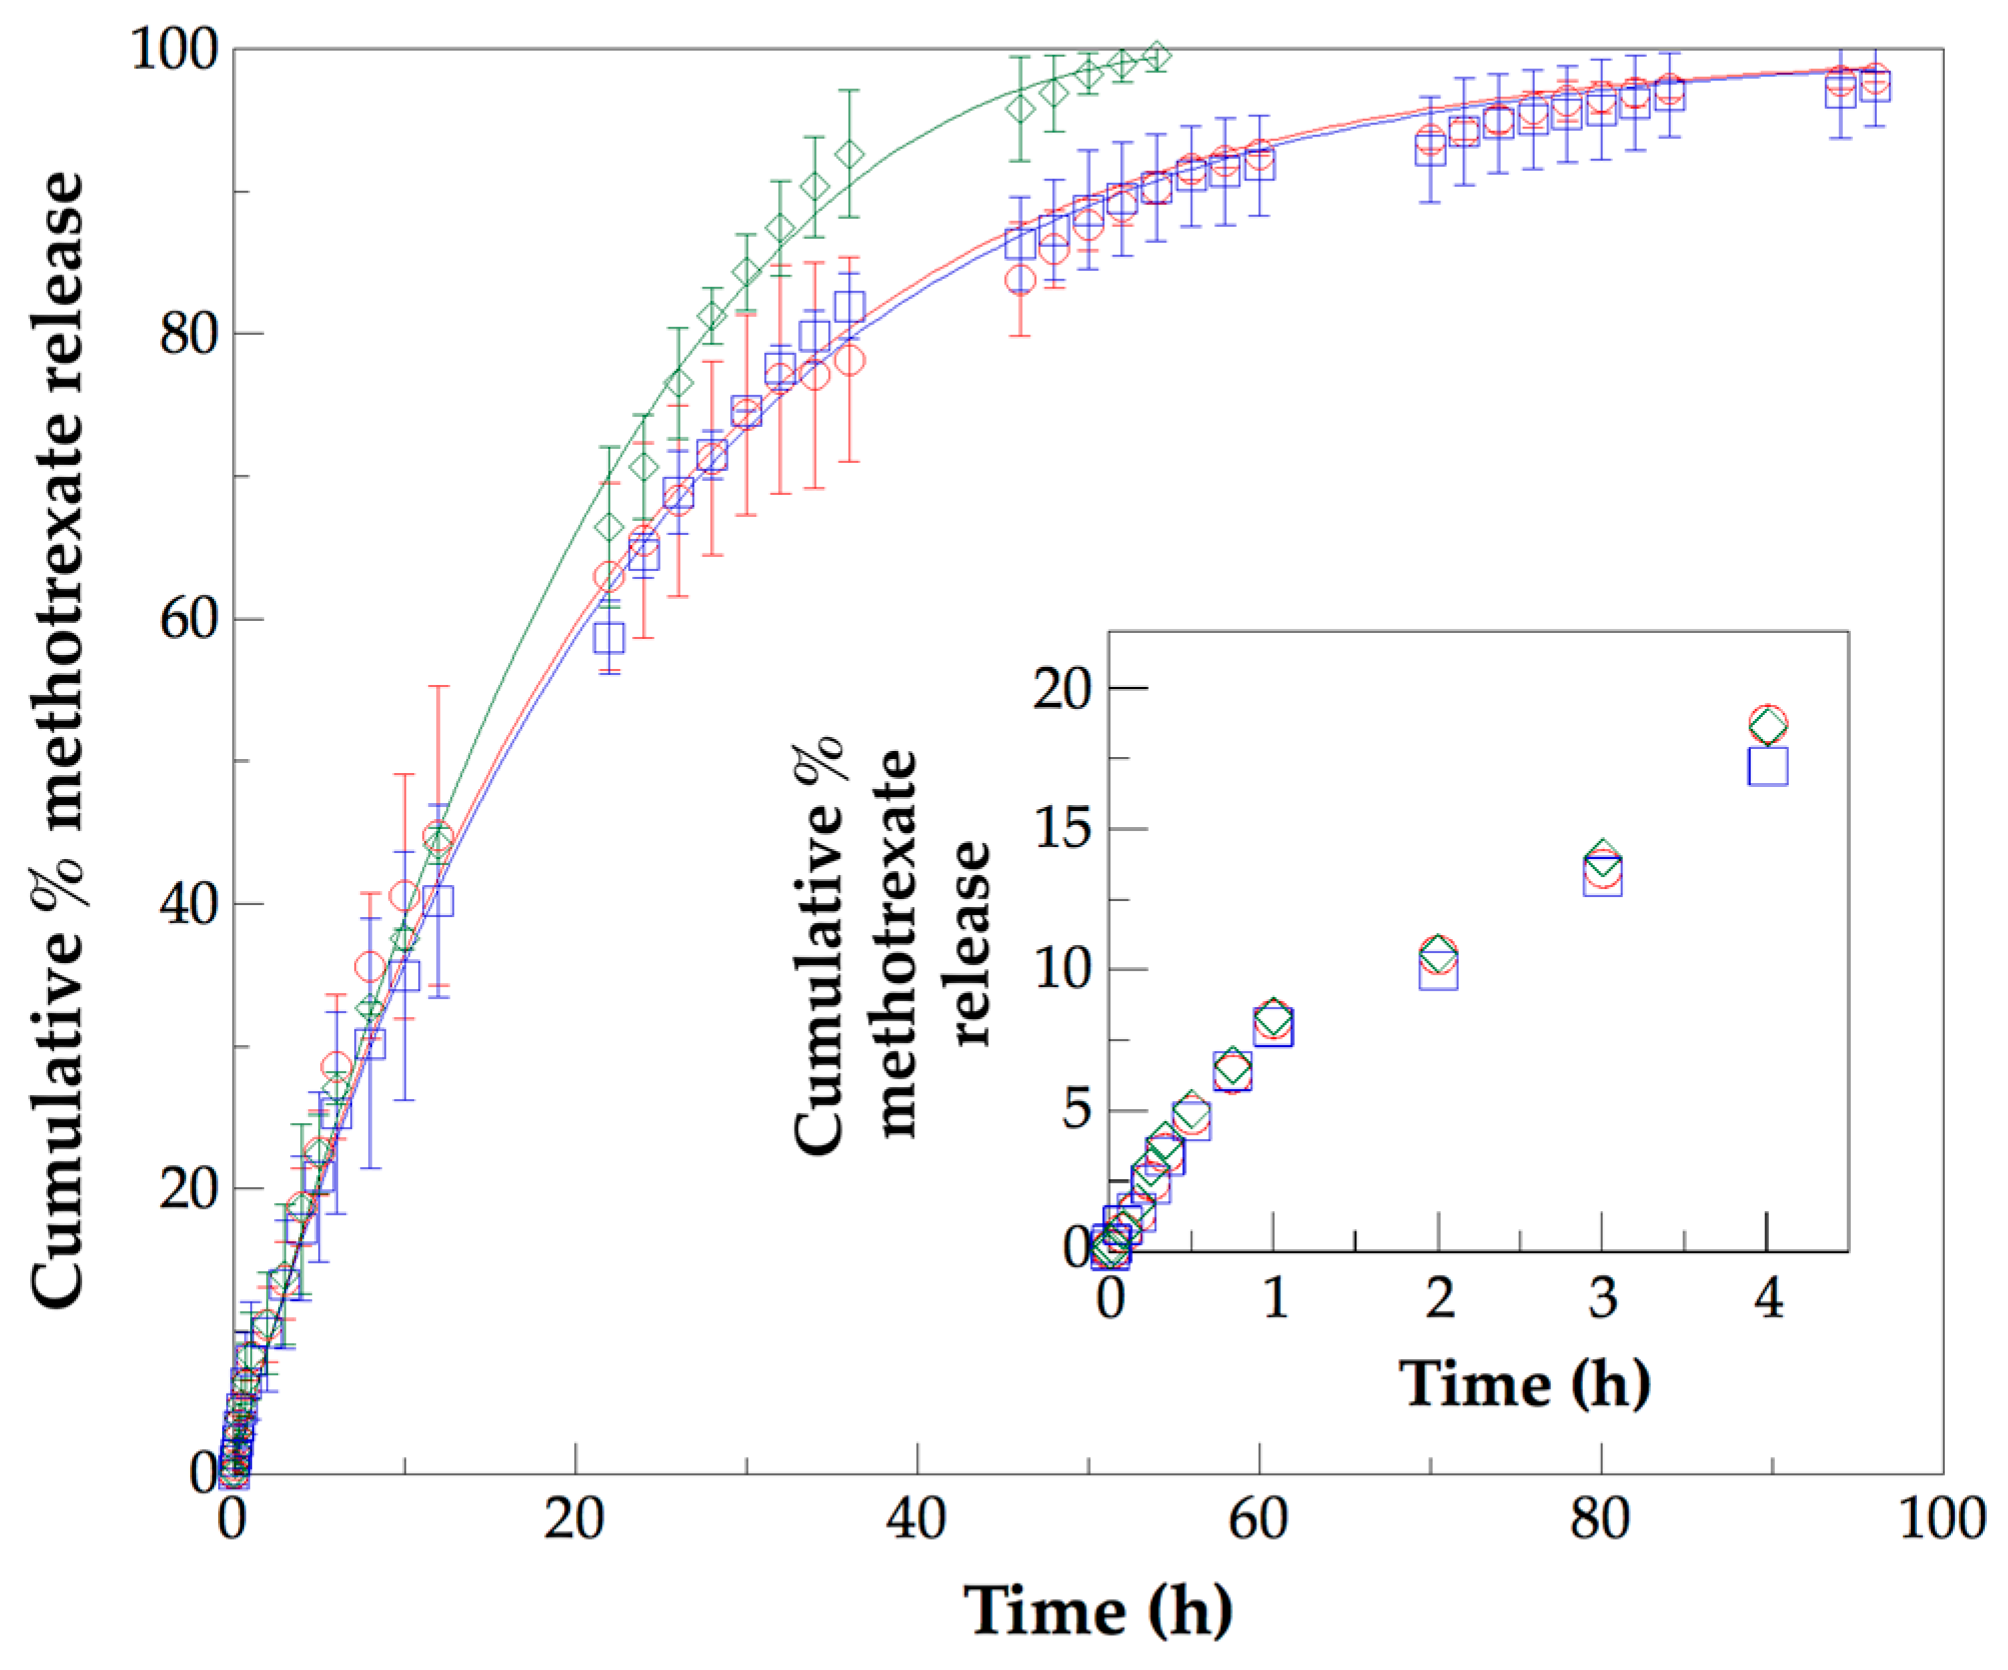
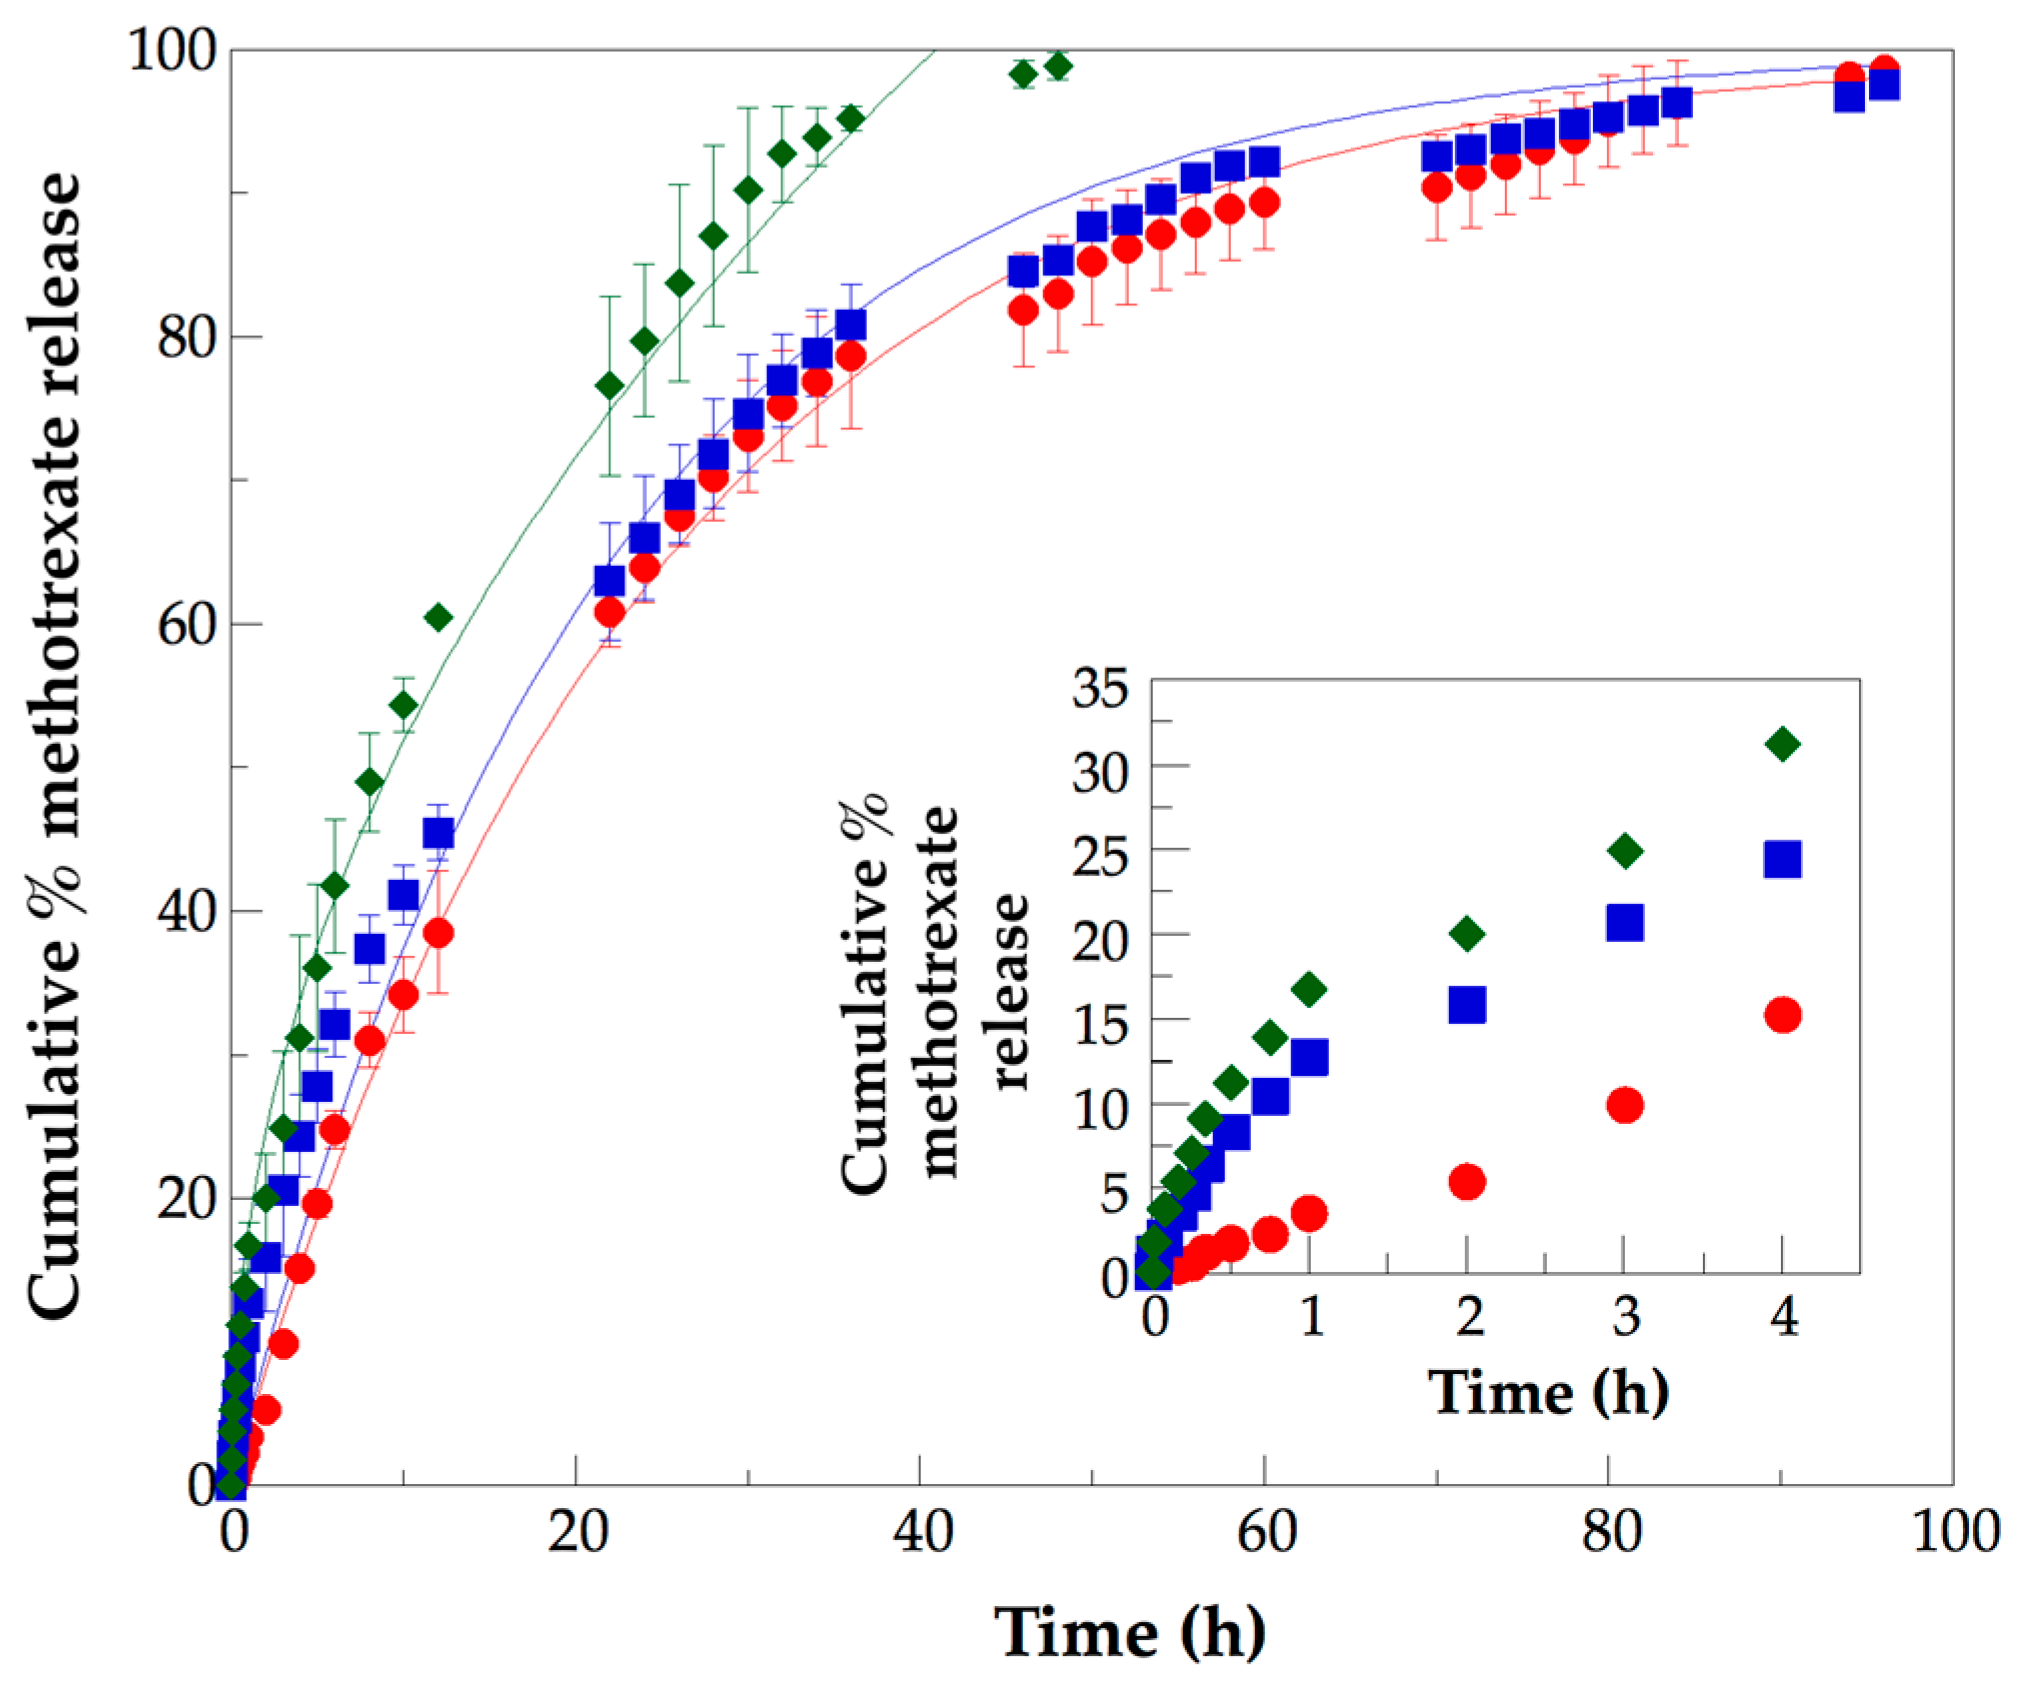
3.5. Analysis of In Vitro Methotrexate Release Profiles from PLLA–PCL–PEG Terpolymers and PLLA–PCL–PEG/CNTpo Nanocomposites

Figure 8 presents the in vitro methotrexate release patterns for the PLLA–PCL–PEG 2 terpolymer and NC 1 and NC 2, whereas Figure 9 shows the release profiles for the PLLA–PCL–PEG 4 terpolymer and NC 3 and NC 4. In both figures, the error bars of all the recovered data are included. An inset is included in which the methotrexate release data recorded until 4 h are shown. During the release test, the tablets of the terpolymers and the nanocomposites underwent erosion. The erosion was faster for the PLLA–PCL–PEG 2 and PLLA–PCL–PEG 4 terpolymers compared to the nanocomposites prepared with them. Moreover, the release from the terpolymers was faster than that from the nanocomposites. Indeed, the methotrexate release rates from PLLA–PCL–PEG 2 and PLLA–PCL–PEG 4 were 44.1% and 60.4% at 12 h, respectively. The highest release was obtained at 54 h for PLLA–PCL–PEG 2 (99.5%) and at 48 h for PLLA–PCL–PEG 4 (98.8%). Contrarily, the methotrexate release rates for NC 1, NC 2, NC 3, and NC 4 were 41.8%, 41.0%, 38.8%, and 43.1% at 12 h, respectively. Moreover, the highest release rates for NC 1, NC 2, NC 3, and NC 4 were 98.7%, 98.5%, 98.0%, and 98.8% at 96 h, respectively. Evidently, the release evolution of all the studied terpolymers and nanocomposites follows a biphasic cumulative release behavior characterized by a “burst release” at the initial times and a plateau (“power–law phase”), which is smaller for PLLA–PCL–PEG 2 and PLLA–PCL–PEG 4 than for the nanocomposites. The “burst release” for the nanocomposites in the first moments was attenuated, as can be observed in the insets of Figure 8 and Figure 9. This effect was more evident for NC 3 and NC 4, which were prepared with a polymer matrix of PLLA–PCL–PEG 4. The fact that this terpolymer has a lower content of PEG than the PLLA–PCL–PEG 2 terpolymer indicates that it is more hydrophobic, which, combined with the presence of CNTspo, favors a slower methotrexate release.
Five models were used to fit the methotrexate release data. These models were Higuchi (1), Korsmeyer–Peppas (2), Korsmeyer–Peppas extended (3), first-order (4), and Hixson–Crowell (5). In all cases, F denotes the percentage of drug released, which is determined from M t / M , and the fraction of drug release at time t, where M t denotes the amount of drug released at time t, and M denotes the amount of drug loaded:
F = k H   t 1 2
where k H denotes the kinetic rate constant of the Higuchi model, which depends on the variables of the release system, and t denotes the time. Higuchi’s model is based on Fick’s second law [61].
F = k K P   t n
where k K P denotes the kinetic rate constant of the Korsmeyer–Peppas model, and n is the release exponent. This exponent characterizes the release mechanism from polymer matrices, which can have different geometries. The Korsmeyer–Peppas model was proposed to assess the released drugs from a polymer matrix [62].
F = k K P   t n + b
where k K P denotes the kinetic rate constant of the Korsmeyer–Peppas extended model, and b denotes the “burst effect.” This model is an extension of the Korsmeyer–Peppas model, and it was proposed to evaluate the “burst effect” [63].
F = 100   ( 1 e k 1   t )
where k 1 denotes the first-order release constant [64]. Using Fick’s first law, it is possible to obtain a relationship among k1 and the diffusion constant in the release medium. A wide variety of systems follow this model.
F = 100   [ 1 ( 1 k H C   t ) 3 ]
where k H C denotes the release constant of the Hixson–Crowell model [65]. This model applies to tablets, and it considers the dissolution carried out in planes parallel to the surface of the tablet.
The DDSolver software was used to fit the experimental data to the drug-release kinetic models [66]. Among the statistical criteria provided by DDSolver to evaluate the goodness of fit of a model, the coefficient of determination (R2), mean square error (MSE), and model selection criterion (MSC) were used in this study. In the comparison of different models, the most appropriate model is the one with the largest MSC. A good fit is achieved when an MSC value larger than 2 or 3 is determined [67]. Table 6 shows the kinetic parameters for methotrexate release from tablets of PLLA–PCL–PEG 2 terpolymer and NC 1 and NC 2 nanocomposites. In contrast, Table 7 presents the kinetic parameters obtained for release tests realized with tablets of PLLA–PCL–PEG 4 terpolymer and NC 3 and NC 4 nanocomposites.
For NC 1, NC 2, NC 3, and NC 4, a comparison of the results shown in Table 6 and Table 7 indicates that the first-order model fit the experimental data with the best accuracy. This statement is based on the fact that the R2 values were generally close to the unity, the MSE values were minimal, and the MSC values were maximal. Contrarily, when these three criteria are taken into account, for the PLLA–PCL–PEG 2 and PLLA–PCL–PEG 4 terpolymers, the best models were Hixson–Crowell and Korsmeyer–Peppas, respectively. In Figure 8 and Figure 9, the solid lines traced over the experimental data of each type of nanocomposite or terpolymer correspond to the fit of the best model mentioned above.
It is important to analyze the result obtained from the Korsmeyer–Peppas model, as its exponent n provides information regarding the drug-release mechanism. The values of n for the nanocomposites were 0.44 (NC 1), 0.45 (NC 2), 0.47 (NC 3), and 0.40 (NC 4). Therefore, Fickian diffusion drives the methotrexate release, specifically for a planar (thin-film) matrix (NC 3), a cylinder-shaped matrix (NC 1 and NC 2), and a sphere-shaped matrix (NC 4). For the last nanocomposite (NC 4), the value of n was minor compared to the typical value of n (0.43) reported elsewhere [68]. Nevertheless, in a similar case, an analogous classification was reported previously [69]. For the PLLA–PCL–PEG 4 terpolymer, the n value was 0.47, indicating diffusion from a planar matrix. However, for PLLA–PCL–PEG 2, the n value was 0.59, indicating an anomalous transport for a planar matrix. Moreover, the analysis through the Korsmeyer–Peppas extended model determined that the n value of PLLA–PCL–PEG 2 terpolymer was 0.77, whereas for NC 1 and NC 2, the values were 0.78 and 0.76, respectively, indicating an anomalous transport for a planar matrix. For all these materials, the value of b was 0.12, indicating that the presence of CNTspo has a small influence on the “burst effect.” Contrarily, for PLLA–PCL–PEG 4 terpolymer, the value of n was 0.61, and the value of b was 0.89, while for NC 3 and NC 4, the values of n were 0.86 and 0.56, respectively, but for both nanocomposites, the values of b were negative. As negative values do not have a physical meaning, these results indicate a poor fit.
The fact that methotrexate is poorly water-soluble (approximately 65 μg/mL) [70] favors its distribution on the PCL chains due to the hydrophobic nature of this biopolymer [14]. In this sense, the lower values of ΔHm1 for the prepared terpolymers and nanocomposites compared to the ΔHm PCL 4 of pure PCL 4 indicate a reduction in crystallinity, which favors the faster hydrolysis of the PCL domains [71] induced via an increment in the mobility of the PCL chains [72]. This affects the release of methotrexate. Although the “burst effect” was not substantially reduced for the studied nanocomposites, it is evident that, in the release tests performed with the nanocomposites, the methotrexate release time was extended, which can be a positive factor in the consideration of their possible use.

4. Conclusions

PLLA–PCL–PEG/CNTpo nanocomposites were prepared and characterized through DSC, as well as FTIR, and XPS spectroscopies, to evaluate their ability to act as nanocarriers of methotrexate. CNTs were prepared through CVD, purified, and chemically functionalized to achieve partial oxidation. The content of the carboxyl groups was higher than that of the hydroxyl groups in the CNTspo. Wet BD was used as an initiator to prepare a series of linear PLLAs and PCL through ROP. The water in the wet BD acted as an effective co-initiator in the synthesis of these homopolymers. PLLA–PCL copolymers and PLLA–PCL–PEG segmented terpolymers were synthesized using OxCl as an effective linker agent. These terpolymers exhibit strong hydrophobic characteristics due to the high content of PLLA and PCL blocks. The evidence recorded using FTIR strongly suggests that the carboxyl and hydroxyl groups of the CNTspo form hydrogen bonding with the ester carbonyl groups of the PCL chains. Moreover, the CNTspo act as nucleating agents of the PCL chains. This suggests that the PCL chains are preferentially oriented to CNTspo. The XPS measurements indicated that the PLLA–PCL–PEG terpolymers chains were grafted to CNTspo. For both PLLA–PCL–PEG terpolymers and PLLA–PCL–PEG/CNTpo nanocomposites, a “burst release” of methotrexate was detected. The “burst release” was attenuated but was not eliminated for the nanocomposites. The in vitro release behavior was analyzed using five models. For all the nanocomposites, the best fit was obtained with the first-order model, whereas for the PLLA–PCL–PEG 2 and PLLA–PCL–PEG 4 terpolymers, the best fit was determined with the Hixson–Crowell and Korsmeyer–Peppas models, respectively. The analysis conducted with the Korsmeyer–Peppas model revealed that, in general, for both the nanocomposites and terpolymers studied, Fickian diffusion drives the methotrexate release.

Supplementary Materials

The following supporting information can be downloaded at https://www.mdpi.com/article/10.3390/polym16182580/s1: Figure S1: DSC thermograms of pure PEG (A), PCL 4 (B), and PLLA 1 (C).

Author Contributions

K.J.G.-I.: methodology, validation, and investigation. E.B.F.-O.: formal analysis, investigation, and writing—review and editing. A.M.-R.: investigation, resources, and writing—review and editing. L.R.C.-Z.: formal analysis and investigation. S.M.N.-D.: conceptualization, resources, writing—original draft, writing—review and editing, supervision, project administration, and funding acquisition. All authors have read and agreed to the published version of the manuscript.

Funding

This research was funded by Consejo Nacional de Humanidades, Ciencias y Tecnologías (CONAHCyT), grant numbers 101369 and 123732.

Institutional Review Board Statement

Not applicable.

Data Availability Statement

The data presented in this study are available upon request from the corresponding author.

Acknowledgments

The authors thank Karla A. Barrera Rivera (Universidad de Guanajuato) for their technical assistance. All authors kindly acknowledge Laboratorio Nacional de Caracterización de Propiedades Fisicoquímicas y Estructura Molecular (Consejo Nacional de Humanidades, Ciencias y Tecnologías (CONAHCyT), grant 123732) for the instrumentation time provided. We also appreciate Saúl Gallegos Castillo (Universidad de Guadalajara) for their support in the Laboratorio de Análisis Industriales y Especiales, as well as Humberto Gutiérrez Pulido (Universidad de Guadalajara) and Ruth Padilla Muñoz (Universidad de Guadalajara) for their assistance in using the Instituto Transdisciplinar de Investigación y Servicios (ITRANS). CONAHCyT funded this research under grant 101369.

Conflicts of Interest

The authors declare no conflicts of interest. The funders had no role in the design of the study, in the collection, analyses, or interpretation of data, in the writing of the manuscript, or in the decision to publish the results.

References

  1. Lopes, J.R.; Santos, G.; Barata, P.; Oliveira, R.; Lopes, C.M. Physical and chemical stimuli–responsive drug delivery systems: Targeted delivery and main routes of administration. Curr. Pharm. Des. 2013, 19, 7169–7184. [Google Scholar] [CrossRef] [PubMed]
  2. Coelho, J.F.; Ferreira, P.C.; Alves, P.; Cordeiro, R.; Fonseca, A.C.; Góis, J.R.; Gil, M.H. Drug delivery systems: Advances technologies potentially applicable in personalized treatments. EPMA J. 2010, 1, 164–209. [Google Scholar] [CrossRef] [PubMed]
  3. Ulbrich, K.; Holá, K.; Ŝubr, V.; Bakandritsos, A.; Tuček, J.; Zbořil, R. Targeted drug delivery with polymers and magnetic nanoparticles: Covalent and noncovalent approaches, release control, and clinical studies. Chem. Rev. 2016, 116, 5338–5431. [Google Scholar] [CrossRef]
  4. Oladipo, A.O.; Lebelo, S.L.; Msagati, T.A.M. Nanocarrier design–function relationship: The prodigious role of properties in regulation biocompatibility for drug delivery applications. Chem. Biol. Interact. 2023, 377, 110466. [Google Scholar] [CrossRef] [PubMed]
  5. Raquez, J.-M.; Habibi, Y.; Murariu, M.; Dubois, P. Polylactide (PLA)–based nanocomposites. Prog. Polym. Sci. 2013, 38, 1504–1542. [Google Scholar] [CrossRef]
  6. Saska, S.; Pilatti, L.; Blay, A.; Shibli, J.A. Bioresorbable polymers: Advanced materials and 4D printing for tissue engineering. Polymers 2021, 13, 563. [Google Scholar] [CrossRef]
  7. Tokiwa, Y.; Jarerat, A. Biodegradation of poly(L–lactide). Biotechnol. Lett. 2004, 26, 771–777. [Google Scholar] [CrossRef]
  8. Sosnowski, S.; Gadzinowski, M.; Slomkowski, S. Poly(L,L–lactide) microspheres by ring–opening polymerization. Macromol. 1996, 29, 4556–4564. [Google Scholar] [CrossRef]
  9. Brzeziński, M.; Biela, T. Polylactide nanocomposites with functionalized carbon nanotubes and their stereocomplexes: A focused review. Mater. Lett. 2014, 121, 244–250. [Google Scholar] [CrossRef]
  10. El Yousfi, R.; Brahmi, R.; Dalli, M.; Achalhi, N.; Azougagh, O.; Tahani, A.; Touzani, R.; El Idrissi, A. Recent advances in nanoparticle development for drug delivery: A comprehensive review of polycaprolactone–based multi–arm architerctures. Polymers 2023, 15, 1835. [Google Scholar] [CrossRef]
  11. Woodruff, M.A.; Hutmacher, D.W. The return of a forgotten polymer–Polycaprolactone in the 21st century. Prog. Polym. Sci. 2010, 35, 1217–1256. [Google Scholar] [CrossRef]
  12. Tambralli, A.; Blakeney, B.; Anderson, J.; Kushwaha, M.; Andukuri, A.; Dean, D.; Jun, H.-W. A hybrid biomimetic scaffold composed of electrospun polycaprolactone nanofibers and self–assembled peptide amphiphile nanofibers. Biofabrication 2009, 1, 025001. [Google Scholar] [CrossRef] [PubMed]
  13. Aghdam, R.M.; Najarian, S.; Shakhesi, S.; Khanlari, S.; Shaabani, K.; Sharifi, S. Investigating the effect of PGA on physical and mechanical properties of electrospun PCL/PGA blend nanofibers. J. Appl. Polym. Sci. 2012, 124, 123–131. [Google Scholar] [CrossRef]
  14. Wang, X.; Wang, Y.; Wei, K.; Zhao, N.; Zhang, S.; Chen, J. Drug distribution within poly(ε–caprolactone) microspheres and in vitro release. J. Mater. Process. Technol. 2009, 209, 348–354. [Google Scholar] [CrossRef]
  15. Constantino, V.R.L.; Figueiredo, M.P.; Magri, V.R.; Eulálio, D.; Cunha, V.R.R.; Alcântara, A.C.S.; Perotti, G.F. Biomaterials based on organic polymers and layered double hydroxides nanocomposites: Drug delivery and tissue engineering. Pharmaceutics 2023, 15, 413. [Google Scholar] [CrossRef]
  16. Yadav, D.; Dewangan, H.K. PEGYLATION: An important approach for novel drug delivery system. J. Biomater. Sci. Polym. Ed. 2021, 32, 266–280. [Google Scholar] [CrossRef] [PubMed]
  17. Veronese, F.M.; Pasut, G. PEGylation, successful approach to drug delivery. Drug Discov. Today 2005, 10, 1451–1458. [Google Scholar] [CrossRef]
  18. Tian, H.; Tang, Z.; Zhuang, X.; Chen, X.; Jing, X. Biodegradable synthetic polymers: Preparation, functionalization and biomedical application. Prog. Polym. Sci. 2012, 37, 237–280. [Google Scholar] [CrossRef]
  19. Tamboli, V.; Mishra, G.P.; Mitra, A.K. Novel pentablock copolymer (PLA–PCL–PEG–PCL–PLA) based nanoparticles for controlled drug delivery: Effect of copolymer compositions on the crystallinity of copolymers and in vitro drug release profile from nanoparticles. Colloid Polym. Sci. 2013, 291, 1235–1245. [Google Scholar] [CrossRef]
  20. Ramasamy, T.; Ruttala, H.B.; Gupta, B.; Poudel, B.K.; Choi, H.-G.; Yong, C.S.; Kim, J.O. Smart chemistry–based nanosized drug delivery systems for systemic applications: A comprehensive review. J. Control. Release 2017, 258, 226–253. [Google Scholar] [CrossRef]
  21. Celentano, W.; Pizzocri, M.; Moncalvo, F.; Pessina, F.; Matteoli, M.; Cellesi, F.; Passoni, L. Functional poly(ε–caprolactone)/poly(ethylene glycol) copolymers with complex topologies for doxorubicin delivery to a proteinase–rich tumor environment. ACS Appl. Polym. Mater. 2022, 4, 8043–8056. [Google Scholar] [CrossRef]
  22. Rad, A.H.; Asiaee, F.; Jafari, S.; Shayanfar, A.; Lavasanifar, A.; Molavi, O. Poly(ethylene glycol)–poly(ε–caprolactone)–based micelles for solubilization and tumor–targeted delivery of silibinin. Bioimpacts 2020, 10, 87–95. [Google Scholar]
  23. Chu, B.; Zhang, L.; Qu, Y.; Chen, X.; Peng, J.; Huang, Y.; Qian, Z. Synthesis, characterization and drug loading property of monomethoxy–poly(ethylene glycol)–poly(ε–caprolactone)–poly(D,L–lactide) (MPEG–PCLA) copolymers. Sci. Rep. 2016, 6, 34069. [Google Scholar] [CrossRef]
  24. Jikei, M.; Takeyama, Y.; Yamadoi, Y.; Shinbo, N.; Matsumoto, K.; Motokawa, M.; Ishibashi, K.; Yamamoto, F. Synthesis and properties of poly(L–lactide)–poly(ε–caprolactone) multiblock copolymers by self–polycondensation of diblock macromonomers. Polym. J. 2015, 47, 657–665. [Google Scholar] [CrossRef]
  25. Zhu, X.; Liu, C.; Duan, J.; Liang, X.; Li, X.; Sun, H.; Kong, D.; Yang, J. Synthesis of three–arm block copolymer poly(lactic–co–glycolic acid)–poly(ethylene glycol) with oxalyl chloride and its application in hydrophobic drug delivery. Int. J. Nanomed. 2016, 11, 6065–6077. [Google Scholar] [CrossRef]
  26. Jia, W.; Gu, Y.; Gou, M.; Dai, M.; Li, X.; Kan, B.; Yang, J.; Song, Q.; Wei, Y.; Qian, Z. Preparation of biodegradable polycaprolactone/poly(ethylene glycol)/polycaprolactone (PCEC) nanoparticles. Drug Deliv. 2008, 15, 409–416. [Google Scholar] [CrossRef]
  27. Huang, X.; Brazel, C.S. On the importance and mechanisms of burst release in matrix–controlled drug delivery systems. J. Control. Release 2001, 73, 121–136. [Google Scholar] [CrossRef] [PubMed]
  28. Qnouch, A.; Solarczyk, V.; Verin, J.; Tourrel, G.; Stahl, P.; Danede, F.; Willart, J.F.; Lemesre, P.E.; Vincent, C.; Siepmann, J.; et al. Dexamethasone–loaded cochlear implants: How to provide a desired “burst release”. Int. J. Pharm. X 2021, 3, 100088. [Google Scholar] [CrossRef]
  29. Bakhrushina, E.O.; Sakharova, P.S.; Konogorova, P.D.; Pyzhov, V.S.; Kosenkova, S.I.; Bardakov, A.I.; Zubareva, I.M.; Krasnyuk, I.I.; Krasnyuk, I.I., Jr. Burst release from in situ forming PLGA–based implants: 12 effectors and ways of correction. Pharmaceutics 2024, 16, 115. [Google Scholar] [CrossRef]
  30. Li, J.; Yap, S.Q.; Yoong, S.L.; Nayak, T.R.; Chandra, G.W.; Ang, W.H.; Panczyk, T.; Ramaprabhu, S.; Vashist, S.K.; Sheu, F.-S.; et al. Carbon nanotube bottles for incorporation, release and enhanced cytotoxic effect of cisplatin. Carbon 2012, 50, 1625–1634. [Google Scholar] [CrossRef]
  31. Heister, E.; Neves, V.; Lamprecht, C.; Silva, S.R.P.; Coley, H.M.; McFadden, J. Drug loading, dispersion stability, and therapeutic efficacy in targeted drug delivery with carbon nanotubes. Carbon 2012, 50, 622–632. [Google Scholar] [CrossRef]
  32. Ye, L.; Chen, W.; Chen, Y.; Qiu, Y.; Yi, J.; Li, X.; Lin, Q.; Guo, B. Functionalized multiwalled carbon nanotube–ethosomes for transdermal delivery of ketoprofen: Ex vivo and in vivo evaluation. J. Drug Deliv. Sci. Technol. 2022, 69, 103098. [Google Scholar] [CrossRef]
  33. Liu, Z.; Tabakman, S.; Welsher, K.; Dai, H. Carbon nanotubes in biology and medicine: In vitro and in vivo detection, imaging and drug delivery. Nano Res. 2009, 2, 85–120. [Google Scholar] [CrossRef] [PubMed]
  34. Lee, W.J.; Clancy, A.J.; Fernández–Toribio, J.C.; Anthony, D.B.; White, E.R.; Solano, E.; Leese, H.S.; Vilatela, J.J.; Shaffer, M.S.P. Interfacially–grafted single–walled carbon nanotube/poly(vinyl alcohol) composite fibers. Carbon 2019, 146, 162–171. [Google Scholar] [CrossRef]
  35. Kalay, S.; Stetsyshyn, Y.; Donchak, V.; Harhay, K.; Lishchynskyi, O.; Ohar, H.; Panchenko, Y.; Voronov, S.; Çulha, M. pH–Controlled fluorescence switching in water–dispersed polymer brushes grafted to modified boron nitride nanotubes for cellular imaging. Beilstein J. Nanotechnol. 2019, 10, 2428–2439. [Google Scholar] [CrossRef]
  36. Silva–Jara, J.M.; Manríquez–González, R.; López–Dellamary, F.A.; Puig, J.E.; Nuño–Donlucas, S.M. Semi–continuous heterophase polymerization to synthesize nanocomposites of poly(acrylic acid)–functionalized carbon nanotubes. J. Macromol. Sci. Part A 2015, 52, 732–744. [Google Scholar] [CrossRef]
  37. Sandoval–García, K.; Alvarado–Mendoza, A.G.; Jiménez–Avalos, J.A.; García–Carvajal, Z.Y.; Olea–Rodríguez, M.A.; Cajero–Zul, L.R.; Nuño–Donlucas, S.M. Synthesis, characterization and evaluation of the toxicity, drug release ability and antibacterial capacity of nanocomposites of polyethylene glycol and functionalized carbon nanotubes. J. Macromol. Sci. Part A 2022, 59, 889–903. [Google Scholar] [CrossRef]
  38. Xia, R.; Li, M.; Zhang, Y.; Qian, J.; Yuan, X. Surface modification of MWNTs with BA–MMA–GMA terpolymer by single–step grafting technique. J. Appl. Polym. Sci. 2011, 119, 282–289. [Google Scholar] [CrossRef]
  39. Villar–Alvarez, E.; Figueroa–Ochoa, E.; Barbosa, S.; Soltero, J.F.A.; Taboada, P.; Mosquera, V. Reverse poly(butylene oxide)–poly(ethylene oxide)–poly(butylene oxide) block copolymers with lengthy hydrophilic blocks as efficient single and dual drug–loaded nanocarriers with synergistic toxic effects on cancer cells. RSC Adv. 2015, 5, 52105–52120. [Google Scholar] [CrossRef]
  40. Rúan–Esparza, L.; Soto, V.; Gómez–Salazar, S.; Rabelero, M.; Ávalos–Borja, M.; Luna–Bárcenas, G.; Prokhorov, E.; Nuño–Donlucas, S.M. Poly[ethylene–co–(acrylic acid)]–based nanocomposites: Thermal and mechanical properties and their structural characteristics studied by Raman spectroscopy. Polym. Compos. 2011, 32, 1181–1189. [Google Scholar] [CrossRef]
  41. Storey, R.F.; Taylor, A.E. End–group analysis of poly(e–caprolactone) initiated with water, ethylene glycol, and 1,4–butanediol. J. Macromol. Sci. Part A 1996, 33, 77–89. [Google Scholar] [CrossRef]
  42. Abdolmaleki, A.; Mallakpour, S.; Rostami, M. Development of carboxylated multi–walled carbon nanotubes reinforced potentially biodegradable poly(amide–imide) based on N–trimellitylimido–S–valine matrixes: Preparation, processing, and thermal properties. Prog. Org. Coat. 2015, 80, 71–76. [Google Scholar] [CrossRef]
  43. Alghunaim, N.S. Optimization and spectroscopic studies on carbon nanotubes/PVA nanocomposites. Results Phys. 2016, 6, 456–460. [Google Scholar] [CrossRef]
  44. Omran, S.M.; Abdullah, E.T.; Al–Zuhairi, O.A. Structural and infrared spectroscopy of polyvinylpyrrolidone/multi–walled carbon nanotubes nanocomposite. Iraqi J. Phys. 2021, 19, 1–6. [Google Scholar] [CrossRef]
  45. Parada, L.G.; Cesteros, L.C.; Meurio, E.; Katime, I. Miscibility and specific interactions in blends of poly(vinyl acetate–co–vinyl alcohol) with poly(ethyloxazoline). Macromol. Chem. Phys. 1997, 198, 2505–2517. [Google Scholar]
  46. Antolín–Cerón, V.H.; Gómez–Salazar, S.; Soto, V.; Ávalos–Borja, M.; Nuño–Donlucas, S.M. Polymer nanocomposites containing carbon nanotubes and miscible polymer blends based on poly[ethylene–co–(acrylic acid)]. J. Appl. Polym. Sci. 2008, 108, 1462–1472. [Google Scholar] [CrossRef]
  47. AAnalyzer®: A Peak–Fitting Program for Photoemission Data. Available online: https://xpsoasis.org/ (accessed on 8 January 2024).
  48. Ratner, B.D.; Castner, D.G. Electron spectroscopy for chemical analysis. In Surface Analysis: The Principal Techniques, 2nd ed.; Vickerman, J.C., Gilmore, I.S., Eds.; Wiley: Chichester, UK, 2009; pp. 53–79. [Google Scholar]
  49. Beamson, G.; Briggs, D. High Resolution XPS of Organic Polymers: The Scienta ESCA300 Database, 1st ed.; Wiley: Chichester, UK, 1992; pp. 84–85, 136–137, 142–143. [Google Scholar]
  50. Wingrove, A.S.; Caret, R.L. Organic Chemistry, 1st ed.; Harla: Mexico City, Mexico, 1984; pp. 1103–1104. [Google Scholar]
  51. Bogdanov, B.; Vidts, A.; Van Den Buicke, A.; Verbeeck, R.; Schacht, E. Synthesis and thermal properties of poly(ethylene glycol)–poly(ε–caprolactone) copolymers. Polymer 1998, 39, 1631–1636. [Google Scholar] [CrossRef]
  52. Bogdanov, B.; Vidts, A.; Schacht, E.; Berghmans, H. Isothermal crystallization of poly(ε–caprolactone–ethylene glycol) block copolymers. Macromolecules 1999, 32, 726–731. [Google Scholar] [CrossRef]
  53. Takeshita, H.; Fukumoto, K.; Ohnishi, T.; Ohkubo, T.; Miya, M.; Takenaka, K.; Shiomi, T. Formation of lamellar structure by competition in crystalization of both components for crystalline–crystallines block copolymers. Polymer 2006, 47, 8210–8218. [Google Scholar] [CrossRef]
  54. Xu, Y.; He, Y.; Wei, J.; Fan, Z.; Li, S. Morphology and melt crystallization of PCL–PEG diblocj copolymers. Macromol. Chem. Phys. 2008, 209, 1836–1844. [Google Scholar] [CrossRef]
  55. Sun, J.; He, C.; Zhuang, X.; Jing, X.; Chen, X. The crystallization behavior of poly(ethylene glycol)–poly(ε–caprolactone) diblock copolymers with asymmetric block compositions. J. Polym. Res. 2011, 18, 2161–2168. [Google Scholar] [CrossRef]
  56. Shokrolahi, F.; Yeganeh, H. Soft segment composition and its influence on phase–separated morphology of PCL/PEG–based poly(urethane urea)s. Iran Polym. J. 2014, 23, 505–512. [Google Scholar] [CrossRef]
  57. Xu, Y.; Zhang, Y.; Fan, Z.; Li, S. Melt crystallization and morphology of poly(ε–caprolactone)–poly(ethylene glycol) diblock copolymers with different compositions and molecular weights. J. Polym. Sci. Part B Polym Phys. 2010, 48, 289–293. [Google Scholar] [CrossRef]
  58. Flory, A.L.; Ramanathan, T.; Brinson, L.C. Physical aging of single wall carbon nanotube polymer nanocomposites: Effect of functionalization of the nanotube on the enthalpy relaxation. Macromolecules 2010, 43, 4247–4252. [Google Scholar] [CrossRef]
  59. Babal, A.S.; Gupta, R.; Singh, B.P.; Dhakate, S.R. Depression in glass transition temperature of multiwalled carbon nanotubes reinforced polycarbonate composites: Effect of functionalization. RSC Adv. 2015, 5, 43462–43472. [Google Scholar] [CrossRef]
  60. Saldaña–Rojas, U.A.; Cortés–Llamas, S.A.; Jiménez–Avalos, J.A.; García–Carvajal, Z.Y.; Olea–Rodríguez, M.A.; Cajero–Zul, L.R.; Nuño–Donlucas, S.M. Evaluation of the toxicity and cisplatin drug-release ability of nanocomposites of polyethylene glycol and carbon nanotubes functionalized with Zn2+ ions. Int. J. Polym. Mater. 2024, 73, 946–960. [Google Scholar] [CrossRef]
  61. Wang, H.; Xu, J.; Wang, J.; Chen, T.; Wang, Y.; Tan, Y.W.; Su, H.; Chan, K.L.; Chen, H. Probing the kinetics of short–distance drug release from nanocarriers to nanoacceptors. Angew. Chem. Int. Ed. 2010, 49, 8426–8430. [Google Scholar] [CrossRef]
  62. Korsmeyer, R.W.; Gumy, R.; Doelker, E.; Buri, P.; Peppas, N.A. Mechanisms of solute release from porous hydrophilic polymers. Int. J. Pharm. 1983, 15, 25–35. [Google Scholar] [CrossRef]
  63. Kim, H.; Fassihi, R. Application of binary polymer in drug release rate modulation. 2. Influence of formulation variables and hydrodynamic conditions on release kinetics. J. Pharm. Sci. 1997, 86, 323–328. [Google Scholar] [CrossRef]
  64. Polli, J.E.; Rekhi, G.S.; Augsburger, L.L.; Shah, V.P. Methods to compare dissolution profiles and a rationale for wide dissolution specifications for metoprolol tartrate tablets. J. Pharm. Sci. 1997, 86, 690–700. [Google Scholar] [CrossRef]
  65. Hixson, A.W.; Crowell, J.H. Dependence of reaction velocity upon surface and agitation. Ind. Eng. Chem. 1931, 23, 923–931. [Google Scholar] [CrossRef]
  66. Zhang, Y.; Huo, M.; Zhou, J.; Zou, A.; Li, W.; Yao, C.; Xie, S. DDSolver: An add–in program for modeling and comparison of drug dissolution profiles. AAPS J. 2010, 12, 263–271. [Google Scholar] [CrossRef] [PubMed]
  67. Mayer, B.X.; Mensik, C.; Krishnaswami, S.; Hartmut, D.; Eichler, H.-G.; Schmetterer, L.; Wolzt, M. Pharmacokinetic–pharmacodynamic profile of systemic nitric oxide–synthase inhibition with L–NMMA in humans. Br. J. Clin. Pharmacol. 1999, 47, 539–544. [Google Scholar] [CrossRef] [PubMed]
  68. Bruschi, M.L. Mathematical models of drug release. In Strategies to Modify the Drug Release from Pharmaceutical Systems, 1st ed.; Bruschi, M.L., Ed.; Elsevier: Cambridge, UK, 2015; pp. 63–86. [Google Scholar]
  69. Shoaib, M.H.; Tazeen, J.; Merchant, H.A.; Yousuf, R.I. Evaluation of drug release kinetics from ibuprofen matrix tablets using HPMC. Pak. J. Pharm. Sci. 2006, 19, 119–124. [Google Scholar]
  70. Giri, B.R.; Kim, J.S.; Park, J.H.; Jin, S.G.; Kim, K.S.; Din, F.U.; Choi, H.G.; Kim, D.W. Improved bioavailability and high photostability of methotrexate by spray–dried surface–attached solid dispersion with and aqueous medium. Pharmaceutics 2021, 13, 111. [Google Scholar] [CrossRef]
  71. Erdal, N.B.; Lando, G.A.; Yadav, A.; Srivastava, R.K.; Hakkarainen, M. Hydrolytic degradation of porous crosslinked poly(e–caprolactone) synthesized by high internal phase emulsion templating. Polymers 2020, 12, 1849. [Google Scholar] [CrossRef]
  72. Yoshioka, T.; Kamada, F.; Kawazoe, N.; Tateishi, T.; Chen, G. Structural changes and biodegradation of PLLA, PCL, and PLGA sponges during in vitro incubation. Polym. Eng. Sci. 2010, 50, 1895–1903. [Google Scholar] [CrossRef]
Scheme 1. Expected chemical reaction for the preparation of PLLA–PCL–PEG terpolymers.
Polymers 16 02580 sch001
Figure 1. 1H–NMR spectrum of the PLLA–PCL 2 copolymer.
Polymers 16 02580 g001
Figure 2. 1H–NMR spectrum of the PLLA–PCL–PEG 3 terpolymer.
Polymers 16 02580 g002
Figure 3. 13C–NMR spectrum of the PLLA–PCL–PEG 2 terpolymer.
Polymers 16 02580 g003
Figure 4. Partial IR spectra centered in the 1500 to 1900 cm−1 region of PEG (A), CNTspo (B), PCL 4 (C), PLLA 1 (D), PLLA–PCL–PEG 2 (E), NC 2 (F), and NC 1 (G).
Polymers 16 02580 g004
Scheme 2. Chemical structure of the prepared PLLA–PCL–PEG terpolymers when water acts as an effective initiator.
Polymers 16 02580 sch002
Figure 5. Partial IR spectra in the 3050-to-3900 cm−1 region for CNTspo (A), PCL 4 (B), PLLA 1 (C), PEG (D), PLLA–PCL–PEG 2 (E), NC 2 (F), and NC 1 (G).
Polymers 16 02580 g005
Figure 6. C1s core-level normalized spectra of PLLA–PCL–PEG 4 (A), NC 4 (B), and NC 3 (C).
Polymers 16 02580 g006
Scheme 3. Grafting chemical reaction for preparing the PLLA–PCL–PEG/CNTspo nanocomposites.
Polymers 16 02580 sch003
Figure 7. DSC thermograms of PLLA–PCL–PEG 4 (A), NC 3 (B), and NC 4 (C).
Polymers 16 02580 g007
Figure 8. In vitro methotrexate release profiles for PLLA–PCL–PEG 2 (), NC 1 (), and NC 2 (). An inset shows the methotrexate release data without error bars until 4 h.
Polymers 16 02580 g008
Figure 9. In vitro methotrexate release patterns for PLLA–PCL–PEG 4 (), NC 3 (), and NC 4 (). An inset shows the methotrexate release data without error bars until 4 h.
Polymers 16 02580 g009
Table 1. Identification legends for the PLLA–PCL–PEG terpolymers, the PLLA–PCL–PEG/CNTspo nanocomposites, and the content of CNTspo (wt.%) in each nanocomposite.
Legend Assigned to the Prepared PLLA–PCL–PEG/CNTspo NanocompositesName of the PLLA–PCL–PEG Terpolymer Used as the Polymer Matrix of a NanocompositeContent of CNTspo (wt.%)
NC 1PLLA–PCL–PEG 21.0
NC 2PLLA–PCL–PEG 20.5
NC 3PLLA–PCL–PEG 41.0
NC 4PLLA–PCL–PEG 40.5
Table 2. GPC results and yield of the homopolymerization of L–LA and ε–CL; both polymer precursors are denominated here as M.
HomopolymerMolar Ratio of [M]/[Wet BD]Mw (g/mol)Mw/MnYield (%)
PLLA 130/124,6701.0790
PLLA 240/131,1101.0892
PLLA 350/134,2501.0995
PLLA 460/134,8001.0790
PCL 130/110,2801.0790
PCL 240/125,6501.1090
PCL 350/132,3301.1693
PCL 460/135,3701.1191
Table 3. Compositions in mol% of PLLA–PCL copolymers.
CopolymerPLLAPCL
PLLA–PCL 163.037.0
PLLA–PCL 252.847.2
PLLA–PCL 362.137.9
PLLA–PCL 454.745.3
Table 4. Compositions in mol% of PLLA–PCL–PEG terpolymers.
TerpolymerPLLAPCLPEG
PLLA–PCL–PEG 168.222.49.4
PLLA–PCL–PEG 246.040.014.0
PLLA–PCL–PEG 351.038.410.6
PLLA–PCL–PEG 448.043.09.0
Table 5. Results of the analysis of the DSC thermograms of the PLLA–PCL–PEG terpolymers and PLLA–PCL–PEG/CNTspo nanocomposites used in methotrexate-release tests.
SampleTg1
(K)
Tg2
(K)
Tm1
(K)
Tm2
(K)
ΔHm1
J/g
Tm3
(K)
ΔHm2
J/g
PLLA–PCL–PEG 2221.15287.15318.458.1398.8535.9
PLLA–PCL–PEG 4223.15285.15317.45323.558.0398.5536.6
NC 1216.15291.15313.95319.8530.2413.6529.6
NC 2218.15258.15312.65319.4533.6413.3528.5
NC 3219.15290.15305.55314.4526.4405.0519.9
NC 4217.15252.15302.15312.7523.3387.9520.5
Table 6. Kinetic parameters for methotrexate release from tablets of PLLA–PCL–PEG 2 terpolymer and NC 1 and NC 2 nanocomposites determined with Higuchi, Korsmeyer–Peppas, Korsmeyer–Peppas extended, first-order, and Hixson–Crowell models.
ModelsTested Materials
PLLA–PCL–PEG 2NC 1NC 2
Higuchi k H   ( h 1 2 ) 14.12 ± 0.3611.56 ± 0.2911.51 ± 0.24
R20.975 ± 0.0130.963 ± 0.0240.960 ± 0.002
MSE39.95 ± 23.9353.16 ± 33.8159.26 ± 6.58
MSC3.67 ± 0.543.31 ± 0.703.11 ± 0.05
Korsmeyer–Peppas k K P   ( h n ) 10.34 ± 0.7114.87 ± 3.6114.18 ± 2.89
n0.59 ± 0.030.44 ± 0.050.45 ± 0.06
R20.984 ± 0.0080.972 ± 0.0120.966 ± 0.008
MSE26.57 ± 16.1641.72 ± 17.7751.47 ± 19.53
MSC4.02 ± 0.533.46 ± 0.463.26 ± 0.23
Korsmeyer–Peppas extended1 k K P   ( h n ) 6.92 ± 3.696.64 ± 0.496.47 ± 3.36
n0.77 ± 0.240.78 ± 0.050.76 ± 0.14
b0.12 ± 0.690.12 ± 0.370.12 ± 0.17
R20.995 ± 0.0030.993 ± 0.0040.996 ± 0.002
MSE1.19 ± 0.851.68 ± 0.230.88 ± 0.73
MSC4.99 ± 0.704.60 ± 0.545.17 ± 0.55
First-order k 1 ( h 1 ) 0.06 ± 0.0030.05 ± 0.0080.04 ± 0.001
R20.991 ± 0.0010.996 ± 0.0030.993 ± 0.005
MSE13.88 ± 3.785.85 ± 3.9110.01 ± 5.32
MSC4.61 ± 0.165.53 ± 0.744.96 ± 0.72
Hixson–Crowell k H C ( h 1 3 ) 0.015 ± 0.0010.012 ± 0.0020.012 ± 0.001
R20.995 ± 0.0040.985 ± 0.0100.983 ± 0.020
MSE6.47 ± 5.2821.18 ± 13.6821.60 ± 25.91
MSC5.56 ± 1.044.23 ± 0.714.75 ± 1.93
1 To determine the burst effect, the portion of the release curve where F < 44.8% was analyzed.
Table 7. Kinetic parameters for methotrexate release from tablets of PLLA–PCL–PEG 4 terpolymer and NC 3 and NC 4 nanocomposites determined with Higuchi, Korsmeyer–Peppas, Korsmeyer–Peppas extended, first-order, and Hixson–Crowell models.
ModelsTested Materials
PLLA–PCL–PEG 4NC 3NC 4
Higuchi k H   ( h 1 2 ) 15.86 ± 0.3511.26 ± 0.3811.56 ± 0.17
R20.985 ± 0.0020.966 ± 0.0060.961 ± 0.015
MSE19.58 ± 4.4050.50 ± 13.5151.48 ± 17.69
MSC4.10 ± 0.113.29 ± 0.183.16 ± 0.38
Korsmeyer–Peppas k K P   ( h n ) 17.65 ± 1.9312.71 ± 0.1417.20 ± 2.33
n0.47 ± 0.040.47 ± 0.010.40 ± 0.03
R20.989 ± 0.0060.967 ± 0.0070.979 ± 0.002
MSE16.33 ± 10.2549.82 ± 14.4428.39 ± 2.04
MSC4.34 ± 0.563.28 ± 0.203.70 ± 0.10
Korsmeyer–Peppas extended1 k K P   ( h n ) 13.75 ± 5.674.88 ± 0.3311.83 ± 3.21
n0.61 ± 0.140.86 ± 0.060.56 ± 0.09
b 0.89 ± 2.83– 0.86 ± 0.18– 0.38 ± 0.51
R20.993 ± 0.0050.988 ± 0.0030.997 ± 0.001
MSE2.66 ± 1.662.43 ± 0.150.65 ± 0.11
MSC4.76 ± 0.794.05 ± 0.235.54 ± 0.23
First-order k 1 ( h 1 ) 0.08 ± 0.0010.04 ± 0.0040.05 ± 0.005
R20.981 ± 0.0150.996 ± 0.0030.987 ± 0.006
MSE25.01 ± 17.655.55 ± 3.8416.28 ± 7.78
MSC3.98 ± 0.895.61 ± 0.854.34 ± 0.53
Hixson–Crowell k H C   ( h 1 3 ) 0.02 ± 0.0010.01 ± 0.0010.01 ± 0.001
R20.964 ± 0.0320.984 ± 0.0110.970 ± 0.010
MSE46.05 ± 37.6921.98 ± 14.7239.53 ± 11.87
MSC3.43 ± 1.054.23 ± 0.823.41 ± 0.34
1 The burst effect was evaluated through an analysis of the portion of the release curve in which F < 60.5%.
Disclaimer/Publisher’s Note: The statements, opinions and data contained in all publications are solely those of the individual author(s) and contributor(s) and not of MDPI and/or the editor(s). MDPI and/or the editor(s) disclaim responsibility for any injury to people or property resulting from any ideas, methods, instructions or products referred to in the content.

