
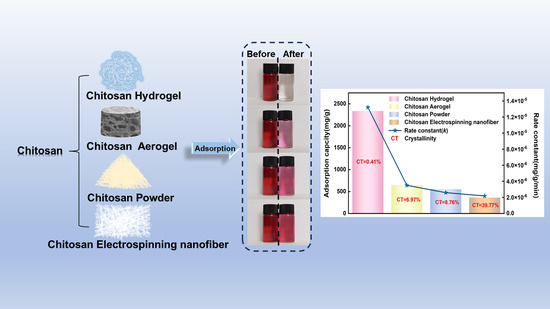
A Comparative Study of Removal of Acid Red 27 by Adsorption on Four Different Chitosan Morphologies


Abstract
1. Introduction
2. Materials and Methods
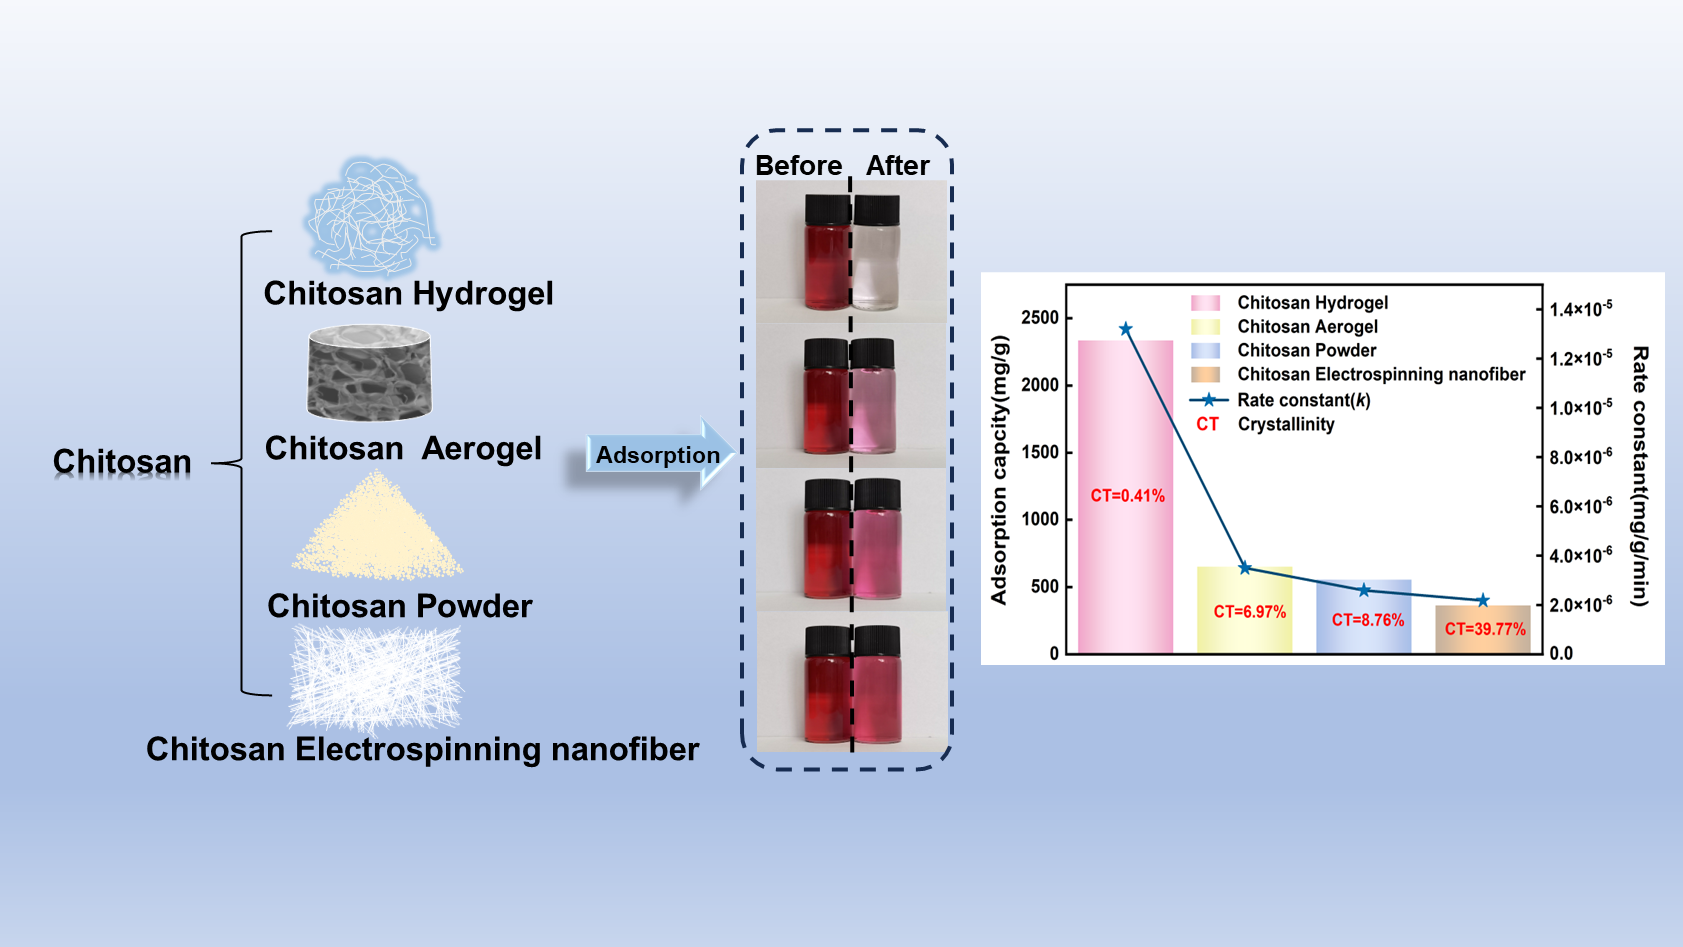
2.1. Materials
2.2. Preparation of CSP
2.3. Preparation of CSH
2.4. Preparation of CSA
2.5. Preparation of CSEN
2.6. Characterization
2.7. Adsorption Kinetics
2.8. Adsorption Isotherm
3. Results
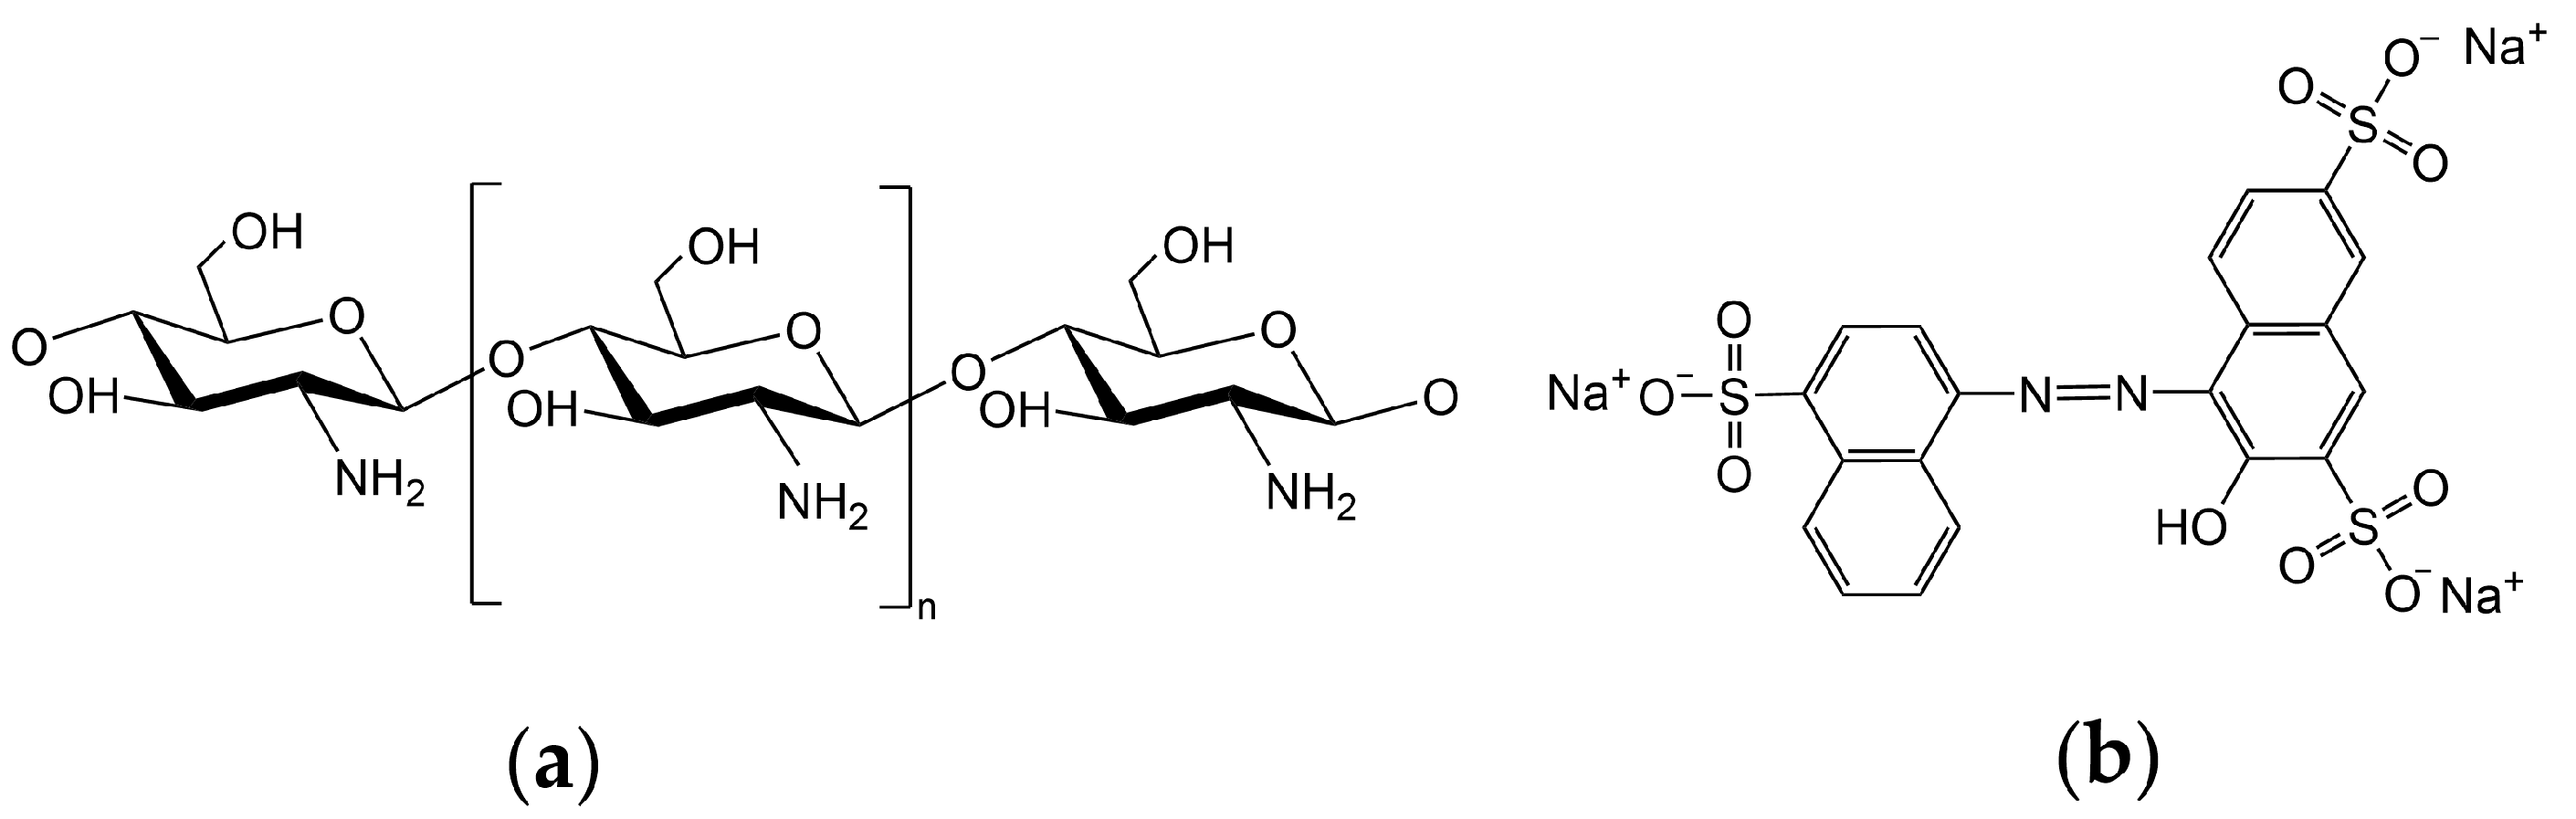
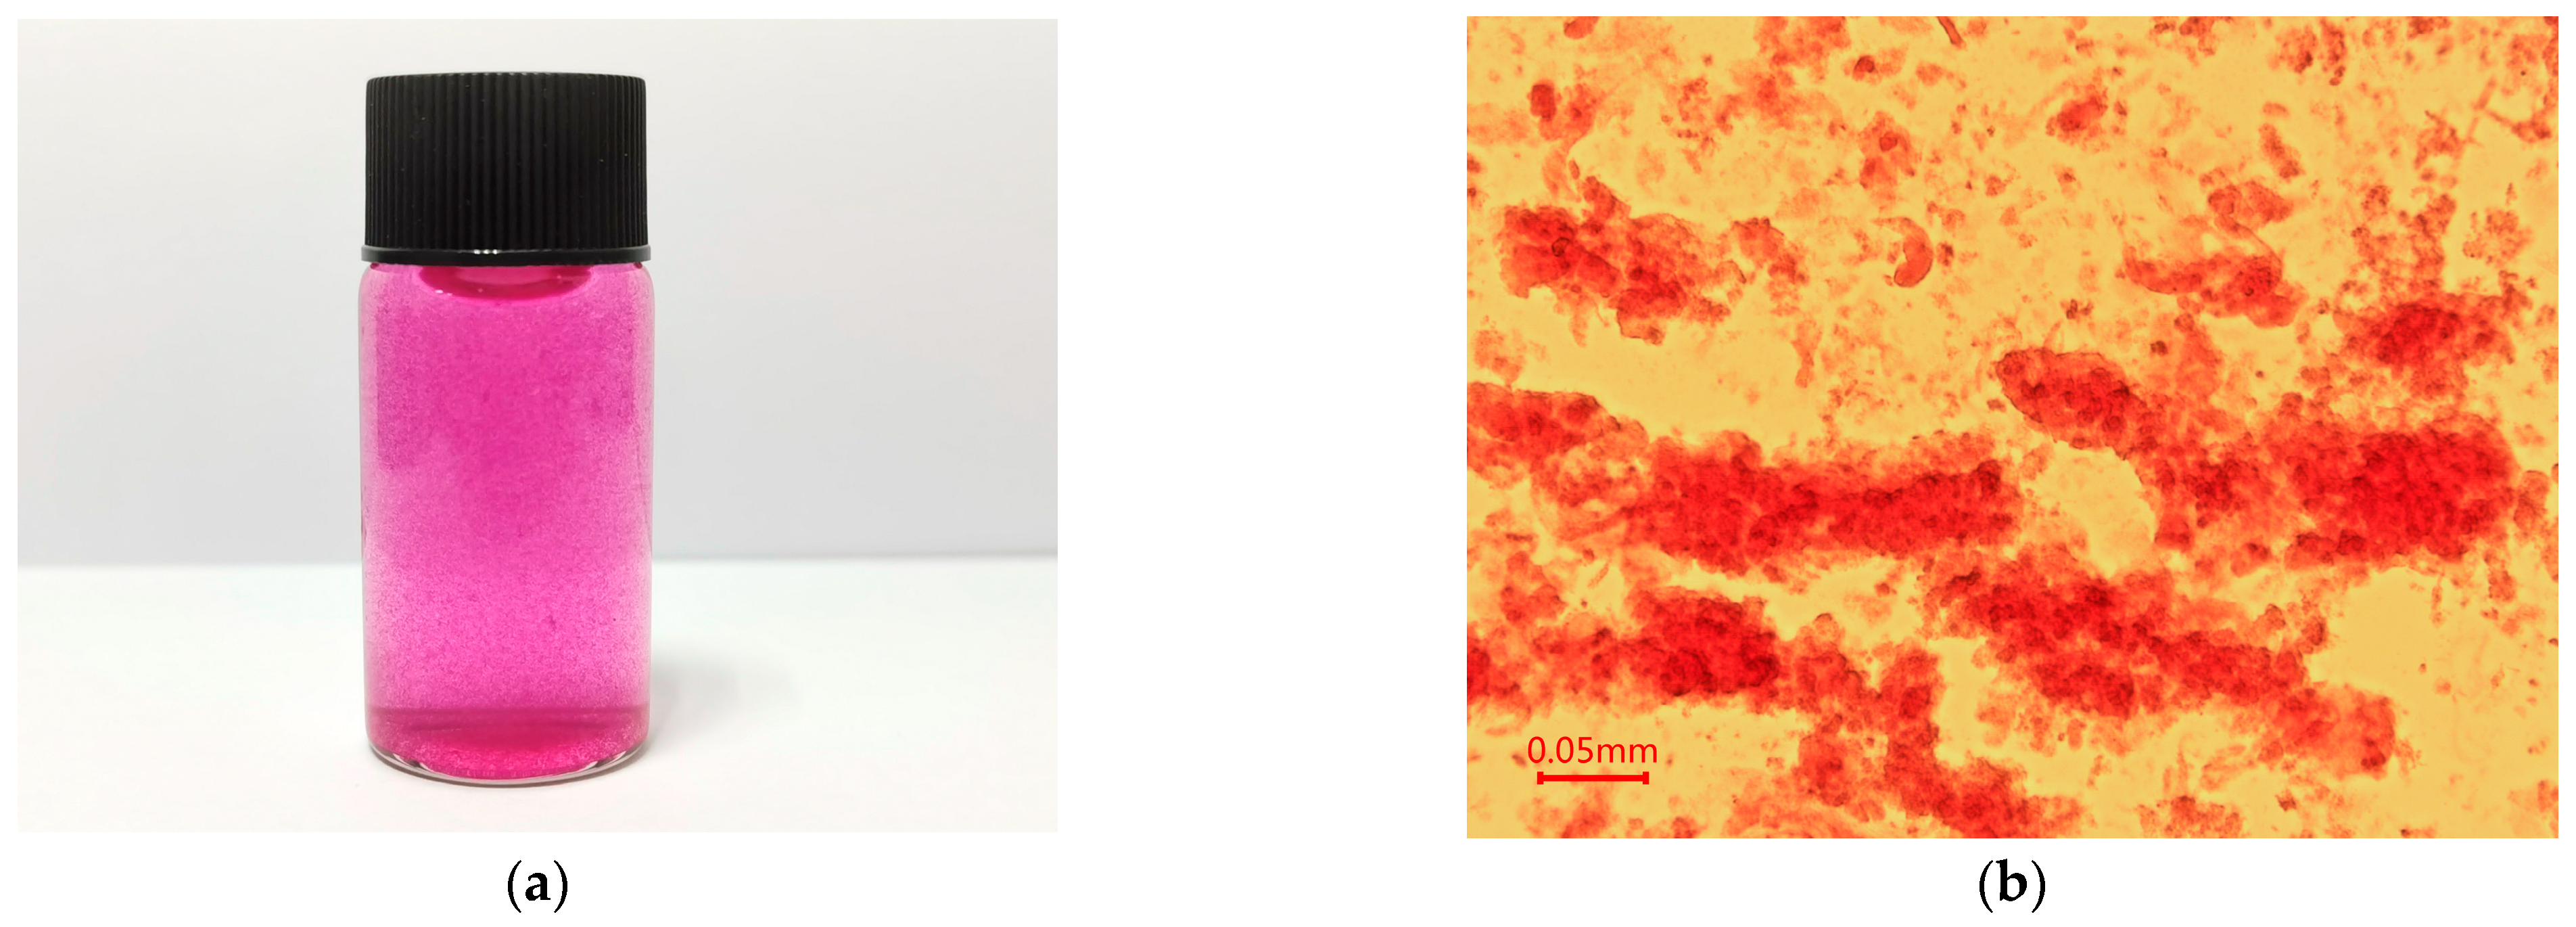
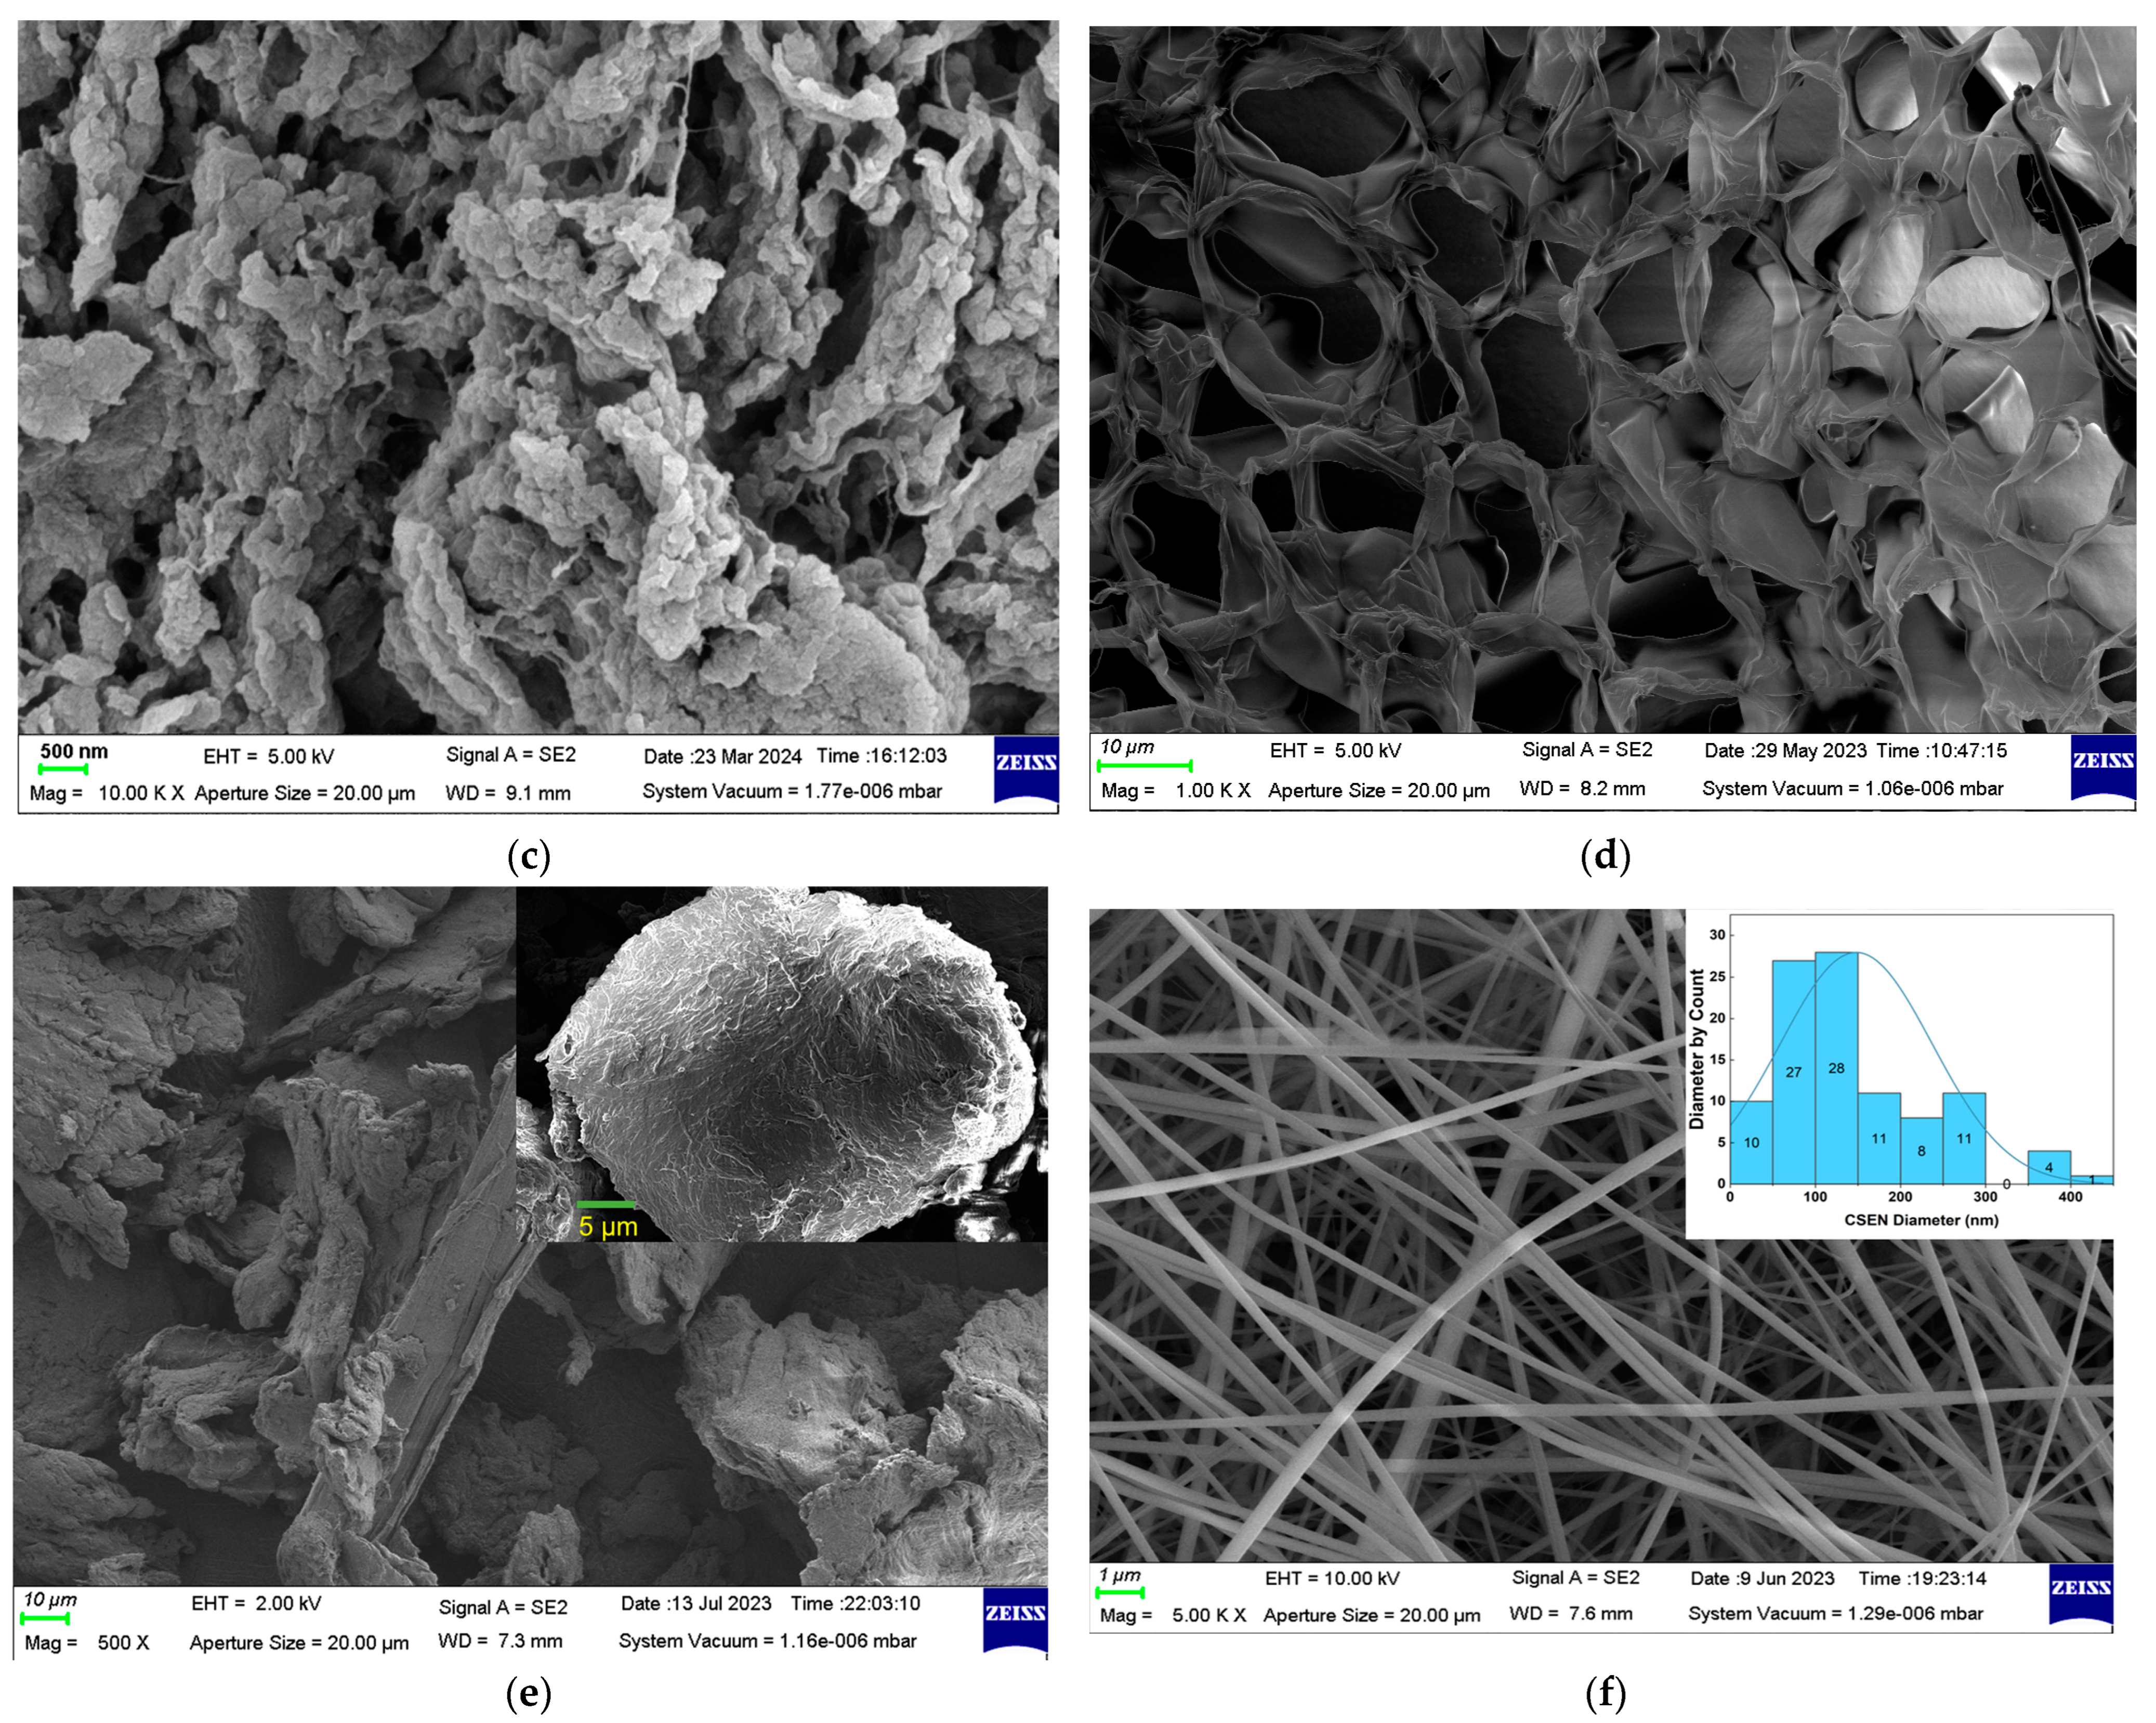
3.1. Morphology Analysis
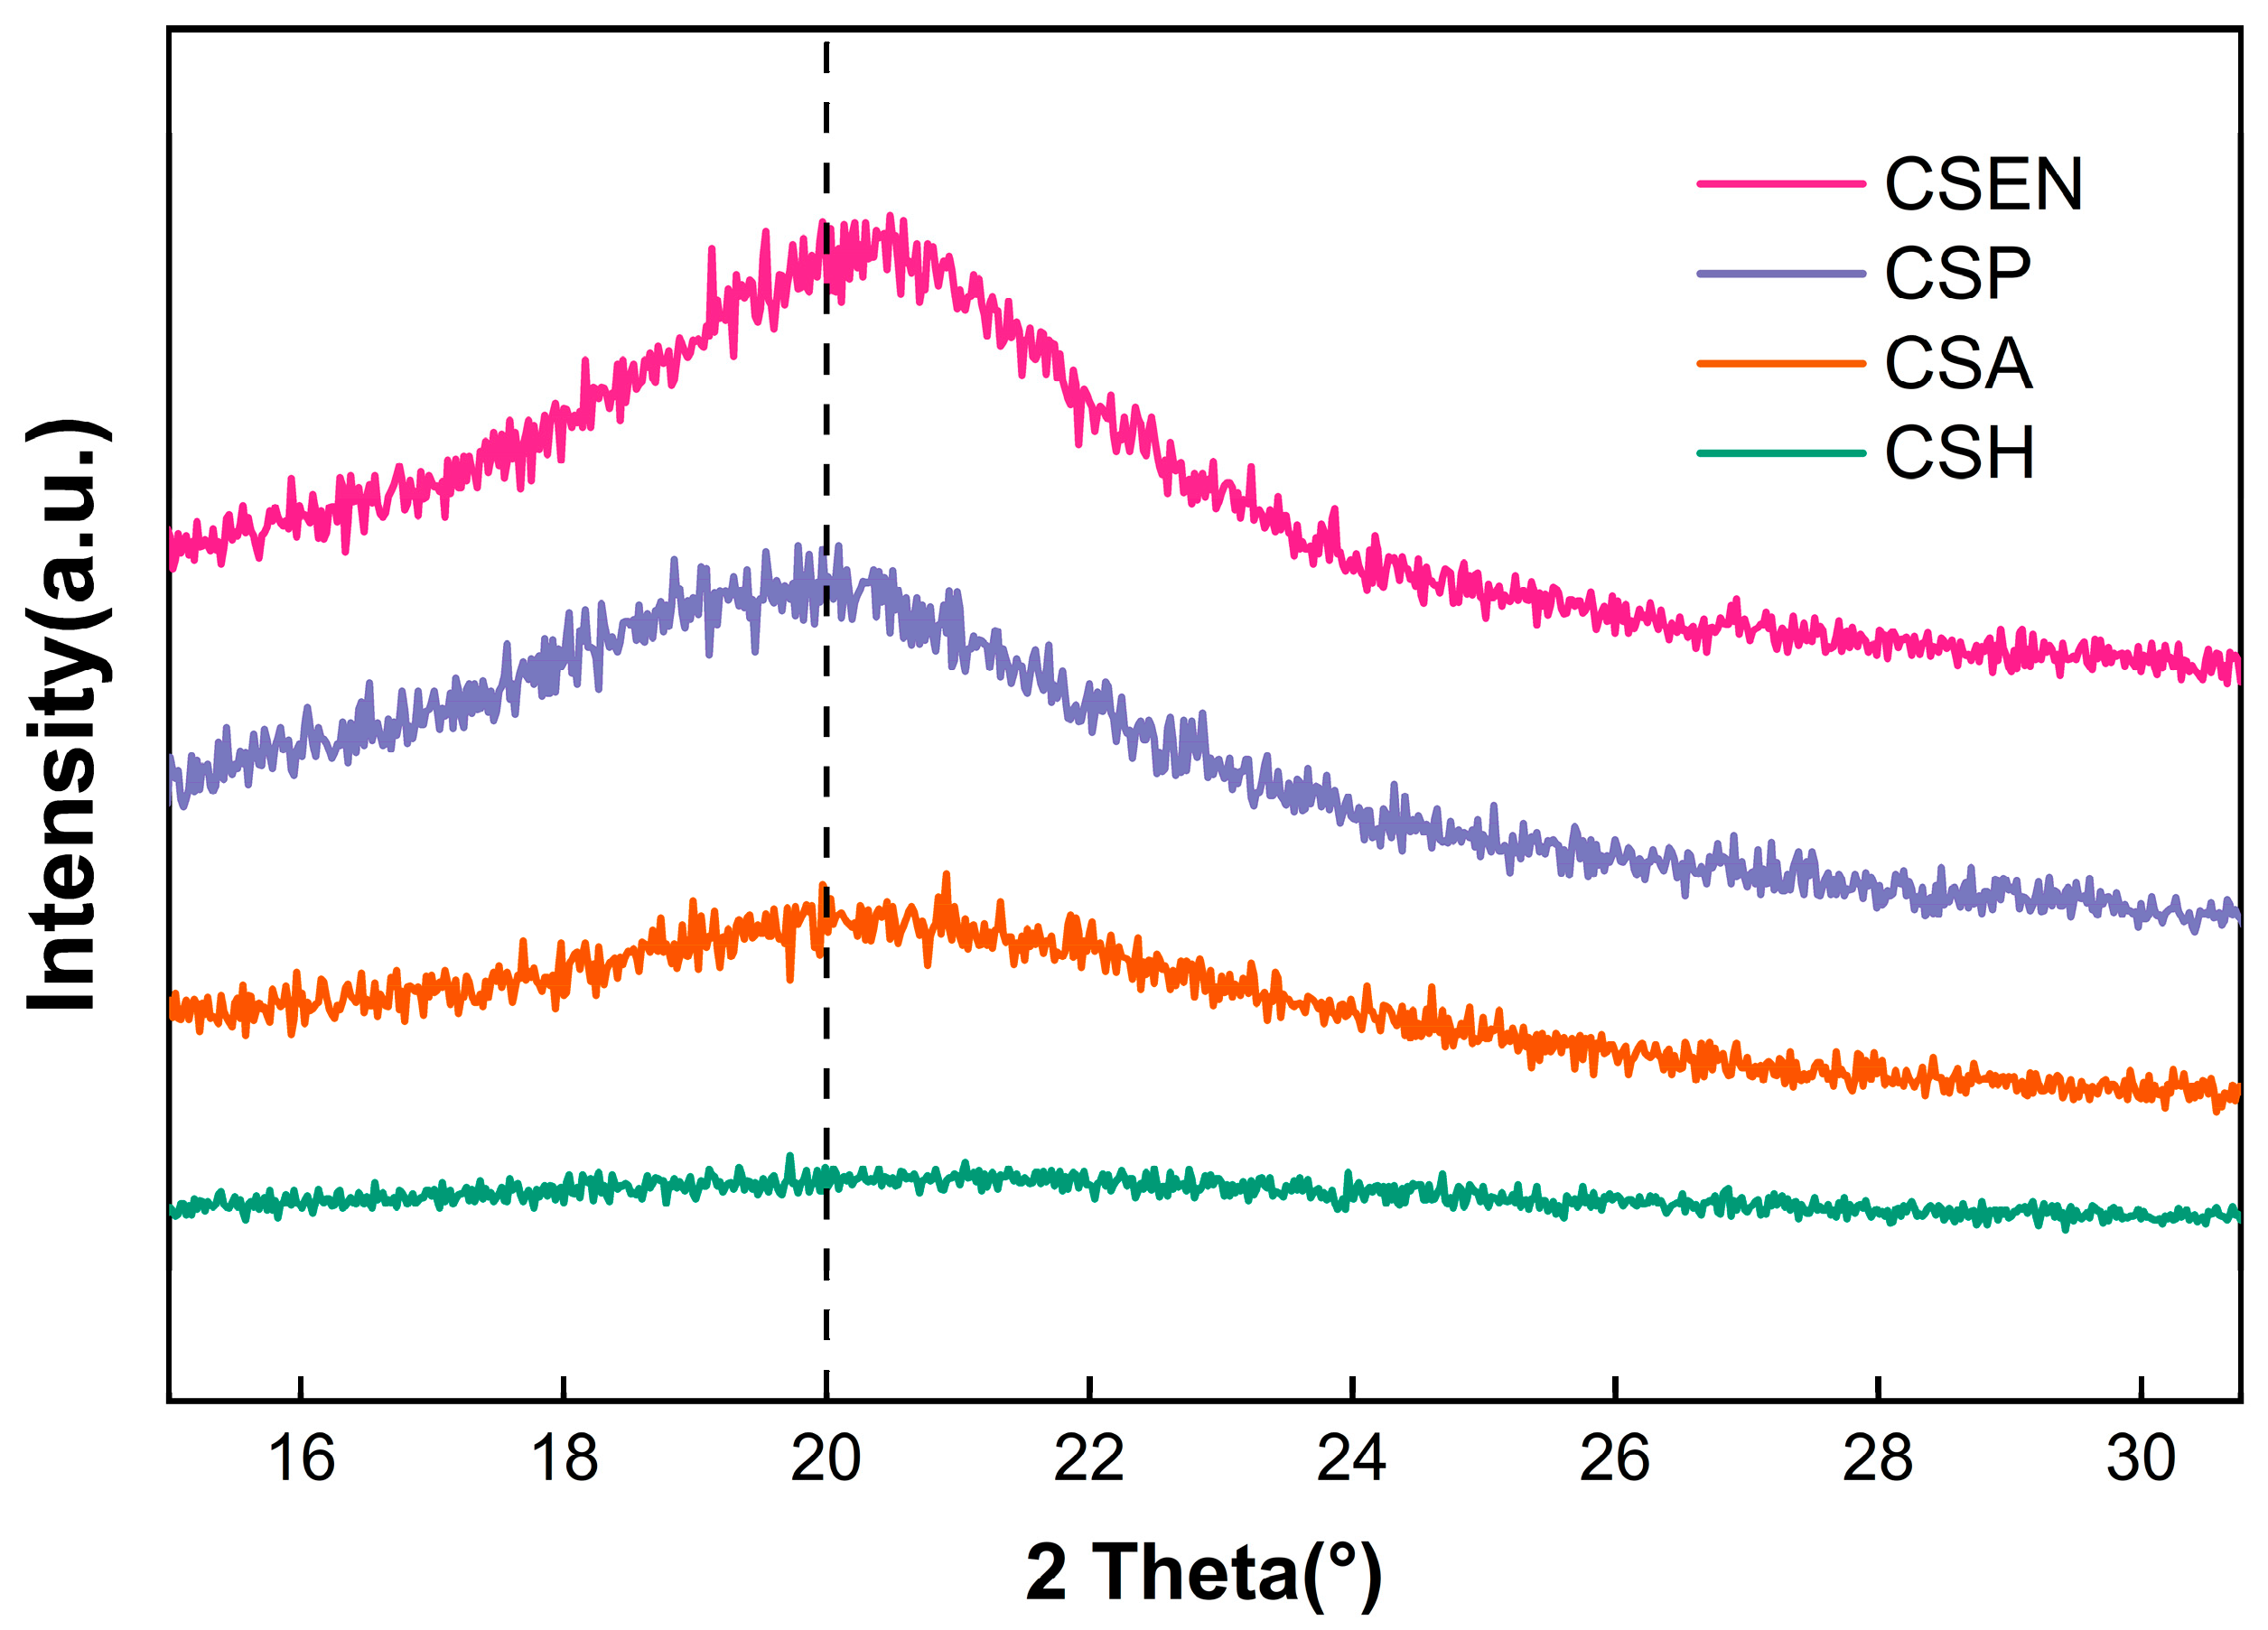
3.2. XRD Analysis
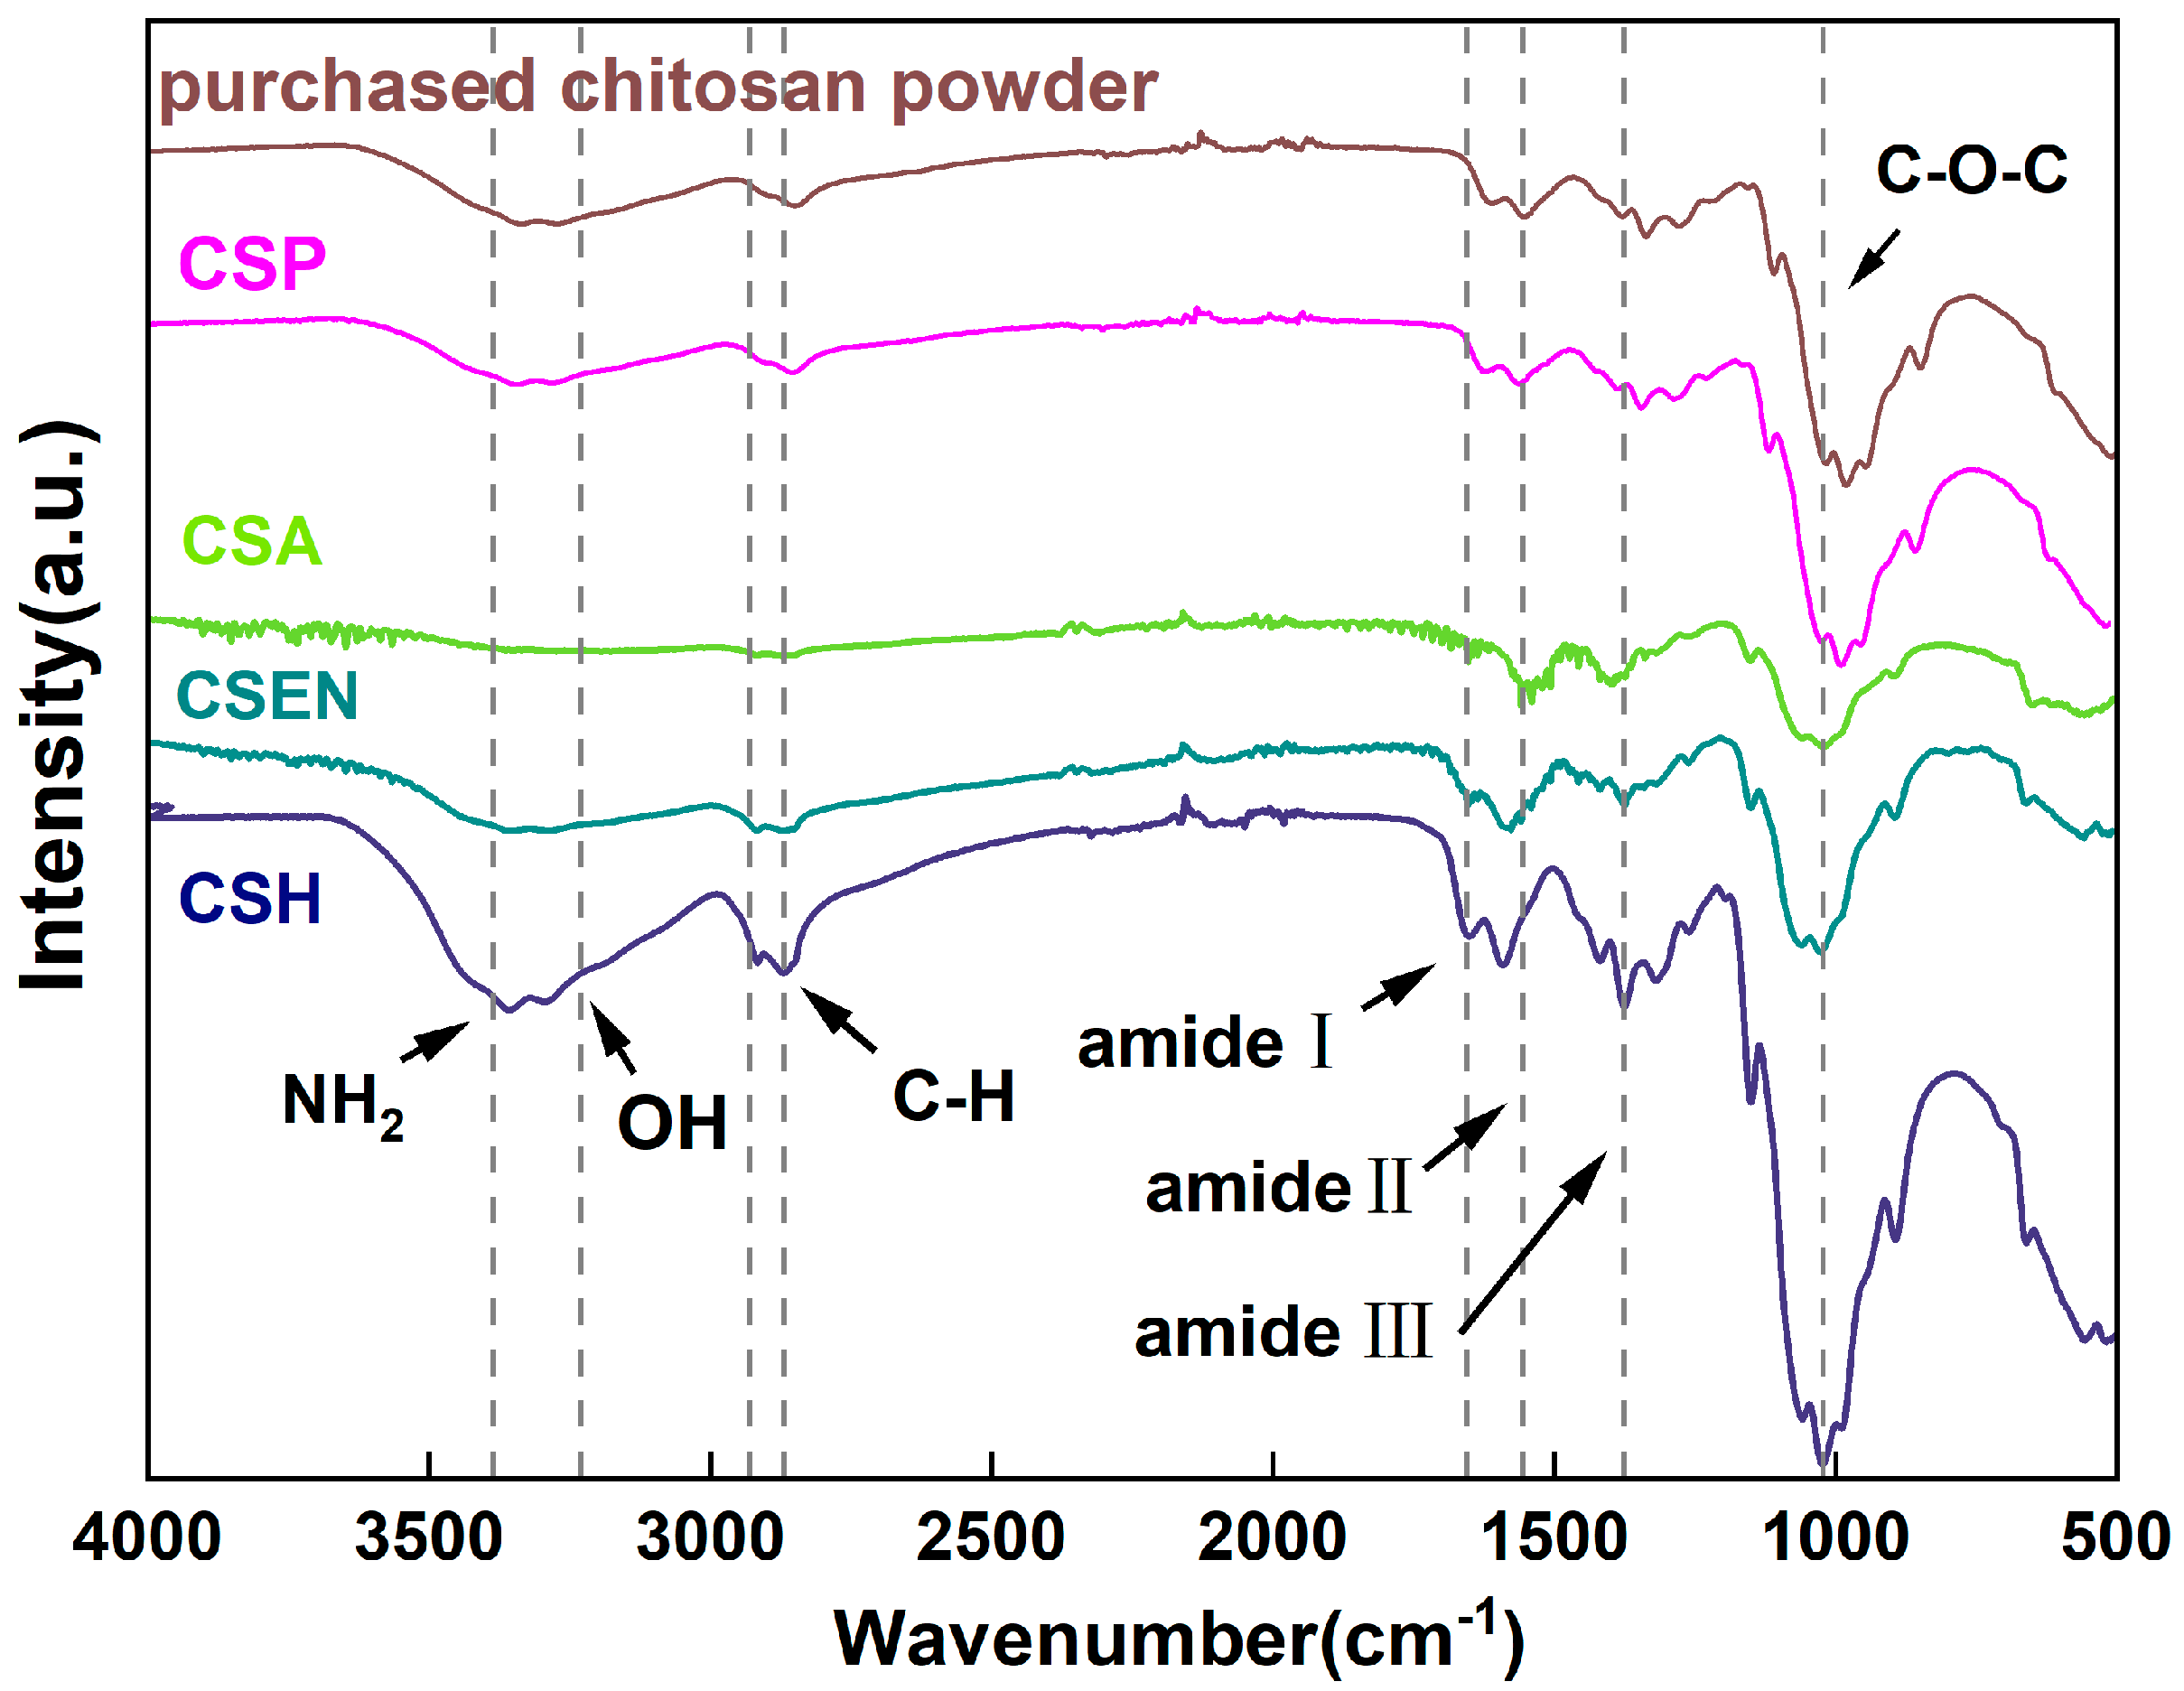
3.3. FTIR Analysis
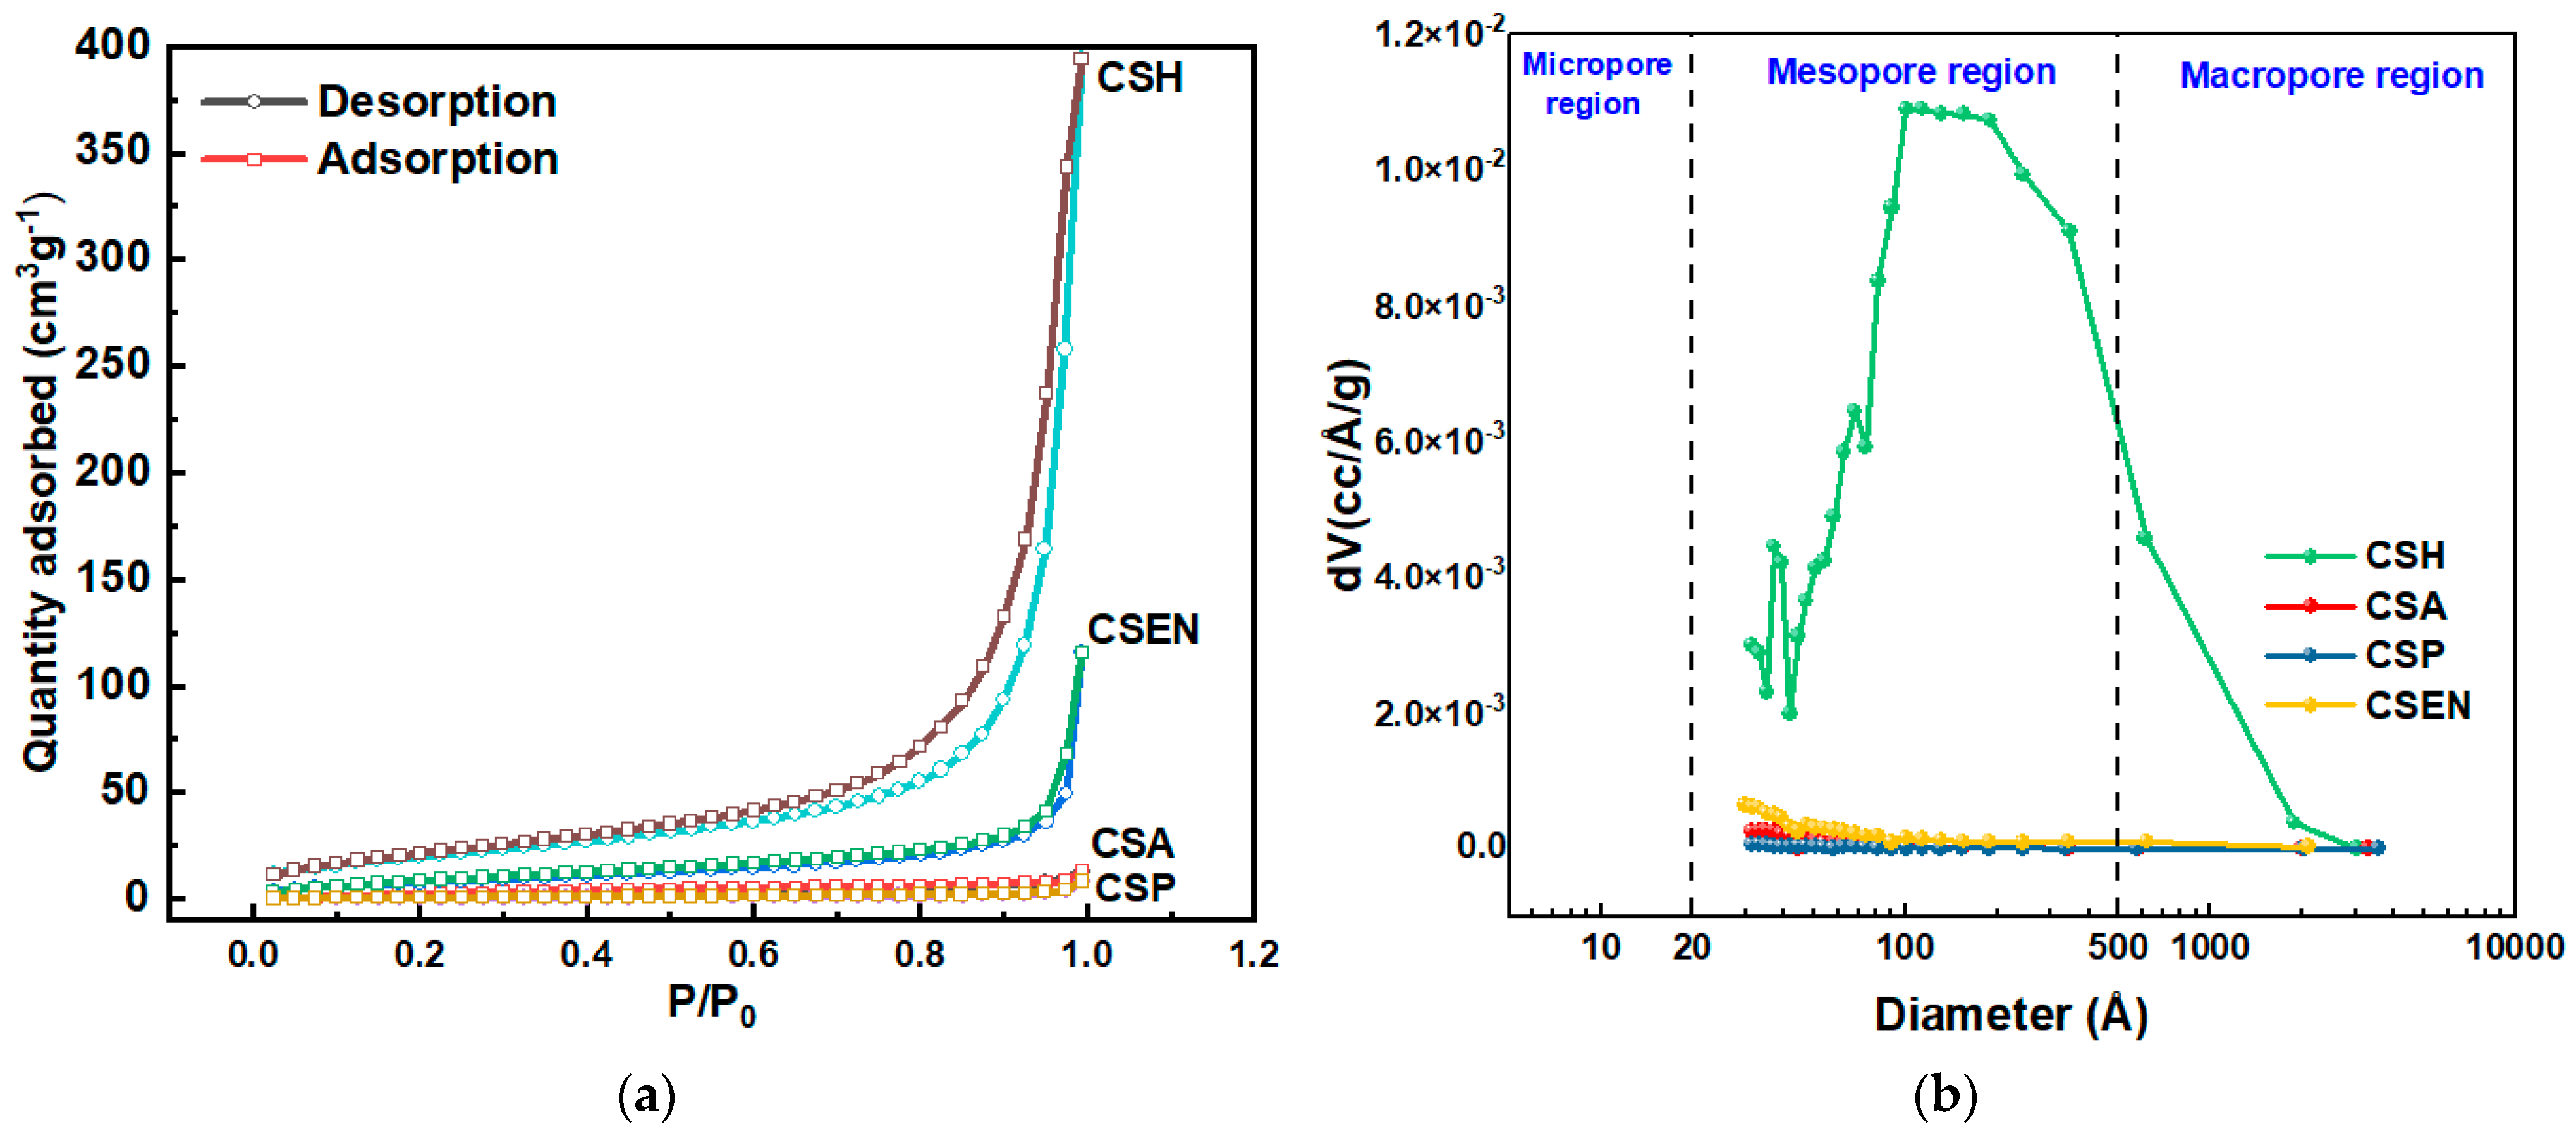
3.4. BET Analysis
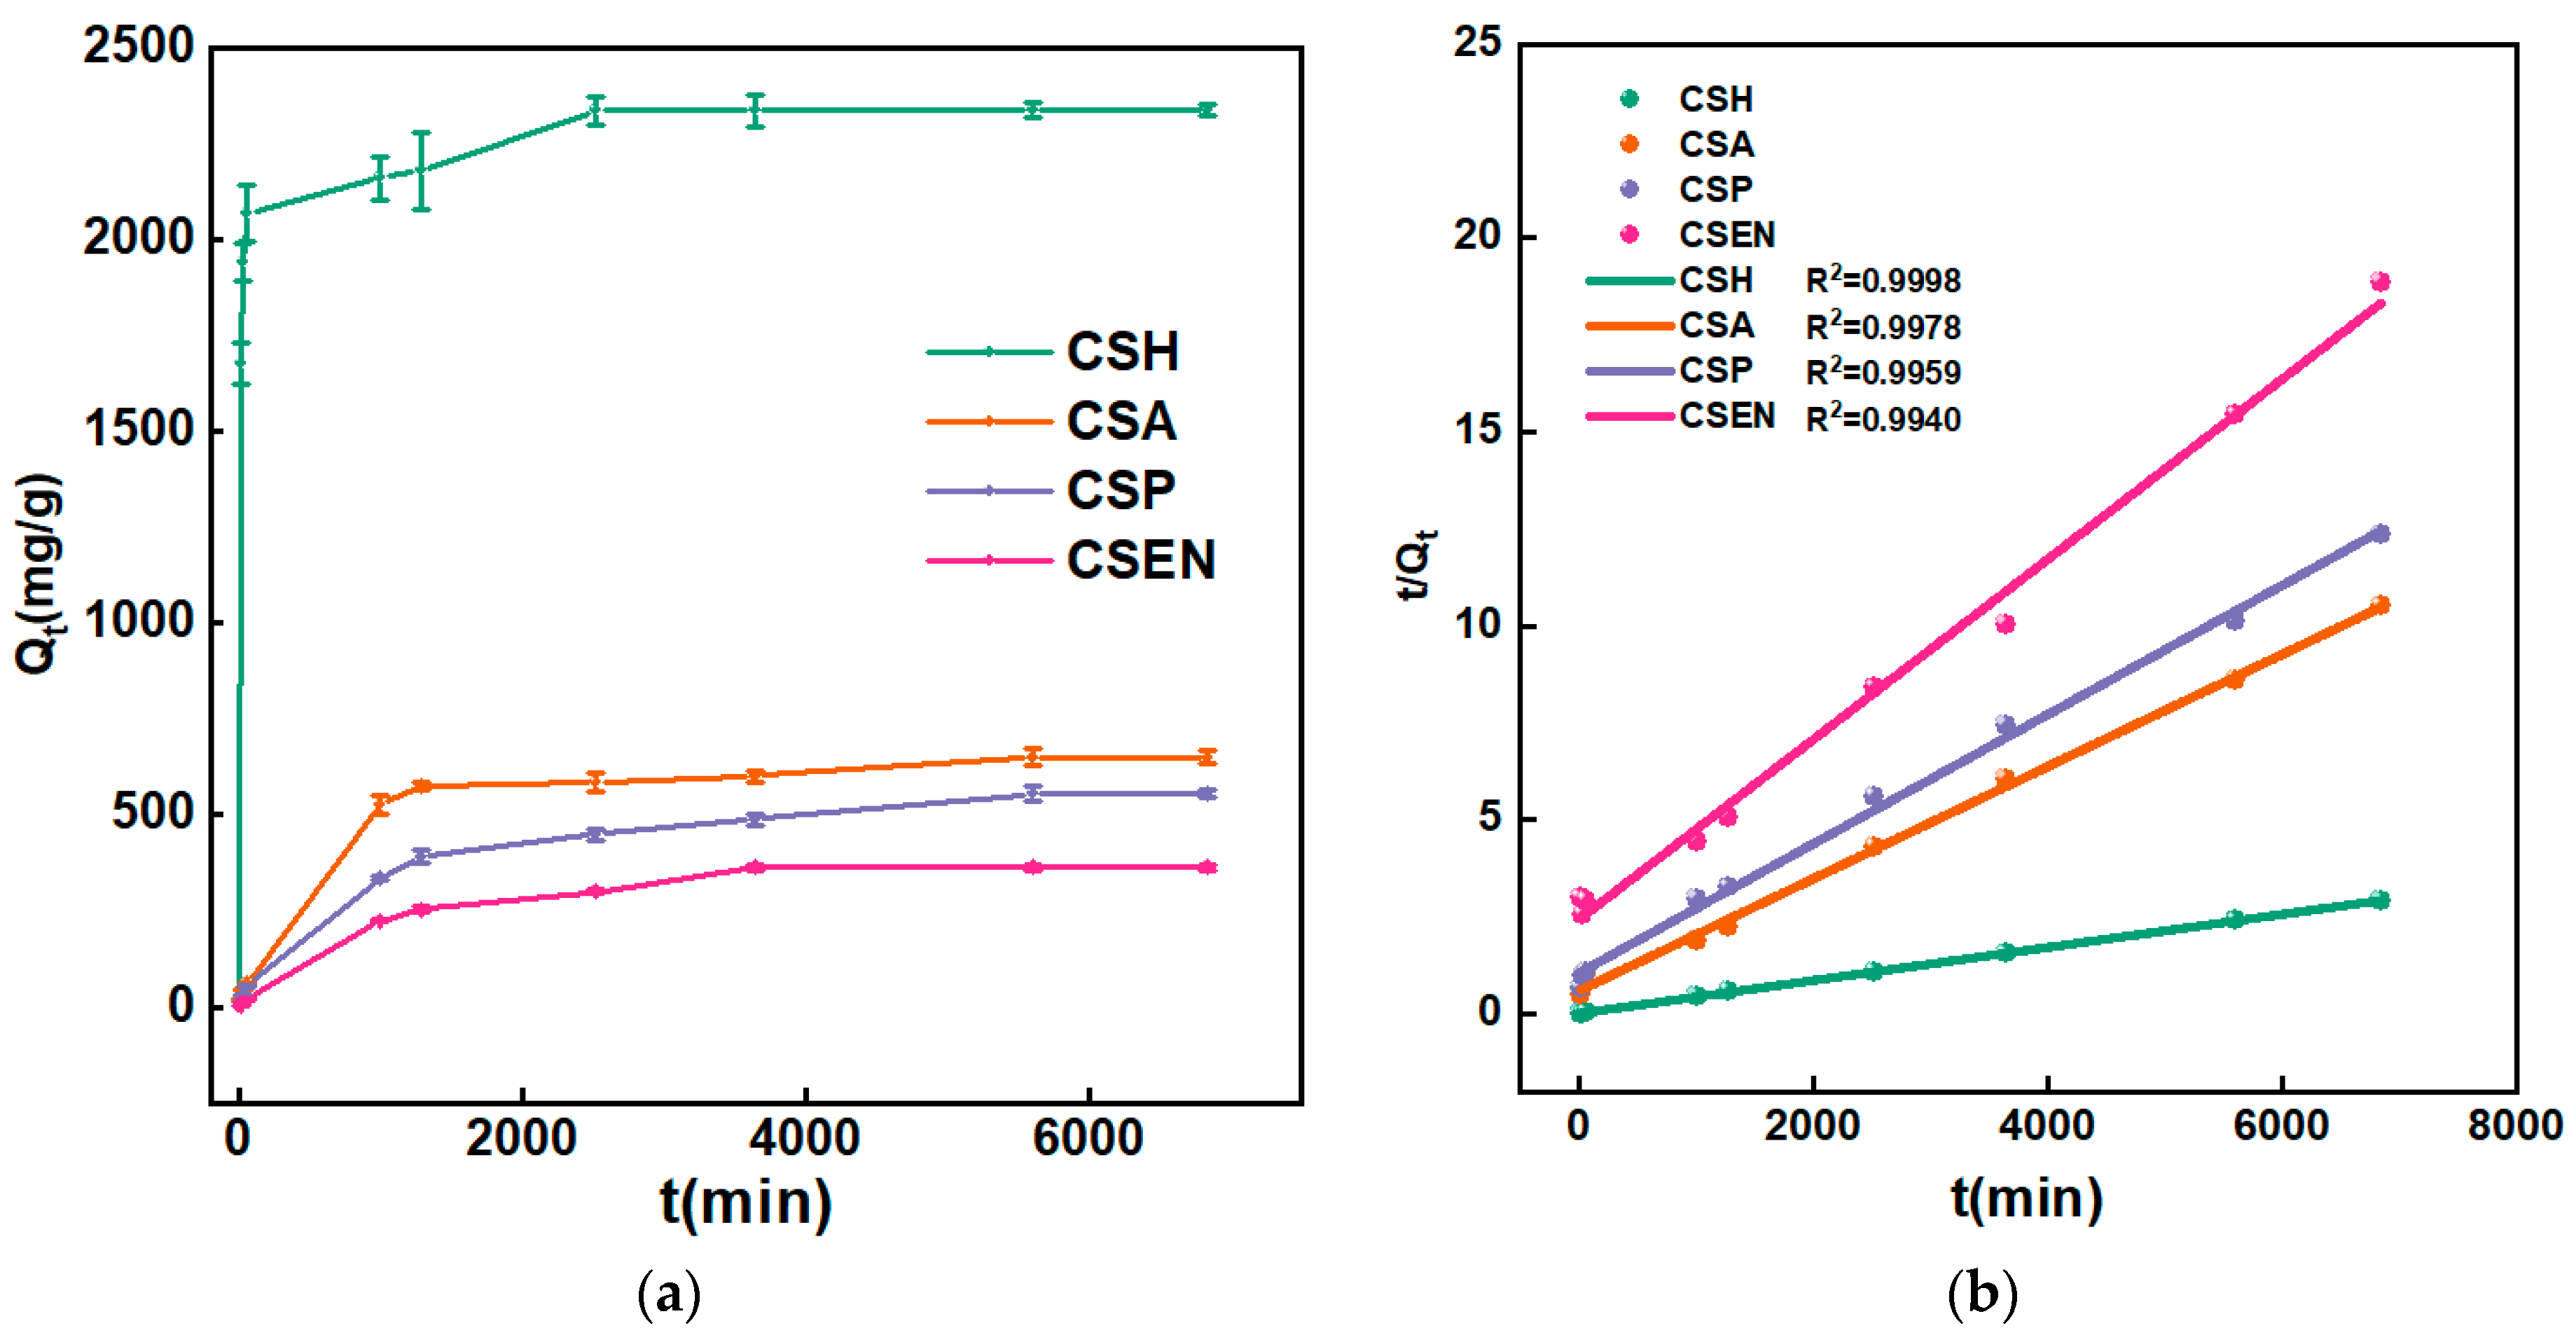
3.5. Adsorption Kinetics Analysis
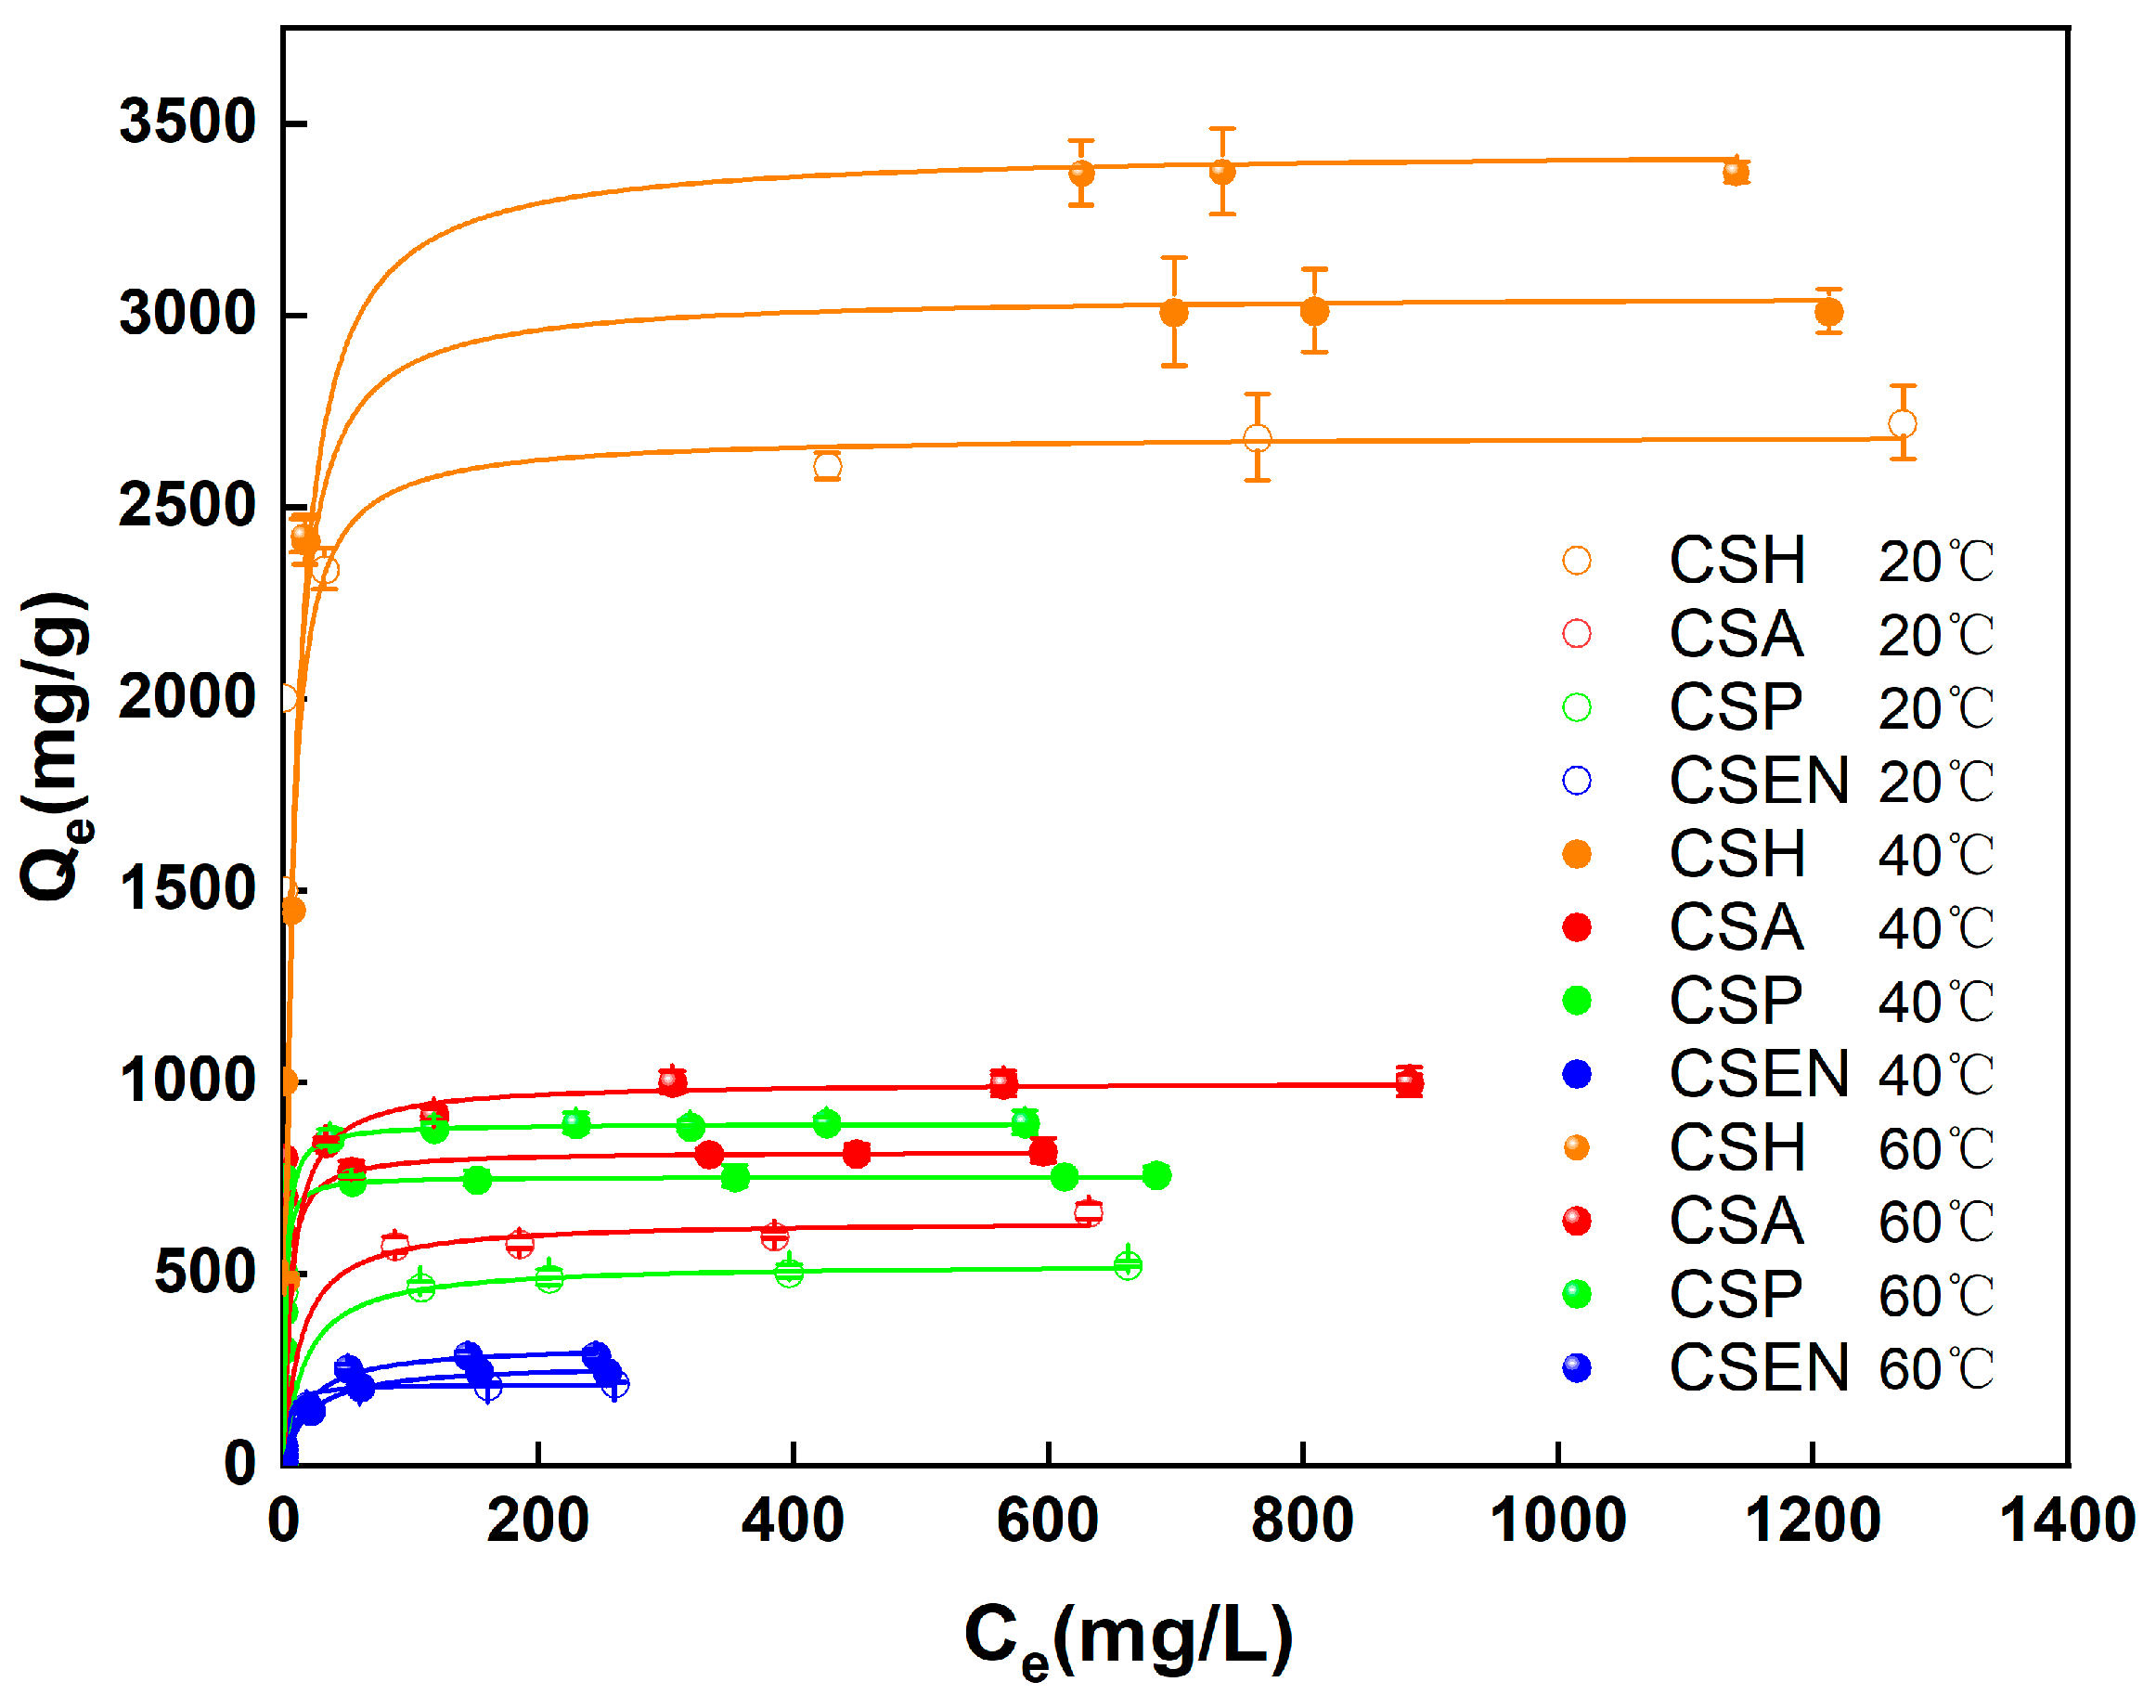
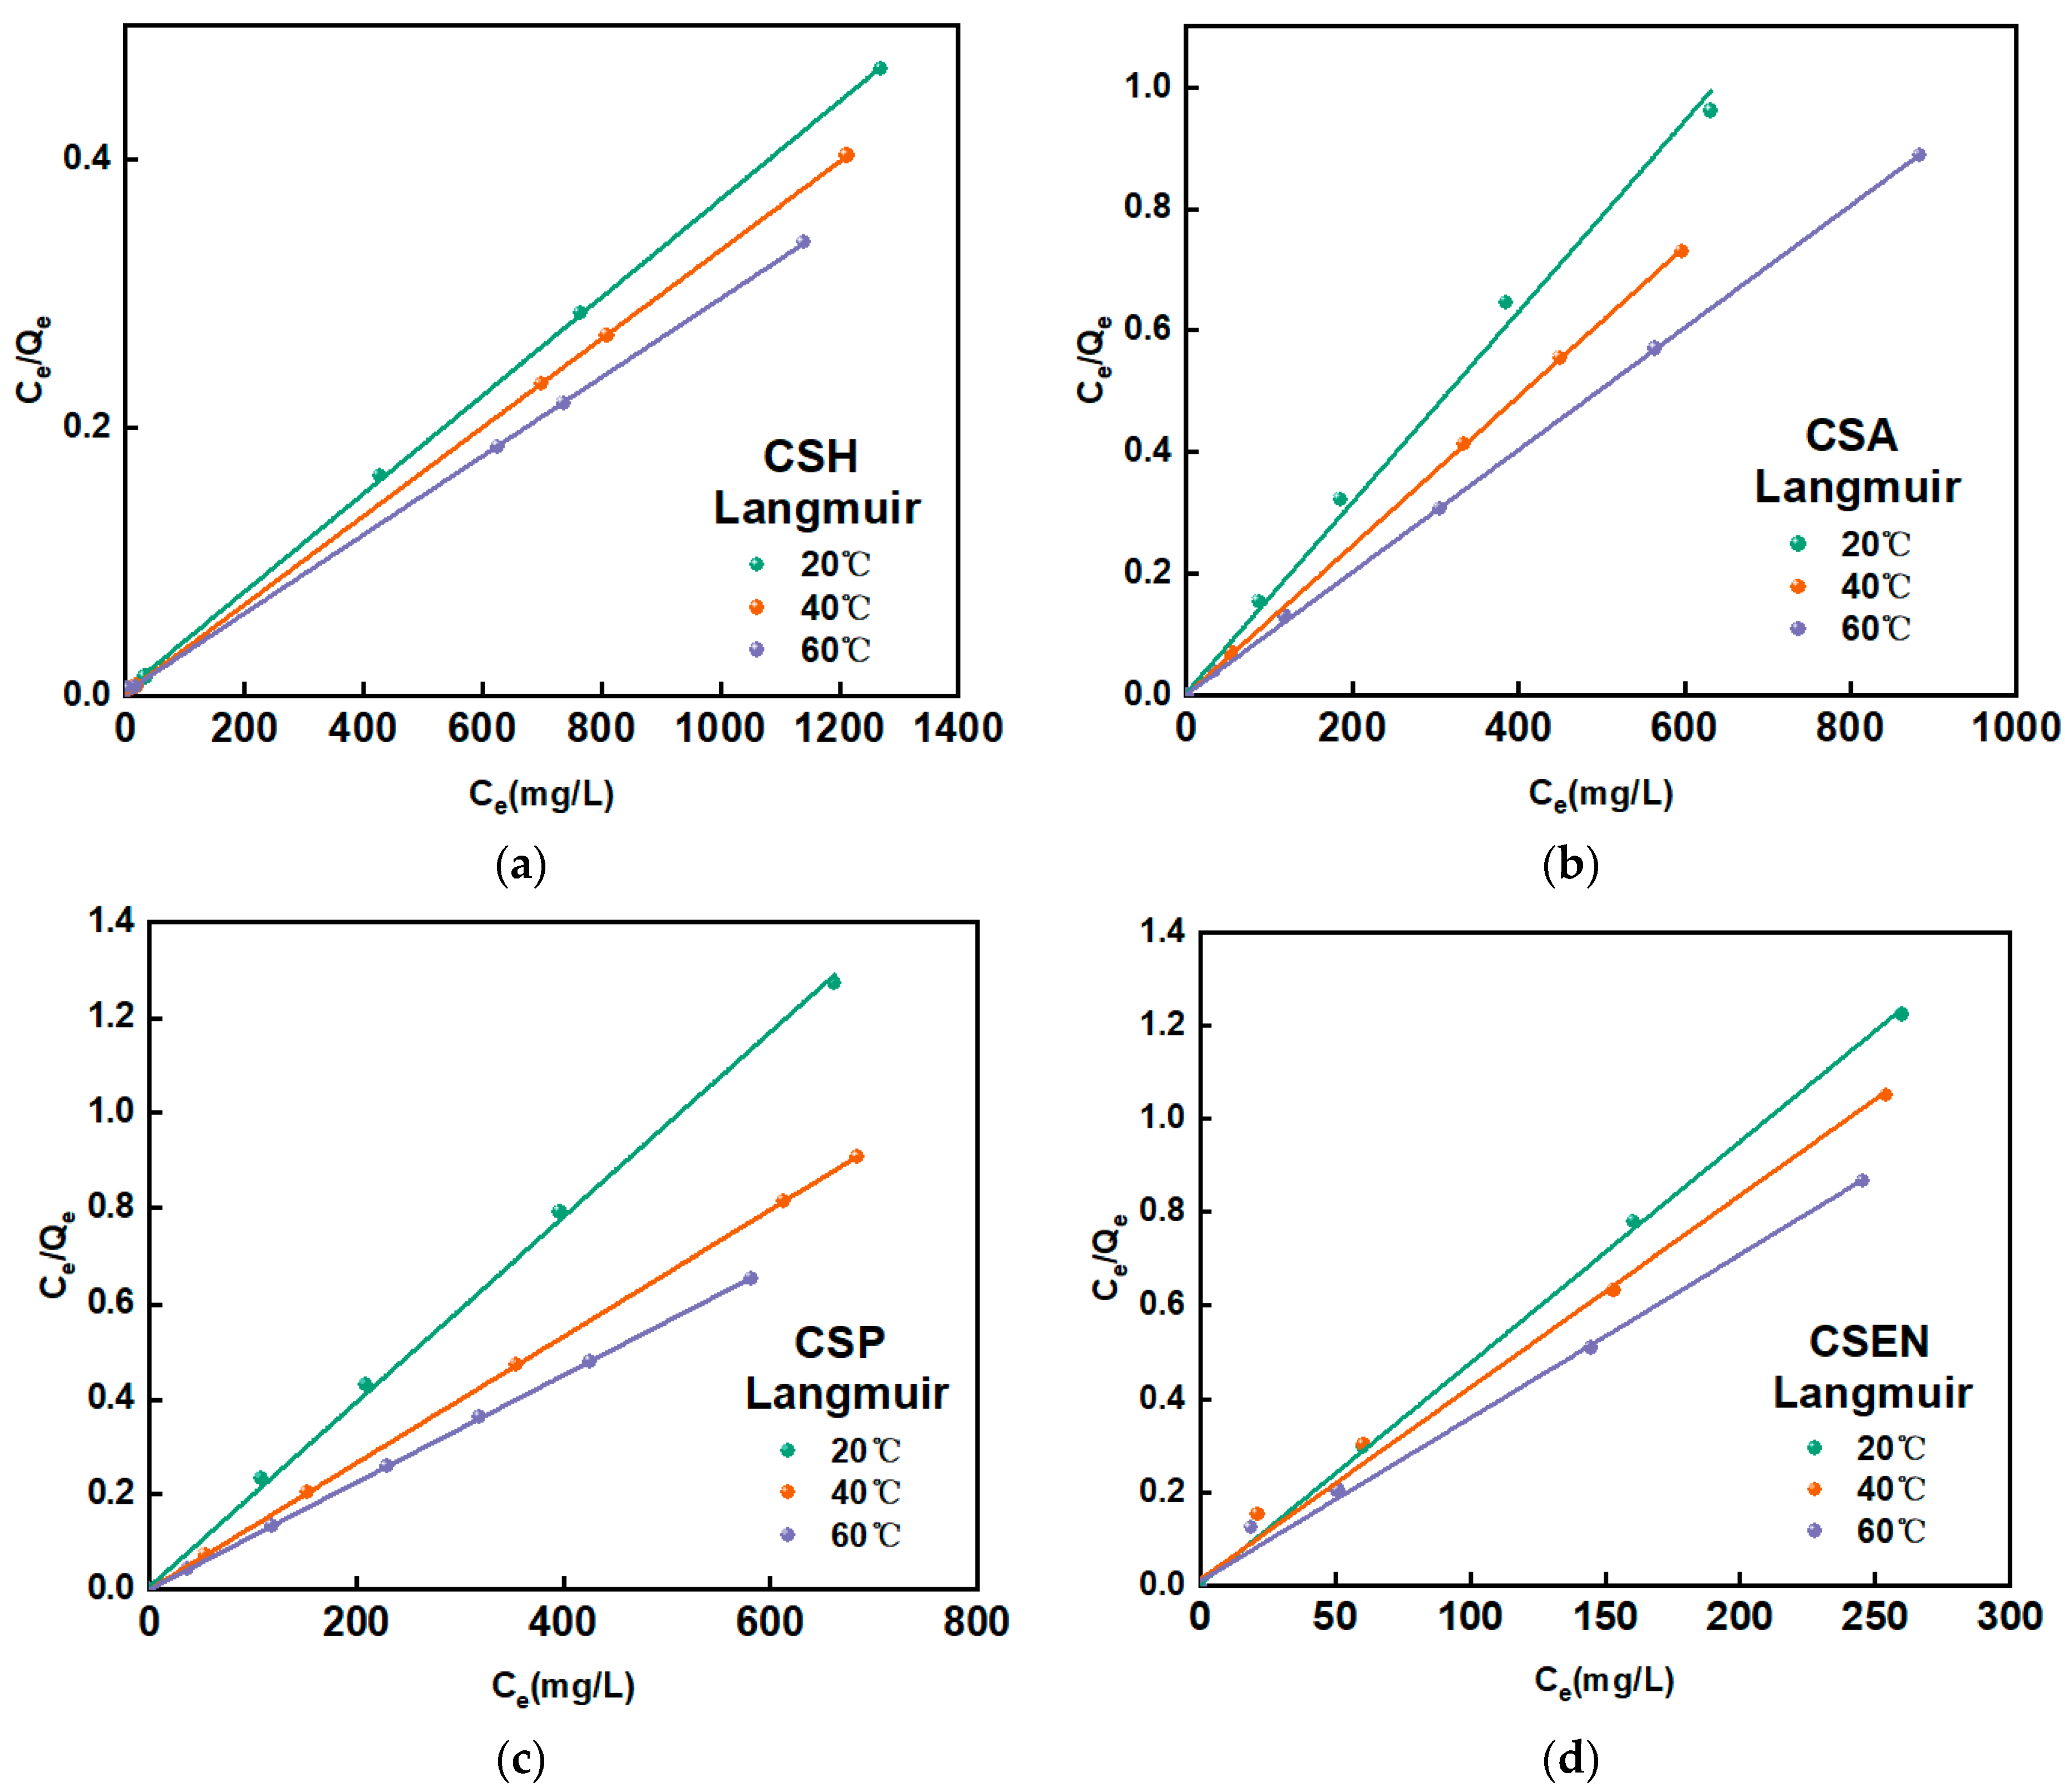
3.6. Adsorption Isotherm Analysis
4. Conclusions
Author Contributions
Funding
Data Availability Statement
Conflicts of Interest
References
- Vandevivere, P.C.; Bianchi, R.; Verstraete, W. Treatment and Reuse of Wastewater from the Textile Wet-Processing Industry: Review of Emerging Technologies. J. Chem. Technol. Biotechnol. 1998, 72, 289–302. [Google Scholar] [CrossRef]
- Fan, L.L.; Zhang, Y.; Luo, C.N.; Lu, F.G.; Qiu, H.M.; Sun, M. Synthesis and characterization of magnetic β-cyclodextrin-chitosan nanoparticles as nano-adsorbents for removal of methyl blue. Int. J. Biol. Macromol. 2012, 50, 444–450. [Google Scholar] [CrossRef] [PubMed]
- Kolya, H.; Kang, C.W. Next-Generation Water Treatment: Exploring the Potential of Biopolymer-Based Nanocomposites in Adsorption and Membrane Filtration. Polymers 2023, 15, 38. [Google Scholar] [CrossRef] [PubMed]
- Zhao, R.; Jin, P.R.; Zhu, J.Y.; Li, Y.; Li, G.C.; Volodine, A.; Liu, Y.Y.; Zheng, J.F.; van der Bruggen, B. Amino acid-based loose polyamide nanofiltration membrane with ultrahigh water permeance for efficient dye/salt separation. J. Membr. Sci. 2023, 673, 11. [Google Scholar] [CrossRef]
- Solanki, Y.S.; Agarwal, M.; Gupta, A.B. Develop an integrating coagulation and RO systems to treat highly turbid water using synthesized coagulants. Water Sci. Technol. 2022, 85, 562–577. [Google Scholar] [CrossRef] [PubMed]
- Thanushree, M.S.; Mahadevappa, M.; Shivaswamy, M.; Mahesh, S.; Premanandasagar, C. Electrochemical treatment of real cotton fabric industry wastewater using copper and stainless steel electrodes. J. Water Sanit. Hyg. Dev. 2023, 13, 197–207. [Google Scholar] [CrossRef]
- Banerjee, P.; DasGupta, S.; De, S. Removal of dye from aqueous solution using a combination of advanced oxidation process and nanofiltration. J. Hazard. Mater. 2007, 140, 95–103. [Google Scholar] [CrossRef]
- Bouabidi, Z.B.; El-Naas, M.H.; Zhang, Z.E. Immobilization of microbial cells for the biotreatment of wastewater: A review. Environ. Chem. Lett. 2019, 17, 241–257. [Google Scholar] [CrossRef]
- Teo, S.H.; Ng, C.H.; Islam, A.; Abdulkareem-Alsultan, G.; Joseph, C.G.; Janaun, J.; Taufiq-Yap, Y.H.; Khandaker, S.; Islam, G.J.; Znad, H.; et al. Sustainable toxic dyes removal with advanced materials for clean water production: A comprehensive review. J. Clean. Prod. 2022, 332, 18. [Google Scholar] [CrossRef]
- Wong, Y.C.; Szeto, Y.S.; Cheung, W.H.; McKay, G. Adsorption of acid dyes on chitosan—Equilibrium isotherm analyses. Process Biochem. 2004, 39, 693–702. [Google Scholar] [CrossRef]
- Dotto, G.L.; Moura, J.M.; Cadaval, T.R.S.; Pinto, L.A.A. Application of chitosan films for the removal of food dyes from aqueous solutions by adsorption. Chem. Eng. J. 2013, 214, 8–16. [Google Scholar] [CrossRef]
- Rego, T.V.; Cadaval, T.R.S., Jr.; Dotto, G.L.; Pinto, L.A.A. Statistical optimization, interaction analysis and desorption studies for the azo dyes adsorption onto chitosan films. J. Colloid Interface Sci. 2013, 411, 27–33. [Google Scholar] [CrossRef] [PubMed]
- Li, C.; Lou, T.; Yan, X.; Long, Y.-z.; Cui, G.; Wang, X. Fabrication of pure chitosan nanofibrous membranes as effective absorbent for dye removal. Int. J. Biol. Macromol. 2018, 106, 768–774. [Google Scholar] [CrossRef] [PubMed]
- Chatterjee, S.; Lee, D.S.; Lee, M.W.; Woo, S.H. Enhanced adsorption of congo red from aqueous solutions by chitosan hydrogel beads impregnated with cetyl trimethyl ammonium bromide. Bioresour. Technol. 2009, 100, 2803–2809. [Google Scholar] [CrossRef] [PubMed]
- Sirvio, J.A.; Visanko, M.; Liimatainen, H. Synthesis of imidazolium-crosslinked chitosan aerogel and its prospect as a dye removing adsorbent. RSC Adv. 2016, 6, 56544–56548. [Google Scholar] [CrossRef]
- Cheung, W.H.; Szeto, Y.S.; McKay, G. Intraparticle diffusion processes during acid dye adsorption onto chitosan. Bioresour. Technol. 2007, 98, 2897–2904. [Google Scholar] [CrossRef] [PubMed]
- Hidayat, E.; Harada, H.; Mitoma, Y.; Yonemura, S.; Halem, H.I. Rapid Removal of Acid Red 88 by Zeolite/Chitosan Hydrogel in Aqueous Solution. Polymers 2022, 14, 893. [Google Scholar] [CrossRef] [PubMed]
- Su, C.; Yang, H.; Zhao, H.; Liu, Y.; Chen, R. Recyclable and biodegradable superhydrophobic and superoleophilic chitosan sponge for the effective removal of oily pollutants from water. Chem. Eng. J. 2017, 330, 423–432. [Google Scholar] [CrossRef]
- Lagergren, S. Zur Theorie der sogenannten Adsorption gelöster Stoffe, Kungliga Svenska Ventenskapsakademiens. Handlingar 1898, 2, 15. [Google Scholar] [CrossRef]
- Ho, Y.S.; McKay, G. Sorption of dye from aqueous solution by peat. Chem. Eng. J. 1998, 2, 115–124. [Google Scholar] [CrossRef]
- Langmuir, I. The adsorption of gases on plane surfaces of glass, mica and platinum. J. Am. Chem. Soc. 1918, 40, 1361–1403. [Google Scholar] [CrossRef]
- Li, D.; Tian, X.; Wang, Z.; Guan, Z.; Li, X.; Qiao, H.; Ke, H.; Luo, L.; Wei, Q. Multifunctional adsorbent based on metal-organic framework modified bacterial cellulose/chitosan composite aerogel for high efficient removal of heavy metal ion and organic pollutant. Chem. Eng. J. 2020, 383, 123127. [Google Scholar] [CrossRef]
- Wang, S.F.; Shen, L.; Zhang, W.D.; Tong, Y.J. Preparation and mechanical properties of chitosan/carbon nanotubes composites. Biomacromolecules 2005, 6, 3067–3072. [Google Scholar] [CrossRef] [PubMed]
- Munim, S.A.; Saddique, M.T.; Raza, Z.A.; Majeed, M.I. Fabrication of cellulose-mediated chitosan adsorbent beads and their surface chemical characterization. Polym. Bull. 2020, 77, 183–196. [Google Scholar] [CrossRef]
- Perez-Nava, A.; Reyes-Mercado, E.; Gonzalez-Campos, J.B. Production of chitosan nanofibers using the HFIP/acetic acid mixture as electrospinning solvent. Chem. Eng. Process.-Process Intensif. 2022, 173, 108849. [Google Scholar] [CrossRef]
- Wang, J.; Shen, L.; Li, H.; Ding, B.; Nie, P.; Dou, H.; Zhang, X. Mesoporous Li4Ti5O12/carbon nanofibers for high-rate lithium-ion batteries. J. Alloys Compd. 2014, 587, 171–176. [Google Scholar] [CrossRef]
- Bhattacharyya, K.G.; Sen Gupta, S. Removal of Cu(II) by natural and acid-activated clays: An insight of adsorption isotherm, kinetic and thermodynamics. Desalination 2011, 272, 66–75. [Google Scholar] [CrossRef]
- Kumari, H.J.; Krishnamoorthy, P.; Arumugam, T.K.; Radhakrishnan, S.; Vasudevan, D. An efficient removal of crystal violet dye from waste water by adsorption onto TLAC/Chitosan composite: A novel low cost adsorbent. Int. J. Biol. Macromol. 2017, 96, 324–333. [Google Scholar] [CrossRef] [PubMed]
- Arora, C.; Soni, S.; Sahu, S.; Mittal, J.; Kumar, P.; Bajpai, P.K. Iron based metal organic framework for efficient removal of methylene blue dye from industrial waste. J. Mol. Liq. 2019, 284, 343–352. [Google Scholar] [CrossRef]
- Subramani, S.E.; Thinakaran, N. Isotherm, kinetic and thermodynamic studies on the adsorption behaviour of textile dyes onto chitosan. Process Saf. Environ. Prot. 2017, 106, 1–10. [Google Scholar] [CrossRef]
- Piron, E.; Domard, A. Interaction between chitosan and uranyl ions. Part 1. Role of physicochemical parameters. Int. J. Biol. Macromol. 1997, 21, 327–335. [Google Scholar] [CrossRef] [PubMed]
- Zhou, D.; Zhang, L.; Guo, S.L. Mechanisms of lead biosorption on cellulose/chitin beads. Water Res. 2005, 39, 3755–3762. [Google Scholar] [CrossRef] [PubMed]
- Sannino, A.; Pappadà, S.; Madaghiele, M.; Maffezzoli, A.; Ambrosio, L.; Nicolais, L. Crosslinking of cellulose derivatives and hyaluronic acid with water-soluble carbodiimide. Polymer 2005, 46, 11206–11212. [Google Scholar] [CrossRef]
- Yoshida, H.; Okamoto, A.; Kataoka, T. Adsorption of acid dye on cross-linked chitosan fibers: Equilibria. Chem. Eng. Sci. 1993, 48, 2267–2272. [Google Scholar] [CrossRef]
- Kayranli, B. Adsorption of textile dyes onto iron based waterworks sludge from aqueous solution; isotherm, kinetic and thermodynamic study. Chem. Eng. J. 2011, 173, 782–791. [Google Scholar] [CrossRef]
- Chiou, M.S.; Li, H.Y. Equilibrium and kinetic modeling of adsorption of reactive dye on cross-linked chitosan beads. J. Hazard. Mater. 2002, 93, 233–248. [Google Scholar] [CrossRef]
- Al-Zawahreh, K.; Barral, M.T.; Al-Degs, Y.; Paradelo, R. Comparison of the sorption capacity of basic, acid, direct and reactive dyes by compost in batch conditions. J. Environ. Manag. 2021, 294, 113005. [Google Scholar] [CrossRef] [PubMed]
- Guerrero-Coronilla, I.; Morales-Barrera, L.; Cristiani-Urbina, E. Kinetic, isotherm and thermodynamic studies of amaranth dye biosorption from aqueous solution onto water hyacinth leaves. J. Environ. Manag. 2015, 152, 99–108. [Google Scholar] [CrossRef] [PubMed]
- Salem, A.E.-N.M.; Ahmed, M.A.; El-shahat, M.F. Selective adsorption of amaranth dye on Fe3O4/MgO nanoparticles. J. Mol. Liq. 2016, 219, 780–788. [Google Scholar] [CrossRef]
- Abdellaoui, K.; Pavlovic, I.; Bouhent, M.; Benhamou, A.; Barriga, C. A comparative study of the amaranth azo dye adsorption/desorption from aqueous solutions by layered double hydroxides. Appl. Clay Sci. 2017, 143, 142–150. [Google Scholar] [CrossRef]
- Yusof, N.H.; Foo, K.Y.; Wilson, L.D.; Hameed, B.H.; Hazwan Hussin, M.; Sabar, S. Microwave-Assisted Synthesis of Polyethyleneimine Grafted Chitosan Beads for the Adsorption of Acid Red 27. J. Polym. Environ. 2020, 28, 542–552. [Google Scholar] [CrossRef]


| Adsorbent | Specific Surface Area (m2/g) | Pore Volume (cc/g) | Pore Diameter (nm) |
|---|---|---|---|
| CSH | 74.6 | 0.62 | 11.34 |
| CSA | 9.6 | 0.02 | 3.5 |
| CSP | 2.2 | 0.01 | 3.3 |
| CSEN | 32.4 | 0.17 | 3.0 |
| Adsorbent | PFO | PSO | ||||
|---|---|---|---|---|---|---|
| κ1 (min−1) | Qe (mg/g) | R12 | κ2 (mg/g/min) | Qe (mg/g) | R22 | |
| CSH | 1.22 × 10⁻² | 680.6 | 0.5016 | 1.32 × 10⁻⁵ | 2346.9 | 0.9998 |
| CSA | 7.66 × 10⁻³ | 551.0 | 0.8190 | 3.50 × 10⁻⁶ | 689.7 | 0.9978 |
| CSP | 5.92 × 10⁻⁴ | 540.4 | 0.9548 | 2.59 × 10⁻⁶ | 602.4 | 0.9959 |
| CSEN | 7.42 × 10⁻⁴ | 221.7 | 0.9656 | 2.18 × 10⁻⁶ | 431.0 | 0.9940 |
| Adsorbent | T (°C) | Langmuir Isotherm | Freundlich Isotherm | ||||
|---|---|---|---|---|---|---|---|
| Qmax (mg/g) | b | RL2 | Kf (mg/g) | 1/n | RF2 | ||
| CSH | 20 | 2732.2 | 0.005 | 0.9999 | 2.255 | 0.029 | 0.9981 |
| 40 | 3030.3 | 0.002 | 0.9999 | 2.069 | 0.135 | 0.9864 | |
| 60 | 3413.0 | 0.003 | 0.9999 | 2.258 | 0.085 | 0.9841 | |
| CSA | 20 | 675.7 | 0.042 | 0.9954 | 2.534 | 0.065 | 0.7729 |
| 40 | 819.7 | 0.006 | 0.9999 | 2.852 | 0.009 | 0.9928 | |
| 60 | 1005.0 | 0.008 | 0.9999 | 2.907 | 0.016 | 0.9128 | |
| CSP | 20 | 534.8 | 0.038 | 0.9997 | 2.618 | 0.066 | 0.9932 |
| 40 | 757.6 | 0.003 | 0.9999 | 2.838 | 0.027 | 0.9772 | |
| 60 | 892.9 | 0.002 | 0.9999 | 2.844 | 0.056 | 0.8725 | |
| CSEN | 20 | 215.5 | 0.023 | 0.9995 | 3.305 | 0.042 | 0.8463 |
| 40 | 260.4 | 0.064 | 0.9988 | 3.314 | 0.056 | 0.8719 | |
| 60 | 303.0 | 0.046 | 0.9981 | 3.288 | 0.082 | 0.8830 | |
| Adsorbent (Deacetylation Degree) | Dye | Qmax (mmol/g) | NAG * (mmol/g) | Reference |
|---|---|---|---|---|
| CSH (70%) | AR 27(85% purity) | 4.523 | 4.343 | This study |
| CSA (70%) | 1.119 | |||
| CSP (70%) | 0.885 | |||
| CSEN (70%) | 0.357 | |||
| Chitosan powder (53%) | Acid Green 25 | 0.945 | 3.289 | [10] |
| Acid Orange 10 | 2.040 | |||
| Acid Orange 12 | 2.778 | |||
| Acid Orange 18 | 1.147 | |||
| Acid Red 73 | 1.309 | |||
| Chitosan film (85 ± 1%) | Acid Red 18 | 0.322 | 5.274 | [11] |
| Chitosan film (85 ± 1%) | Tartrazine | 0.774 | 5.274 | [12] |
| Amaranth | 0.460 | |||
| Chitosan nanofibrous membrane (≥95%) | Acid Blue 113 | 1.963 | 5.894 | [13] |
| Chitosan beads(cross-linked) (85.5%) | Reactive Red 189 | 1.704 | 5.305 | [36] |
| Chitosan beads(non-cross-linked) (85.5%) | 1.046 | |||
| Composted pine bark | AR 27 | 0.007 | - | [37] |
| Municipal solid waste compost | 0.117 | |||
| Water hyacinth leaves | 0.117 | [38] | ||
| Fe3O4/MgO/ nanoparticles | 0.063 | [39] | ||
| MgAlCO3 | 0.200 | [40] | ||
| CS-PEI-GLA | 0.080 | [41] |
Disclaimer/Publisher’s Note: The statements, opinions and data contained in all publications are solely those of the individual author(s) and contributor(s) and not of MDPI and/or the editor(s). MDPI and/or the editor(s) disclaim responsibility for any injury to people or property resulting from any ideas, methods, instructions or products referred to in the content. |
© 2024 by the authors. Licensee MDPI, Basel, Switzerland. This article is an open access article distributed under the terms and conditions of the Creative Commons Attribution (CC BY) license (https://creativecommons.org/licenses/by/4.0/).
Share and Cite
Wu, H.; Zhou, J.; Zhang, S.; Niu, P.; Li, H.; Liu, Z.; Zhang, N.; Li, C.; Wang, L.; Wang, Y. A Comparative Study of Removal of Acid Red 27 by Adsorption on Four Different Chitosan Morphologies. Polymers 2024, 16, 1019. https://doi.org/10.3390/polym16071019
Wu H, Zhou J, Zhang S, Niu P, Li H, Liu Z, Zhang N, Li C, Wang L, Wang Y. A Comparative Study of Removal of Acid Red 27 by Adsorption on Four Different Chitosan Morphologies. Polymers. 2024; 16(7):1019. https://doi.org/10.3390/polym16071019
Chicago/Turabian StyleWu, Hongli, Jiaying Zhou, Sai Zhang, Ping Niu, Haoming Li, Zhongmin Liu, Ning Zhang, Chunhui Li, Liping Wang, and Yudong Wang. 2024. "A Comparative Study of Removal of Acid Red 27 by Adsorption on Four Different Chitosan Morphologies" Polymers 16, no. 7: 1019. https://doi.org/10.3390/polym16071019
APA StyleWu, H., Zhou, J., Zhang, S., Niu, P., Li, H., Liu, Z., Zhang, N., Li, C., Wang, L., & Wang, Y. (2024). A Comparative Study of Removal of Acid Red 27 by Adsorption on Four Different Chitosan Morphologies. Polymers, 16(7), 1019. https://doi.org/10.3390/polym16071019