
Thermal Properties’ Enhancement of PLA-Starch-Based Polymer Composite Using Sucrose

 ,
,  , ,
, ,  , ,
, ,  and
and 
Abstract
1. Introduction
2. Materials and Methods
2.1. Materials
2.2. Biocomposite Preparation
2.2.1. Starch–Glycerol–Sucrose Blend
2.2.2. PLA-TPS Blend
2.3. Thermal Properties’ Analysis
2.4. Water Vapor Transmission Rate (WVTR)
2.5. Mechanical Strength
2.6. FTIR Analysis
2.7. Crystallinity
2.8. Morphology Analysis
2.9. Biodegradability Analysis
3. Results
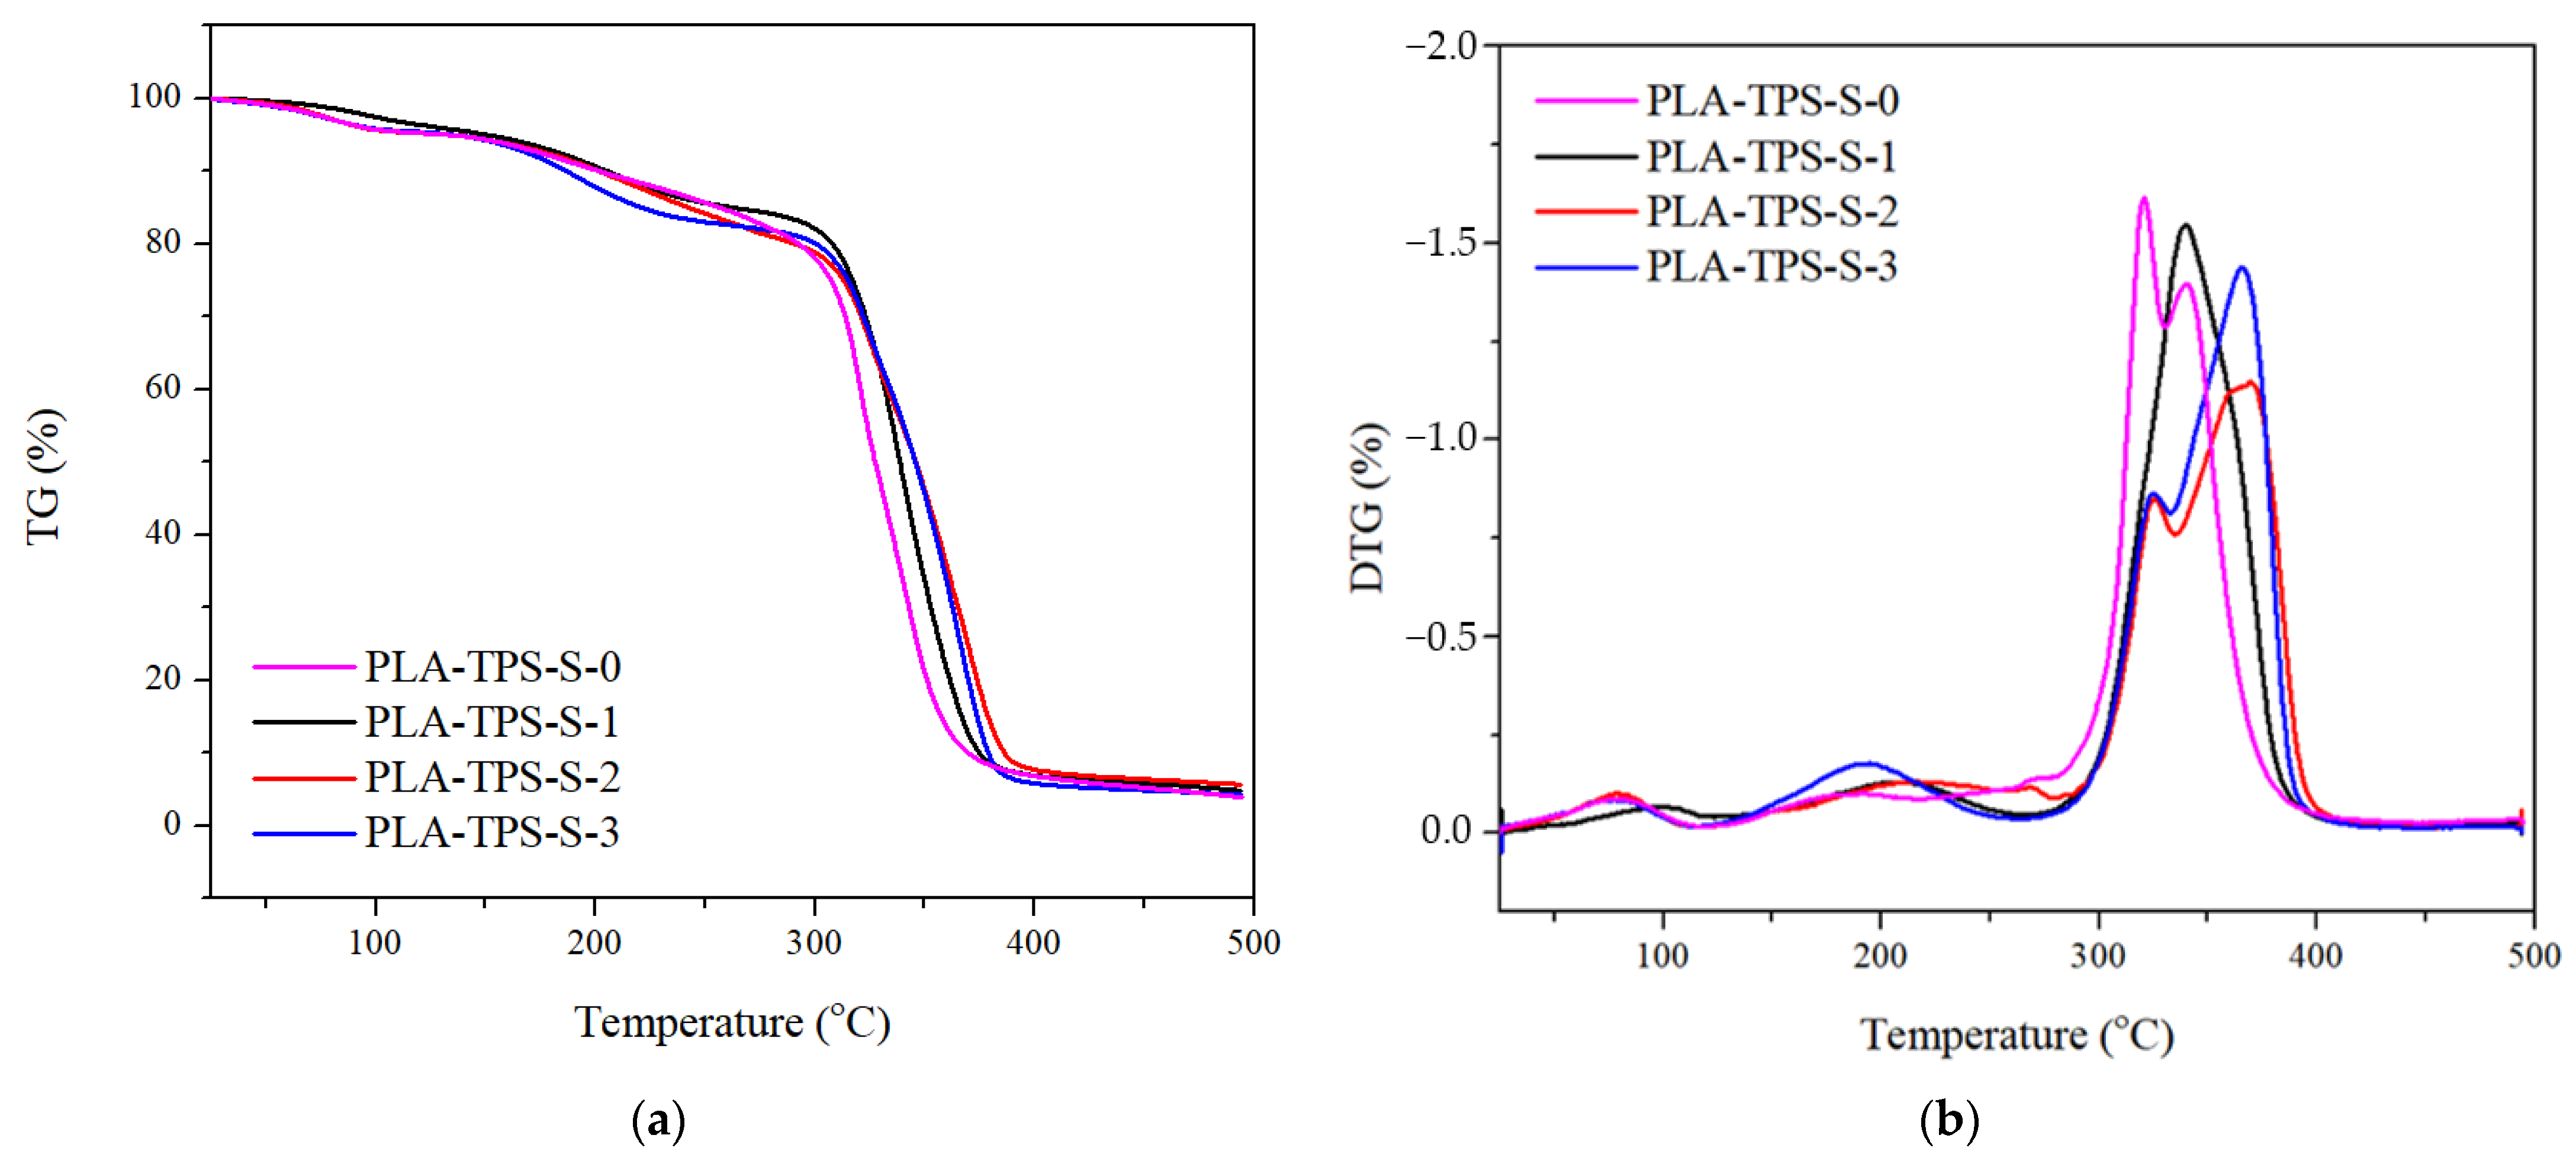
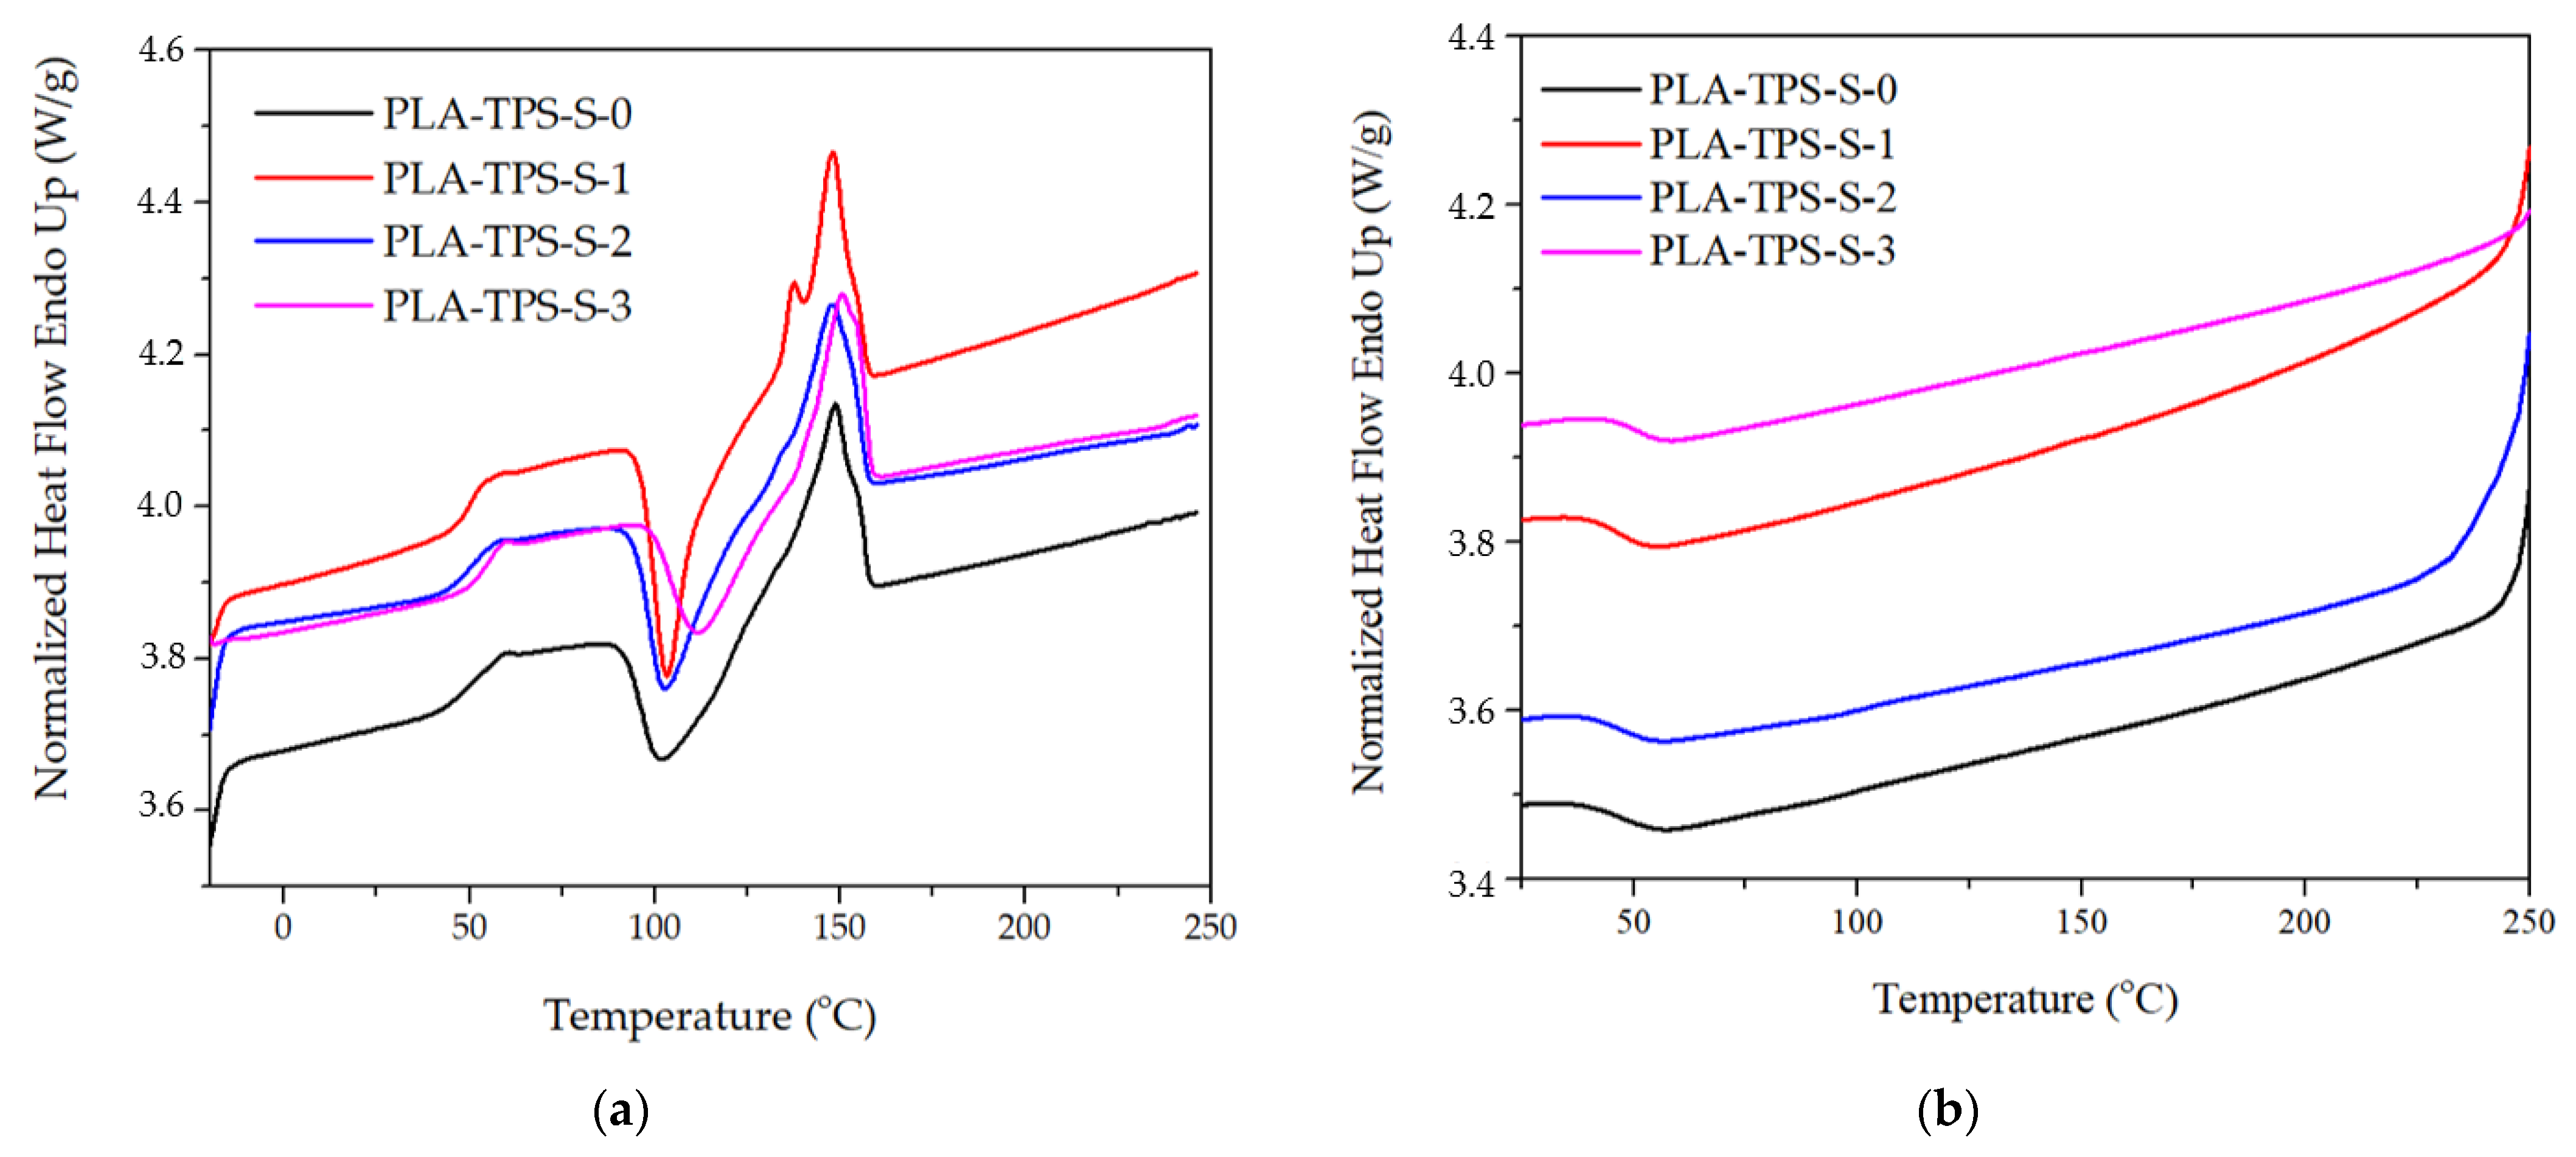
3.1. Thermal Properties
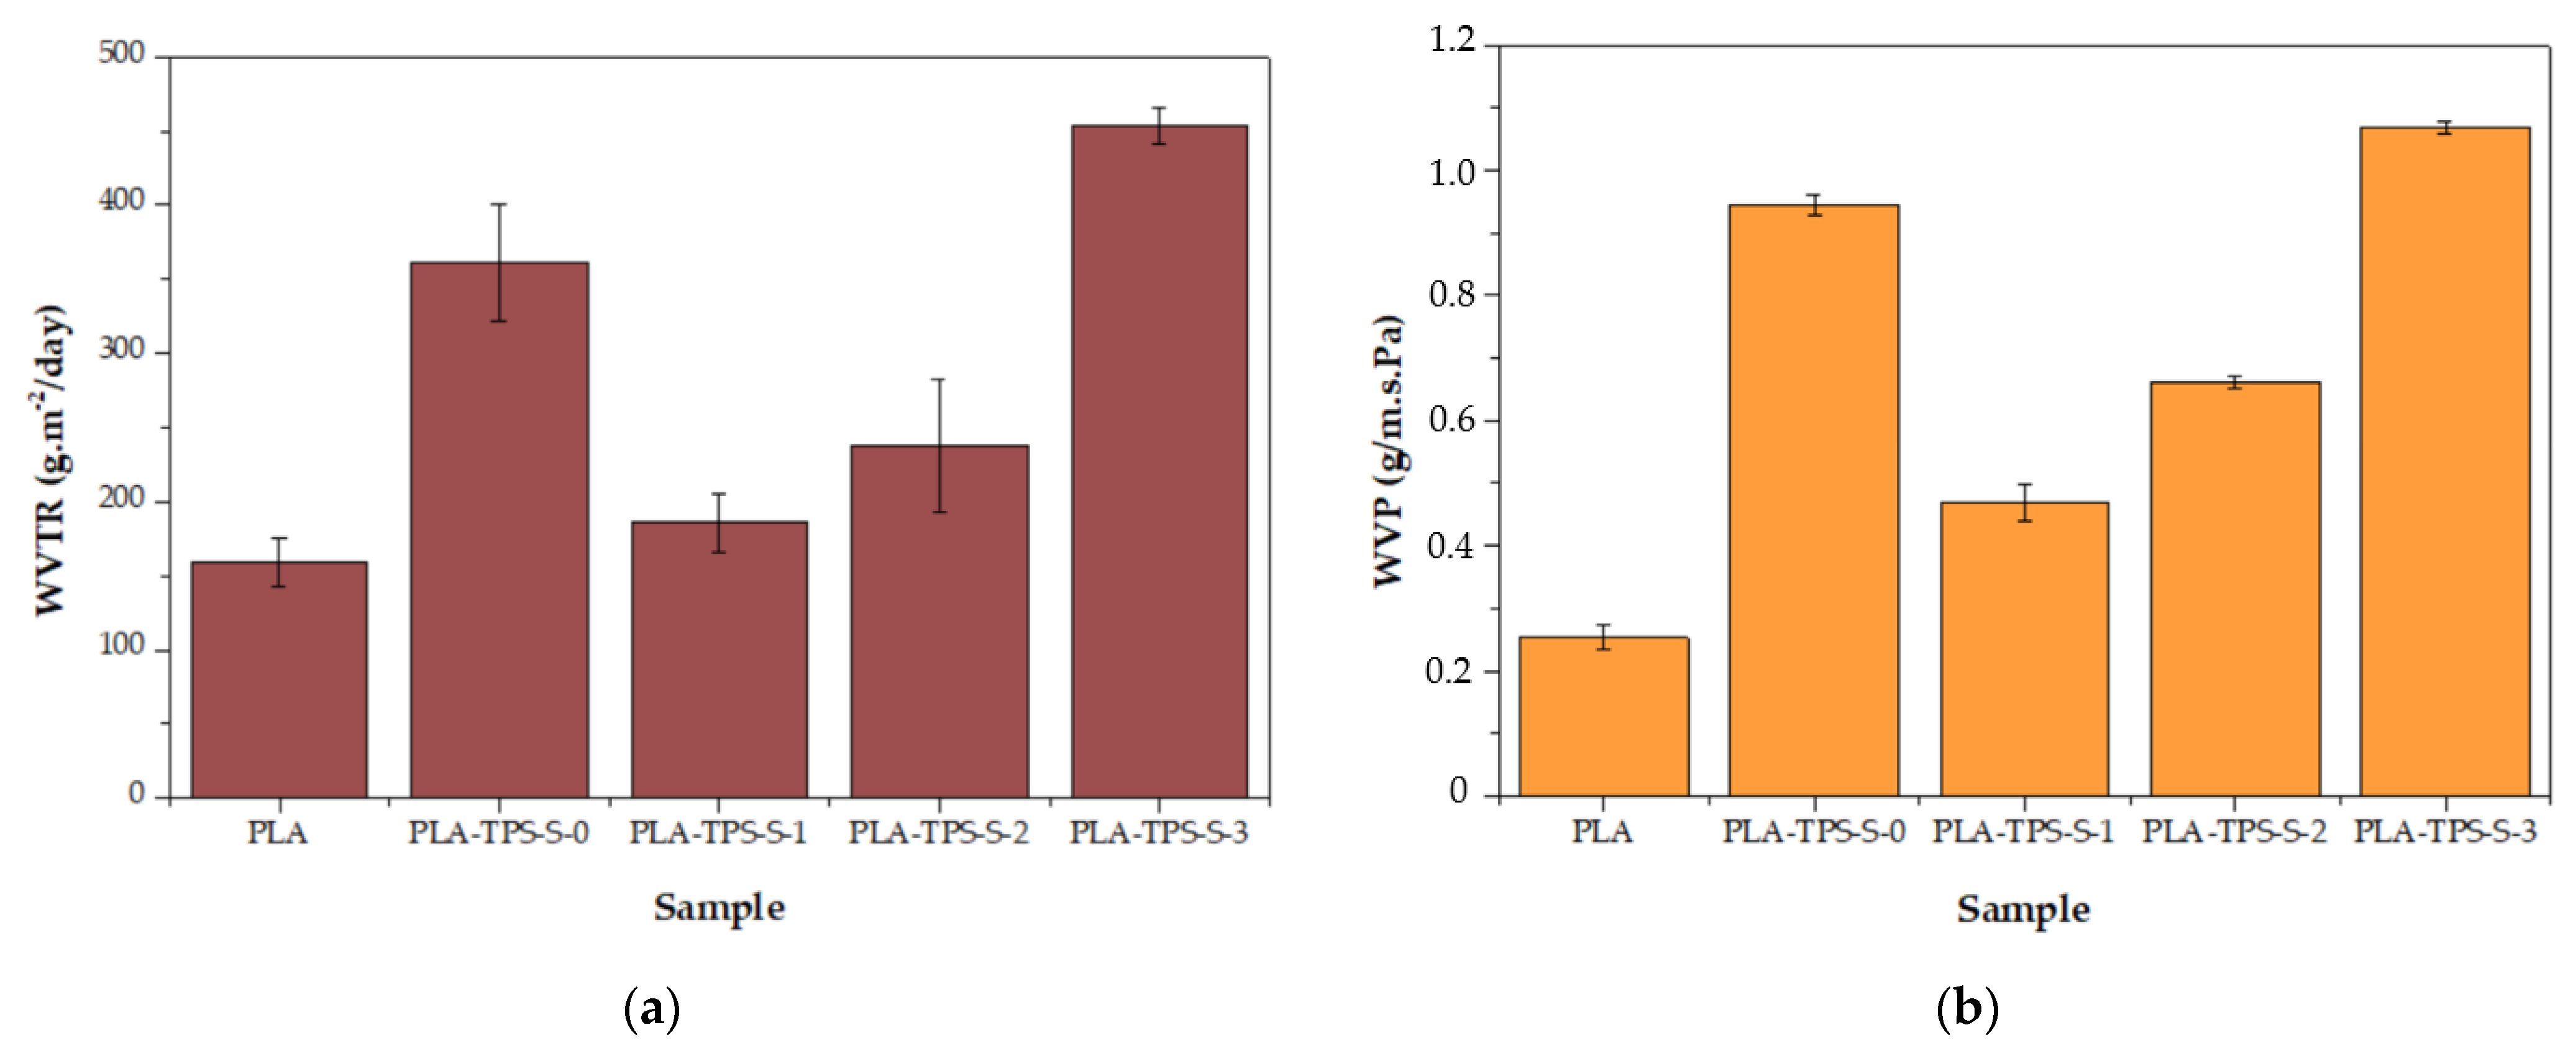
3.2. WVTR Characteristics
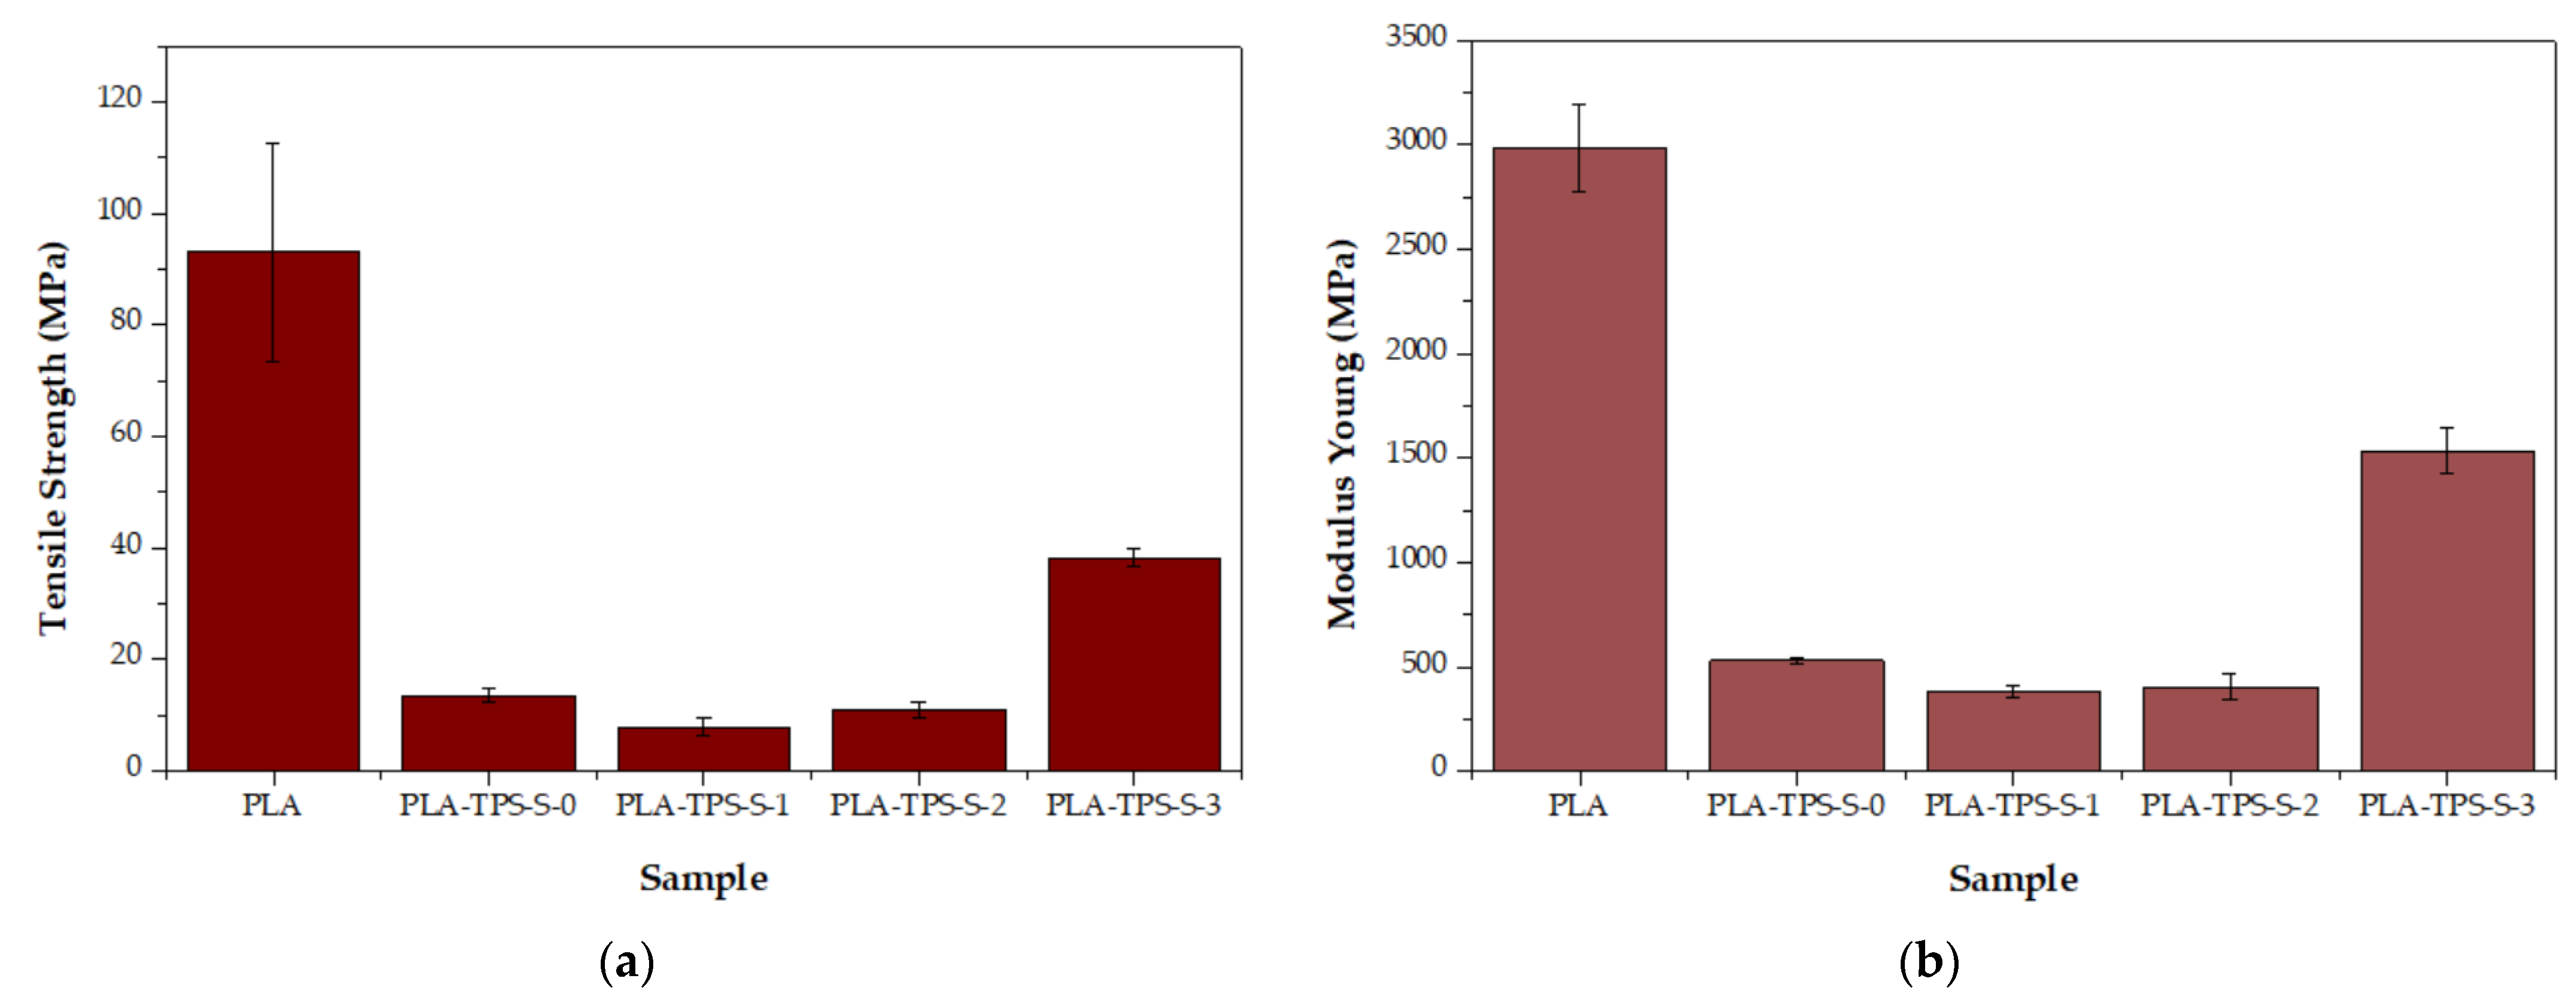
3.3. Mechanical Characteristics
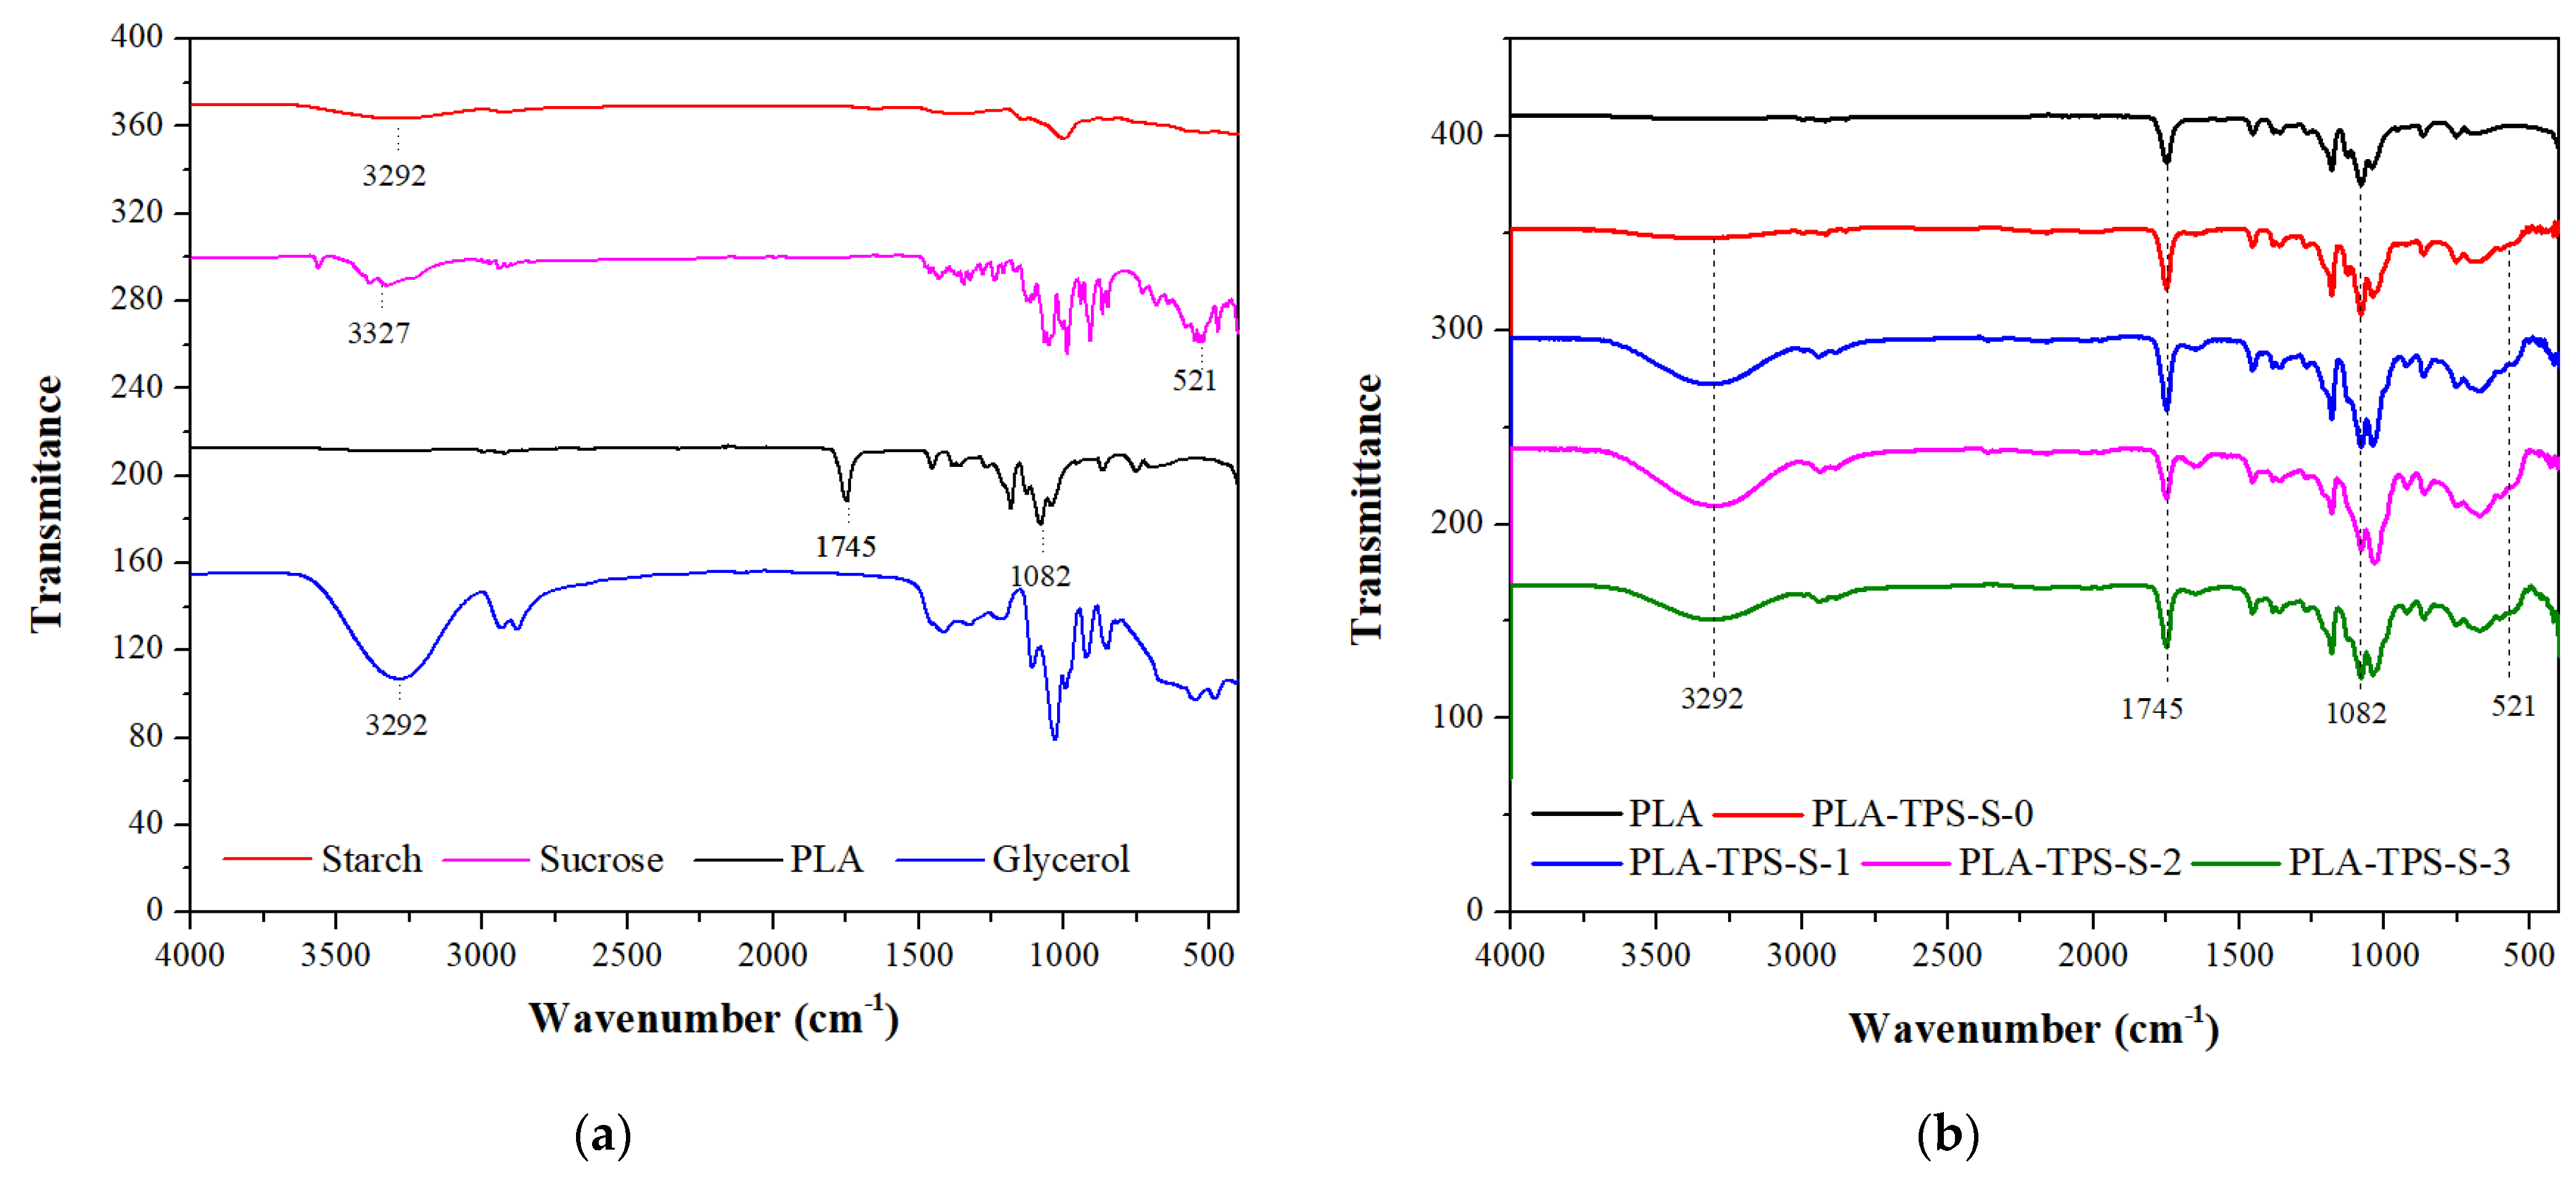
3.4. FTIR Spectra
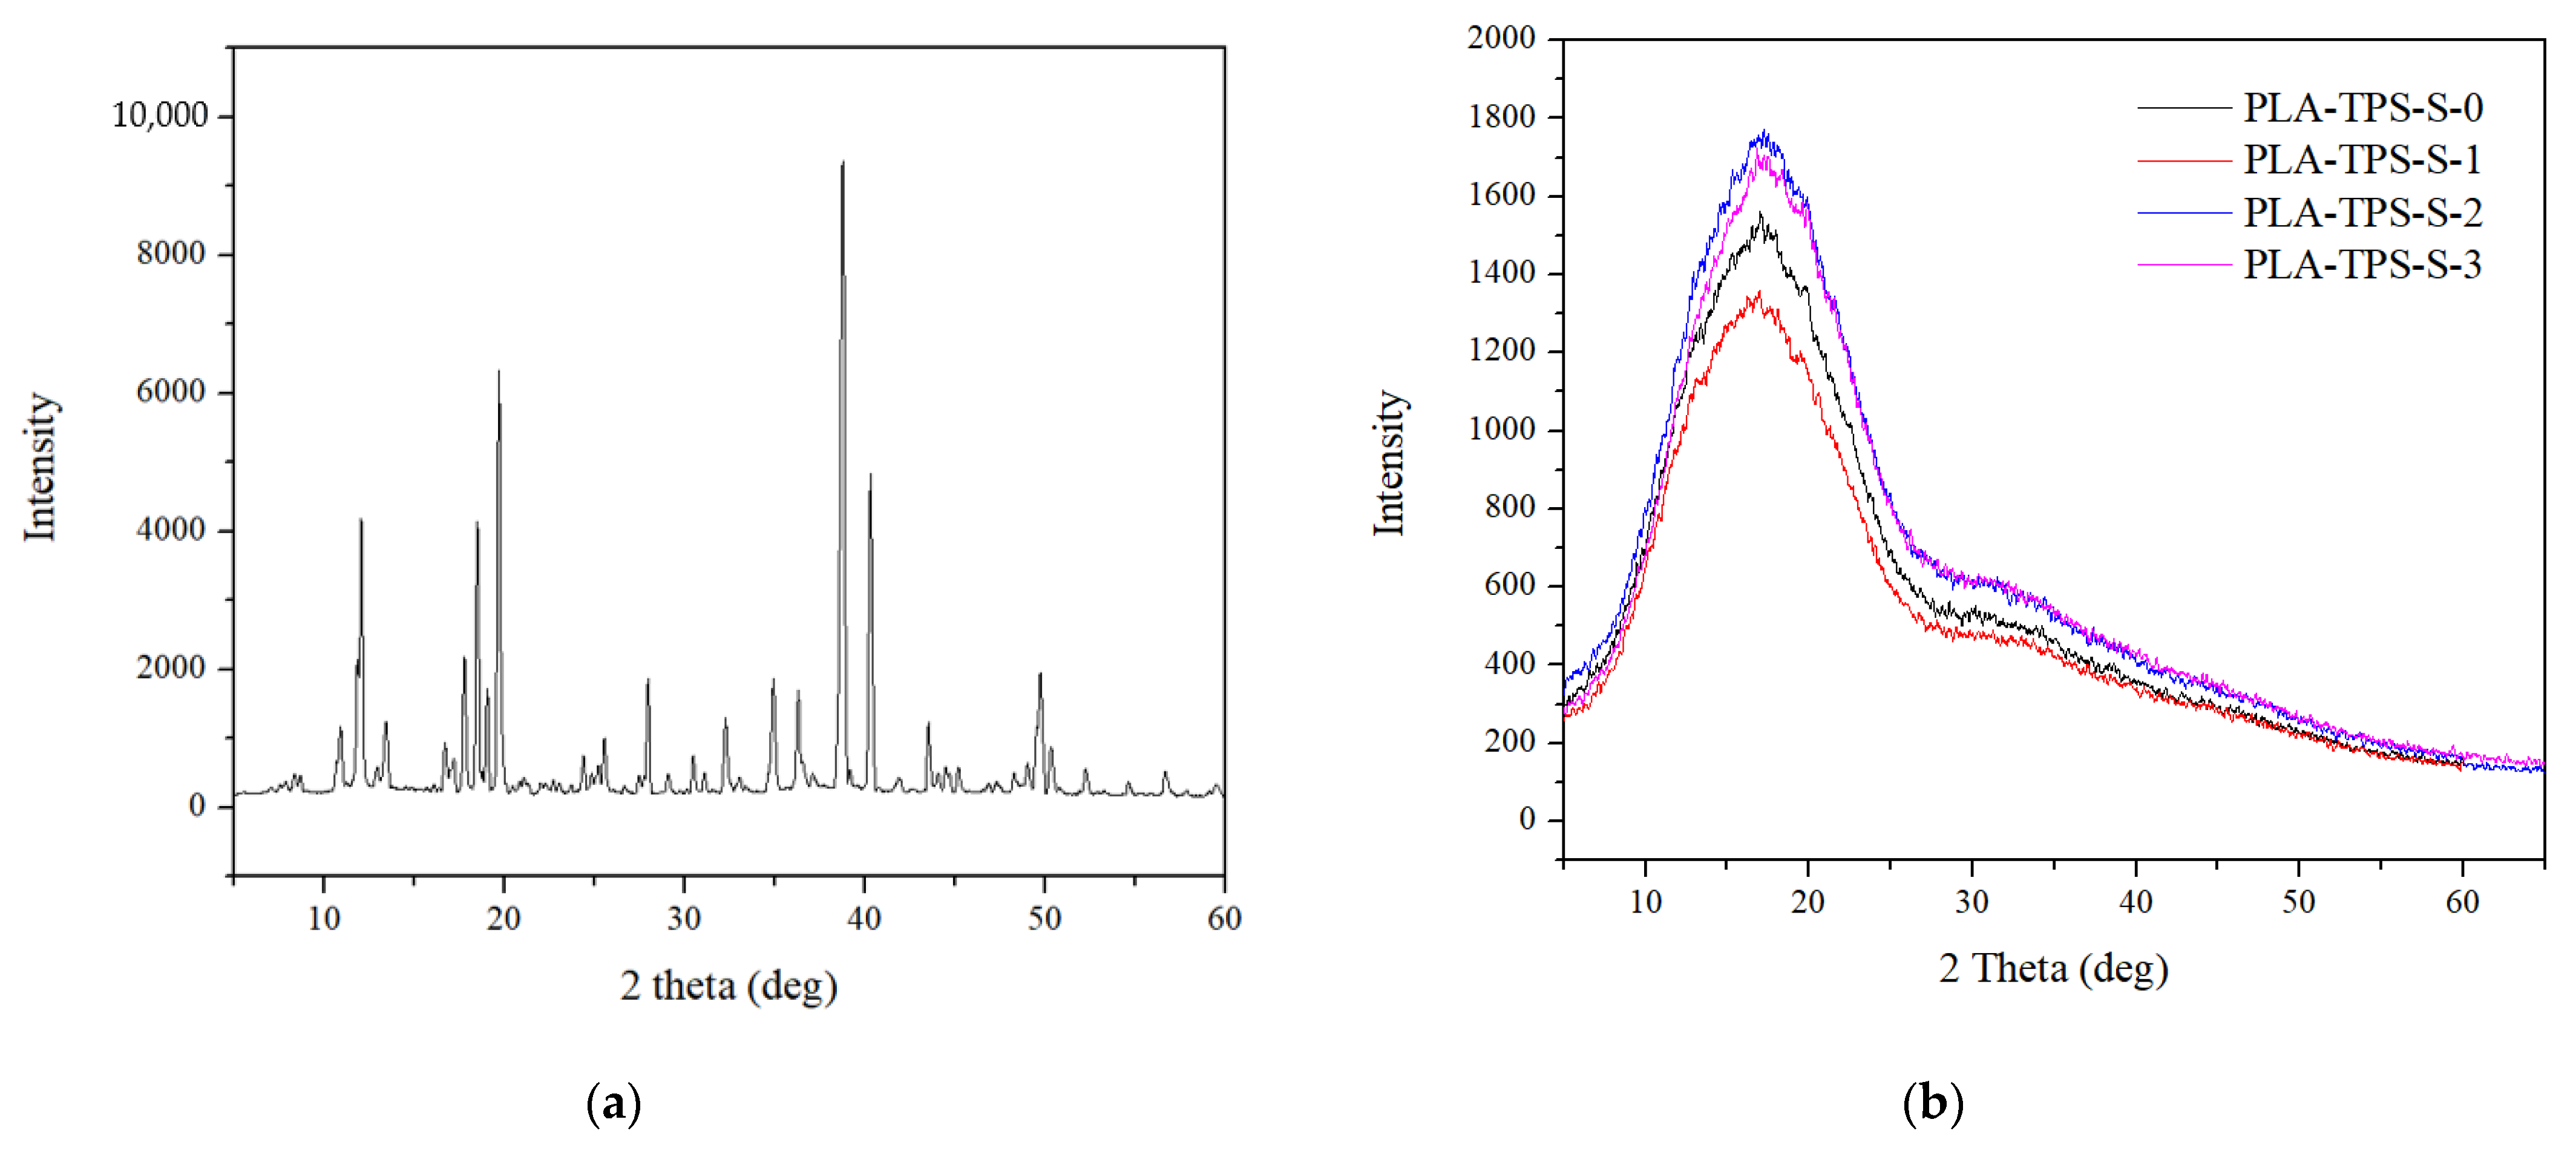
3.5. XRD

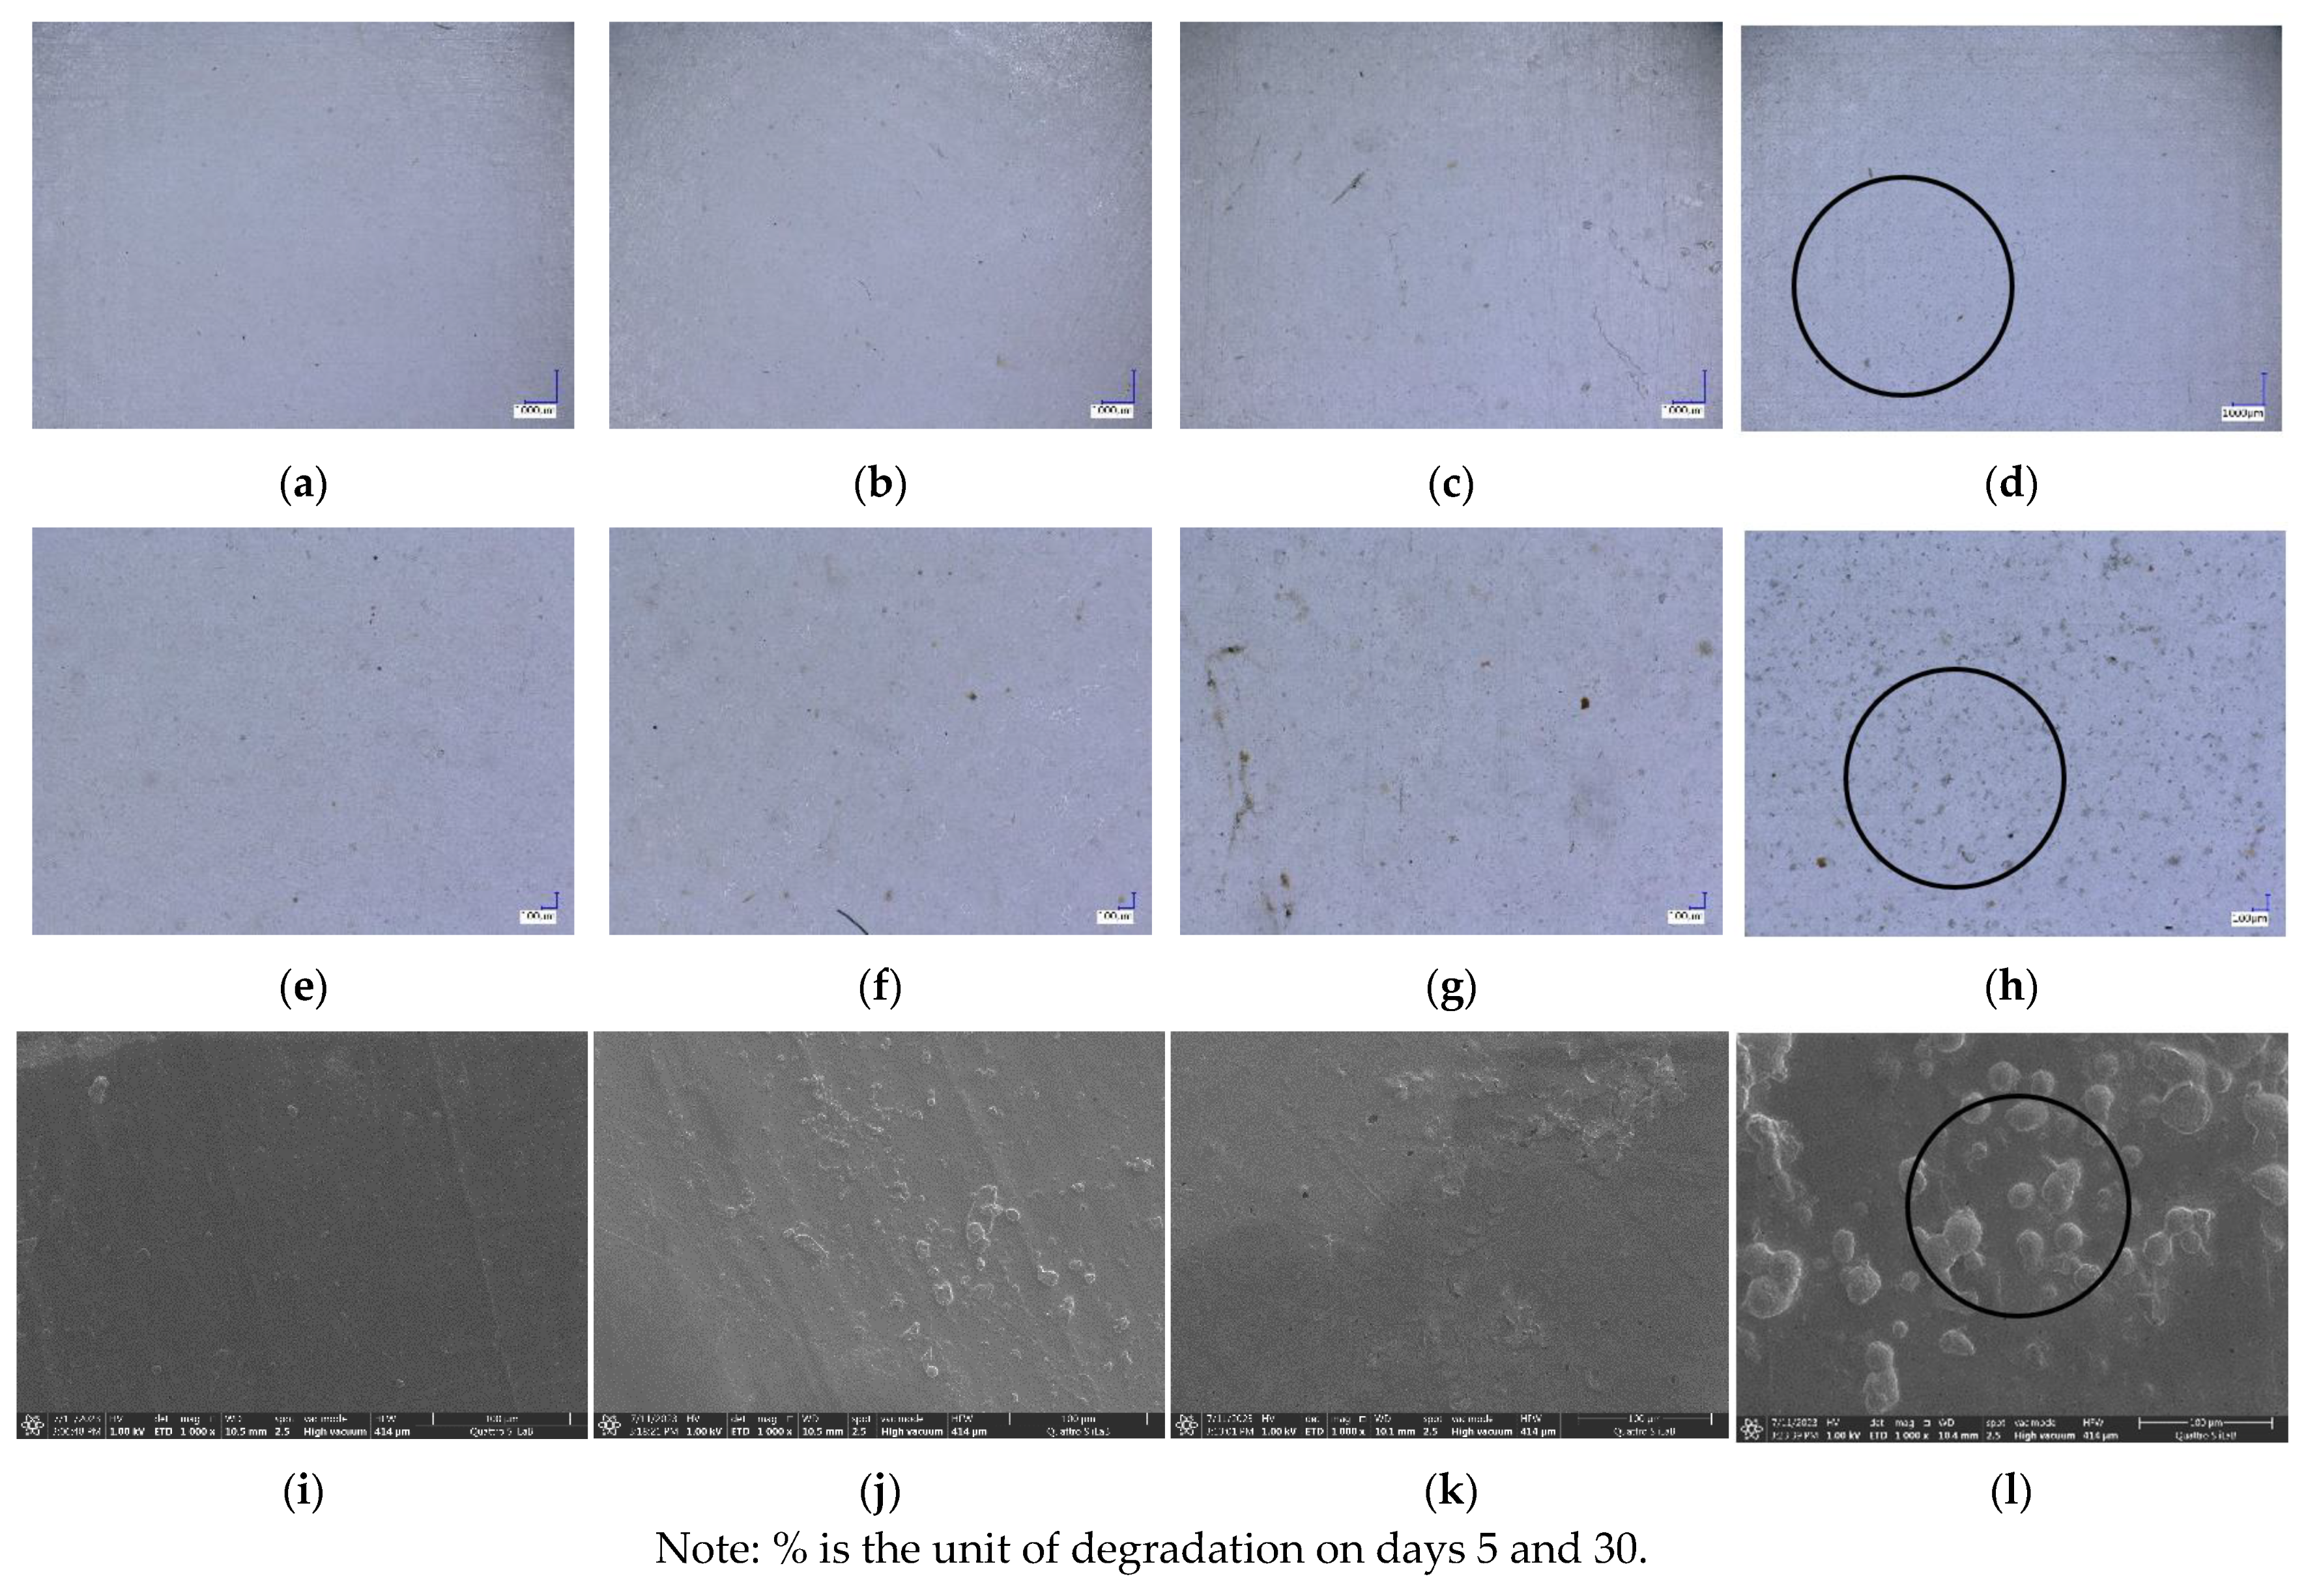
3.6. Morphology
3.7. Biodegradability
4. Conclusions
Supplementary Materials
Author Contributions
Funding
Institutional Review Board Statement
Data Availability Statement
Acknowledgments
Conflicts of Interest
References
- Zubir, N.H.M.; Sam, S.T.; Zulkepli, N.N.; Omar, M.F. The Effect of Rice Straw Particulate Loading and Polyethylene Glycol as Plasticizer on the Properties of Polylactic Acid/Polyhydroxybutyrate-Valerate Blends. Polym. Bull. 2018, 75, 61–76. [Google Scholar] [CrossRef]
- DeStefano, V.; Khan, S.; Tabada, A. Applications of PLA in Modern Medicine. Eng. Regen. 2020, 1, 76–87. [Google Scholar] [CrossRef]
- Wang, N.; Yu, J.; Chang, P.R.; Ma, X. Influence of Citric Acid on the Properties of Glycerol-Plasticized Dry Starch (DTPS) and DTPS/Poly(Lactic Acid) Blends. Starch—Stärke 2007, 59, 409–417. [Google Scholar] [CrossRef]
- Zhang, X.; Tan, B.H.; Li, Z. Biodegradable Polyester Shape Memory Polymers: Recent Advances in Design, Material Properties and Applications. Mater. Sci. Eng. C 2018, 92, 1061–1074. [Google Scholar] [CrossRef]
- Singhvi, M.S.; Zinjarde, S.S.; Gokhale, D.V. Polylactic Acid: Synthesis and Biomedical Applications. J. Appl. Microbiol. 2019, 127, 1612–1626. [Google Scholar] [CrossRef] [PubMed]
- Martinez Villadiego, K.; Arias Tapia, M.J.; Useche, J.; Escobar Macías, D. Thermoplastic Starch (TPS)/Polylactic Acid (PLA) Blending Methodologies: A Review. J. Polym. Env. 2022, 30, 75–91. [Google Scholar] [CrossRef]
- Pantani, R.; Turng, L.S. Manufacturing of Advanced Biodegradable Polymeric Components. J. Appl. Polym. Sci. 2015, 132, 42305. [Google Scholar] [CrossRef]
- Ferrarezi, M.M.F.; de Oliveira Taipina, M.; da Silva, L.C.E.; Gonçalves, M. do C. Poly(Ethylene Glycol) as a Compatibilizer for Poly(Lactic Acid)/Thermoplastic Starch Blends. J. Polym. Environ. 2013, 21, 151–159. [Google Scholar] [CrossRef]
- Agwamba, E.C. Comparative Study of Sucrose Plasticised Bioplastic Derivatives with Selected Petro-Plastics. Bayero J. Pure Appl. Sci. 2020, 12, 386–394. [Google Scholar] [CrossRef]
- Nissa, R.C.; Fikriyyah, A.K.; Abdullah, A.H.D.; Pudjiraharti, S. Preliminary Study of Biodegradability of Starch-Based Bioplastics Using ASTM G21-70, Dip-Hanging, and Soil Burial Test Methods. In IOP Conference Series: Earth and Environmental Science; Institute of Physics Publishing: Bristol, UK, 2019; Volume 277. [Google Scholar]
- N Wuk Park, J.U.; Soon, S.I.; Kim, H.; Kim, Y.H. Biodegradable Polymer Blends of Poly(L-Lactic Acid) and Gelatinized Starch. Polym. Eng. Sci. 2000, 40, 2539–2550. [Google Scholar] [CrossRef]
- Barros, M.T.; Petrova, K.T.; Singh, R.P. Synthesis and Biodegradation Studies of New Copolymers Based on Sucrose Derivatives and Styrene. Eur. Polym. J. 2010, 46, 1151–1157. [Google Scholar] [CrossRef]
- Alonso-González, M.; Ramos, M.; Bengoechea, C.; Romero, A.; Guerrero, A. Evaluation of Composition on Processability and Water Absorption of Wheat Gluten-Based Bioplastics. J. Polym. Env. 2021, 29, 1434–1443. [Google Scholar] [CrossRef]
- Massijaya, S.Y.; B Laksana, R.P.; Nissa, R.C.; Nurhamiyah, Y.; Irmayanti, M.; Ningrum, R.S.; Kusumah, S.S.; Karlinasari, L. Characterization of PLA-Based Biopolymer Composite Physical Properties with Addition of Sucrose. In Proceedings of the International Conference on Biomass and Bioenergy 2023, Bogor, Indonesia, 7–8 August 2023. [Google Scholar]
- TAPPI T 464 OM-12 (R2022); Water Vapor Transmission Rate of Paper and Paperboard at High Temperature and Humidity. TAPPI: Peachtree Corners, GA, USA, 2012.
- ASTM D882-12; 2012 Standard Test Method for Tensile Properties of Thin Plastic Sheeting. American Standard and Testing Material: West Conshohocken, PA, USA, 2012.
- ASTM G21-15; Standard Practice for Determining Resistance of Synthetic Polymeric Materials to Fungi. American Standard and Testing Material: West Conshohocken, PA, USA, 2021.
- Oluwasina, O.O.; Olaleye, F.K.; Olusegun, S.J.; Oluwasina, O.O.; Mohallem, N.D.S. Influence of Oxidized Starch on Physicomechanical, Thermal Properties, and Atomic Force Micrographs of Cassava Starch Bioplastic Film. Int. J. Biol. Macromol. 2019, 135, 282–293. [Google Scholar] [CrossRef] [PubMed]
- Kusumah, S.S.; Arinana, A.; Hadi, Y.S.; Guswenrivo, I.; Yoshimura, T.; Umemura, K.; Tanaka, S.; Kanayama, K. Utilization of Sweet Sorghum Bagasse and Citric Acid in the Manufacturing of Particleboard. III: Influence of Adding Sucrose on the Properties of Particleboard. Bioresources 2017, 12, 7498–7514. [Google Scholar] [CrossRef]
- Yang, Z.; Li, X.; Si, J.; Cui, Z.; Peng, K. Morphological, Mechanical and Thermal Properties of Poly(Lactic Acid) (PLA)/Cellulose Nanofibrils (CNF) Composites Nanofiber for Tissue Engineering. J. Wuhan Univ. Technol. Mater. Sci. Ed. 2019, 34, 207–215. [Google Scholar] [CrossRef]
- Tanaka, M.; Motomura, T.; Ishii, N.; Shimura, K.; Onishi, M.; Mochizuki, A.; Hatakeyama, T. Cold Crystallization of Water in Hydrated Poly(2-Methoxyethyl Acrylate) (PMEA). Polym. Int. 2000, 49, 1709–1713. [Google Scholar] [CrossRef]
- Yu, L.; Liu, H.; Dean, K.; Chen, L. Cold Crystallization and Postmelting Crystallization of PLA Plasticized by Compressed Carbon Dioxide. J. Polym. Sci. B Polym. Phys. 2008, 46, 2630–2636. [Google Scholar] [CrossRef]
- Kusumaningrum, W.B.; Syamani, F.A.; Suryanegara, L. Heat Properties of Polylactic Acid Biocomposites after Addition of Plasticizers and Oil Palm Frond Microfiber. J. Kim. Sains Dan Apl. 2020, 23, 295–304. [Google Scholar] [CrossRef]
- Kaavessina, M.; Ali, I.; Al-Zahrani, S.M. The Influences of Elastomer toward Crystallization of Poly(Lactic Acid). Procedia Chem. 2012, 4, 164–171. [Google Scholar] [CrossRef]
- Kong, Y.; Hay, J.N. The Measurement of the Crystallinity of Polymers by DSC. Polymer 2002, 43, 3873–3878. [Google Scholar] [CrossRef]
- Song, Z.; Xiao, H.; Zhao, Y. Hydrophobic-Modified Nano-Cellulose Fiber/PLA Biodegradable Composites for Lowering Water Vapor Transmission Rate (WVTR) of Paper. Carbohydr. Polym. 2014, 111, 442–448. [Google Scholar] [CrossRef] [PubMed]
- Cazón, P.; Morales-Sanchez, E.; Velazquez, G.; Vázquez, M. Measurement of the Water Vapor Permeability of Chitosan Films: A Laboratory Experiment on Food Packaging Materials. J. Chem. Educ. 2022, 99, 2403–2408. [Google Scholar] [CrossRef]
- Chinnan, M.S.; Park, H.J. Effect of Plasticizer Level and Temperature on Water Vapor Transmission of Cellulose-Based Films. J. Food Process Eng. 1995, 18, 417–429. [Google Scholar] [CrossRef]
- Robertson, G.L. Food Packaging; CRC Press: Boca Raton, FL, USA, 2016; ISBN 9781439862421. [Google Scholar]
- Figura, L.; Teixeira, A.A. Food Physics: Physical Properties—Measurement and Applications, 2007th ed.; Springer: Berlin/Heidelberg, Germany, 2007. [Google Scholar]
- Borji, A.; Jourani, A. Spectrophotometry as a Method for the Determination of Solubility of Sucrose in Water and Metastable Zone Width of Its Aqueous Solutions. Cryst. Res. Technol. 2018, 53, 1700123. [Google Scholar] [CrossRef]
- Fadini, A.L.; Rocha, F.S.; Alvim, I.D.; Sadahira, M.S.; Queiroz, M.B.; Alves, R.M.V.; Silva, L.B. Mechanical Properties and Water Vapour Permeability of Hydrolysed Collagen-Cocoa Butter Edible Films Plasticized with Sucrose. Food Hydrocoll. 2013, 30, 625–631. [Google Scholar] [CrossRef]
- Sobral, P.; Menegalli, F.; Roques, M. Mechanical, water vapor barrier and thermal properties of gelatin based edible films. Food Hydrocoll. 2001, 15, 423–432. [Google Scholar] [CrossRef]
- Zherebtsov, S.; Semenova, I.P.; Garbacz, H.; Motyka, M. Advanced Mechanical Properties. In Nanocrystalline Titanium; Elsevier: Amsterdam, The Netherlands, 2019; pp. 103–121. [Google Scholar]
- Sofiah; Yuniar; Aznury, M. Melianti Mechanical Properties of Bioplastics Product from Musa Paradisica Formatypica Concentrate with Plasticizer Variables. J. Phys. Conf. Ser. 2019, 1167, 012048. [Google Scholar] [CrossRef]
- Ginting, M.H.S.; Lubis, M.; Sidabutar, T.; Sirait, T.P. The Effect of Increasing Chitosan on the Characteristics of Bioplastic from Starch Talas (Colocasia Esculenta) Using Plasticizer Sorbitol. IOP Conf. Ser. Earth Environ. Sci. 2018, 126, 012147. [Google Scholar] [CrossRef]
- Zhao, X.; Liu, J.; Li, J.; Liang, X.; Zhou, W.; Peng, S. Strategies and Techniques for Improving Heat Resistance and Mechanical Performances of Poly(Lactic Acid) (PLA) Biodegradable Materials. Int. J. Biol. Macromol. 2022, 218, 115–134. [Google Scholar] [CrossRef] [PubMed]
- Nandiyanto, A.B.D.; Ragadhita, R.; Fiandini, M. Interpretation of Fourier Transform Infrared Spectra (FTIR): A Practical Approach in the Polymer/Plastic Thermal Decomposition. Indones. J. Sci. Technol. 2023, 8, 113–126. [Google Scholar] [CrossRef]
- Jannah, N.R.; Jamarun, N.; Putri, Y.E. Production of Starch-Based Bioplastic from Durio Zibethinus Murr Seed Using Glycerol as Plasticizer. J. Ris. Kim. 2021, 12. [Google Scholar] [CrossRef]
- Ørskov, K.E.; Christensen, L.B.; Wiking, L.; Hannibal, T.; Hammershøj, M. Detecting Interactions between Starch and Casein in Imitation Cheese by FTIR and Raman Spectroscopy. Food Chem. Adv. 2023, 2, 100322. [Google Scholar] [CrossRef]
- Zhou, J.; Wang, B.; Xu, C.; Xu, Y.Z.; Tan, H.; Zhang, X.; Zhang, Y. Performance of Composite Materials by Wood Fiber/Polydopamine/Silver Modified PLA and the Antibacterial Property. J. Mater. Res. Technol. 2022, 18, 428–438. [Google Scholar] [CrossRef]
- Hadjiivanov, K. Identification and Characterization of Surface Hydroxyl Groups by Infrared Spectroscopy. In Advances in Catalysis; Academic Press Inc.: Cambridge, MA, USA, 2014; Volume 57, pp. 99–318. [Google Scholar]
- Rilda, Y.; Valeri, A.; Syukri, S.; Agustien, A.; Pardi, H.; Sofyan, N. Biosynthesis, Characterization, and Antibacterial Activity of Ti-Doped ZnO (Ti/ZnO) Using Mediated Aspergillus Niger. S. Afr. J. Chem. Eng. 2023, 45, 10–19. [Google Scholar] [CrossRef]
- Chieng, B.W.; Ibrahim, N.A.; Yunus, W.M.Z.W.; Hussein, M.Z. Poly(Lactic Acid)/Poly(Ethylene Glycol) Polymer Nanocomposites: Effects of Graphene Nanoplatelets. Polymers 2014, 6, 93–104. [Google Scholar] [CrossRef]
- Guerrero, P.; Garrido, T.; Leceta, I.; de la Caba, K. Films Based on Proteins and Polysaccharides: Preparation and Physical–Chemical Characterization. Eur. Polym. J. 2013, 49, 3713–3721. [Google Scholar] [CrossRef]
- Cataldo, V.A.; Cavallaro, G.; Lazzara, G.; Milioto, S.; Parisi, F. Coffee Grounds as Filler for Pectin: Green Composites with Competitive Performances Dependent on the UV Irradiation. Carbohydr. Polym. 2017, 170, 198–205. [Google Scholar] [CrossRef] [PubMed]
- Yu, W.; Yuan, T.; Yao, Y.; Deng, Y.; Wang, X. PLA/Coffee Grounds Composite for 3D Printing and Its Properties. Forests 2023, 14, 367. [Google Scholar] [CrossRef]
- Singh, T.; Pattnaik, P.; Kumar, S.R.; Fekete, G.; Dogossy, G.; Lendvai, L. Optimization on Physicomechanical and Wear Properties of Wood Waste Filled Poly(Lactic Acid) Biocomposites Using Integrated Entropy-Simple Additive Weighting Approach. S. Afr. J. Chem. Eng. 2022, 41, 193–202. [Google Scholar] [CrossRef]
- Ahn, H.K.; Richard, T.L.; Glanville, T.D. Optimum Moisture Levels for Biodegradation of Mortality Composting Envelope Materials. Waste Manag. 2008, 28, 1411–1416. [Google Scholar] [CrossRef] [PubMed]


| Stage | Sample | Starch (%) | Glycerol (%) | Sucrose (%) |
|---|---|---|---|---|
| First Blending | TPS-S-0 | 65 | 35 | 0 |
| TPS-S-1 | 64.5 | 34.5 | 1 | |
| TPS-S-2 | 64 | 34 | 2 | |
| TPS-S-3 | 63.5 | 33.5 | 3 | |
| Stage | Sample | PLA (%) | TPS-S (%) | |
| Second Blending | PLA-TPS-S-0 | 60 | 40 | |
| PLA-TPS-S-1 | 60 | 40 | ||
| PLA-TPS-S-2 | 60 | 40 | ||
| PLA-TPS-S-3 | 60 | 40 | ||
| Peak | Sample | Tonset (°C) | Tmax (°C) | WL (%) |
|---|---|---|---|---|
| 1 | PLA-TPS-S-0 | 58.06 | 77.02 | 4.4 |
| PLA-TPS-S-1 | 82.24 | 97.76 | 4.1 | |
| PLA-TPS-S-2 | 57.12 | 78.81 | 4.4 | |
| PLA-TPS-S-3 | 54.68 | 77.06 | 4.2 | |
| 2 | PLA-TPS-S-0 | 308.65 | 319.62 | 39.8 |
| PLA-TPS-S-1 | 174.06 | 203.83 | 10.4 | |
| PLA-TPS-S-2 | 157.04 | 210.47 | 12 | |
| PLA-TPS-S-3 | 158.78 | 194.79 | 13 | |
| 3 | PLA-TPS-S-0 | 333.97 | 342.86 | 40.8 |
| PLA-TPS-S-1 | 317.34 | 340.14 | 78.1 | |
| PLA-TPS-S-2 | 311.74 | 339.76 | 21.7 | |
| PLA-TPS-S-3 | 309.08 | 322.30 | 20.4 | |
| 4 | PLA-TPS-S-0 | - | - | - |
| PLA-TPS-S-1 | - | - | - | |
| PLA-TPS-S-2 | 366.42 | 371.76 | 49.6 | |
| PLA-TPS-S-3 | 347.39 | 367.86 | 54.7 |
| Sample | Tg (°C) | Tm (°C) | Tcc (°C) | ∆Hm (J/g) | ∆Hc (J/g) | Xc (%) |
|---|---|---|---|---|---|---|
| PLA-TPS-S-0 | 51.91 | 148.63 | 58.46 | 38.5 | −11.75 | 27.86 |
| PLA-TPS-S-1 | 49.62 | 148.13 | 57.29 | 40.6 | −11.70 | 30.10 |
| PLA-TPS-S-2 | 50.93 | 147.63 | 59.30 | 45.2 | −12.00 | 34.58 |
| PLA-TPS-S-3 | 55.22 | 150.31 | 59.28 | 39.01 | −11.14 | 29.03 |
| Day | PLA-TPS-S-1 | PLA-TPS-S-2 | PLA-TPS-S-3 |
|---|---|---|---|
| 5 | 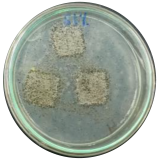 |  | 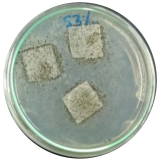 |
| 15.5% | 18% | 16.2% | |
| 30 |  | 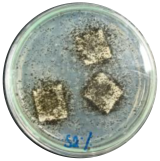 |  |
| 59.9% | 72% | 65.2% |
| Sample | Moisture Content (%) | Standard Deviation |
|---|---|---|
| PLA-TPS-S-1 | 10.4 | 1.52 |
| PLA-TPS-S-2 | 8.7 | 1.12 |
| PLA-TPS-S-3 | 11.2 | 0.28 |
Disclaimer/Publisher’s Note: The statements, opinions and data contained in all publications are solely those of the individual author(s) and contributor(s) and not of MDPI and/or the editor(s). MDPI and/or the editor(s) disclaim responsibility for any injury to people or property resulting from any ideas, methods, instructions or products referred to in the content. |
© 2024 by the authors. Licensee MDPI, Basel, Switzerland. This article is an open access article distributed under the terms and conditions of the Creative Commons Attribution (CC BY) license (https://creativecommons.org/licenses/by/4.0/).
Share and Cite
Massijaya, S.Y.; Lubis, M.A.R.; Nissa, R.C.; Nurhamiyah, Y.; Kusumaningrum, W.B.; Marlina, R.; Ningrum, R.S.; Sutiawan, J.; Hidayat, I.; Kusumah, S.S.; et al. Thermal Properties’ Enhancement of PLA-Starch-Based Polymer Composite Using Sucrose. Polymers 2024, 16, 1028. https://doi.org/10.3390/polym16081028
Massijaya SY, Lubis MAR, Nissa RC, Nurhamiyah Y, Kusumaningrum WB, Marlina R, Ningrum RS, Sutiawan J, Hidayat I, Kusumah SS, et al. Thermal Properties’ Enhancement of PLA-Starch-Based Polymer Composite Using Sucrose. Polymers. 2024; 16(8):1028. https://doi.org/10.3390/polym16081028
Chicago/Turabian StyleMassijaya, Sri Yustikasari, Muhammad Adly Rahandi Lubis, Rossy Choerun Nissa, Yeyen Nurhamiyah, Wida Banar Kusumaningrum, Resti Marlina, Riska Surya Ningrum, Jajang Sutiawan, Iman Hidayat, Sukma Surya Kusumah, and et al. 2024. "Thermal Properties’ Enhancement of PLA-Starch-Based Polymer Composite Using Sucrose" Polymers 16, no. 8: 1028. https://doi.org/10.3390/polym16081028
APA StyleMassijaya, S. Y., Lubis, M. A. R., Nissa, R. C., Nurhamiyah, Y., Kusumaningrum, W. B., Marlina, R., Ningrum, R. S., Sutiawan, J., Hidayat, I., Kusumah, S. S., Karlinasari, L., & Hartono, R. (2024). Thermal Properties’ Enhancement of PLA-Starch-Based Polymer Composite Using Sucrose. Polymers, 16(8), 1028. https://doi.org/10.3390/polym16081028