Abstract
Nowadays, due to water pollution, more and more living beings are exposed to dangerous compounds, which can lead to them contracting diseases. The removal of contaminants (including heavy metals) from water is, therefore, a necessary aspect to guarantee the well-being of living beings. Among the most used techniques, the employment of adsorbent materials is certainly advantageous, as they are easy to synthesize and are cheap. In this work, poly(ethylene glycol) diacrylate (PEGDA) hydrogels doped with silver nanoparticles (AgNPs) for removing Hg(II) ions from water are presented. AgNPs were embedded in PEGDA-based matrices by using a photo-polymerizable solution. By exploiting a custom-made 3D printer, the filters were synthesized. The kinetics of interaction was studied, revealing that the adsorption equilibrium is achieved in 8 h. Subsequently, the adsorption isotherms of PEGDA doped with AgNPs towards Hg(II) ions were studied at different temperatures (4 °C, 25 °C, and 50 °C). In all cases, the best isotherm model was the Langmuir one (revealing that the chemisorption is the driving process and the most favorable one), with maximum adsorption capacities equal to 0.55, 0.57, and 0.61 mg/g, respectively. Finally, the removal efficiency was evaluated for the three temperatures, obtaining for 4 °C, 25 °C, and 50 °C the values 94%, 94%, and 86%, respectively.
1. Introduction
Water is the most crucial good for life-support processes in organisms, and it is a basic and indispensable need for human beings and all living creatures on earth. The consumption of water by humans should be safe, easily accessible, adequate, and free from any kind of contamination. Pollutants in water pose a severe threat to human health as well as the aquatic ecosystem. Water pollutants sources are commonly split into two groups: natural and anthropogenic [1]. The natural sources refer to contamination due to geological composition or to natural events such as volcanic eruptions or geothermal fluids that change the chemical composition of water bodies. Meanwhile, anthropogenic pollution is attributed to all human activities, such as the widespread use of pesticides and manures on farms, dumping without treatments of industrial waste directly in rivers or sea, etc. [2].
Pollutants can be classified on the basis of their chemical nature, such as inorganic [3,4,5,6] and organic contaminants [7,8,9,10], pathogens [11,12,13], thermal pollution [14,15], and radioactive contamination [16,17,18]. Among inorganic contaminants, heavy metal ions represent the most dangerous species, as they are highly toxic even at very low concentrations. Moreover, they are not degradable and tend to accumulate, consequently causing damage to the environment and living beings [19]. For example, mercury (Hydrargyrum, Hg) is considered a heavy metal and is toxic at even low exposures [20]. The history of mercury compounds and their use is ancient. Indeed, the Hg amalgam cinnabar was applied in ancient cave paintings for red colors, and metallic Hg was recognized in early Greece where it was applied as a beauty product to improve skin color [21]. Inorganic mercury is transformed into organic compounds, like methylmercury (CH3Hg), which is extremely stable and accumulates in the food chain. CH3Hg is a neurotoxic compound, which is accountable for microtubule damage, mitochondrial harm, lipid peroxidation, and the gathering of neurotoxic molecules, such as serotonin, aspartate, and glutamate [22].
For these reasons, the removal of water contaminants is a topic that in recent decades has become increasingly studied and deeply explored by the scientific community. Indeed, the number of peer-reviewed papers related to this subject has grown from 17,524 to 44,518 in only nine years (2013–2022), according to the SciVal website [23], by using the keywords “wastewater treatment”, “wastewater”, and “water management”.
The techniques able to remove these pollutants include physical, chemical, and biological methods. Physical processes include sedimentation, degasification, and filtration [24,25]. Chemical approaches provide flocculation/coagulation, ozonation, chemical precipitation, adsorption, and ion exchange [26,27,28,29,30,31]. Aerobic and anaerobic treatments and phytoremediation belong to biological methods [32,33,34,35,36,37]. Physical methods, such as sedimentation or filtration, are generally used to remove particles suspended in water and, therefore, the efficiency of these techniques is limited to the size of the species to be removed. Consequently, well-solubilized chemical compounds are not affected by these techniques [38,39]. The degasification acts only on solubilized gasses, and the efficiency decreases when the gasses concentration is high [40]. Flocculation/coagulation may not be effective on species such as heavy metals or pathogens; the addition of coagulation chemicals can leak into the environment, polluting it [41]. The ozonation technique, in addition to being expensive, is ineffective for removing heavy metals or persistent organic compounds [42,43]. Chemical-precipitation efficiency depends on temperature and pH [44]. Instead, the ion-exchange method is not able to remove organic species and the membranes used reach saturation and, therefore, lose effectiveness over time [5]. Biological methods have as disadvantages the high initial cost to build the water treatment plant and the very long time of water depuration [40,45]. These are only some of the disadvantages of the purification processes mentioned.
Among all these processes, the adsorption technique has several advantages: low operational cost, relatively high efficiency, design simplicity, and in most cases, possible regenerative procedures. However, adsorption also has a disadvantage related to poor selectivity and disposal issues [40]. Nanomaterials, which have interesting features, such as optical [46,47,48], mechanical [49,50,51], electrical [52,53,54,55], or magnetic properties [56,57,58], differ considerably when compared with their macroscopic counterparts, but the most useful property is the high surface area, which makes the nanomaterials suitable as adsorbent species. Indeed, a greater surface area guarantees greater interaction with the surrounding environment. These innovative materials can be used alone or in combination with a matrix that can host them and maintain their adsorption capacity. Surface-functionalized nanoparticles (based on metal or metal oxide) are successfully used to collect heavy metal ions [59], but in this case, the main challenge is represented by the separation of nanomaterials from wastewater. For this reason, many researchers turn to designing substrate-based adsorbent materials. Indeed, with the help of polymer, it is possible to handle and collect in an easy way the sorbent filter from the wastewater, once they have removed the toxic contaminants. Recently, adsorbent materials containing noble metal nanomaterials [60,61,62,63] have been achieving success not only for their efficiency but also for other features such as anti-bactericity [64,65].
In this work, silver nanoparticles were employed as dopants in three-dimensional filters based on PEGDA, which were synthesized by using a custom-made 3D printer. The printing method is based on the photo-polymerization technique, where a common projector coupled with a PC was used for this aim. The structural and morphological features of the 3D-printed filter were studied using X-ray diffraction and scanning electron microscopy, respectively. Once printed, the interaction of Hg(II) ions and the filters was studied by X-ray Photoelectron Spectroscopy (XPS) and Fourier Transform Infrared (FT-IR). Finally, the kinetics of interaction and the adsorption capacity at different temperatures were studied. The system, consisting of silver nanoparticles and a photopolymerizable monomer (PEGDA), represents one of the few systems that involve the use of noble metal nanostructures for the removal of heavy metals from water [66,67,68,69,70] and, in addition, the only one that involves a three-dimensional structuring of the filter.
2. Materials and Methods
2.1. Chemicals
Silver nitrate (AgNO3), sodium citrate (Na3C6H5O7, cit, 99% pure), L-cysteine (C3H7NO2S, Lcys, 97% pure) sodium borohydride (NaBH4, ≥98.0%), Poly(ethylene glycol) diacrylate (PEGDA, Mn = 700 g/mol, density 1.12 g/mL at 25 °C) and lithium phenyl-2,4,6-trimethylbenzoylphosphinate (LAP, ≤95% pure) were purchased from Merck (Darmstadt, Germany). They were used without further purification processes and dissolved in deionized water (18.2 MΩ·cm).
2.2. Synthesis of Silver Nanoparticles (AgNPs-cit-Lcys)
Silver nanoparticles capped with citrate and L-cysteine (AgNPs-cit-Lcys) were synthesized according to previous work [71]. Briefly, 10 mL of citrate solution [0.01 M in deionized water (dH2O)], 25 mL of L-cysteine solution (0.002 M in dH2O), and 2.5 mL of silver nitrate (AgNO3) solution (0.05 M in dH2O) were sequentially added in a 100 mL flask under stirring. AgNO3 is the precursor salt of Ag+ ions, while citrate and L-cysteine are the capping agents, which avoid the aggregation of growing silver nanoparticles. The mixture was then degassed with Argon for 10 min (this was accomplished at low pressure and room temperature with a cannula in the flask closed with a rubber stopper, allowing air to flow outside through another needle) and 4 mL of a sodium borohydride (NaBH4) solution (0.016 g in 4 mL of dH2O) added for reducing the Ag+ ions into Ag0 (nanoparticles). The mixture was allowed to react at room temperature (r.t.) for 2 h, and then, the brown solution was collected. The solution was stored in the fridge at T = 4 °C before use in the synthesis of the 3D filters.
2.3. Synthesis of PEGDA/AgNPs-cit-Lcys Filters by Using 3D Printer
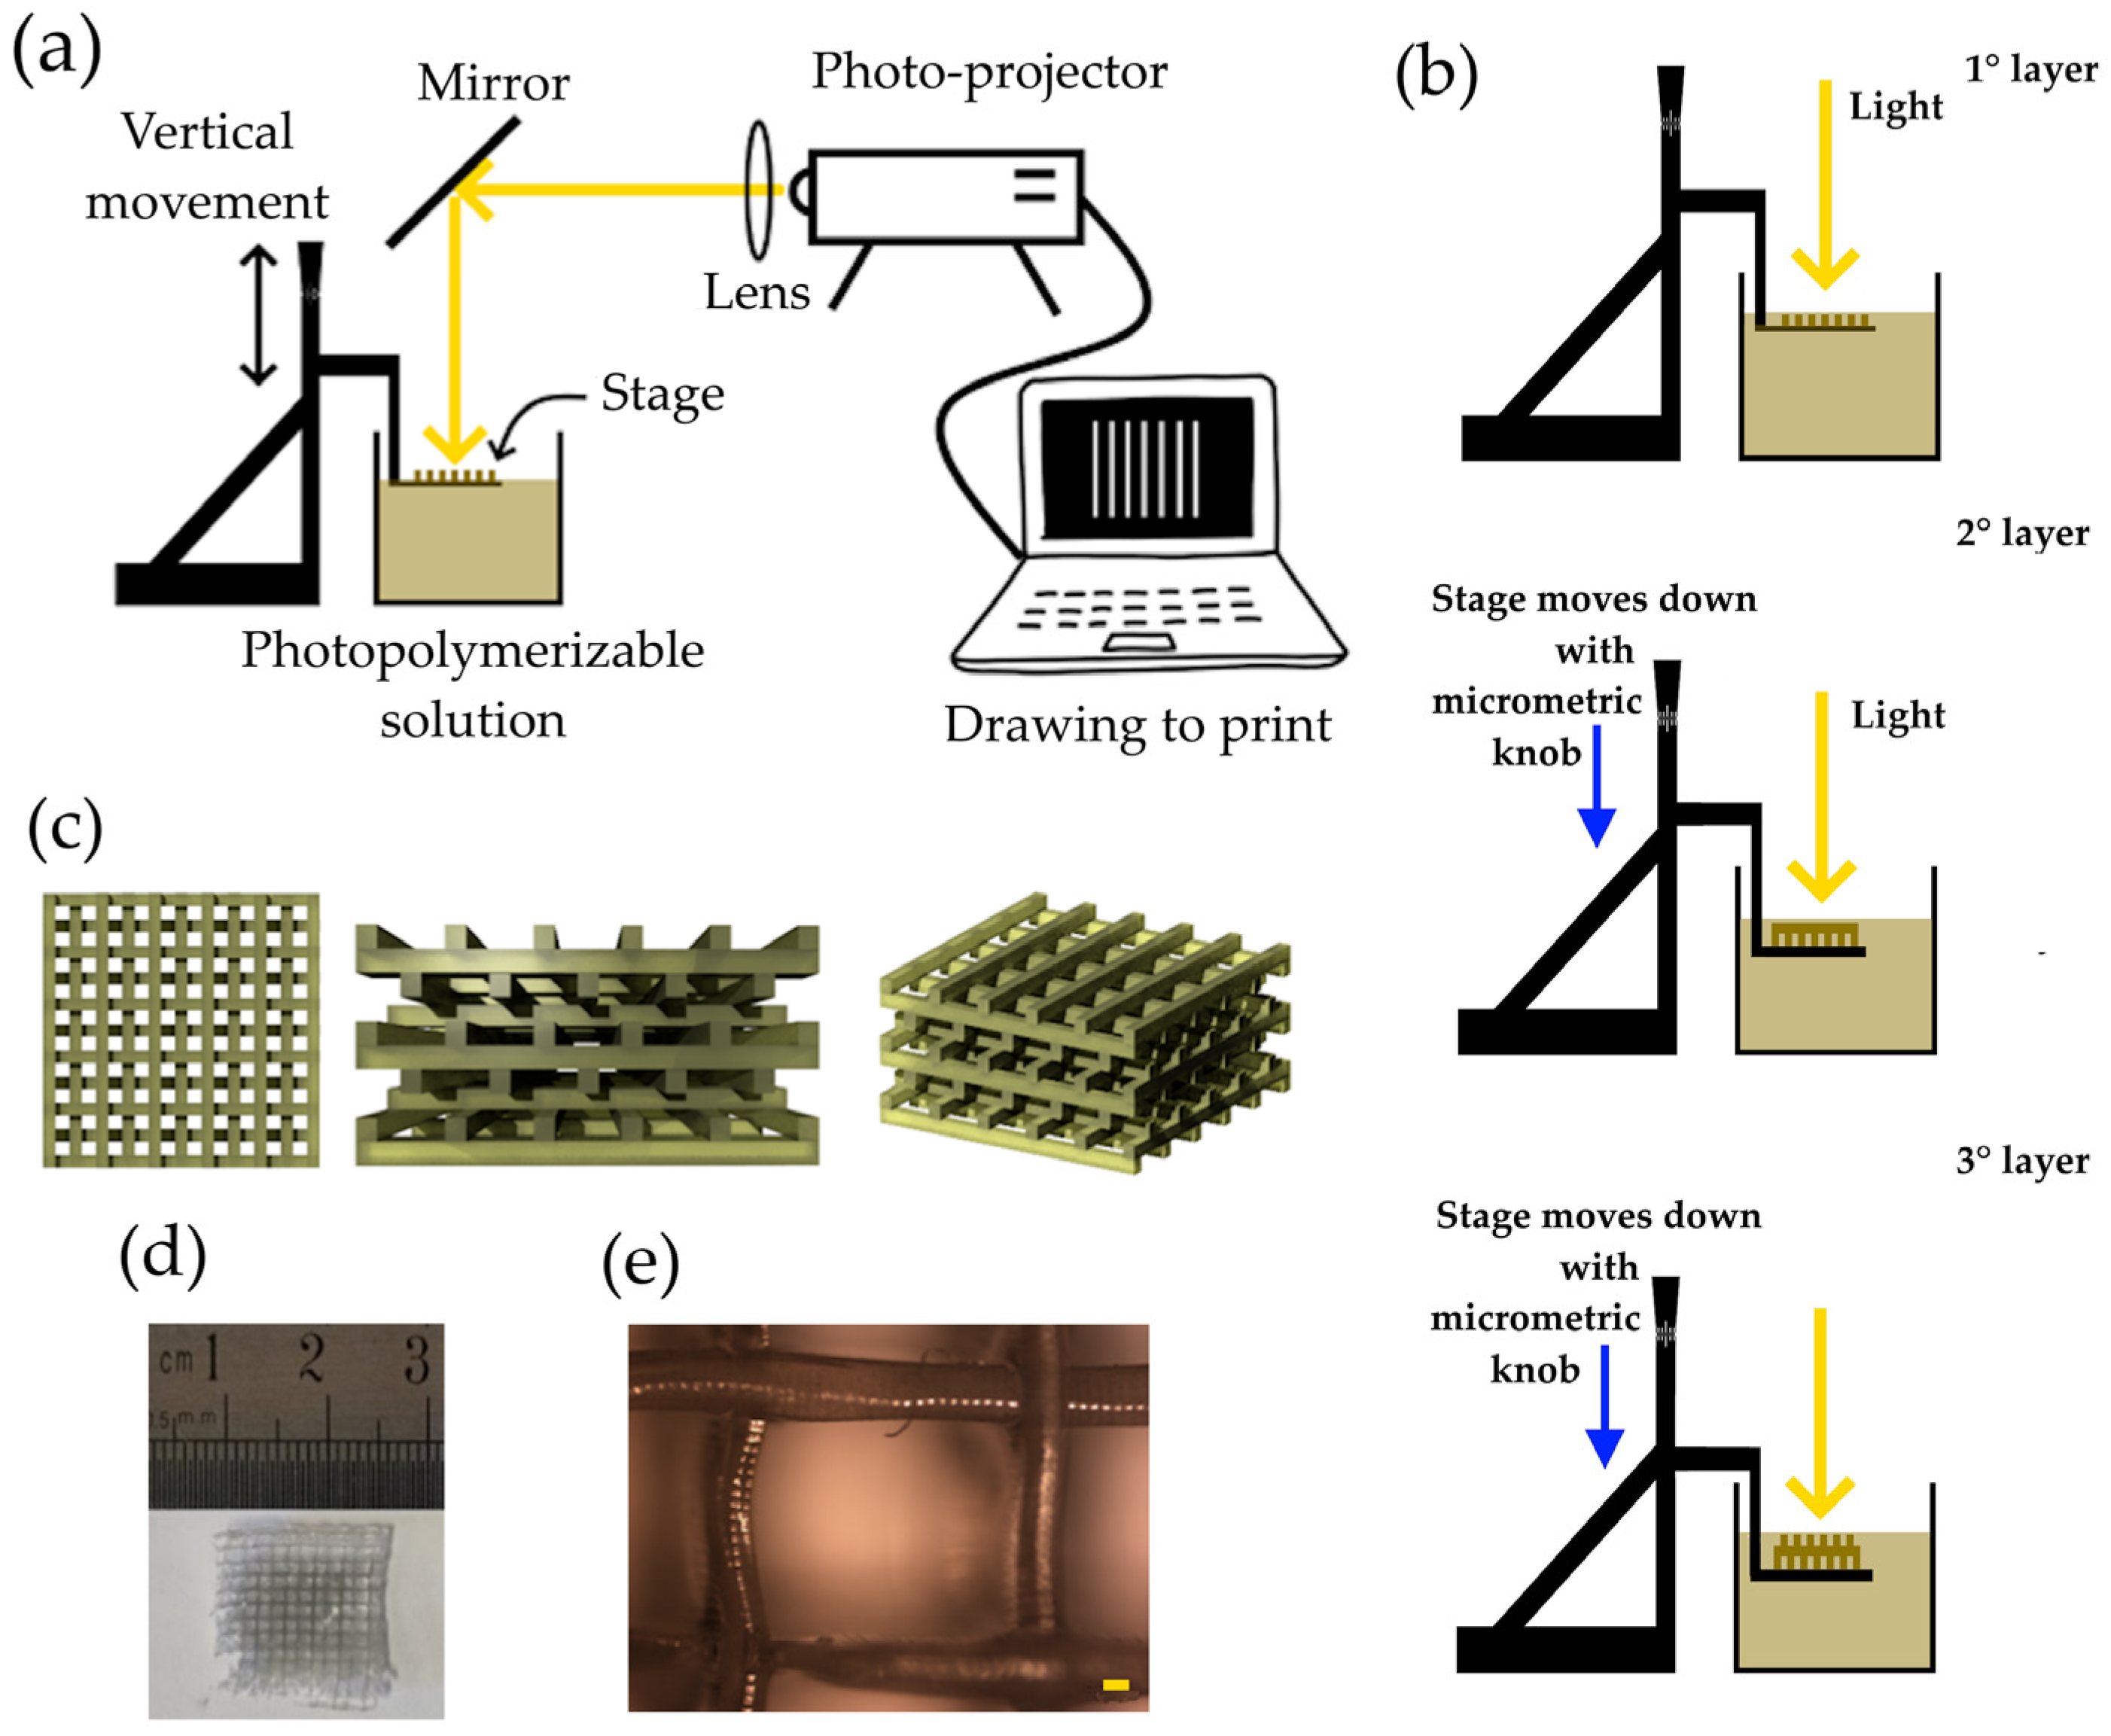
A photopolymerizable solution was synthesized by mixing PEGDA (30% in volume), AgNPs-cit-Lcys (70% in volume at the concentration of 0.5 mg/mL), and LAP (1% in weight with respect to the PEGDA mass). PEGDA was diluted in AgNPs-cit-Lcys, and LAP was added. The mixture was stirred for 20 min in the dark, and the solution was ready to be polymerized (the viscosity of the solution was 40.2 mPa∙s). Figure 1a shows the schematic representation of the 3D printer. A PC connected to a commercial photo-projector (Acer, Taipei, Taiwan, X1385WH, power and density of 3.30 mW and 106 mW/cm2, respectively, at 500 nm measured on the solution surface), a collimator lens, and a dichroic mirror (only the range 450–600 nm is reflected) composes the main part of the 3D printer. A metallic plate fixed on an XYZ translation stage and a plastic container complete the printer setup. The photopolymerization solution is poured into the plastic container to be polymerized on the surface of the metallic plate. The light coming from the photo projector passes through a lens (f = 201.0 mm), and the beam is reflected at 90° by the mirror. The metallic plate is immersed in the solution of PEGDA and AgNPs, and the knob can move it vertically. The light beam, once reflected, arrives onto a thin layer of the photopolymerizable solution, and the polymerization occurs only where the light is present. After the first layer is synthesized, the plate is moved down into the solution, through the micrometric knob, and a new layer is available to be polymerized (second layer). Among the exposition of the layers, the light beam is stopped (projecting a black slide), avoiding unwanted polymerizations. A schematic drawing of the working principle of 3D printing is shown in Figure 1b.

Figure 1.
(a) schematic representation of 3D printer; (b) working principle of the 3D printer based on photopolymerization; (c) schematic drawings of a filter observed from different angles; (d) picture of a filter; and (e) image of optical microscope of a PEGDA/AgNPs-cit-Lcys filter (magnification 5×, scale bar 100 µm).
Figure 1c shows the schematic aspect of the final filter at different views. Parallel lines in one direction define the first layer. The second one is perpendicular with respect to the first, and the third layer is parallel to the first one but slightly shifted in one direction to create a mismatching of these two layers. The same idea is applied to the fourth layer, etc. By repeating the procedure, it is possible to make the desired structure. This kind of structure increases the surface area of the filter and favors the interaction between the metal ions and the adsorbent material.
Figure 1d shows a picture of a final hydrogel, while Figure 1e depicts an optical microscope image (Nikon L-IM coupled with a Nikon camera, model DS-U1), where lines have a length (thickness) of about 200 µm. Other optical images are reported in Figure S1 of the Supporting Information.
The exposure time for each layer was 1 min, the number of layers in a filter was 10, and the distance between two adjacent layers was 300 µm.
Before the investigations, the hydrogels were cleaned in a solution of water for 72 h at room temperature and in the dark, with a changing of the water every 24 h to remove any unreacted LAP and/or PEGDA molecules. The hydrogels were used for the filtering tests without any further process.
Although the mechanical properties of the material are not strictly necessary for the purpose of the following work, preliminary investigations were carried out through stress–strain measurements obtaining a Young’s modulus equal to 14 MPa ± 2 MPa. Further investigations need to confirm this result.
2.4. Kinetics of Interaction, Filtering Tests, and Adsorption Thermodynamics
The interaction kinetics were carried out in a static condition and at room temperature (T = 25 °C). Two 3D filters (total mass on average 0.4 g) were immersed in a beaker containing 10 mL of Hg(II) polluted water at 8 mg/L for different times (from 0 to 24 h). The mercury concentration was measured using inductively coupled plasma-optical emission spectroscopy (ICP-OES). The minimum time to reach the maximum adsorption was estimated to be ~8 h of interaction. Subsequently, the Hg(II) filtering tests were carried out by changing the Hg(II) ions concentration from 2 mg/L to 20 mg/L for three different temperatures: T1 = 4 °C, T2 = 25 °C, and T3 = 50 °C. To evaluate and compare the adsorption capacities, the amount of metal ion adsorbed per unit mass of the sorbent (mg/g) was measured by using Equation (1) [72]:
where qe (mg/g) is the adsorption capacity at equilibrium, Ci and Ce, are the initial and equilibrium concentrations of metal ion (mg/L), respectively, V is the volume of adsorbate solution in liters, and m is the mass of the filter in gram. The Ci and Ce were measured by ICP-OES. The removal efficiency (RE) was calculated according to the Equation (2) [72]:
The release of Ag from the filter was also studied. The washing waters of filters were collected every 24 h for 3 days and, subsequently, the Ag concentration was measured by ICP-OES. The Ag-releasing tests showed that no silver was lost during the investigation, revealing that the AgNPs were firmly incorporated into the polymer matrix.
The adsorption thermodynamics were evaluated following the procedure shown in the literature [73].
2.5. Analytical Greenness Metric Calculation
According to the idea of Pena-Pereira F. and co-workers [74], we calculated the Analytical GREEnness metric (AGREE); this parameter focuses on making analytical procedures more environmentally benign and safer for humans. A detailed description of the AGREE metric is reported in the Supporting Information. Based on the 12 parameters, a score of 0.42 was calculated, which is in line with most of the literature [75,76,77,78,79].
2.6. Instrumentation
An Ultraviolet/Visible/Near infrared (UV/Vis/NIR) spectrophotometer (Lambda 750, Perkin Elmer, Shelton, CT, USA) was used to optically characterize the samples in the range of 300–700 nm.
The concentrations of Hg and Ag in the water were measured by ICP-OES (Avio 200, Perkin-Elmer). After a suitable calibration, Hg and Ag concentrations were analyzed using the 253.652 nm and 328.068 nm emission lines, respectively. All the tests were repeated three times. Detailed information about the calibration of the ICP-OES instrument is reported in the Supporting Information.
The viscosity of the photopolymerizable solution was measured by AR 2000ex rheometer (TA Instruments, New Castle, DE, USA), using a steady-state flow, applying a shear rate of 1.000 s−1, and the measures were in triplicate.
A Philips X-Pert Pro 500 (Amsterdam, The Netherlands) diffractometer X-ray diffraction (XRD) was performed using Cu Kα radiation (λ = 1.54056 Å) in the 5–90° 2θ range, with a 1 s counting time and 0.02° step size. A 3D-printed filter was first dried in an oven at 120 °C for 24h to remove completely the solvent, and then, the sample was ground to a fine powder. The morphology of the samples was investigated using a Zeiss Leo SUPRA™ 35 (Oberkochen, Germany) field emission scanning electron microscope (FE-SEM). SEM images are shown in the Supporting Information in Figure S2, while Figure S3 shows the XRD spectrum of a filter.
Fourier transform infrared (FT-IR) measurements were performed by a VECTOR 22 (Bruker, Billerica, MA, USA) FT-IR interferometer equipped with a deuterated triglycine sulfate detector operating in between 400 and 4000 cm−1, with a resolution of 1 cm−1. Reflection–absorption infrared spectroscopy (RAIRS) measurements were carried out with a Specac P/N 19,650 series monolayer/grazing angle accessory; spectra were collected at incidence angles of 70° with respect to the normal to the sample surface.
X-ray photoelectron spectroscopy (XPS) probed the chemical composition and molecular structure of the filters. XPS measurements were carried out on the PEGDA membranes doped with AgNPs before and after Hg(II) filtering tests. XPS analysis was performed with a custom-made instrument, having two separate chambers: one for the samples preparation and the second one for analyzing them in UHV (ultra-high vacuum). The latter is equipped with a six-degree-of-freedom manipulator and a hemispherical electron analyzer (mean radius = 150 mm) with a five-lens output system combined with a 16-channel detector, which gives a total instrument resolution of 1.0 eV as measured at the Ag 3d5/2 core level. Samples were degassed overnight into the preparation chamber, until the total pressure was about 10−8 Torr, before introducing them in the analysis chamber. A 10−8–10−9 Torr range was the typical vacuum pressure in the analysis chamber during the measurements. The non-monochromatized Mg Kα (1253.6 eV) was used as the X-ray radiation source. Calibration of the energy scale was accomplished by referencing the spectra to the C1s core level signal of aromatic C atoms, found at 284.70 eV, for all samples. Atomic ratio values were calculated from peak intensities divided by Scofield’s factors [80]. After subtraction of a Shirley-type background, the C1s, N1s, O1s, S2p, and Ag3d spectra were fitted by using Gaussian profiles as fitting functions. The S2p3/2, 1/2 doublets were fitted using the same full width at half-maximum (FWHM) for both components, a spin−orbit splitting of 1.2 eV, and a branching ratio (2p3/2/2p1/2) of 2. The Ag3d5/2, 3/2 doublets were fitted using the same FWHM for both components, a spin−orbit splitting of 6.0 eV, and a branching ratio (3d5/2/3d3/2) of 3/2. For the Hg4f7/2, 5/2 doublets, a spin−orbit splitting of 4.1 eV and a branching ratio (4f7/2/4f5/2) of 4/3 was selected. When several different species were identified in a spectrum, the same FWHM value was set for all single photoemission bands.
3. Results and Discussion
3.1. Optical Characterization
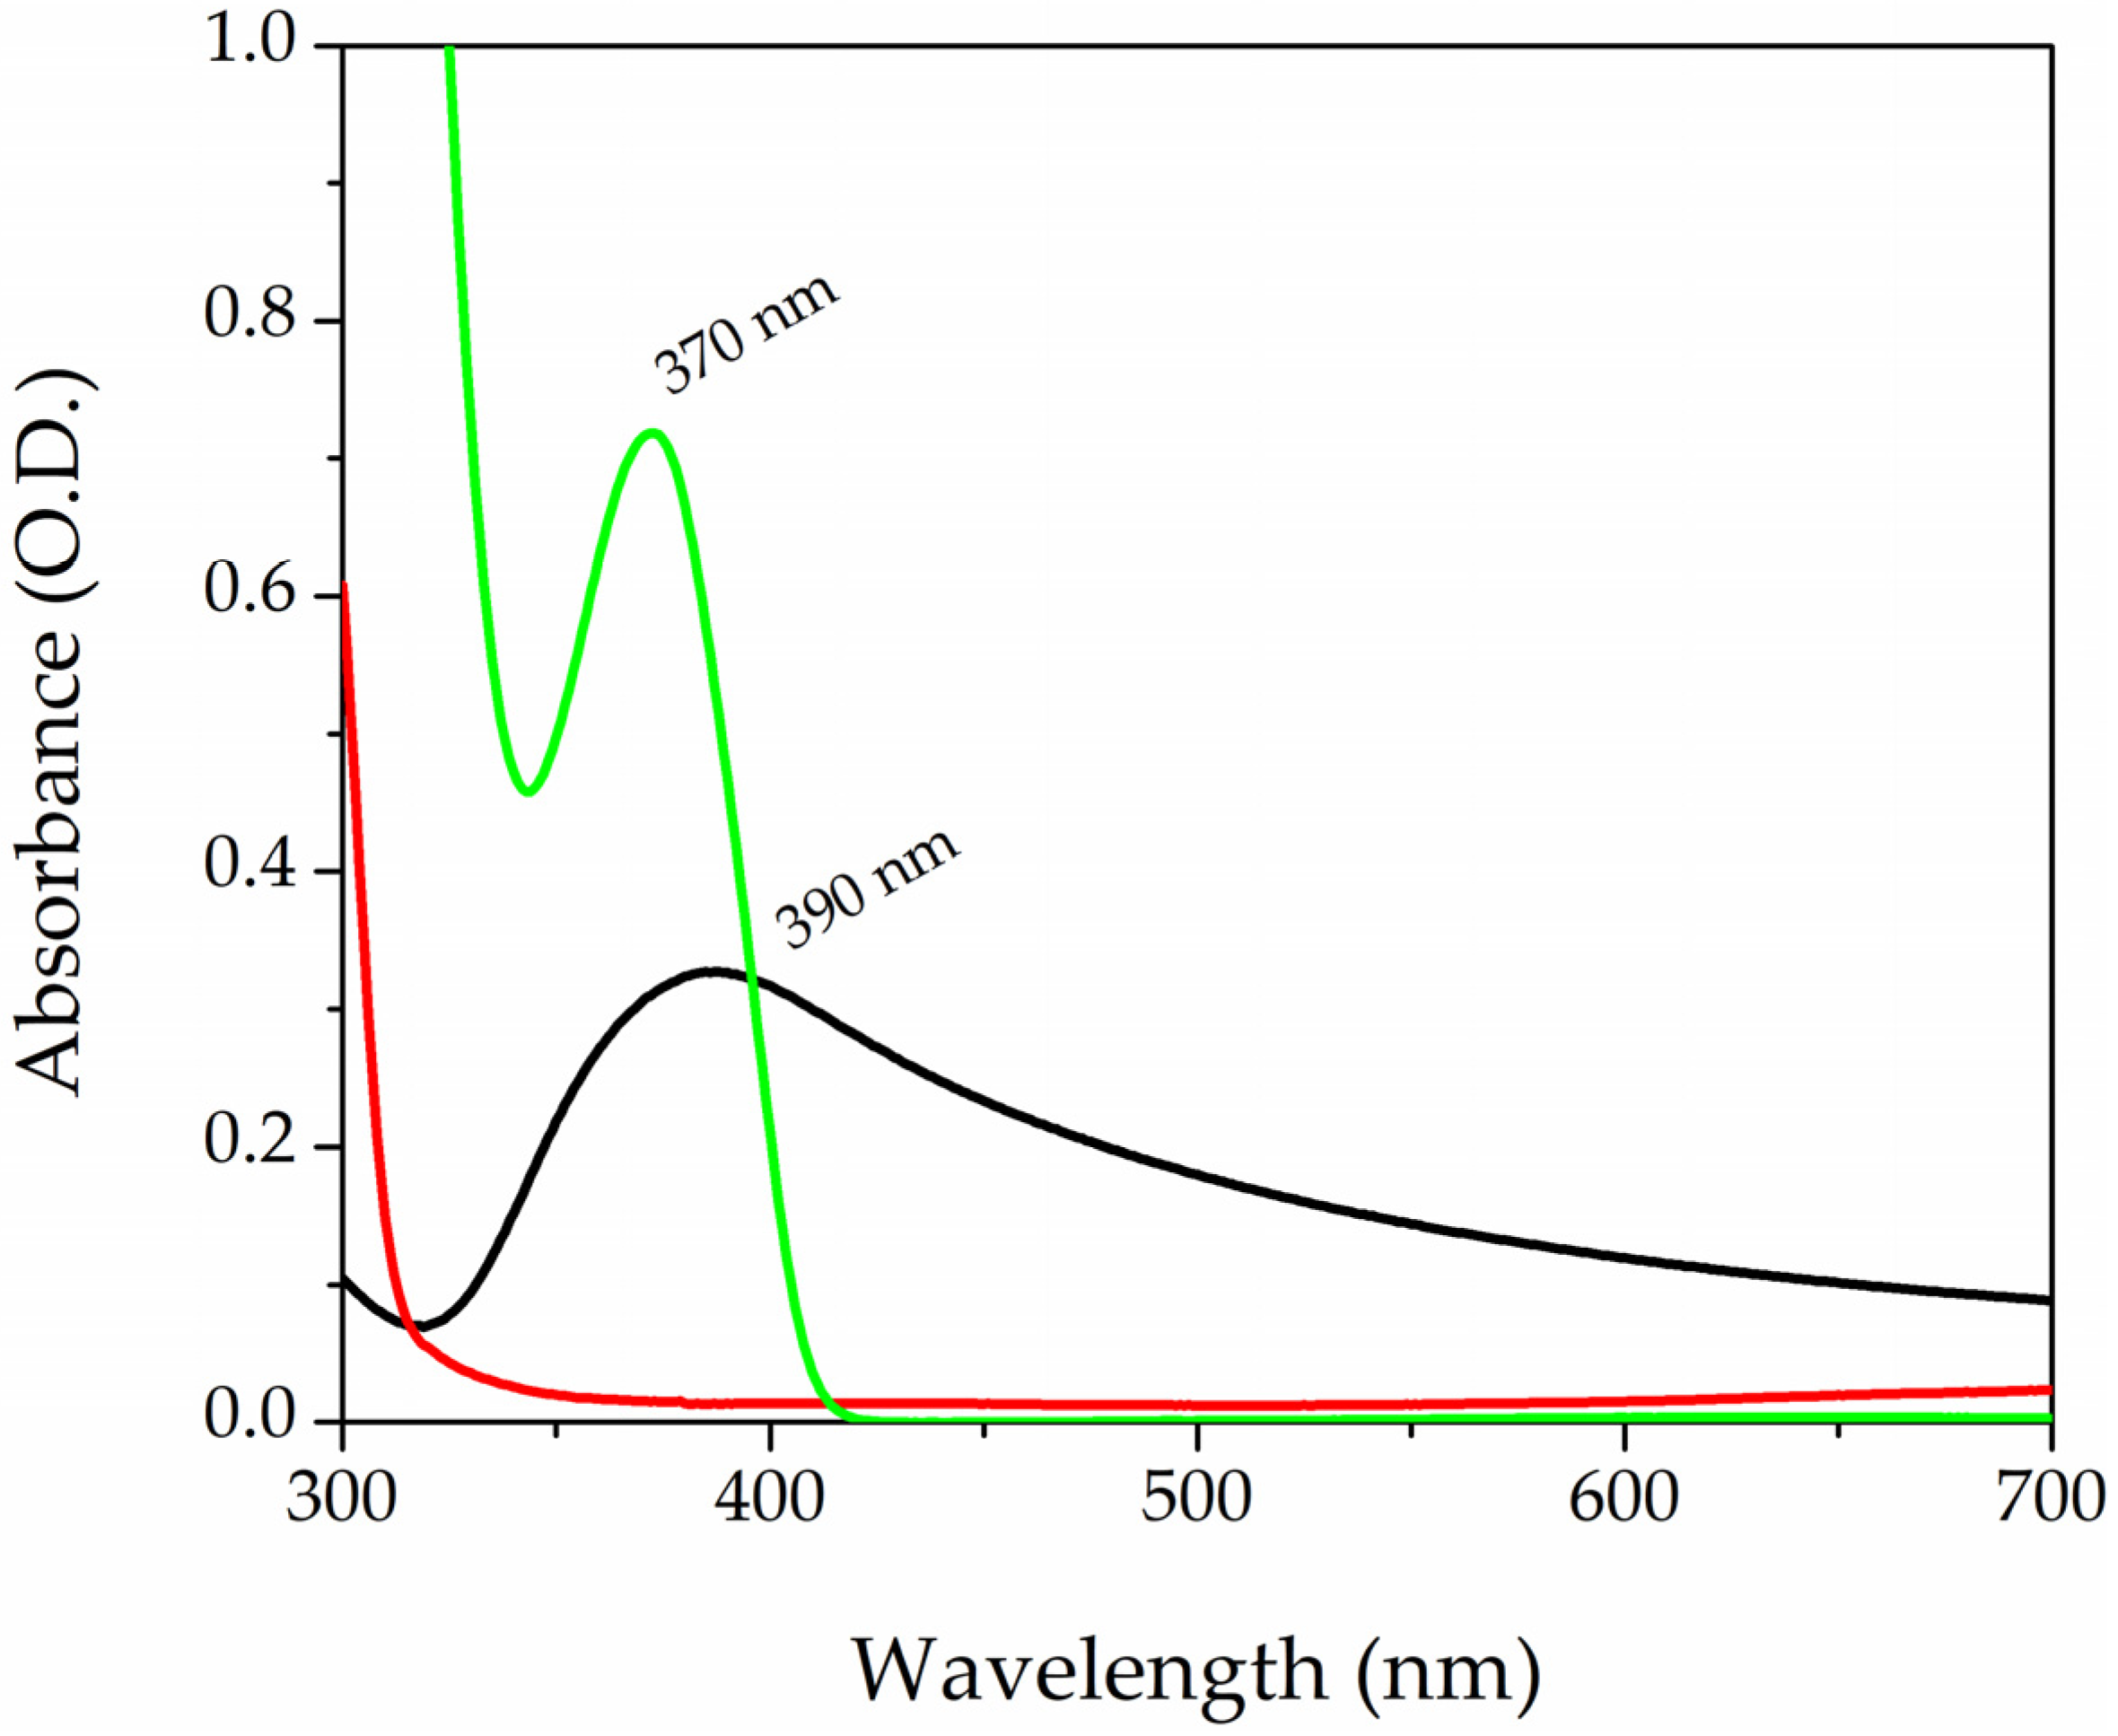
Figure 2 shows the absorption spectra of the three components of the photopolymerizable solution. The black curve refers to the AgNPs-cis-Lcys colloidal solutions, while the red and green lines correspond to PEGDA and LAP, respectively. AgNPs have a surface plasmon resonance (SPR) band centered at 390 nm, with an FWHM of 120 nm; these particles have a spherical shape and a mean diameter of 5 nm, as reported in the literature [71]. The PEGDA spectrum does not show any peaks in that range of wavelength. On the contrary, the LAP solution has a band peaked at 370 nm. The tail of the photoinitiator enters into the visible range, and this organic molecule is divided into radicals by exposition to visible light and starts the photopolymarizable reaction by opening the double bonds of the acrylate ends (R-C=C) of the PEGDA. Two PEGDA chains join together, forming a covalent bond R-C-C-R’ (yield of polymerization reaction was 90%, the detailed calculation is in the Supporting Information). A sketch of the process is reported in Figure S4 of the Supporting Information.
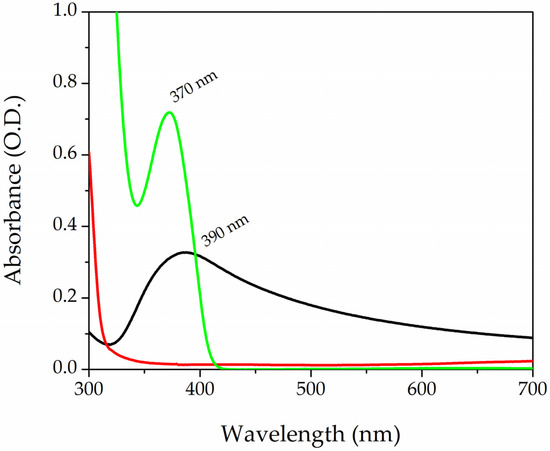
Figure 2.
UV-Vis absorption spectra of AgNPs-cit-Lcys (black curve) colloidal solution, PEGDA700 (red line), and LAP solution at the concentration of 0.1% in wt (green curve).
3.2. Molecular Structure and Chemical Composition: FT-IR and XPS Studies
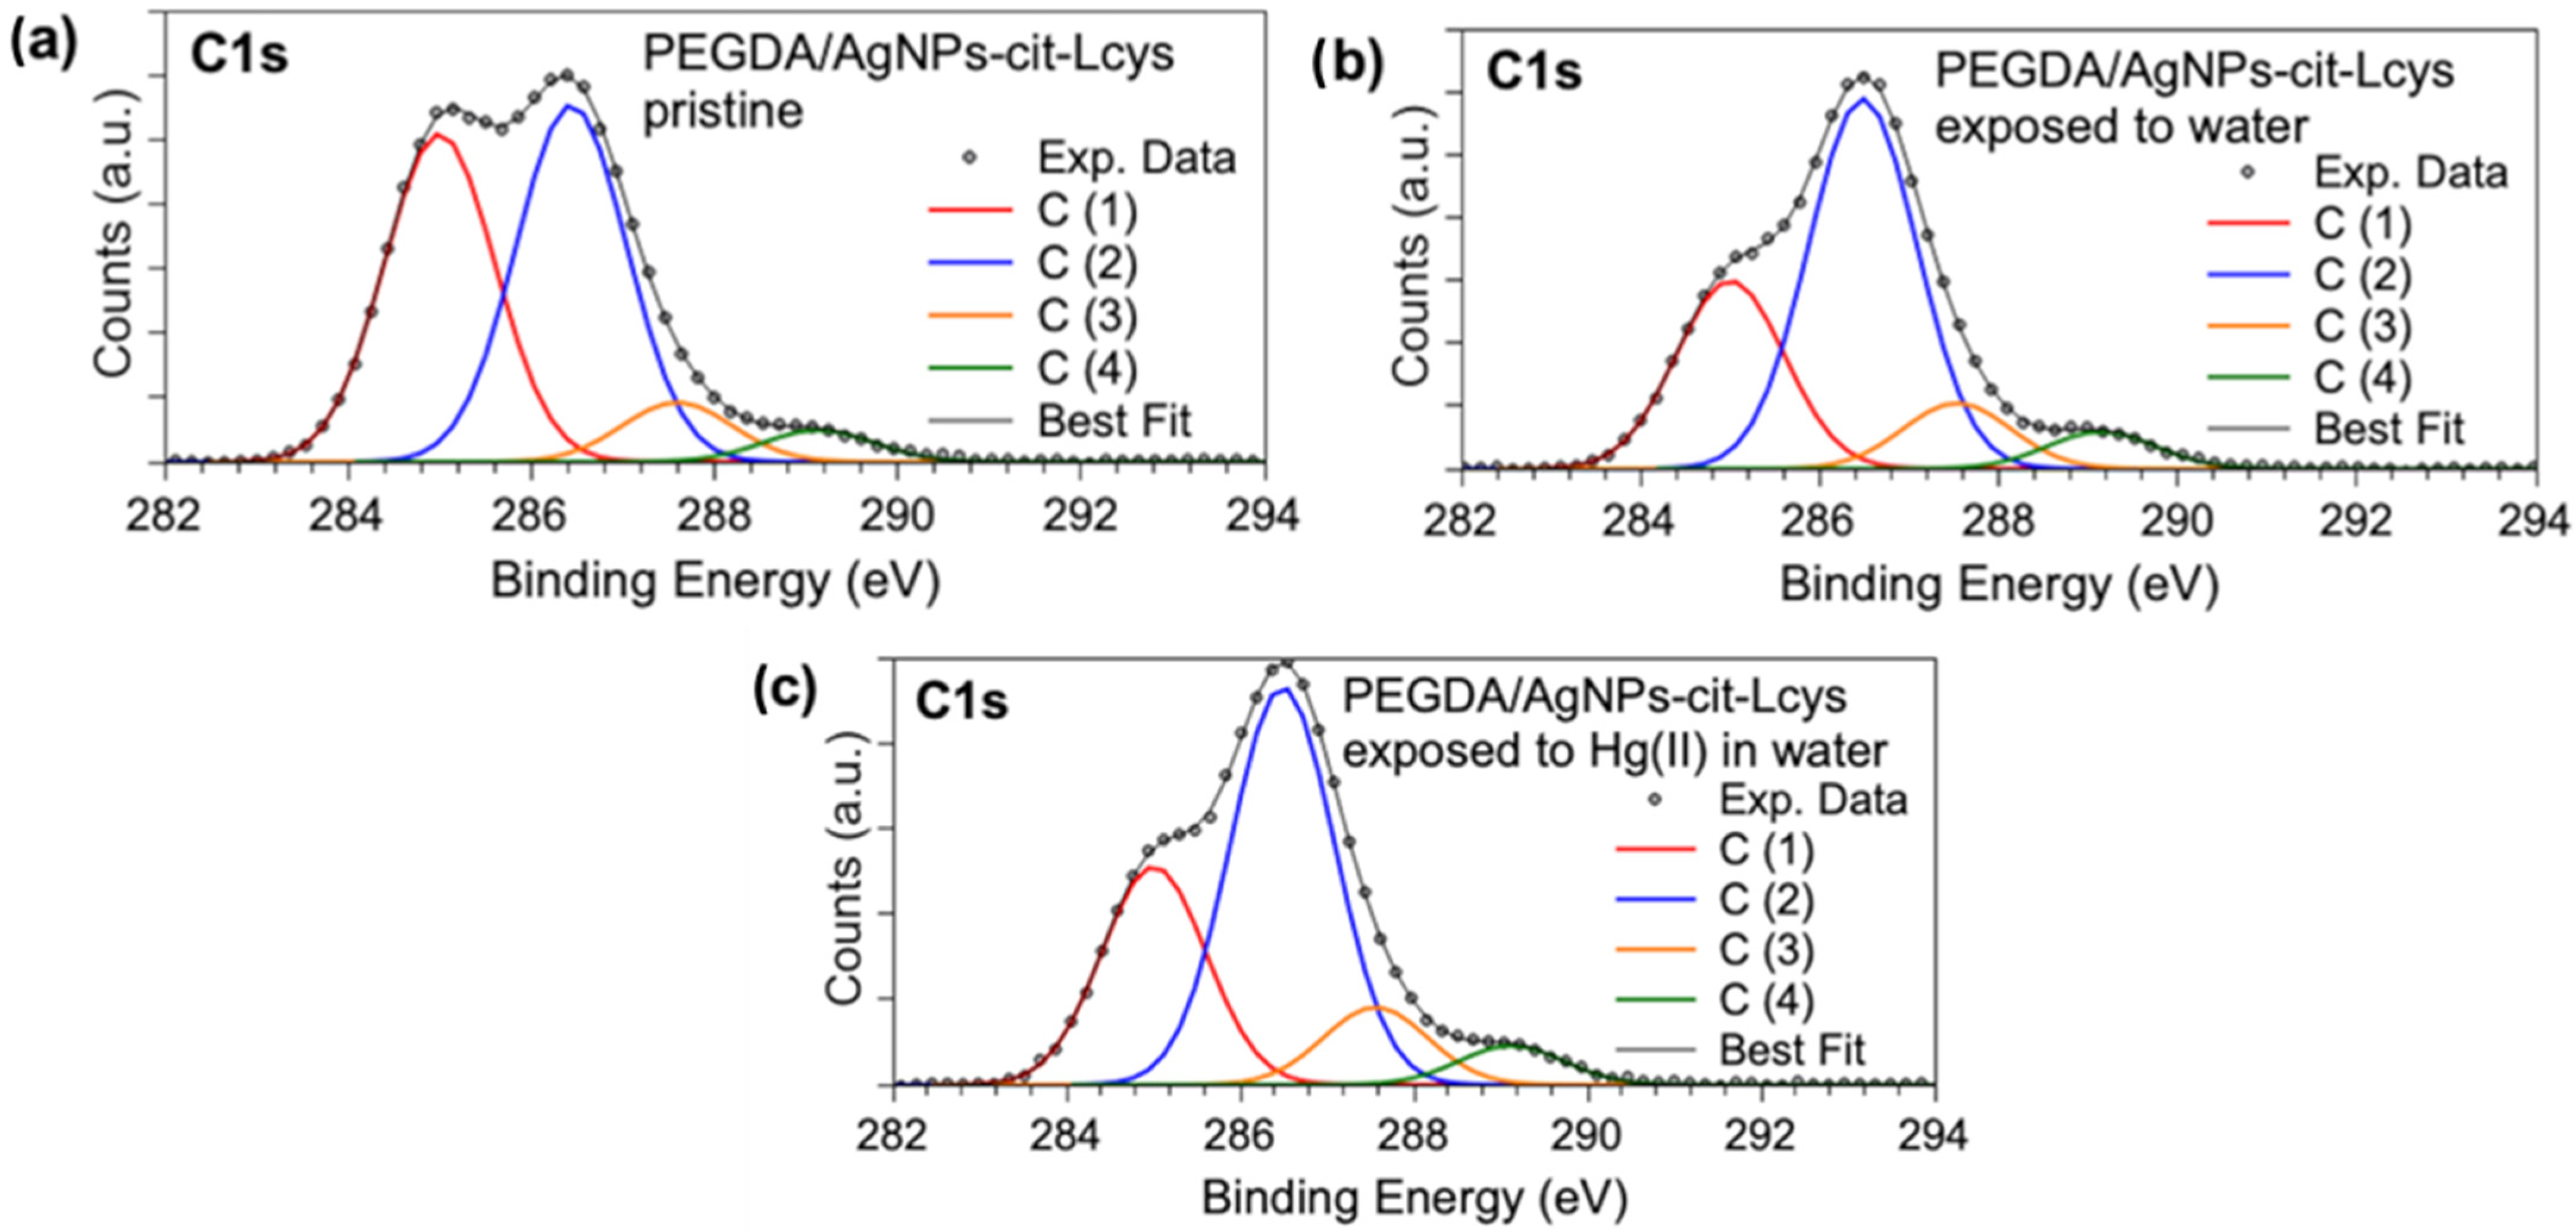
X-ray photoelectron spectroscopy measurements allowed for investigating the molecular structure and chemical composition of PEGDA filters enriched with silver nanoparticles. The core-level spectra acquired at the C1s, S2p, Ag3d, and Hg4f allowed for ascertaining the presence and stability of AgNPs-cit-Lcys on the surface of the PEGDA membranes, and they gave information about the presence of Hg after the filtering activity, as well as useful information about the heavy metal oxidation state. The binding energy (BE), FWHM, atomic ratio values, and proposed assignments for all the measured signals are reported in Table S1 in the Supporting Information; here, only the most indicative signals will be discussed. C1s XPS spectra (Figure 3a–c) display four components assigned, respectively, to aliphatic and aromatic C (C1, BE = 285.0 eV) and C-S of L-cysteine, C-N and C-O (C2, BE = 286.5 eV), C=O (C3, BE = 287.6 eV), and COOR (R = H, C) (C4, BE = 289.1 eV) functional groups. The relative intensities of C1s spectral components are stable in the three samples (see Table S1), confirming the chemical stability of the PEGDA/AgNPs-cit-Lcys membranes; the lowering of the C1 component intensity after the membranes’ immersion in water is probably due to the removal of the C-C contaminants that are always observed in samples prepared in air [81,82].
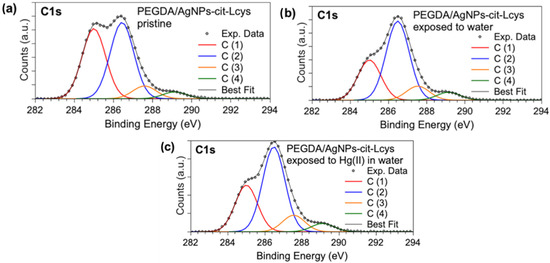
Figure 3.
XPS C1s core-level spectra collected on (a) pristine PEGDA/AgNPs-cit-Lcys, (b) PEGDA/AgNPs-cit-Lcys after immersion in water, (c) PEGDA/AgNPs-cit-Lcys after immersion in water containing 20 mg/L Hg(II).
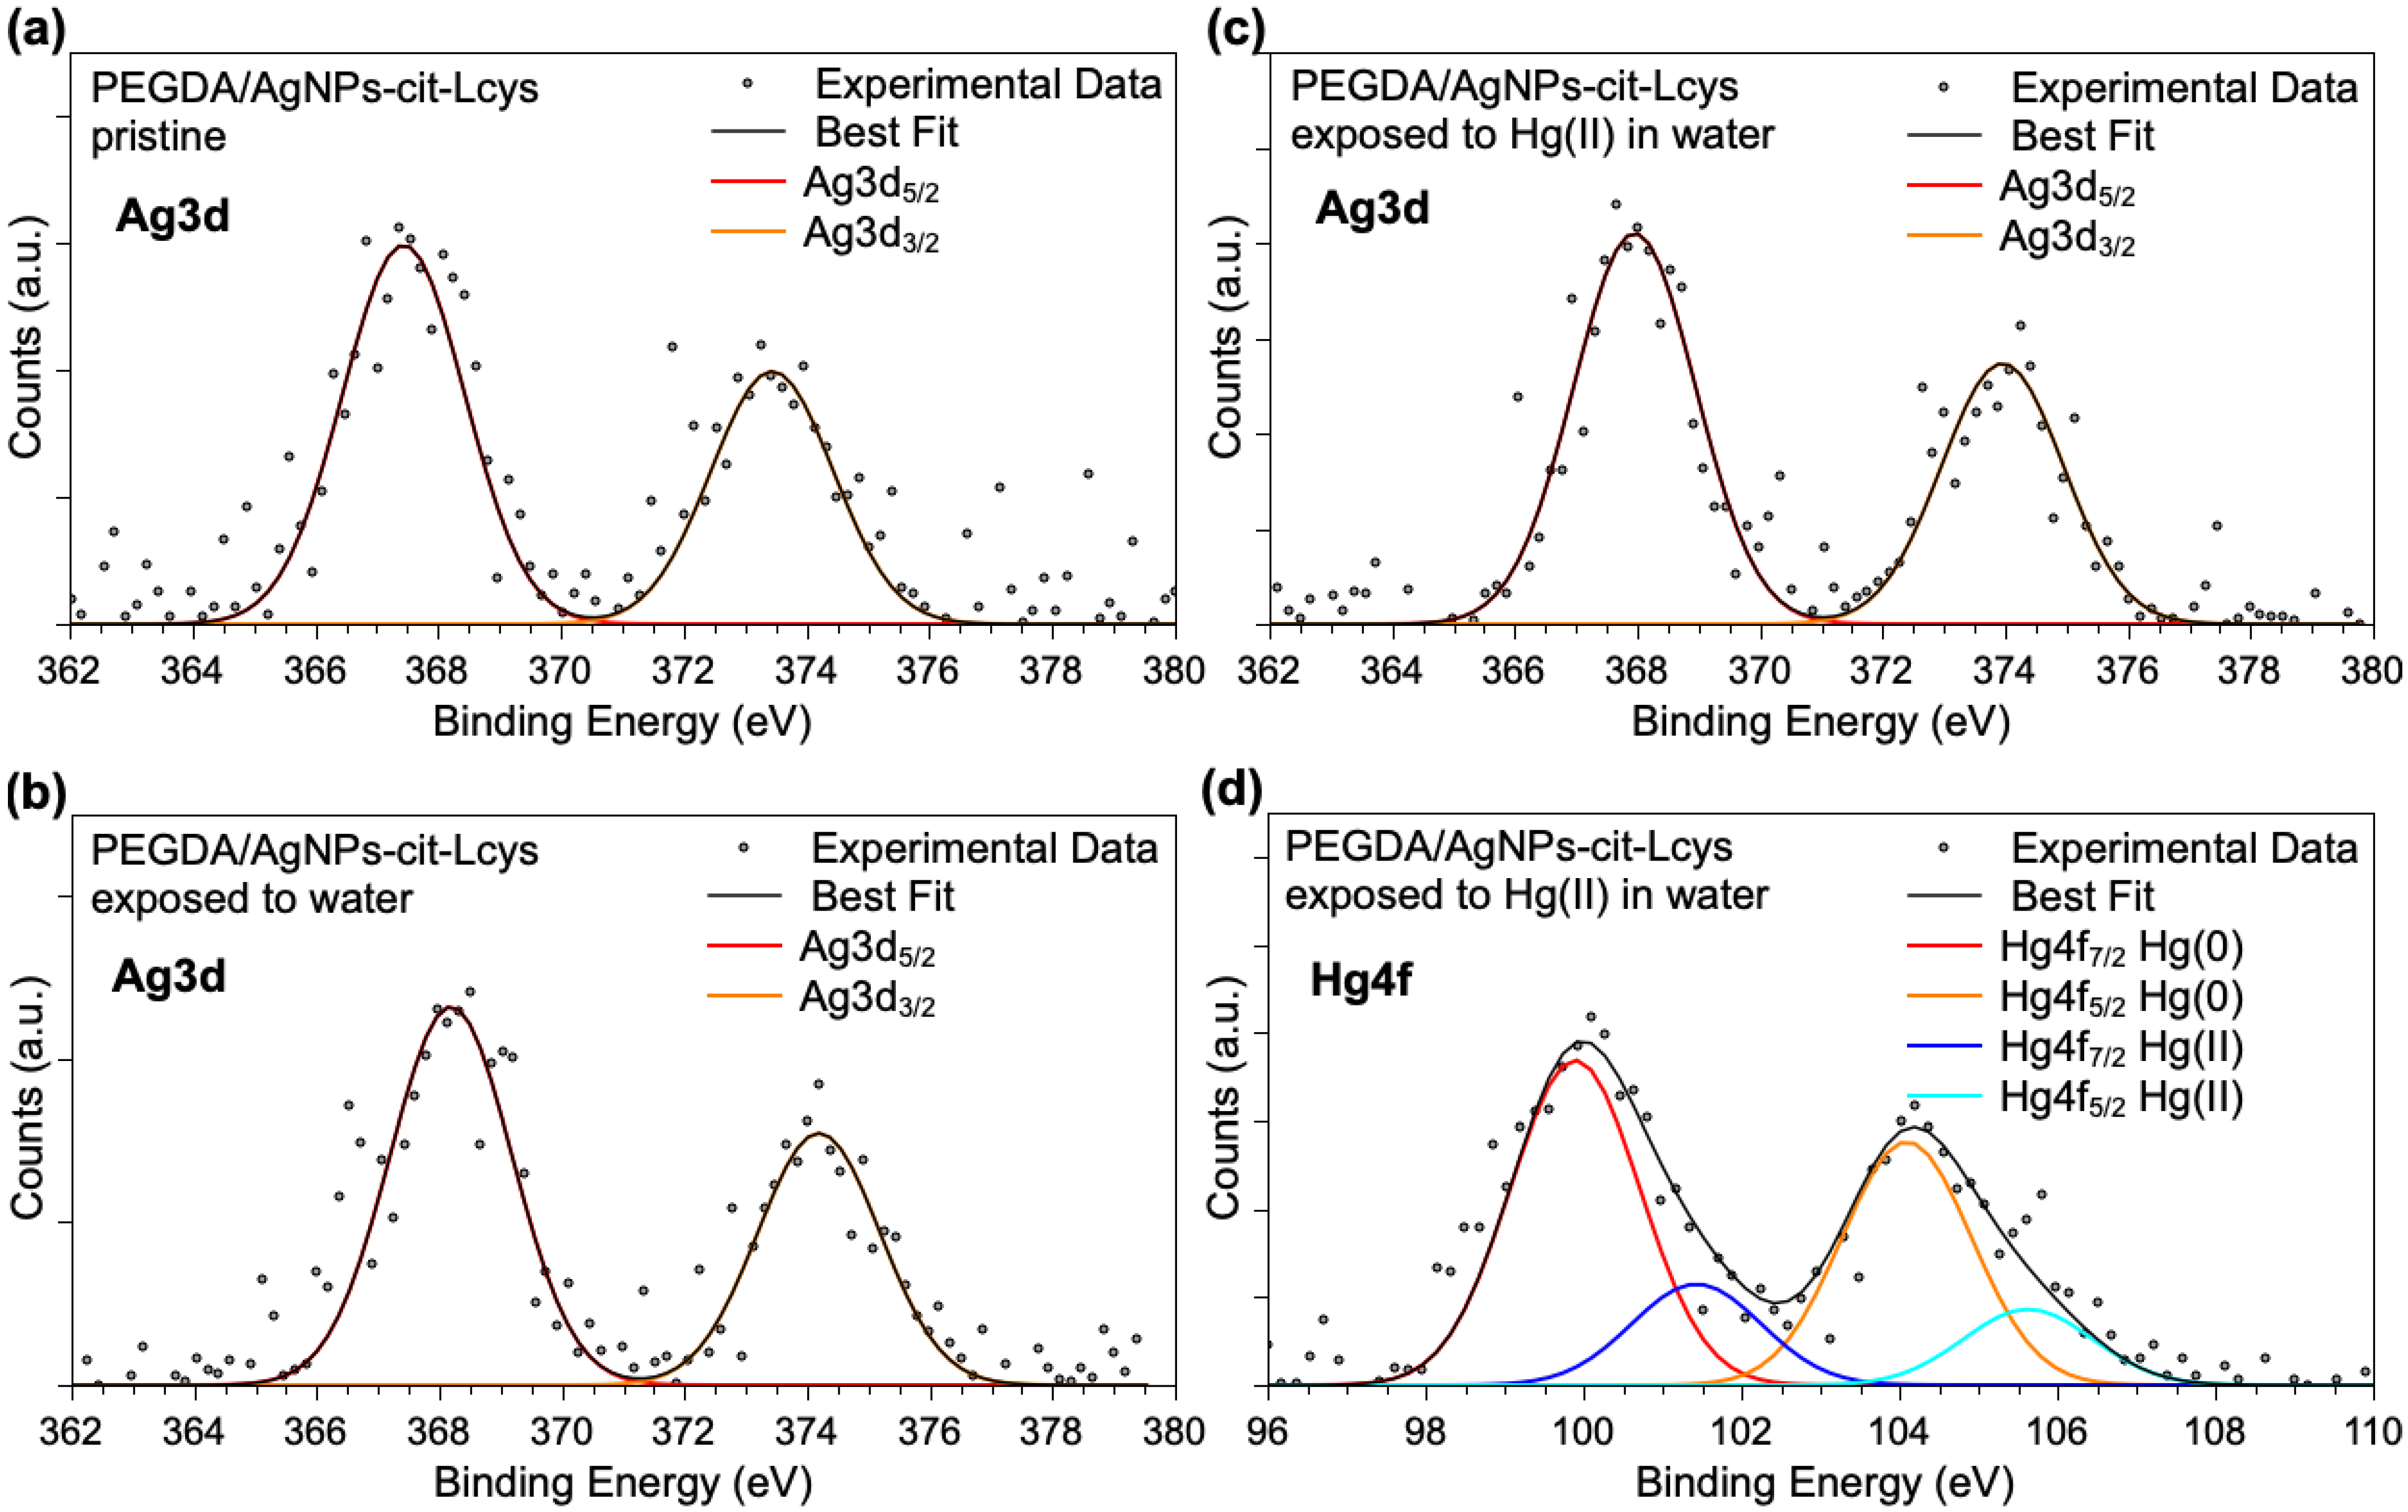
Ag3d and Hg4f spectra are shown in Figure 4. It is noteworthy that Ag3d spectra are analogous for the three samples, confirming the NPs’ stability in the PEGDA membrane also after immersion in water and exposure to Hg(II) ions. However, due to the very low intensity of the signals, the components individuated by applying a peak-fitting procedure would not be reliable, and only a main signal indicative for Ag atoms can be unambiguously pointed out (Ag3d5/2 BE = 368 eV). The Hg4f spectrum reported in Figure 4d as measured on the PEGDA/AgNPs-cit-Lcys after immersion in water containing 20 mg/L Hg(II) suggests that mercury ions are partially reduced by the interaction with silver nanoparticles, as already observed for similar systems. Actually, two spin–orbit pairs are observed: the first signal (Hg4f7/2 BE = 99.9 eV) is due to atomic Hg(0), probably forming an alloy with silver atoms, and the peaks at higher BE (Hg4f7/2 BE = 101.4 eV) are indicative for the presence of Hg(II) ions. This finding is not surprising, since in a previous work, we investigated in detail the interaction between free-standing hydrophilic silver nanoparticles and Hg(II) ions in water samples, revealing a redox activity leading to reduced Hg(0) and aggregated particles of mixed Hg(0)/Ag(0) [83]. This also suggests that PEGDA does not modify the AgNPs-Hg interaction mechanism.
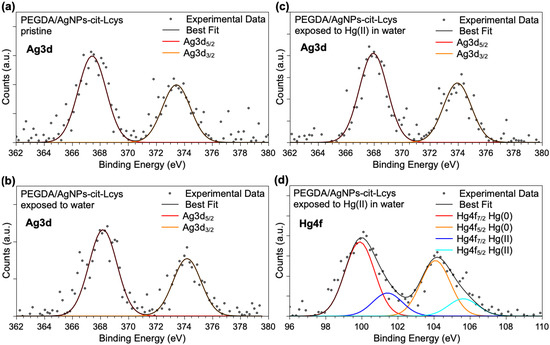
Figure 4.
XPS Ag3d core-level spectra collected on (a) pristine PEGDA/AgNPs-cit-Lcys, (b) PEGDA/AgNPs-cit-Lcys after immersion in water, (c) PEGDA/AgNPs-cit-Lcys after immersion in water containing 20 mg/L Hg(II), (d) Hg4f spectrum collected on PEGDA/AgNPs-cit-Lcys after immersion in water containing 20 mg/L Hg(II).
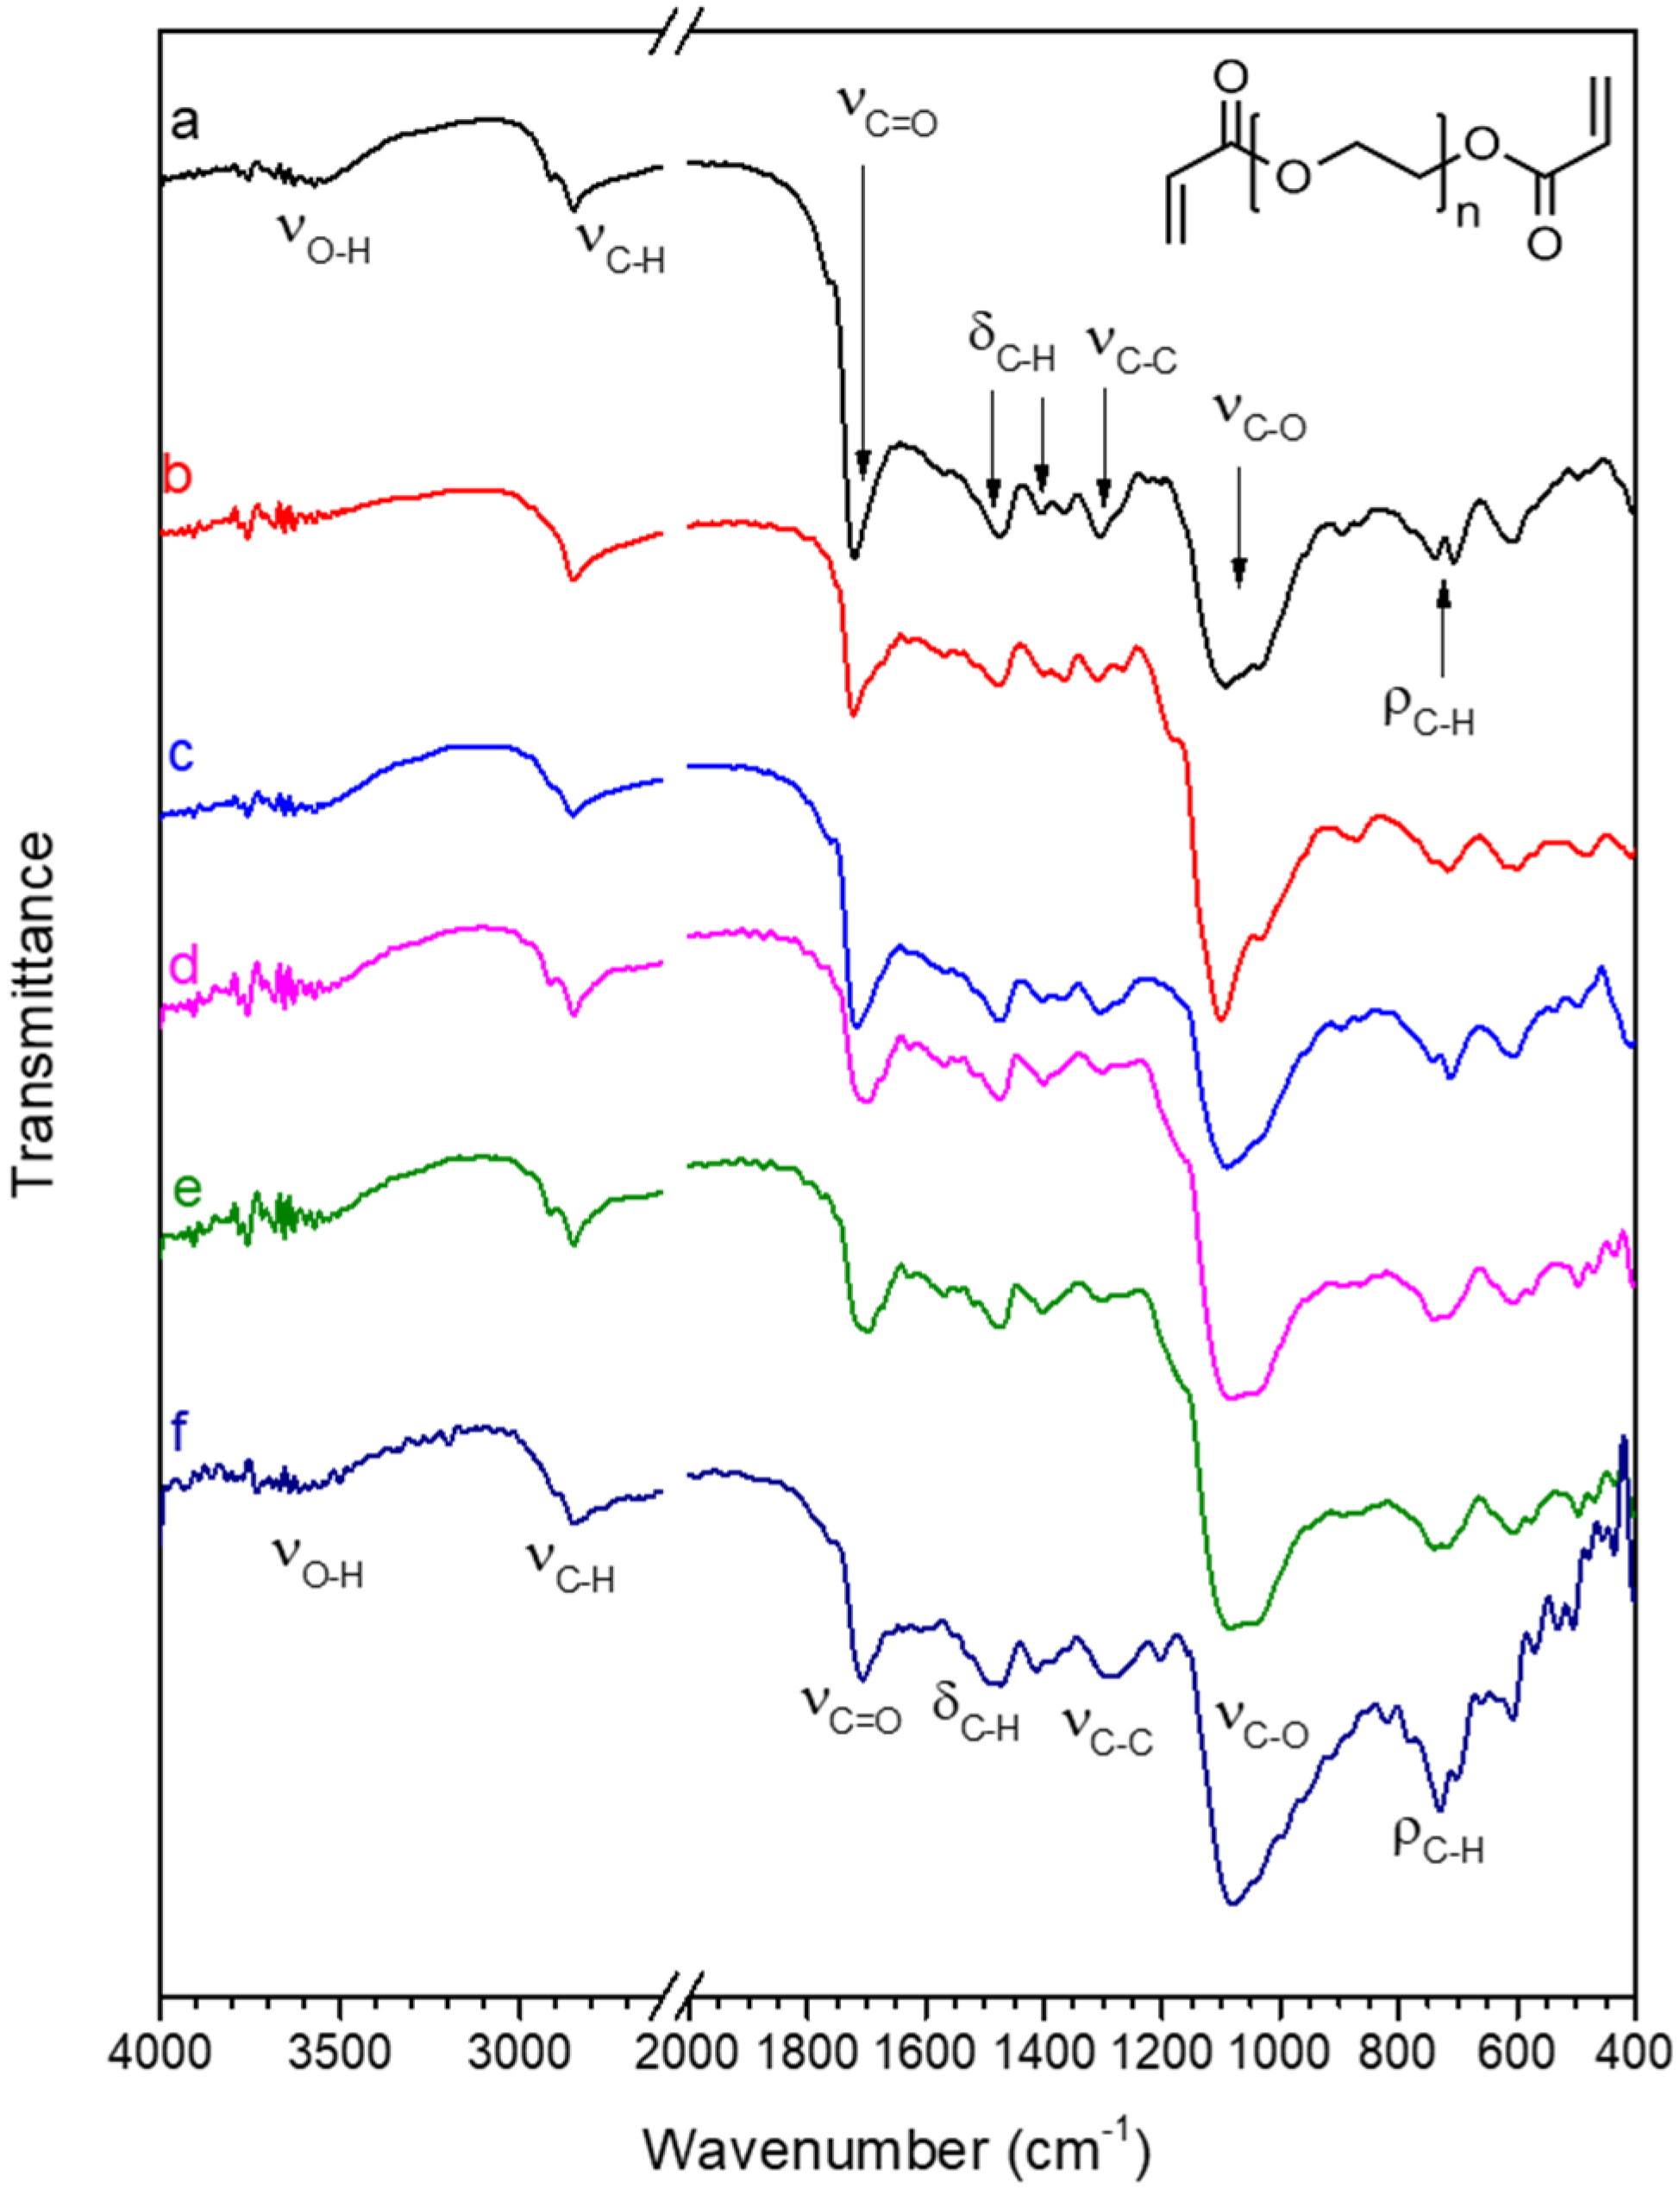
The FT-IR spectrum of pristine PEGDA, shown in Figure 5a, is in agreement with the spectra reported in the literature [84,85]; for clarity, Table 1 reports a summary of the main peak’s position and assignment. In the spectrum of PEGDA, most peaks are related to the PEG backbone. The peaks at 2920 and 2850 cm−1 (νC-H) are related to the stretching vibrations of aliphatic C-H bonds, peaks at 1470 and 1370 cm−1 (δC-H) are due to bending vibrations of aliphatic C-H, and the peaks at 710–730 cm−1 (ρC-H) to rocking vibrations of the methylene group. The most intense peak in the PEG spectrum is related to the C-O stretching vibration (νC-O 1090 cm−1), located in Figure 5a. The chemical structure of the PEGDA polymer shows two ester functional groups at the chain terminal, producing an intense C=O stretching peak (νC=O), located at 1725 cm−1 in Figure 5a, and a lower intensity peak at about 1300 cm−1 (νC-O), related to stretching vibrations of C-O bonds that are part of the ester function [86]. Since the C=O stretching vibration (νC=O) is due to the chain terminals and the PEG-type C-O stretching vibration (νC-O, 1090 cm−1) to the chain backbone, the higher the intensity ratio between νC=O and νC-O, the shorter the chain length of the PEG backbone. A low-intensity O-H stretching peak at about 3600 cm−1 (νO-H) can be due to physisorbed water.
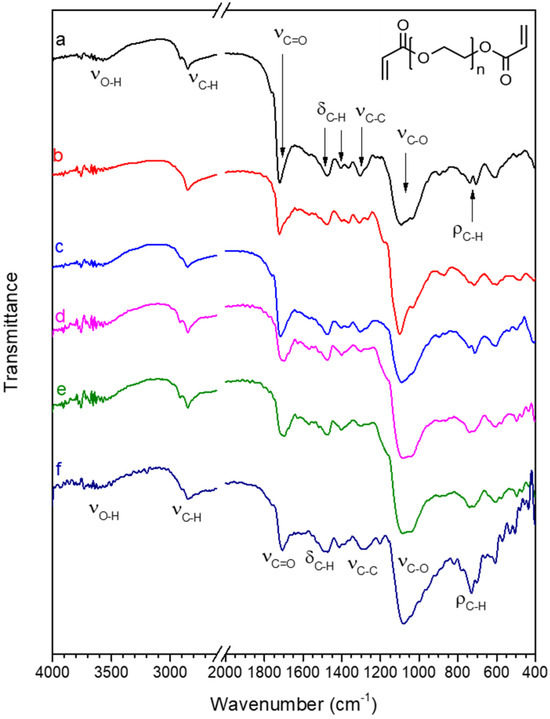
Figure 5.
FT-IR spectra in the 4000–2600 and 2000–400 cm−1 range of (a) pristine PEGDA; (b) PEGDA after 24 h immersion in water; (c) PEGDA after 24 h immersion in water containing 20 mg/L Hg(II); (d) PEGDA/AgNPs-cit-Lcys; (e) PEGDA/AgNPs-cit-Lcys after 24 h immersion in water; (f) PEGDA/AgNPs-cit-Lcys after immersion in water containing 20 mg/L Hg(II). The chemical structure of PEGDA is also shown in the top right corner of the figure.

Table 1.
Position (in cm−1) and assignment of the main peaks in the FT-IR spectra are shown in Figure 5.
Treatment with water does not alter the structure of PEGDA, since in the spectrum of PEGDA after 24 h immersion in water (spectrum b), peaks are found in the same position of the pristine sample spectrum. The spectrum of PEGDA after immersion in water containing Hg(II) (spectrum c) also shows that the structure of PEGDA remains unaltered by the treatment.
The incorporation of silver nanoparticles in the PEGDA membrane to produce sample PEGDA/AgNPs-cit-Lcys (spectrum d) does not alter the chemical structure of PEGDA, and the PEGDA/AgNPs-cit-Lcys membrane appears stable even after immersion in pure water (spectrum e) and in water containing Hg(II) (spectrum f). These results confirm that the Hg(II) ions do not preferentially interact with PEGDA chains.
3.3. Effect on Mercury Ions Concentration: Adsorption Isotherms
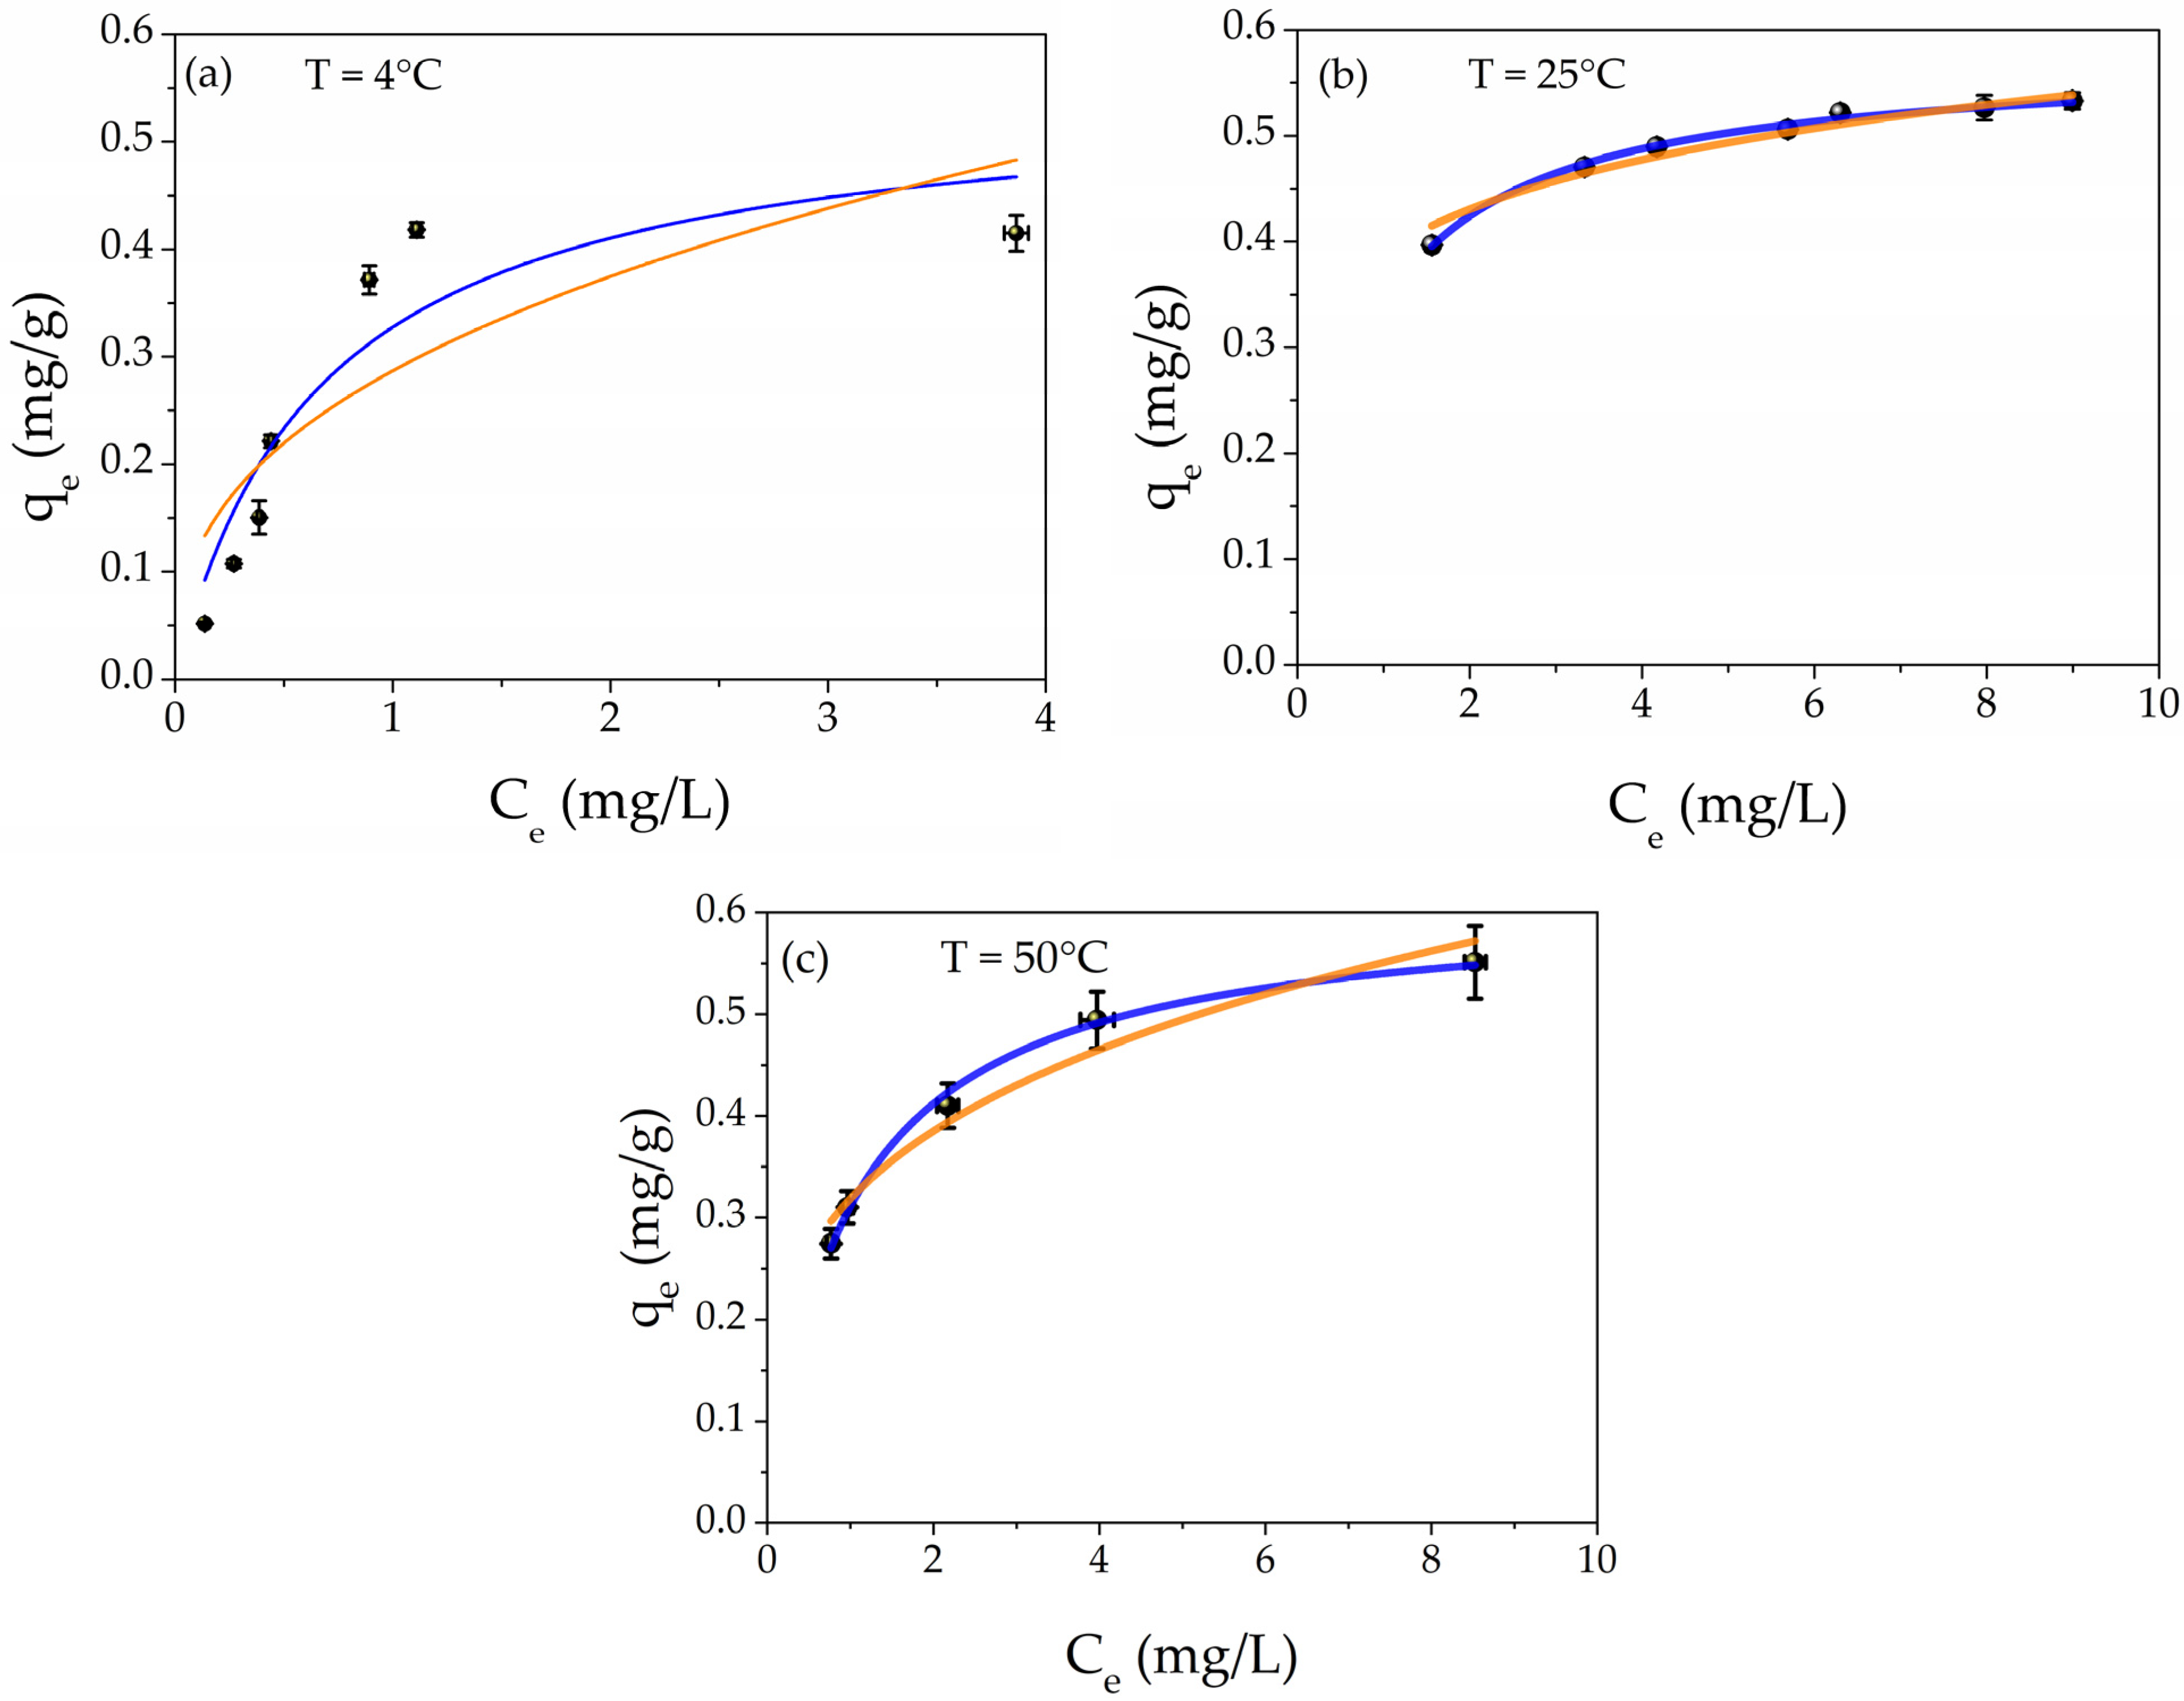
The adsorption capacity study was carried out by using different aqueous concentrations of Hg(II) from 2 to 20 mg/L. Figure 6 depicts the adsorption capacities (black points) as a function of the Hg(II) equilibrium concentration at different temperatures T = 4 °C, T = 25 °C, and 50 °C, respectively. In addition, the best fit of the experimental points is presented. The orange line is the Freundlich isotherm; meanwhile, the blue curve represents the Langmuir model.
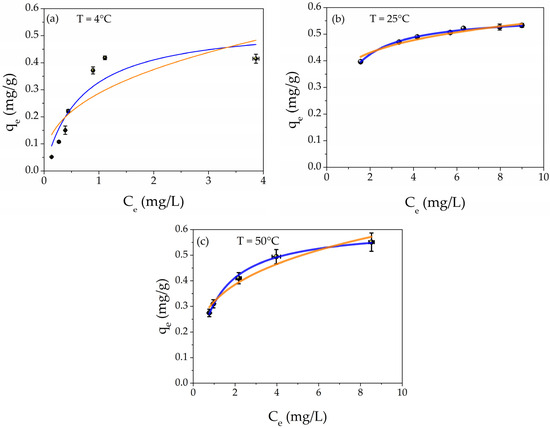
Figure 6.
Plot of adsorption capacity (qe) as a function of equilibrium concentration Ce at different temperatures: (a) T = 4 °C, (b) T = 25 °C, and (c) T = 50 °C; the isotherm best fits are also shown in the graphs: orange line Freundlich and blue line Langmuir models, respectively.
The Freundlich isotherm is defined by Equation (3) [87]:
where, KF is Freundlich’s coefficient and is related to the adsorption capacity, while n is a number related to the strength constant of the isotherm model.
The Langmuir isotherm is defined according to Equation (4) [87]:
where qm (mg/g) is the maximum adsorption capacity and KL (L/mg) is the Langmuir isotherm constant. The qe and Ce parameters have the same meaning as those in Equation (1). The chemo-physical meanings of the two isotherms are explained in the literature [87,88]. Briefly, the Freundlich isotherm model describes the physisorption process, while the Langmuir isotherm refers to the chemisorption phenomenon.
The parameters obtained by the best fits are listed in Table 2 for all temperatures. For each temperature, it is possible to notice that the R2 values of Langmuir isotherms are higher than those of Freundlich models, confirming the chemisorption nature of the mechanism. In addition, the maximum adsorption value (qm) increases with the increasing temperature, from 0.55 mg/g to 0.61 mg/g for 4 °C and 50 °C, respectively. This result indicates that the enhancement of the provided energy encourages the adsorption of Hg(II) into the metal core of AgNPs, forming the amalgam Hg/Ag, as reported in the XPS study and our previous research [68,83]. A comparison with the literature [66,67,68,69,70] about the performance of filtration toward heavy metal ions is reported in Table S2 of the Supporting Information.
Table 2.
Isotherm parameters determined by fitting the experimental points.
The removal efficiency was calculated according to Formula (2). For the temperatures of 4 °C, 25 °C, and 50 °C, they were 94%, 94%, and 86%, respectively; these values were determined by averaging the removal efficiencies over the range of 2–20 mg/L at the three different temperatures. The values show that the RE is almost constant in this temperature range (the calculated error was 5% as the standard deviation).
3.4. Adsorption Thermodynamics
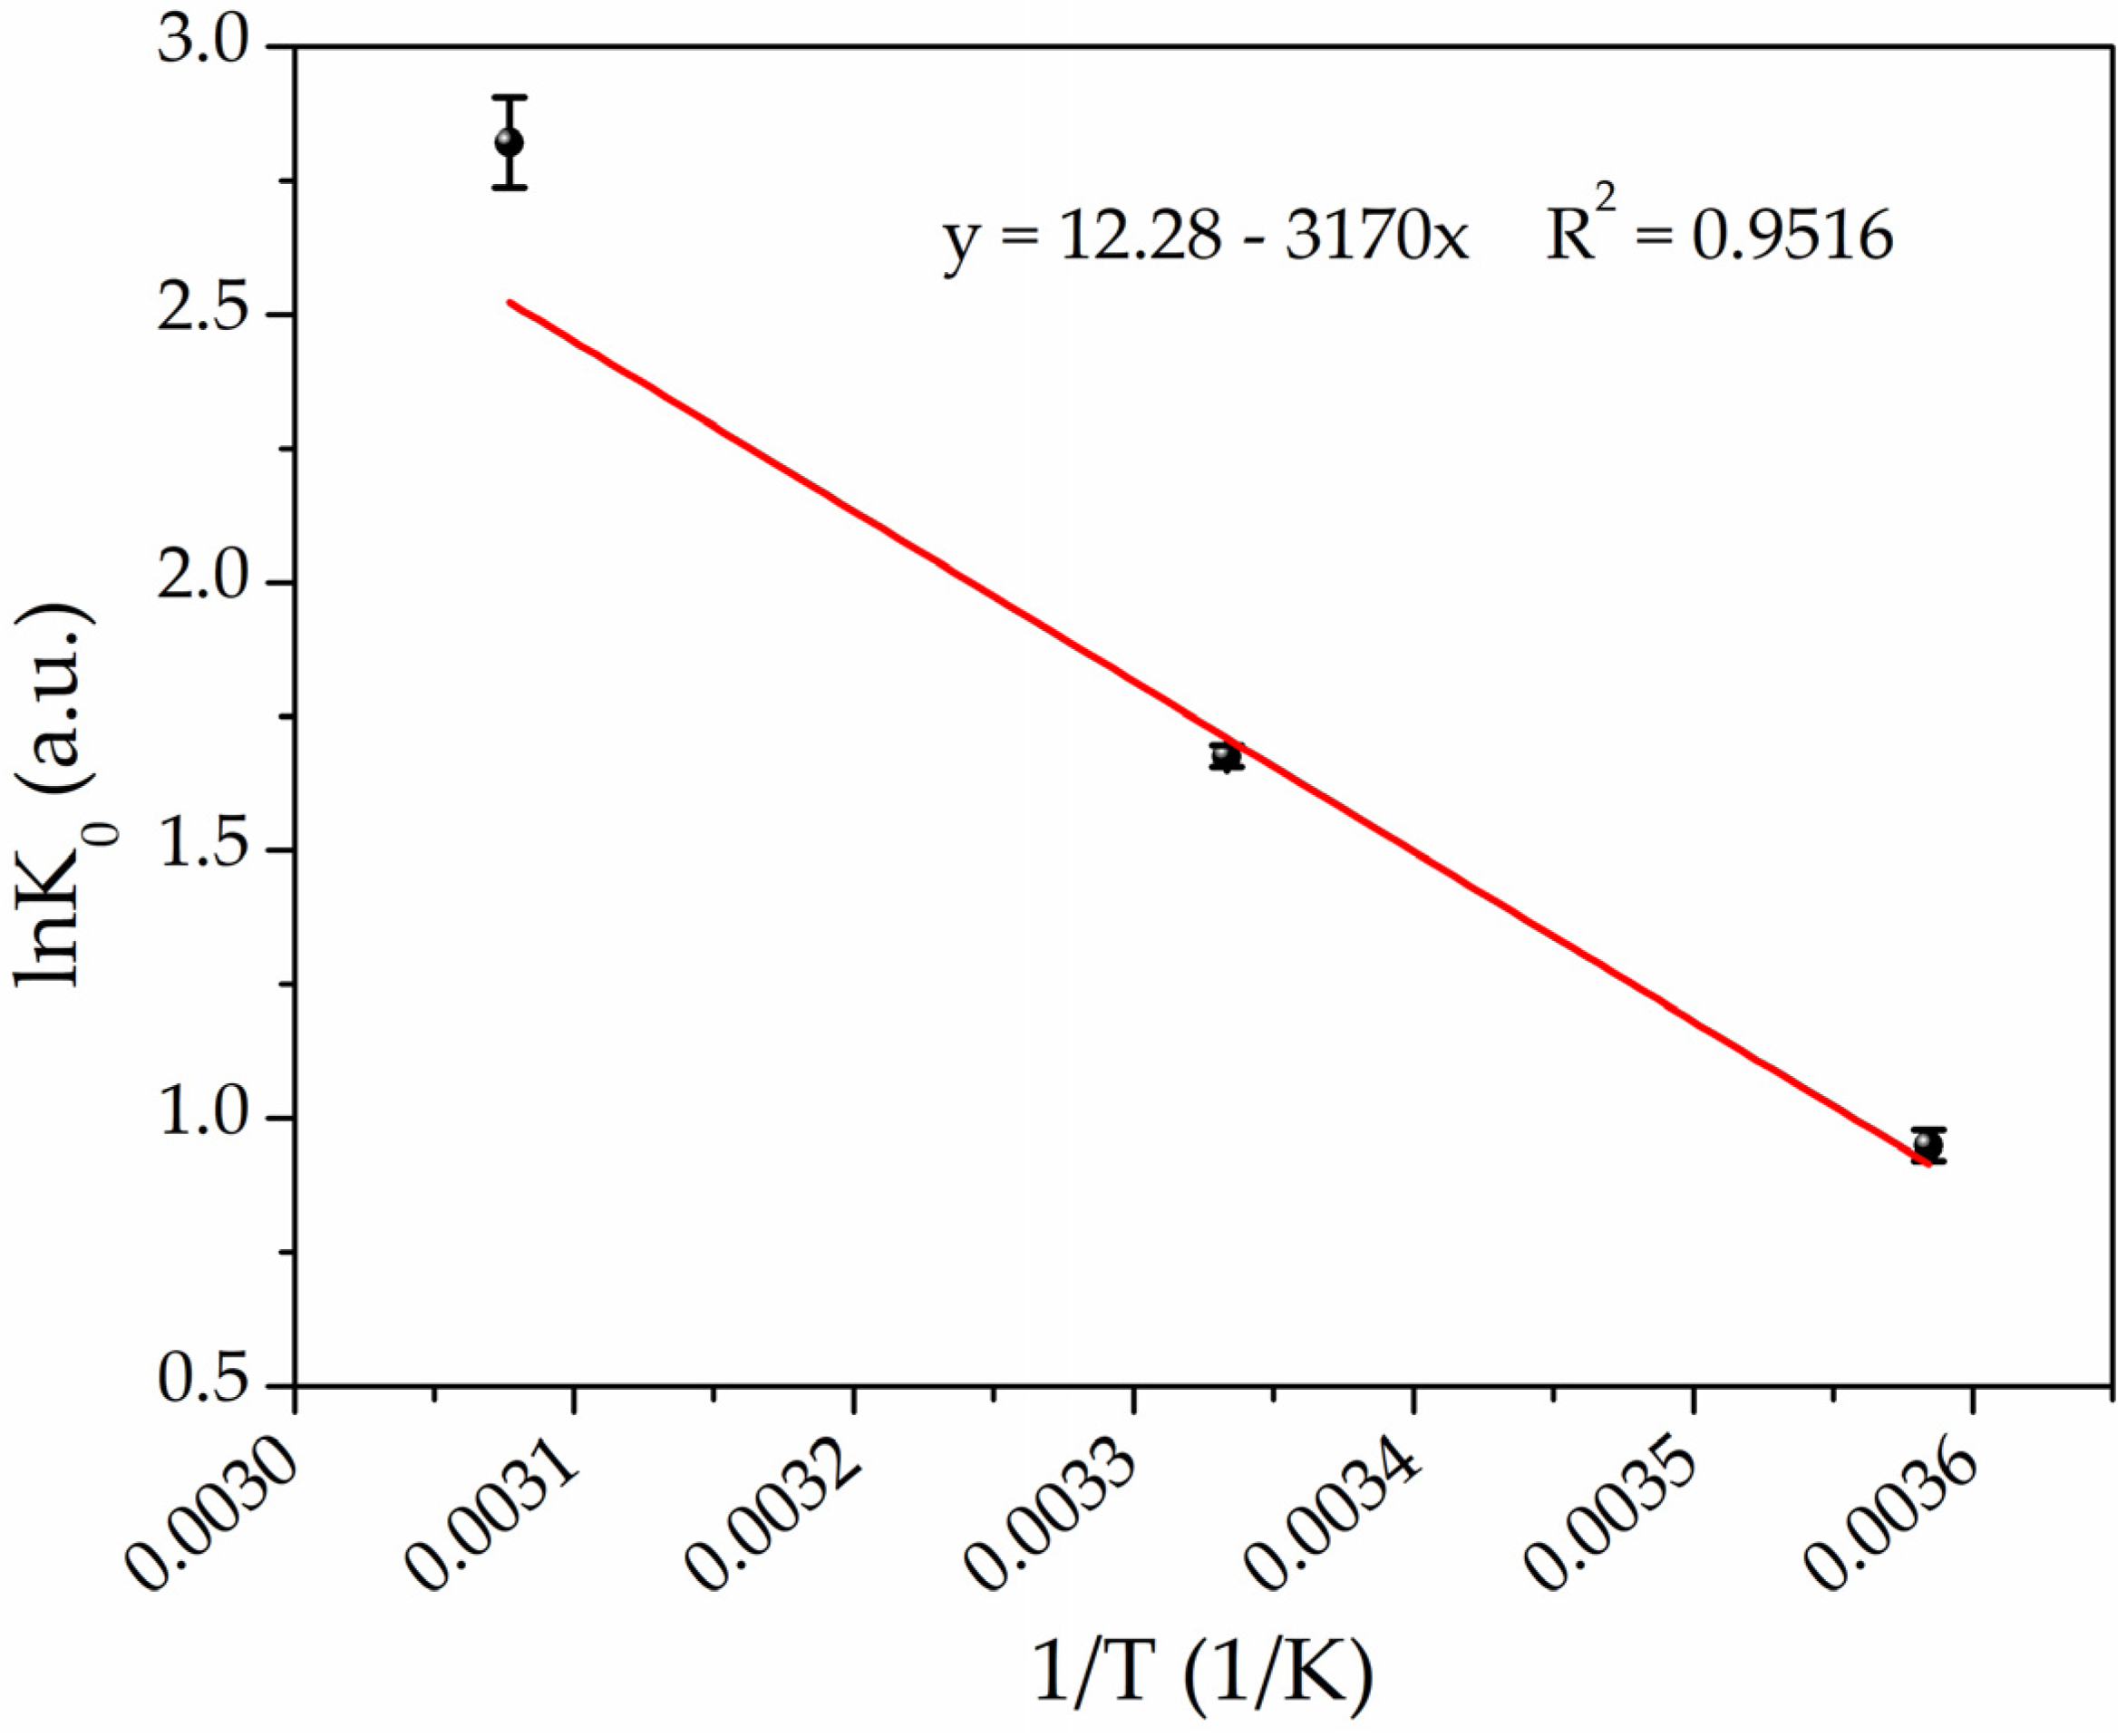
The thermodynamic parameters were calculated by following the method described in the literature [73,89]. Briefly, the adsorption isotherms at the three temperatures were plotted as ln(qe/Ce) as a function of qe. Subsequently, linear regressions were performed to determine the intercept, which represents the lnK0, where K0 is the thermodynamic equilibrium constant. ΔG0 was calculated by following Equation (5) [73]:
where R is the universal gas constant [8.314 J/(mol·K)], and T is the temperature in Kelvin. Subsequently, by plotting lnK0 versus 1/T (Van’t Hoff plot) as shown in Figure 7, it is possible to determine the enthalpy (ΔH0) and entropy (ΔS0) changes from the slope and intercept, respectively, by fitting the experimental data according to Equation (6) [73]:
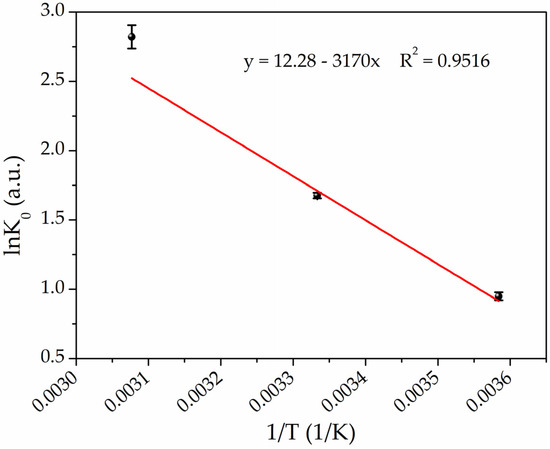
Figure 7.
Van’t Hoff plot for the adsorption of Hg(II) on PEGDA/AgNPs-cit-Lcys at the temperatures of 4 °C, 25 °C, and 50 °C (black points refer to experimental data, while red line represents the best fit).
The thermodynamic parameters are listed in Table 3. The negative values of ΔG0 confirm that the adsorption is spontaneous, and the negative increases of ΔG0 values with the increasing temperature indicate that the adsorption reactions are thermodynamically more favorable at higher temperatures. The observed positive enthalpy change (ΔH0 = 26.36 kJ/mol) confirms that the adsorption process is endothermic, and the positive ΔS0 value [102.09 J/(mol·K)] indicates that the adsorption is driven by entropy change, which means that the nature of the adsorbate or adsorbent has been changed in the process of adsorption (amalgamation) [89,90].
Table 3.
Thermodynamic parameters of the Hg(II) adsorption onto PEGDA/AgNPs-cit-Lcys at different temperatures.
3.5. Effect on Contact Time: Adsorption Kinetics
The effect on contact time was studied by measuring the concentration of Hg(II) ions of the treated solutions at different times. Figure 8 shows the adsorption data of Hg(II) by PEGDA doped with AgNPs-cit-Lcys at different times (black points), and the adsorption capacity reaches the equilibrium value (qe, exp. = 0.21 mg/g, average value of the last five points) in about 8 h. The experimental data were fitted by using different kinetic models: pseudo-first order (PFO, red line), pseudo-second order (PSO, blue line), and mixed order (MO, green line) developed by X. Guo and J. Wang [91,92]. The analytical formulas of these models are collected and explained in detail in the literature [91,92]. To understand the adsorption kinetics of our system, the conditions of applicability of the models have to be considered. For the PFO, three conditions can occur: the initial concentration of pollutant is higher than the active sites, at the initial stage of adsorption, the occupation of active sites of the adsorbent is almost zero, and finally, the number of active sites is low. Also in the case of the PSO, three conditions can describe the process: the initial concentration of pollutant is low, the final step of the process is the adsorption on the active sites, and the number of active sites is higher than the ions [92]. These two models only describe some particular conditions and not the overall adsorption process which can be more complex; indeed, the conditions of a real adsorption process change during the process itself. On the contrary, the MO model takes into account the entire adsorption process and it can represent the conditions at any stage of the adsorption process. Moreover, the limiting step can be the diffusion of the ions and/or the adsorption of them on the active sites, and finally, the pollutant’s initial concentration is arbitrary.
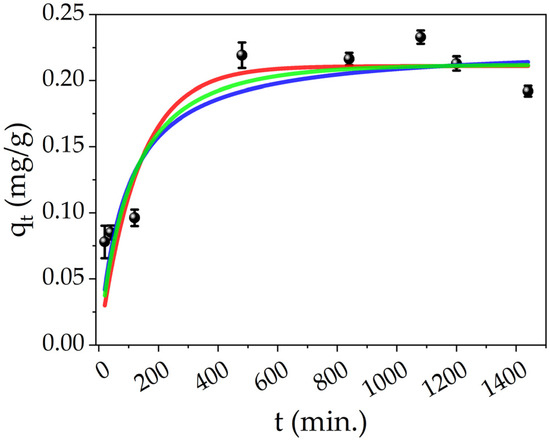
Figure 8.
Effect of contact time on the Hg(II) adsorption onto PEGDA/AgNPs-cit-Lcys (black points), fittings of different kinetic models for Hg(II) adsorption on PEGDA/AgNPs-cit-Lcys: PFO (red line), PSO (blue line) and MO (green line).
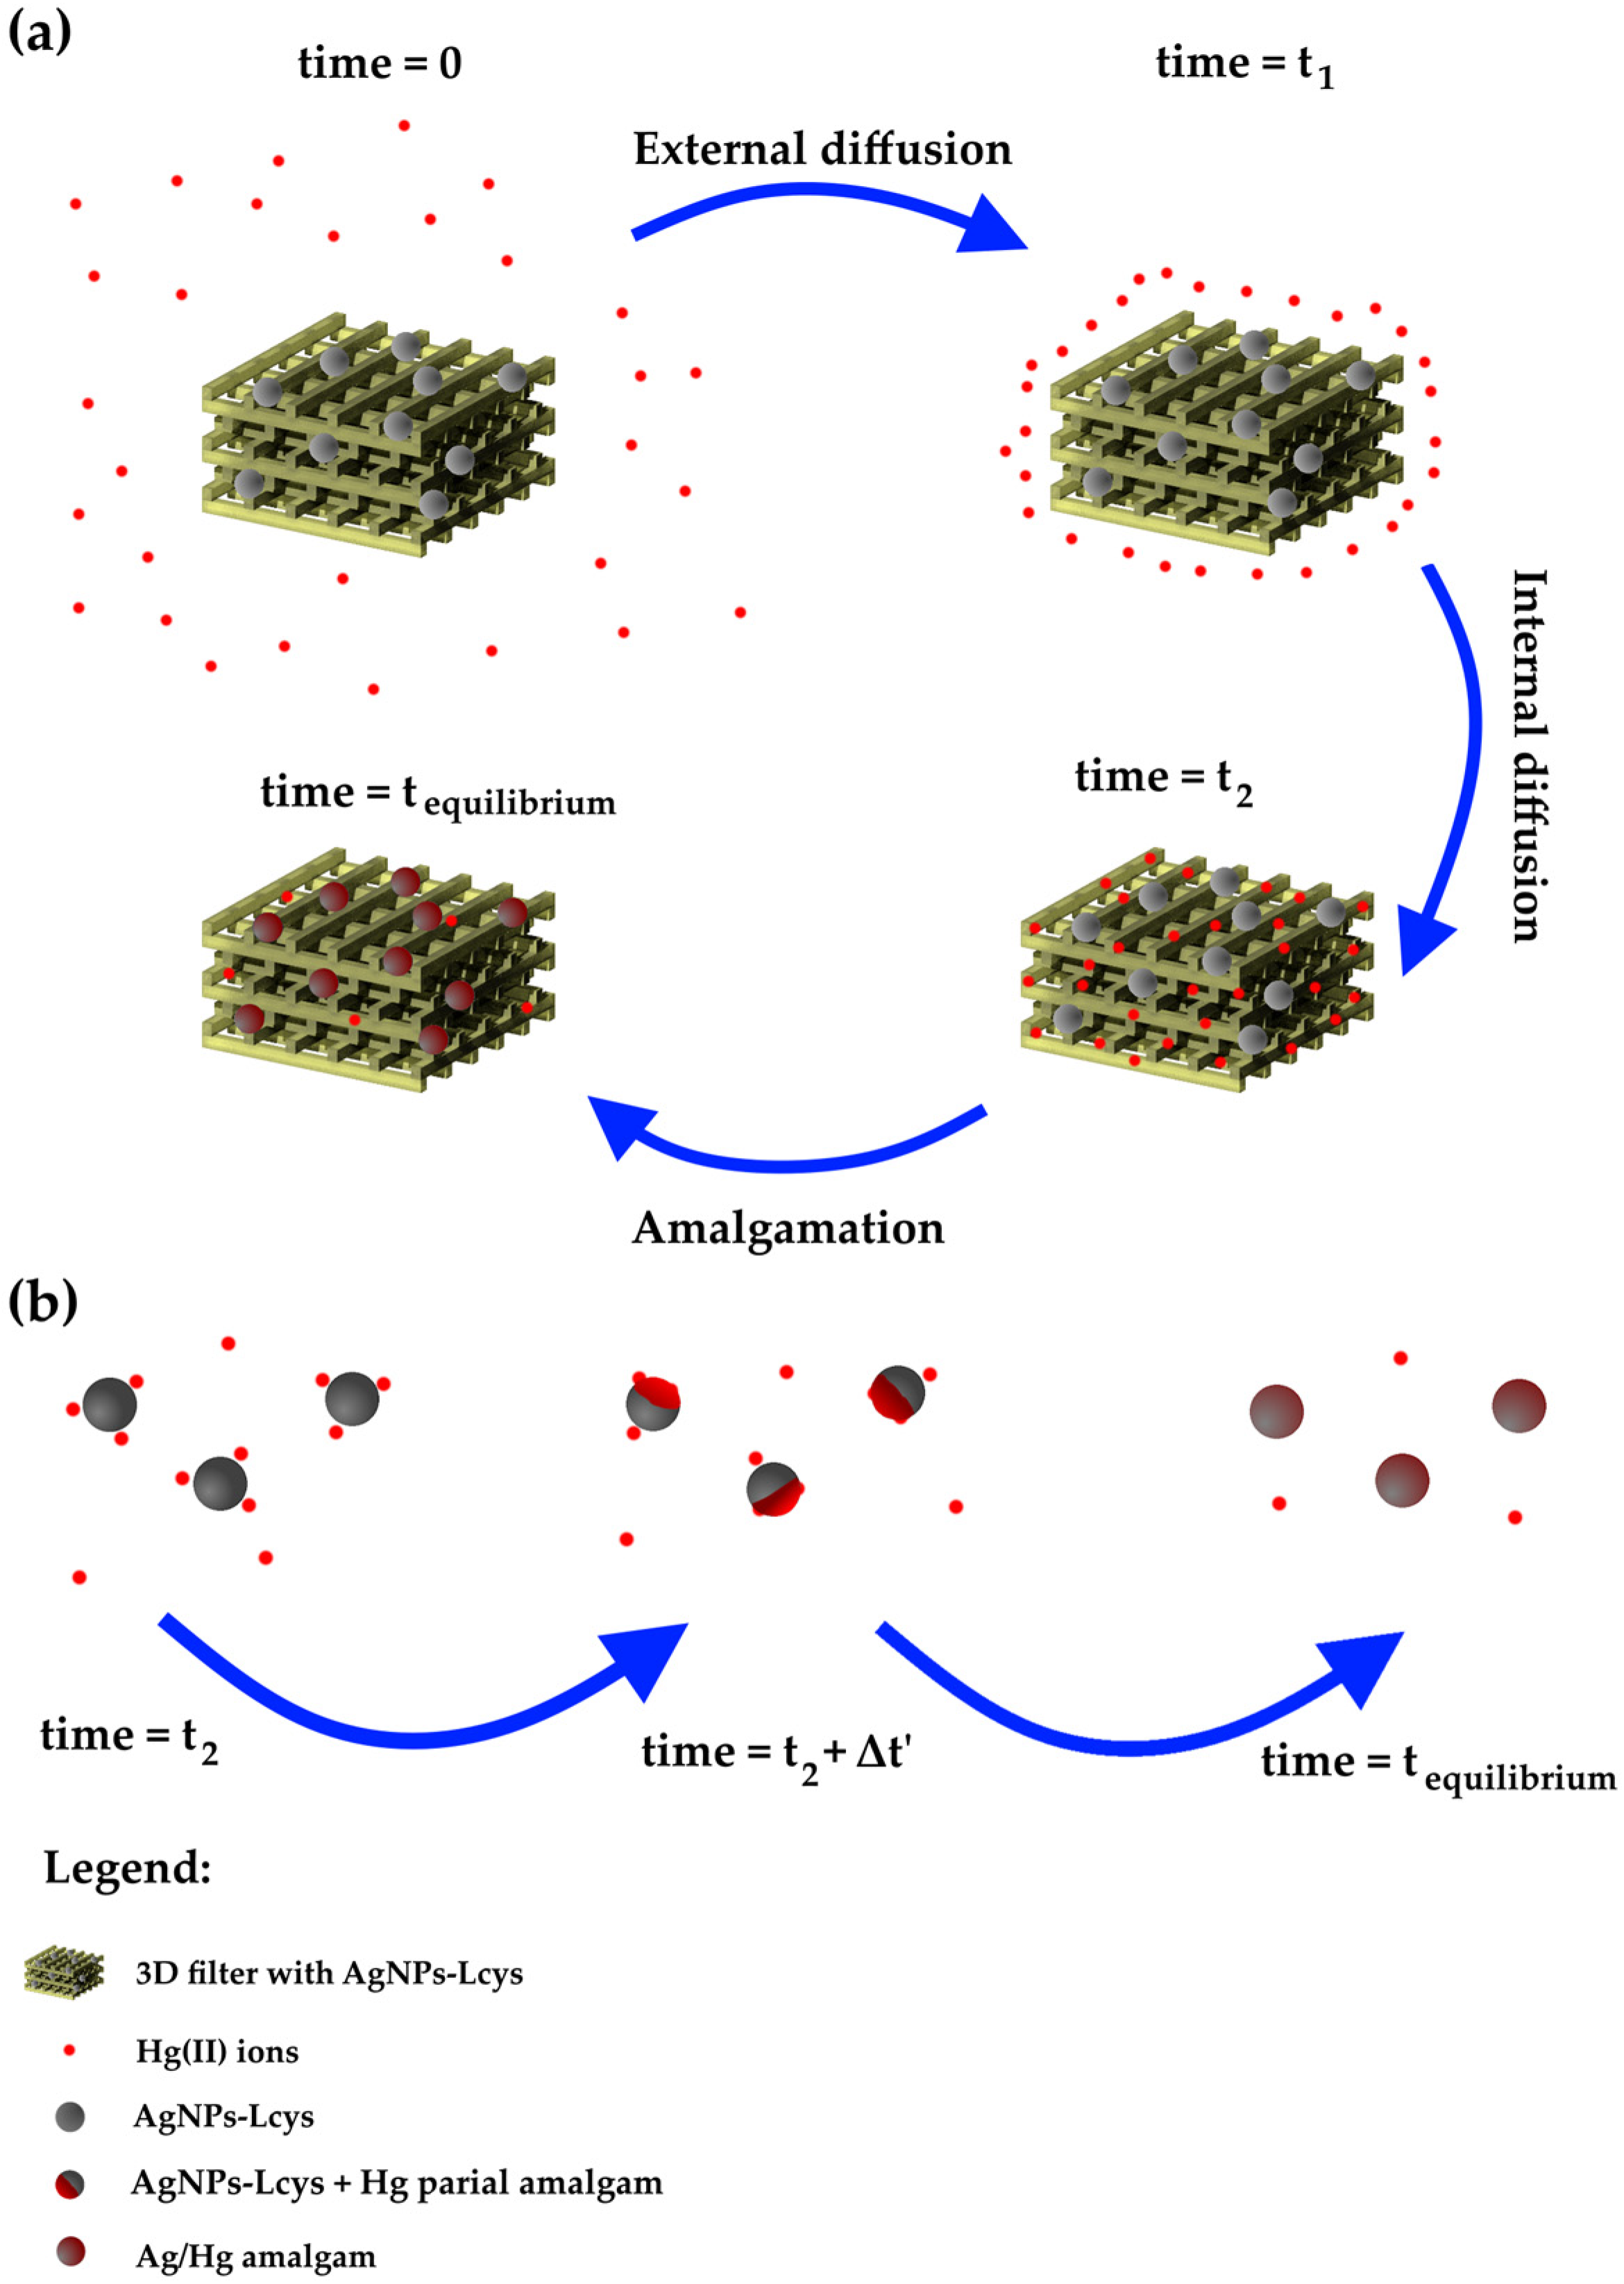
The fitting parameters and the experimental adsorption capacity are listed in Table 4. All the models show an excellent approximation of the qe, while the R2 value slightly increases from the PFO to MO model and suggests that the MO is the appropriate kinetic model. In order to understand the chemical meaning of the interaction, the mathematical interpretation of the chemical one is also added. As reported in our previous works [71,83], the colloidal solutions of AgNPs interact by reducing the Hg(II) ions in Hg(0) and forming a mercury–silver amalgam within several minutes. Meanwhile, from Figure 8, it is clear that it is necessary at least 8 h to complete the adsorption (and thus the interaction); consequently, the limiting step can be the internal diffusion of the ions in the PEGDA. Referring to Figure 9a, at the time zero, the active sites are completely empty. In the figure, the grey spheres represent the silver nanoparticles (active sites), the red points refer to mercury ions, and the yellow 3D structure is the PEGDA filter. In the subsequent stage, the Hg(II) ions reach the surface of the filter (external diffusion, time = t1 in the picture), and then, the ions arrive at the AgNP surface by internal diffusion (time = t2). Once reached by the silver particles, the amalgamation occurs, represented by the dark red spheres in the picture. Finally, the process finishes when all the silver nanoparticles adsorb their maximum amount of mercury (time = tequilibrium). More specifically, the chemisorption process is shown in Figure 9b. The mercury ions diffuse through the polymer matrix and arrive near the AgNPs. The mercury ions interacting with the surface of the AgNPs are reduced. The formation of the Ag/Hg amalgam starts (t2 + Δt’), until complete amalgamation (tequilibrium) is accomplished, and the maximum chemisorption of mercury by the silver nanoparticles is fulfilled.
Table 4.
Fitting parameters.
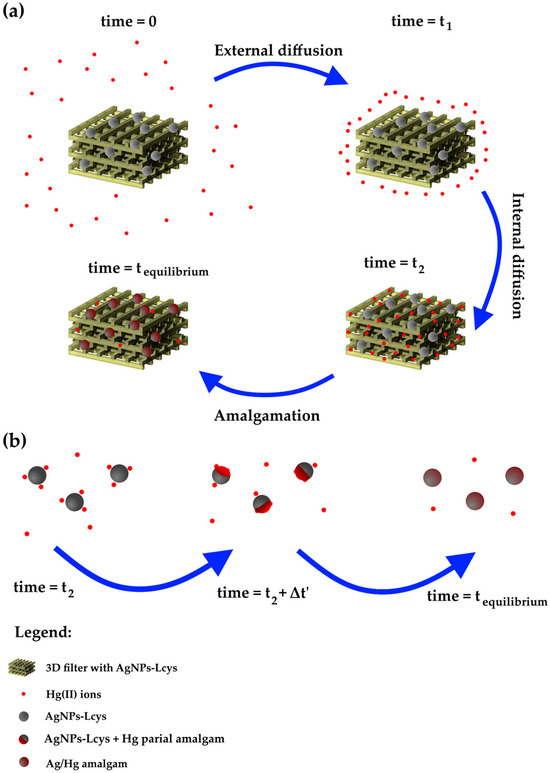
Figure 9.
Schematic representation of (a) the overall adsorption process; (b) the actual chemisorption process occurring between AgNPs-Lcys and Hg(II) ions.
4. Conclusions
In this work, the insertion of AgNPs-cit-Lcys into a PEGDA matrix by a 3D printing process has been proven. The XPS and FT-IR measurements showed that the PEGDA did not interfere with the AgNPs’ chemical interaction with the Hg(II) ions in the subsequent Hg/Ag amalgam formation. The adsorption-capacity studies revealed that the adsorption process is chemisorption (Langmuir model), and by increasing the temperature of interaction (from 4 °C to 50 °C), the maximum adsorption increases (from 0.55 to 0.61 mg/g). The removal efficiency was evaluated for the three temperatures, obtaining for 4 °C, 25 °C, and 50 °C the values 94%, 94%, and 86%, respectively. Despite the good results, this type of system presents some limitations, such as relatively long filtering times (8 h) and limited maximum adsorption capacity (0.57 mg/g at 25 °C). In addition, we limited the study of the 3D filters only to static conditions. Nevertheless, we are confident that the systems can work with additional improvements on the doping of the matrix and the mechanical properties in dynamic conditions (water flow and/or under pressure), giving better removal efficiency and reducing the filtering times.
Supplementary Materials
The following supporting information can be downloaded at: https://www.mdpi.com/article/10.3390/polym16081034/s1, Figure S1. Optical microscopy of a filter section: (a) picture of 3 layers with layer 1 and layer 3 in the same focal plane; layer 2 is out of focus; (b) schematic representation of the 3 planes; (c) picture of 3 layers with a cross section of layer 2 in the focal plane and layer 1 and 3 out of focus; (d) schematization of the 3 layers; Figure S2. SEM images of 3D-printed filter at different magnification scale bars 20 µm and 1 µm for (a) and (b), respectively. A classic morphology of a polymer can be observed in the picture with a compact structure with very low porosity; Figure S3. XRD spectrum of a 3D-printed filter. The wide band at 20° confirms the amorphous nature of the PEGDA/AgNPs-cit-Lcys system; Figure S4. Photopolymerization reaction of PEGDA with the LAP photoinitiator; Table S1: Complete collection of XPS data; Figure S5. Result of the AGREE analysis for our analytical process; Table S2. Comparison of filtering capabilities toward heavy metal ions of various nanocomposite hydrogels with gold or silver metal nanostructures.
Author Contributions
Conceptualization, L.B., P.P. and I.V.; methodology, L.B. and P.P.; software, L.B.; validation, I.V., P.P., M.S., C.B. and G.I.; formal analysis, L.B., I.V. and P.P.; investigation, L.B., I.D.G., F.B., C.B. and G.I.; data curation, L.B., I.V. and P.P.; writing—original draft preparation, L.B.; writing—review and editing, C.B., G.I., F.B., M.S., I.D.G., I.V. and P.P.; supervision, I.V. and P.P.; project administration, P.P. All authors have read and agreed to the published version of the manuscript.
Funding
The project A0375-2020-36521 (CUP: E85F21002440002) FACS (Filtraggio acque contaminate tramite sistemi nanostrutturati) has received funding from the Regione Lazio (Italy) by “Gruppi di ricerca 2020”—POR FESR Lazio 2014–2020.
Institutional Review Board Statement
Not applicable.
Data Availability Statement
Data are contained within the article and Supplementary Materials.
Acknowledgments
The authors are grateful to Daniela Cerasani for the realization of the 3D drawings (Figure 1c) of our filters and Leonardo Duranti for the SEM and XRD investigations. The Grant of Excellence Departments 2023–2027, MIUR (ARTICOLO 1, COMMI 314–337 LEGGE 232/2016), and ECS 0000024 Rome Technopole (CUP B83C22002820006, PNRR Missione 4 Componente 2 Investimento 1.5, finanziato dall’Unione europea—NextGenerationEU) are gratefully acknowledged by authors of Roma Tre University.
Conflicts of Interest
Michele Sisani and Irene Di Guida was employed by the company Prolabin & Tefarm S.r.l. The remaining authors declare that the research was conducted in the absence of any commercial or financial relationships that could be construed as a potential conflict of interest.
References
- Madhav, S.; Ahamad, A.; Singh, A.K.; Kushawaha, J.; Chauhan, J.S.; Sharma, S.; Singh, P. Water Pollutants: Sources and Impact on the Environment and Human Health. In Sensors in Water Pollutants Monitoring: Role of Material; Springer Nature: Berlin, Germany, 2020; pp. 43–62. ISBN 978-981-15-0670-3. [Google Scholar]
- Qasem, N.A.A.; Mohammed, R.H.; Lawal, D.U. Removal of heavy metal ions from wastewater: A comprehensive and critical review. npj Clean Water 2021, 4, 36. [Google Scholar] [CrossRef]
- Wu, S.; Wang, Y.; Iqbal, M.; Mehmood, K.; Li, Y.; Tang, Z.; Zhang, H. Challenges of fluoride pollution in environment: Mechanisms and pathological significance of toxicity—A review. Environ. Pollut. 2022, 304, 119241. [Google Scholar] [CrossRef]
- Lin, D.; Liang, H.; Li, G. Factors affecting the removal of bromate and bromide in water by nanofiltration. Environ. Sci. Pollut. Res. 2020, 27, 24639–24649. [Google Scholar] [CrossRef]
- Carolin, C.F.; Kumar, P.S.; Saravanan, A.; Joshiba, G.J.; Naushad, M. Efficient techniques for the removal of toxic heavy metals from aquatic environment: A review. J. Environ. Chem. Eng. 2017, 5, 2782–2799. [Google Scholar] [CrossRef]
- Yan, C.; Qu, Z.; Wang, J.; Cao, L.; Han, Q. Microalgal bioremediation of heavy metal pollution in water: Recent advances, challenges, and prospects. Chemosphere 2022, 286, 131870. [Google Scholar] [CrossRef]
- Li, X.; Zhang, L.; Yang, Z.; Wang, P.; Yan, Y.; Ran, J. Adsorption materials for volatile organic compounds (VOCs) and the key factors for VOCs adsorption process: A review. Sep. Purif. Technol. 2020, 235, 116213. [Google Scholar] [CrossRef]
- Picó, Y.; Barceló, D. Analysis and Prevention of Microplastics Pollution in Water: Current Perspectives and Future Directions. ACS Omega 2019, 4, 6709–6719. [Google Scholar] [CrossRef]
- Syafrudin, M.; Kristanti, R.A.; Yuniarto, A.; Hadibarata, T.; Rhee, J.; Al-onazi, W.A.; Algarni, T.S.; Almarri, A.H.; Al-Mohaimeed, A.M. Pesticides in Drinking Water—A Review. Int. J. Environ. Res. Public Health 2021, 18, 468. [Google Scholar] [CrossRef] [PubMed]
- Farhan Hanafi, M.; Sapawe, N. A review on the water problem associate with organic pollutants derived from phenol, methyl orange, and remazol brilliant blue dyes. Mater. Today Proc. 2020, 31, A141–A150. [Google Scholar] [CrossRef]
- Strokal, M.; Spanier, J.E.; Kroeze, C.; Koelmans, A.A.; Flörke, M.; Franssen, W.; Hofstra, N.; Langan, S.; Tang, T.; van Vliet, M.T.; et al. Global multi-pollutant modelling of water quality: Scientific challenges and future directions. Curr. Opin. Environ. Sustain. 2019, 36, 116–125. [Google Scholar] [CrossRef]
- Luo, W.; Dai, W.; Zhang, X.; Zheng, L.; Zhao, J.; Xie, X.; Xu, Y. Effects of Shigella flexneri exposure on development of Xenopus Tropicals embryo and its immune response. J. Hazard. Mater. 2022, 427, 128153. [Google Scholar] [CrossRef] [PubMed]
- Zhu, K.; Ren, H.; Lu, Y. Potential Biorisks of Cryptosporidium spp. and Giardia spp. from Reclaimed Water and Countermeasures. Curr. Pollut. Rep. 2022, 8, 456–476. [Google Scholar] [CrossRef]
- Singh, J.; Yadav, P.; Pal, A.K.; Mishra, V. Water Pollutants: Origin and Status; Springer: Singapore, 2020; pp. 5–20. [Google Scholar]
- Vallero, D.A. Thermal Pollution. In Waste; Elsevier: Amsterdam, The Netherlands, 2019; pp. 381–404. [Google Scholar]
- Adebiyi, F.M.; Ore, O.T.; Adeola, A.O.; Durodola, S.S.; Akeremale, O.F.; Olubodun, K.O.; Akeremale, O.K. Occurrence and remediation of naturally occurring radioactive materials in Nigeria: A review. Environ. Chem. Lett. 2021, 19, 3243–3262. [Google Scholar] [CrossRef]
- Zhao, C.; Wang, G.; Zhang, M.; Wang, G.; de With, G.; Bezhenar, R.; Maderich, V.; Xia, C.; Zhao, B.; Jung, K.T.; et al. Transport and dispersion of tritium from the radioactive water of the Fukushima Daiichi nuclear plant. Mar. Pollut. Bull. 2021, 169, 112515. [Google Scholar] [CrossRef] [PubMed]
- Natarajan, V.; Karunanidhi, M.; Raja, B. A critical review on radioactive waste management through biological techniques. Environ. Sci. Pollut. Res. 2020, 27, 29812–29823. [Google Scholar] [CrossRef] [PubMed]
- Kim, R.-Y.; Yoon, J.-K.; Kim, T.-S.; Yang, J.E.; Owens, G.; Kim, K.-R. Bioavailability of heavy metals in soils: Definitions and practical implementation—A critical review. Environ. Geochem. Health 2015, 37, 1041–1061. [Google Scholar] [CrossRef] [PubMed]
- Yang, L.; Zhang, Y.; Wang, F.; Luo, Z.; Guo, S.; Strähle, U. Toxicity of mercury: Molecular evidence. Chemosphere 2020, 245, 125586. [Google Scholar] [CrossRef] [PubMed]
- Barnett, J.R.; Miller, S.; Pearce, E. Colour and art: A brief history of pigments. Opt. Laser Technol. 2006, 38, 445–453. [Google Scholar] [CrossRef]
- Ghangrekar, M.M.; Chatterjee, P. Water Pollutants Classification and Its Effects on Environment. In Carbon Nanotubes for Clean Water; Springer: Cham, Switzerland, 2018; pp. 11–26. [Google Scholar]
- SciVal. Available online: https://www.scival.com/trends/keyphrases/chart?uri=Customer/0/ResearchArea/219260 (accessed on 3 August 2023).
- Xue, J.; Peldszus, S.; Van Dyke, M.I.; Huck, P.M. Removal of polystyrene microplastic spheres by alum-based coagulation-flocculation-sedimentation (CFS) treatment of surface waters. Chem. Eng. J. 2021, 422, 130023. [Google Scholar] [CrossRef]
- Pronk, W.; Ding, A.; Morgenroth, E.; Derlon, N.; Desmond, P.; Burkhardt, M.; Wu, B.; Fane, A.G. Gravity-driven membrane filtration for water and wastewater treatment: A review. Water Res. 2019, 149, 553–565. [Google Scholar] [CrossRef]
- Zhao, C.; Zhou, J.; Yan, Y.; Yang, L.; Xing, G.; Li, H.; Wu, P.; Wang, M.; Zheng, H. Application of coagulation/flocculation in oily wastewater treatment: A review. Sci. Total Environ. 2021, 765, 142795. [Google Scholar] [CrossRef] [PubMed]
- Abujazar, M.S.S.; Karaağaç, S.U.; Abu Amr, S.S.; Alazaiza, M.Y.D.; Bashir, M.J. Recent advancement in the application of hybrid coagulants in coagulation-flocculation of wastewater: A review. J. Clean. Prod. 2022, 345, 131133. [Google Scholar] [CrossRef]
- Benalia, M.C.; Youcef, L.; Bouaziz, M.G.; Achour, S.; Menasra, H. Removal of Heavy Metals from Industrial Wastewater by Chemical Precipitation: Mechanisms and Sludge Characterization. Arab. J. Sci. Eng. 2022, 47, 5587–5599. [Google Scholar] [CrossRef]
- Wang, J.; Chen, H. Catalytic ozonation for water and wastewater treatment: Recent advances and perspective. Sci. Total Environ. 2020, 704, 135249. [Google Scholar] [CrossRef] [PubMed]
- Lebron, Y.A.R.; Moreira, V.R.; Amaral, M.C.S. Metallic ions recovery from membrane separation processes concentrate: A special look onto ion exchange resins. Chem. Eng. J. 2021, 425, 131812. [Google Scholar] [CrossRef]
- Bastianini, M.; Sisani, M.; Naryyev, E.; Petracci, A.; Di Guida, I.; Narducci, R. Composite membranes based on polyvinyl alcohol and lamellar solids for water decontamination. New J. Chem. 2024, 48, 2128–2139. [Google Scholar] [CrossRef]
- Vinitnantharat, S.; Kositchaiyong, S.; Chiarakorn, S. Removal of fluoride in aqueous solution by adsorption on acid activated water treatment sludge. Appl. Surf. Sci. 2010, 256, 5458–5462. [Google Scholar] [CrossRef]
- Qiao, S.; Hou, C.; Wang, X.; Zhou, J. Minimizing greenhouse gas emission from wastewater treatment process by integrating activated sludge and microalgae processes. Sci. Total Environ. 2020, 732, 139032. [Google Scholar] [CrossRef]
- Shi, X.; Leong, K.Y.; Ng, H.Y. Anaerobic treatment of pharmaceutical wastewater: A critical review. Bioresour. Technol. 2017, 245, 1238–1244. [Google Scholar] [CrossRef]
- Kong, Z.; Li, L.; Xue, Y.; Yang, M.; Li, Y.-Y. Challenges and prospects for the anaerobic treatment of chemical-industrial organic wastewater: A review. J. Clean. Prod. 2019, 231, 913–927. [Google Scholar] [CrossRef]
- Zazouli, M.A.; Mahdavi, Y.; Bazrafshan, E.; Balarak, D. Phytodegradation potential of bisphenolA from aqueous solution by Azolla Filiculoides. J. Environ. Heal. Sci. Eng. 2014, 12, 66. [Google Scholar] [CrossRef]
- Saravanan, A.; Jayasree, R.; Hemavathy, R.V.; Jeevanantham, S.; Hamsini, S.; Yaashikaa, P.R.; Manivasagan, V.; Yuvaraj, D. Phytoremediation of Cr(VI) ion contaminated soil using Black gram (Vigna mungo): Assessment of removal capacity. J. Environ. Chem. Eng. 2019, 7, 103052. [Google Scholar] [CrossRef]
- Samal, S. Effect of shape and size of filler particle on the aggregation and sedimentation behavior of the polymer composite. Powder Technol. 2020, 366, 43–51. [Google Scholar] [CrossRef]
- Evangelista, S.; Viccione, G.; Siani, O. A new cost effective, long life and low resistance filter cartridge for water treatment. J. Water Process Eng. 2019, 27, 1–14. [Google Scholar] [CrossRef]
- Saravanan, A.; Senthil Kumar, P.; Jeevanantham, S.; Karishma, S.; Tajsabreen, B.; Yaashikaa, P.R.; Reshma, B. Effective water/wastewater treatment methodologies for toxic pollutants removal: Processes and applications towards sustainable development. Chemosphere 2021, 280, 130595. [Google Scholar] [CrossRef] [PubMed]
- Cui, H.; Huang, X.; Yu, Z.; Chen, P.; Cao, X. Application progress of enhanced coagulation in water treatment. RSC Adv. 2020, 10, 20231–20244. [Google Scholar] [CrossRef] [PubMed]
- Grace Pavithra, K.; Senthil Kumar, P.; Jaikumar, V.; Sundar Rajan, P. Removal of colorants from wastewater: A review on sources and treatment strategies. J. Ind. Eng. Chem. 2019, 75, 1–19. [Google Scholar] [CrossRef]
- Guo, Y.; Zhu, S.; Wang, B.; Huang, J.; Deng, S.; Yu, G.; Wang, Y. Modelling of emerging contaminant removal during heterogeneous catalytic ozonation using chemical kinetic approaches. J. Hazard. Mater. 2019, 380, 120888. [Google Scholar] [CrossRef]
- Ong, D.C.; de Luna, M.D.G.; Pingul-Ong, S.M.B.; Kan, C.-C. Manganese and iron recovery from groundwater treatment sludge by reductive acid leaching and hydroxide precipitation. J. Environ. Manag. 2018, 223, 723–730. [Google Scholar] [CrossRef]
- Pejman, A.H.; Bidhendi, G.R.N.; Karbassi, A.R.; Mehrdadi, N.; Bidhendi, M.E. Evaluation of spatial and seasonal variations in surface water quality using multivariate statistical techniques. Int. J. Environ. Sci. Technol. 2009, 6, 467–476. [Google Scholar] [CrossRef]
- Nicolai, E.; Pizzoferrato, R.; Li, Y.; Frattegiani, S.; Nucara, A.; Costa, G. A New Optical Method for Quantitative Detection of Microplastics in Water Based on Real-Time Fluorescence Analysis. Water 2022, 14, 3235. [Google Scholar] [CrossRef]
- Burratti, L.; Casalboni, M.; De Matteis, F.; Pizzoferrato, R.; Prosposito, P. Polystyrene Opals Responsive to Methanol Vapors. Materials 2018, 11, 1547. [Google Scholar] [CrossRef] [PubMed]
- Schiesaro, I.; Battocchio, C.; Venditti, I.; Prosposito, P.; Burratti, L.; Centomo, P.; Meneghini, C. Structural characterization of 3d metal adsorbed AgNPs. Phys. E Low-Dimens. Syst. Nanostruct. 2020, 123, 114162. [Google Scholar] [CrossRef]
- Wu, Q.; Miao, W.; Zhang, Y.; Gao, H.; Hui, D. Mechanical properties of nanomaterials: A review. Nanotechnol. Rev. 2020, 9, 259–273. [Google Scholar] [CrossRef]
- Babicheva, R.I.; Dmitriev, S.V.; Korznikova, E.A.; Zhou, K. Mechanical Properties of Two-Dimensional sp2-Carbon Nanomaterials. J. Exp. Theor. Phys. 2019, 129, 66–71. [Google Scholar] [CrossRef]
- Meng, T.; Ying, K.; Yang, X.; Hong, Y. Comparative study on mechanisms for improving mechanical properties and microstructure of cement paste modified by different types of nanomaterials. Nanotechnol. Rev. 2021, 10, 370–384. [Google Scholar] [CrossRef]
- Yousaf, S.; Zulfiqar, S.; Shahi, M.N.; Warsi, M.F.; Al-Khalli, N.F.; Aly Aboud, M.F.; Shakir, I. Tuning the structural, optical and electrical properties of NiO nanoparticles prepared by wet chemical route. Ceram. Int. 2020, 46, 3750–3758. [Google Scholar] [CrossRef]
- Raza, T.; Qu, L.; Khokhar, W.A.; Andrews, B.; Ali, A.; Tian, M. Progress of Wearable and Flexible Electrochemical Biosensors With the Aid of Conductive Nanomaterials. Front. Bioeng. Biotechnol. 2021, 9, 761020. [Google Scholar] [CrossRef] [PubMed]
- Ashtari, K.; Nazari, H.; Ko, H.; Tebon, P.; Akhshik, M.; Akbari, M.; Alhosseini, S.N.; Mozafari, M.; Mehravi, B.; Soleimani, M.; et al. Electrically conductive nanomaterials for cardiac tissue engineering. Adv. Drug Deliv. Rev. 2019, 144, 162–179. [Google Scholar] [CrossRef]
- Naponiello, G.; Venditti, I.; Zardetto, V.; Saccone, D.; Di Carlo, A.; Fratoddi, I.; Barolo, C.; Dini, D. Photoelectrochemical characterization of squaraine-sensitized nickel oxide cathodes deposited via screen-printing for p -type dye-sensitized solar cells. Appl. Surf. Sci. 2015, 356, 911–920. [Google Scholar] [CrossRef]
- Trukhanov, A.V.; Tishkevich, D.I.; Podgornaya, S.V.; Kaniukov, E.; Darwish, M.A.; Zubar, T.I.; Timofeev, A.V.; Trukhanova, E.L.; Kostishin, V.G.; Trukhanov, S.V. Impact of the Nanocarbon on Magnetic and Electrodynamic Properties of the Ferrite/Polymer Composites. Nanomaterials 2022, 12, 868. [Google Scholar] [CrossRef]
- Peralta, M.E.; Ocampo, S.; Funes, I.G.; Onaga Medina, F.; Parolo, M.E.; Carlos, L. Nanomaterials with Tailored Magnetic Properties as Adsorbents of Organic Pollutants from Wastewaters. Inorganics 2020, 8, 24. [Google Scholar] [CrossRef]
- Raghuram, N.; Rao, T.S.; Naidu, K.C.B. Magnetic properties of hydrothermally synthesized Ba1–xSrxFe12O19 (x = 0.0–0.8) nanomaterials. Appl. Phys. A 2019, 125, 839. [Google Scholar] [CrossRef]
- Charpentier, T.V.J.; Neville, A.; Lanigan, J.L.; Barker, R.; Smith, M.J.; Richardson, T. Preparation of Magnetic Carboxymethylchitosan Nanoparticles for Adsorption of Heavy Metal Ions. ACS Omega 2016, 1, 77–83. [Google Scholar] [CrossRef]
- Burratti, L.; Zannotti, M.; Maranges, V.; Giovannetti, R.; Duranti, L.; De Matteis, F.; Francini, R.; Prosposito, P. Poly(ethylene glycol) Diacrylate Hydrogel with Silver Nanoclusters for Water Pb(II) Ions Filtering. Gels 2023, 9, 133. [Google Scholar] [CrossRef] [PubMed]
- Ren, T.; Peng, J.; Yuan, H.; Liu, Z.; Li, Q.; Ma, Q.; Li, X.; Guo, X.; Wu, Y. Nanocellulose-based hydrogel incorporating silver nanoclusters for sensitive detection and efficient removal of hexavalent chromium. Eur. Polym. J. 2022, 175, 111343. [Google Scholar] [CrossRef]
- Asthana, A.; Verma, R.; Singh, A.K.; Susan, M.A.B.H.; Adhikari, R. Silver Nanoparticle Entrapped Calcium-Alginate Beads for Fe(II) Removal via Adsorption. Macromol. Symp. 2016, 366, 42–51. [Google Scholar] [CrossRef]
- Miranda, B.; Dello Iacono, S.; Rea, I.; Borbone, F.; De Stefano, L. Effect of the molecular weight on the sensing mechanism in polyethylene glycol diacrylate/gold nanocomposite optical transducers. Heliyon 2024, 10, e25593. [Google Scholar] [CrossRef]
- Wang, R.; Zhao, P.; Yu, R.; Jiang, J.; Liang, R.; Liu, G. Cost-efficient collagen fibrous aerogel cross-linked by Fe (III)/silver nanoparticle complexes for simultaneously degrading antibiotics, eliminating antibiotic-resistant bacteria, and adsorbing heavy metal ions from wastewater. Sep. Purif. Technol. 2022, 303, 122209. [Google Scholar] [CrossRef]
- Sahraei, R.; Ghaemy, M. Synthesis of modified gum tragacanth/graphene oxide composite hydrogel for heavy metal ions removal and preparation of silver nanocomposite for antibacterial activity. Carbohydr. Polym. 2017, 157, 823–833. [Google Scholar] [CrossRef]
- Chen, G.; Hai, J.; Wang, H.; Liu, W.; Chen, F.; Wang, B. Gold nanoparticles and the corresponding filter membrane as chemosensors and adsorbents for dual signal amplification detection and fast removal of mercury (II). Nanoscale 2017, 9, 3315–3321. [Google Scholar] [CrossRef]
- Wankar, S.; Sapre, N.; Gumathannavar, R.; Jadhav, Y.; Kulkarni, A. Silver-chitosan (Ag-CH) nanocomposite hydrogel for remediation of aqueous medium. Mater. Today Proc. 2022. [Google Scholar] [CrossRef]
- Burratti, L.; Sisani, M.; Di Guida, I.; De Matteis, F.; Francini, R.; Prosposito, P. Poly(ethylene glycol) Diacrylate Hydrogels Doped with Silver Nanoparticles for Optical Sensing and Removing Hg(II) Ions from Water. Chemosensors 2023, 11, 518. [Google Scholar] [CrossRef]
- Lei, X.; Li, H.; Luo, Y.; Sun, X.; Guo, X.; Hu, Y.; Wen, R. Novel fluorescent nanocellulose hydrogel based on gold nanoclusters for the effective adsorption and sensitive detection of mercury ions. J. Taiwan Inst. Chem. Eng. 2021, 123, 79–86. [Google Scholar] [CrossRef]
- Kodoth, A.K.; Badalamoole, V. Silver nanoparticle-embedded pectin-based hydrogel for adsorptive removal of dyes and metal ions. Polym. Bull. 2020, 77, 541–564. [Google Scholar] [CrossRef]
- Prosposito, P.; Burratti, L.; Bellingeri, A.; Protano, G.; Faleri, C.; Corsi, I.; Battocchio, C.; Iucci, G.; Tortora, L.; Secchi, V.; et al. Bifunctionalized Silver Nanoparticles as Hg2+ Plasmonic Sensor in Water: Synthesis, Characterizations, and Ecosafety. Nanomaterials 2019, 9, 1353. [Google Scholar] [CrossRef] [PubMed]
- Kaur, R.; Goyal, D.; Agnihotri, S. Chitosan/PVA silver nanocomposite for butachlor removal: Fabrication, characterization, adsorption mechanism and isotherms. Carbohydr. Polym. 2021, 262, 117906. [Google Scholar] [CrossRef]
- Li, W.; Pan, G.; Zhang, M.; Zhao, D.; Yang, Y.; Chen, H.; He, G. EXAFS studies on adsorption irreversibility of Zn(II) on TiO2: Temperature dependence. J. Colloid Interface Sci. 2008, 319, 385–391. [Google Scholar] [CrossRef] [PubMed]
- Pena-Pereira, F.; Wojnowski, W.; Tobiszewski, M. AGREE—Analytical GREEnness Metric Approach and Software. Anal. Chem. 2020, 92, 10076–10082. [Google Scholar] [CrossRef]
- Panda, S.S.; Afzal, O.; Altamimi, A.S.A.; Beg, S. Simultaneous estimation of neratinib and naringenin from pharmaceuticals using a stability-indicating liquid chromatographic method: Application to analytical quality by design concept and multi-tool method greenness assessment. Microchem. J. 2023, 191, 108848. [Google Scholar] [CrossRef]
- Moema, D.; Makwakwa, T.A.; Gebreyohannes, B.E.; Dube, S.; Nindi, M.M. Hollow fiber liquid phase microextraction of fluoroquinolones in chicken livers followed by high pressure liquid chromatography: Greenness assessment using National Environmental Methods Index Label (NEMI), green analytical procedure index (GAPI), Analytical GREEnness metric (AGREE), and Eco Scale. J. Food Compos. Anal. 2023, 117, 105131. [Google Scholar] [CrossRef]
- Kamal, M.F.; Youssef, R.M.; Morshedy, S.; El-Sayed, N.W. Green and Smart Quantitative Quality Control for Veterinary Mixture of Ivermectin and Clorsulon: Ecological Evaluation of Spectral Analyses via Analytical Eco-Scale, Green Analytical Procedure Index, and Analytical GREEnness Metric Approaches. J. AOAC Int. 2023, 106, 1455–1463. [Google Scholar] [CrossRef] [PubMed]
- Cora Jofre, F.; Azcarate, S.M.; Camiña, J.M.; Pacheco, P.; Savio, M. Assessing the greenness of optimized ultrasound and infrared assisted extraction through analytical metrics. Adv. Sample Prep. 2023, 5, 100054. [Google Scholar] [CrossRef]
- Vakh, C.; Tobiszewski, M. Greenness assessment of analytical methods used for antibiotic residues determination in food samples. TrAC Trends Anal. Chem. 2023, 166, 117162. [Google Scholar] [CrossRef]
- Castle, J.E. Practical Surface Analysis by Auger and X-ray Photoelectron Spectroscopy; Briggs, D., Seah, M.P., Eds.; John Wiley and Sons Ltd.: Chichester, UK, 1983; Volume 6, p. 533. [Google Scholar]
- Secchi, V.; Franchi, S.; Ciccarelli, D.; Dettin, M.; Zamuner, A.; Serio, A.; Iucci, G.; Battocchio, C. Biofunctionalization of TiO2 Surfaces with Self-Assembling Layers of Oligopeptides Covalently Grafted to Chitosan. ACS Biomater. Sci. Eng. 2019, 5, 2190–2199. [Google Scholar] [CrossRef]
- Oliveira, C.; Chaves, C.R.; Bargiela, P.; da Rocha, M.D.G.C.; da Silva, A.F.; Chubaci, J.F.D.; Boström, M.; Persson, C.; Malta, M. Surface studies of the chemical environment in gold nanorods supported by X-ray photoelectron spectroscopy (XPS) and ab initio calculations. J. Mater. Res. Technol. 2021, 15, 768–776. [Google Scholar] [CrossRef]
- Schiesaro, I.; Burratti, L.; Meneghini, C.; Fratoddi, I.; Prosposito, P.; Lim, J.; Scheu, C.; Venditti, I.; Iucci, G.; Battocchio, C. Hydrophilic Silver Nanoparticles for Hg(II) Detection in Water: Direct Evidence for Mercury–Silver Interaction. J. Phys. Chem. C 2020, 124, 25975–25983. [Google Scholar] [CrossRef]
- Li, J.; Tong, J.; Li, X.; Yang, Z.; Zhang, Y.; Diao, G. Facile microfluidic synthesis of copolymer hydrogel beads for the removal of heavy metal ions. J. Mater. Sci. 2016, 51, 10375–10385. [Google Scholar] [CrossRef]
- Magalhães, L.S.S.M.; Andrade, D.B.; Bezerra, R.D.S.; Morais, A.I.S.; Oliveira, F.C.; Rizzo, M.S.; Silva-Filho, E.C.; Lobo, A.O. Nanocomposite Hydrogel Produced from PEGDA and Laponite for Bone Regeneration. J. Funct. Biomater. 2022, 13, 53. [Google Scholar] [CrossRef]
- Silverstain, R.M.; Webster, F.X. Spectrometric Identification of Organic Compounds, 6th ed.; John Wiley & Sons: Hoboken, NJ, USA, 1998; ISBN 0-471-13457-0. [Google Scholar]
- Chen, X.; Hossain, M.F.; Duan, C.; Lu, J.; Tsang, Y.F.; Islam, M.S.; Zhou, Y. Isotherm models for adsorption of heavy metals from water—A review. Chemosphere 2022, 307, 135545. [Google Scholar] [CrossRef]
- Febrianto, J.; Kosasih, A.N.; Sunarso, J.; Ju, Y.-H.; Indraswati, N.; Ismadji, S. Equilibrium and kinetic studies in adsorption of heavy metals using biosorbent: A summary of recent studies. J. Hazard. Mater. 2009, 162, 616–645. [Google Scholar] [CrossRef] [PubMed]
- Khan, A.A.; Singh, R.P. Adsorption thermodynamics of carbofuran on Sn (IV) arsenosilicate in H+, Na+ and Ca2+ forms. Colloids Surf. 1987, 24, 33–42. [Google Scholar] [CrossRef]
- Bulut, E.; Özacar, M.; Şengil, İ.A. Adsorption of malachite green onto bentonite: Equilibrium and kinetic studies and process design. Microporous Mesoporous Mater. 2008, 115, 234–246. [Google Scholar] [CrossRef]
- Guo, X.; Wang, J. A general kinetic model for adsorption: Theoretical analysis and modeling. J. Mol. Liq. 2019, 288, 111100. [Google Scholar] [CrossRef]
- Wang, J.; Guo, X. Adsorption kinetic models: Physical meanings, applications, and solving methods. J. Hazard. Mater. 2020, 390, 122156. [Google Scholar] [CrossRef]

Disclaimer/Publisher’s Note: The statements, opinions and data contained in all publications are solely those of the individual author(s) and contributor(s) and not of MDPI and/or the editor(s). MDPI and/or the editor(s) disclaim responsibility for any injury to people or property resulting from any ideas, methods, instructions or products referred to in the content. |
© 2024 by the authors. Licensee MDPI, Basel, Switzerland. This article is an open access article distributed under the terms and conditions of the Creative Commons Attribution (CC BY) license (https://creativecommons.org/licenses/by/4.0/).