
Out-of-Mold Sensor-Based Process Parameter Optimization and Adaptive Process Quality Control for Hot Runner Thin-Walled Injection-Molded Parts


Abstract
1. Introduction
2. Methodology
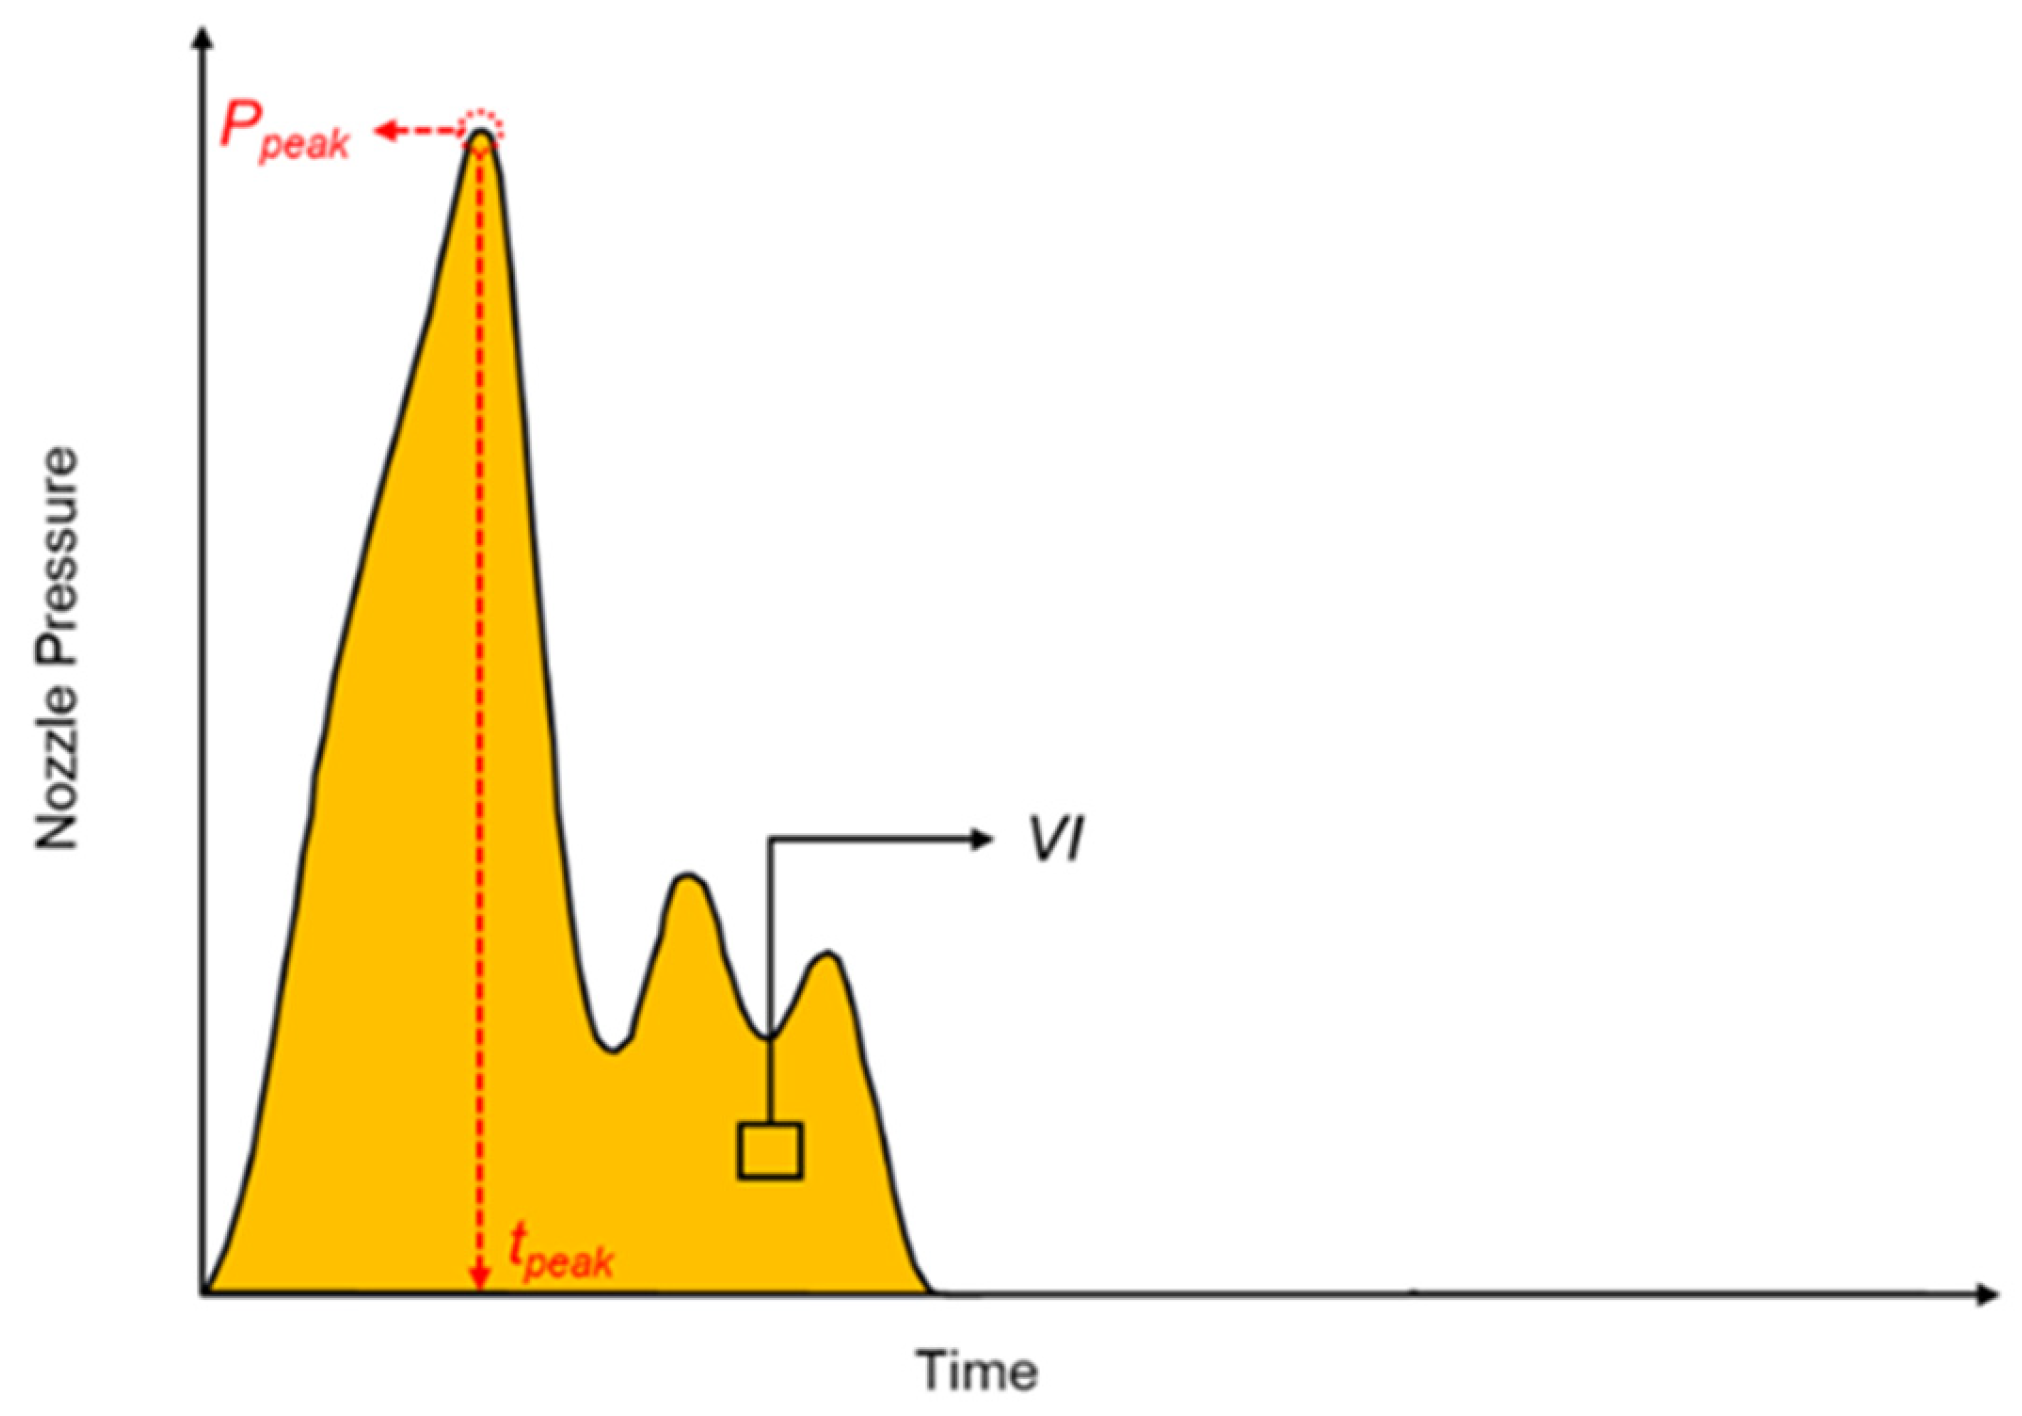
2.1. Characteristics of the Nozzle Pressure Profile
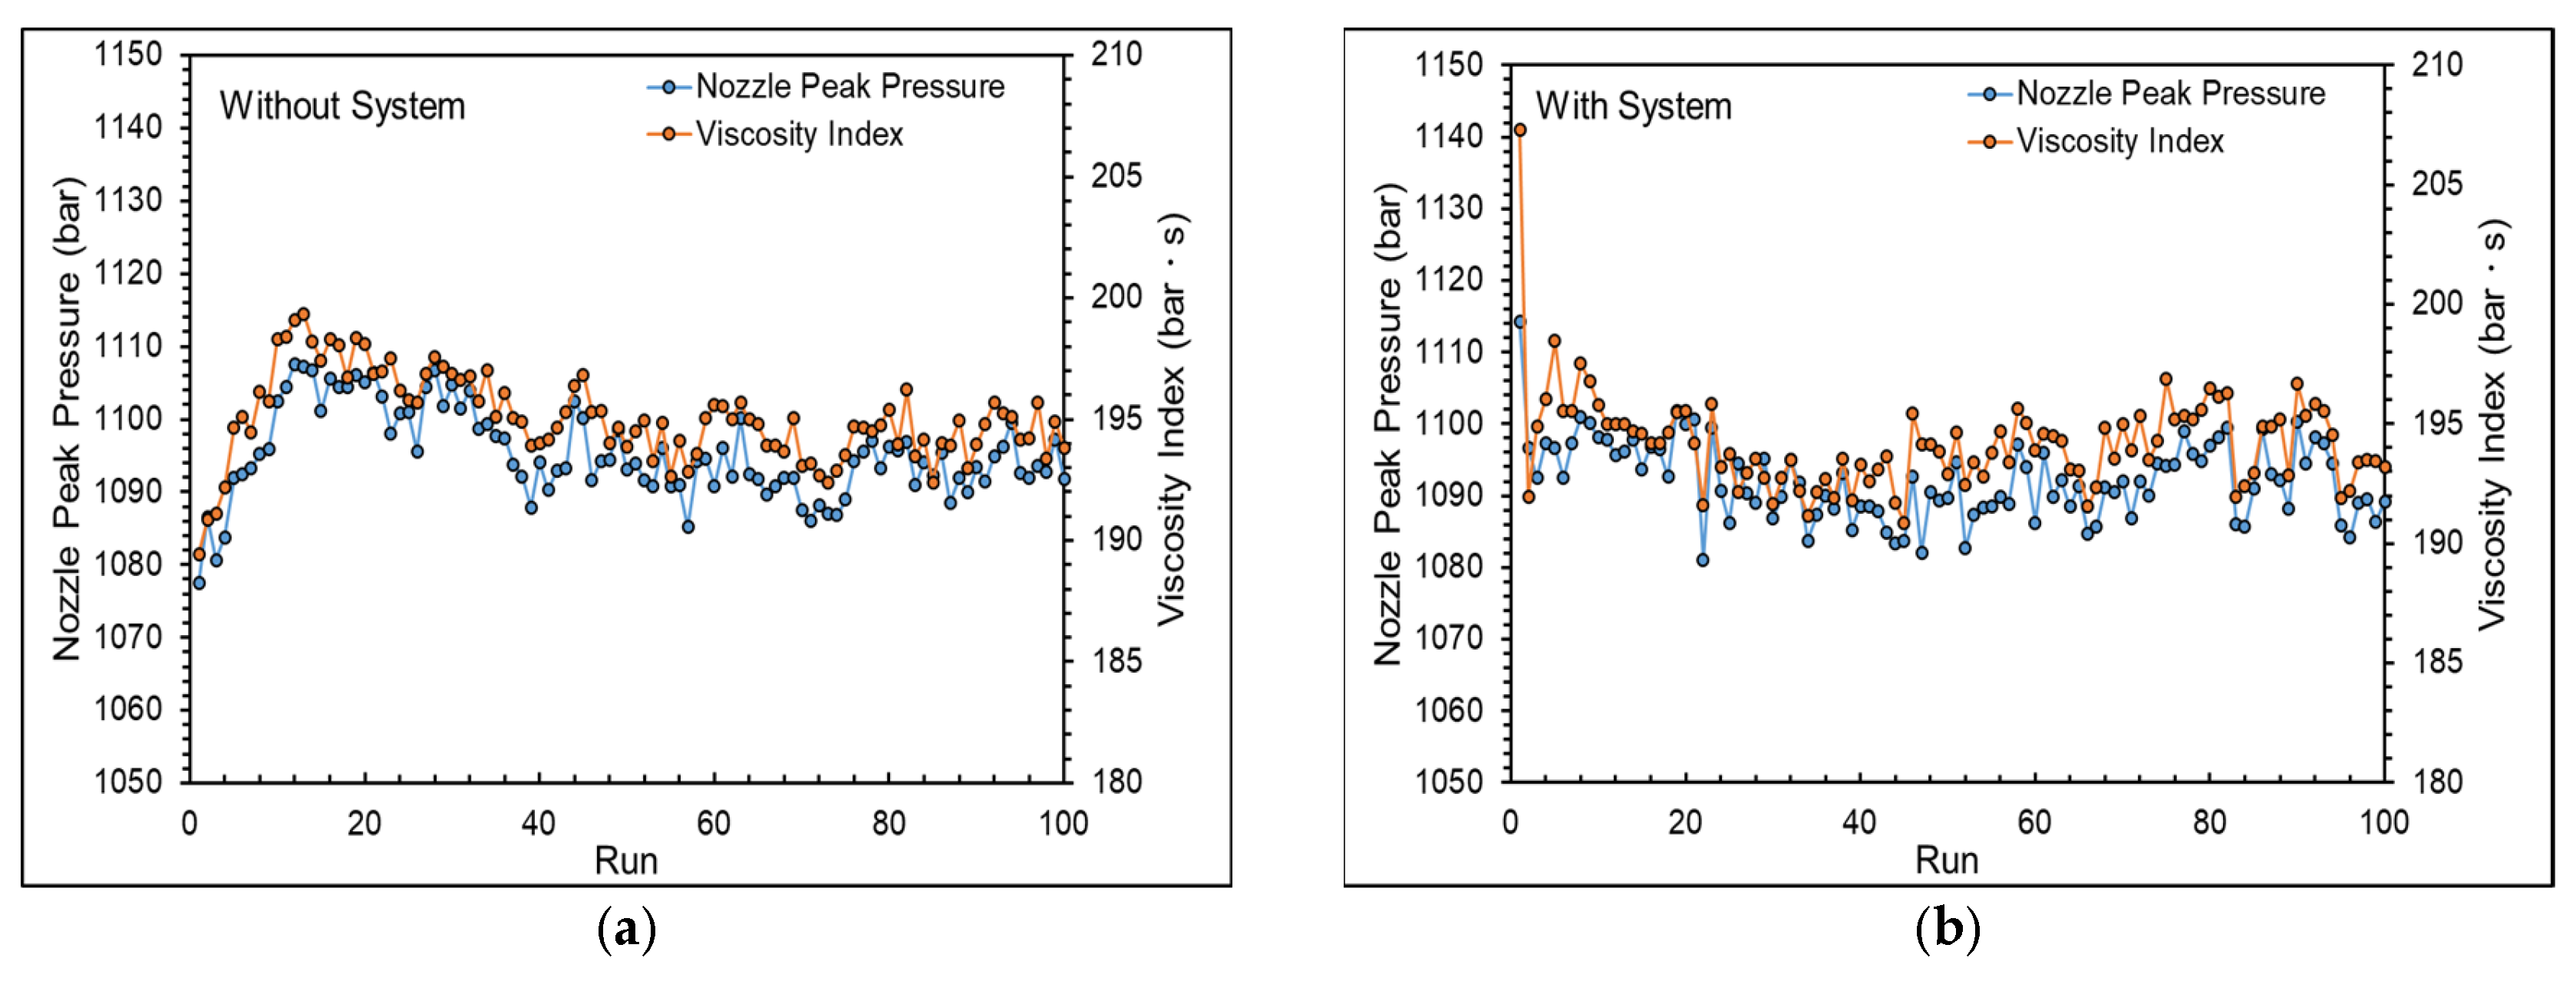
- Nozzle peak pressure (Ppeak): As the highest point on the nozzle pressure curve, the nozzle peak pressure occurs when the molten material transitions from flow to compression upon filling the mold, forming the peak of the nozzle pressure. This is utilized to optimize the injection speed and V/P switchover point, serving as an online quality index for the adaptive process control system.
- Timing of peak pressure (tpeak): The instant of time when the nozzle peak pressure occurs is used to optimize the injection speed.
- Viscosity index (VI): The integral of pressure over time from the start of injection to the end of cooling is primarily employed as an online quality index for the adaptive process control system and assesses changes in product weight, as shown in Equation (1).
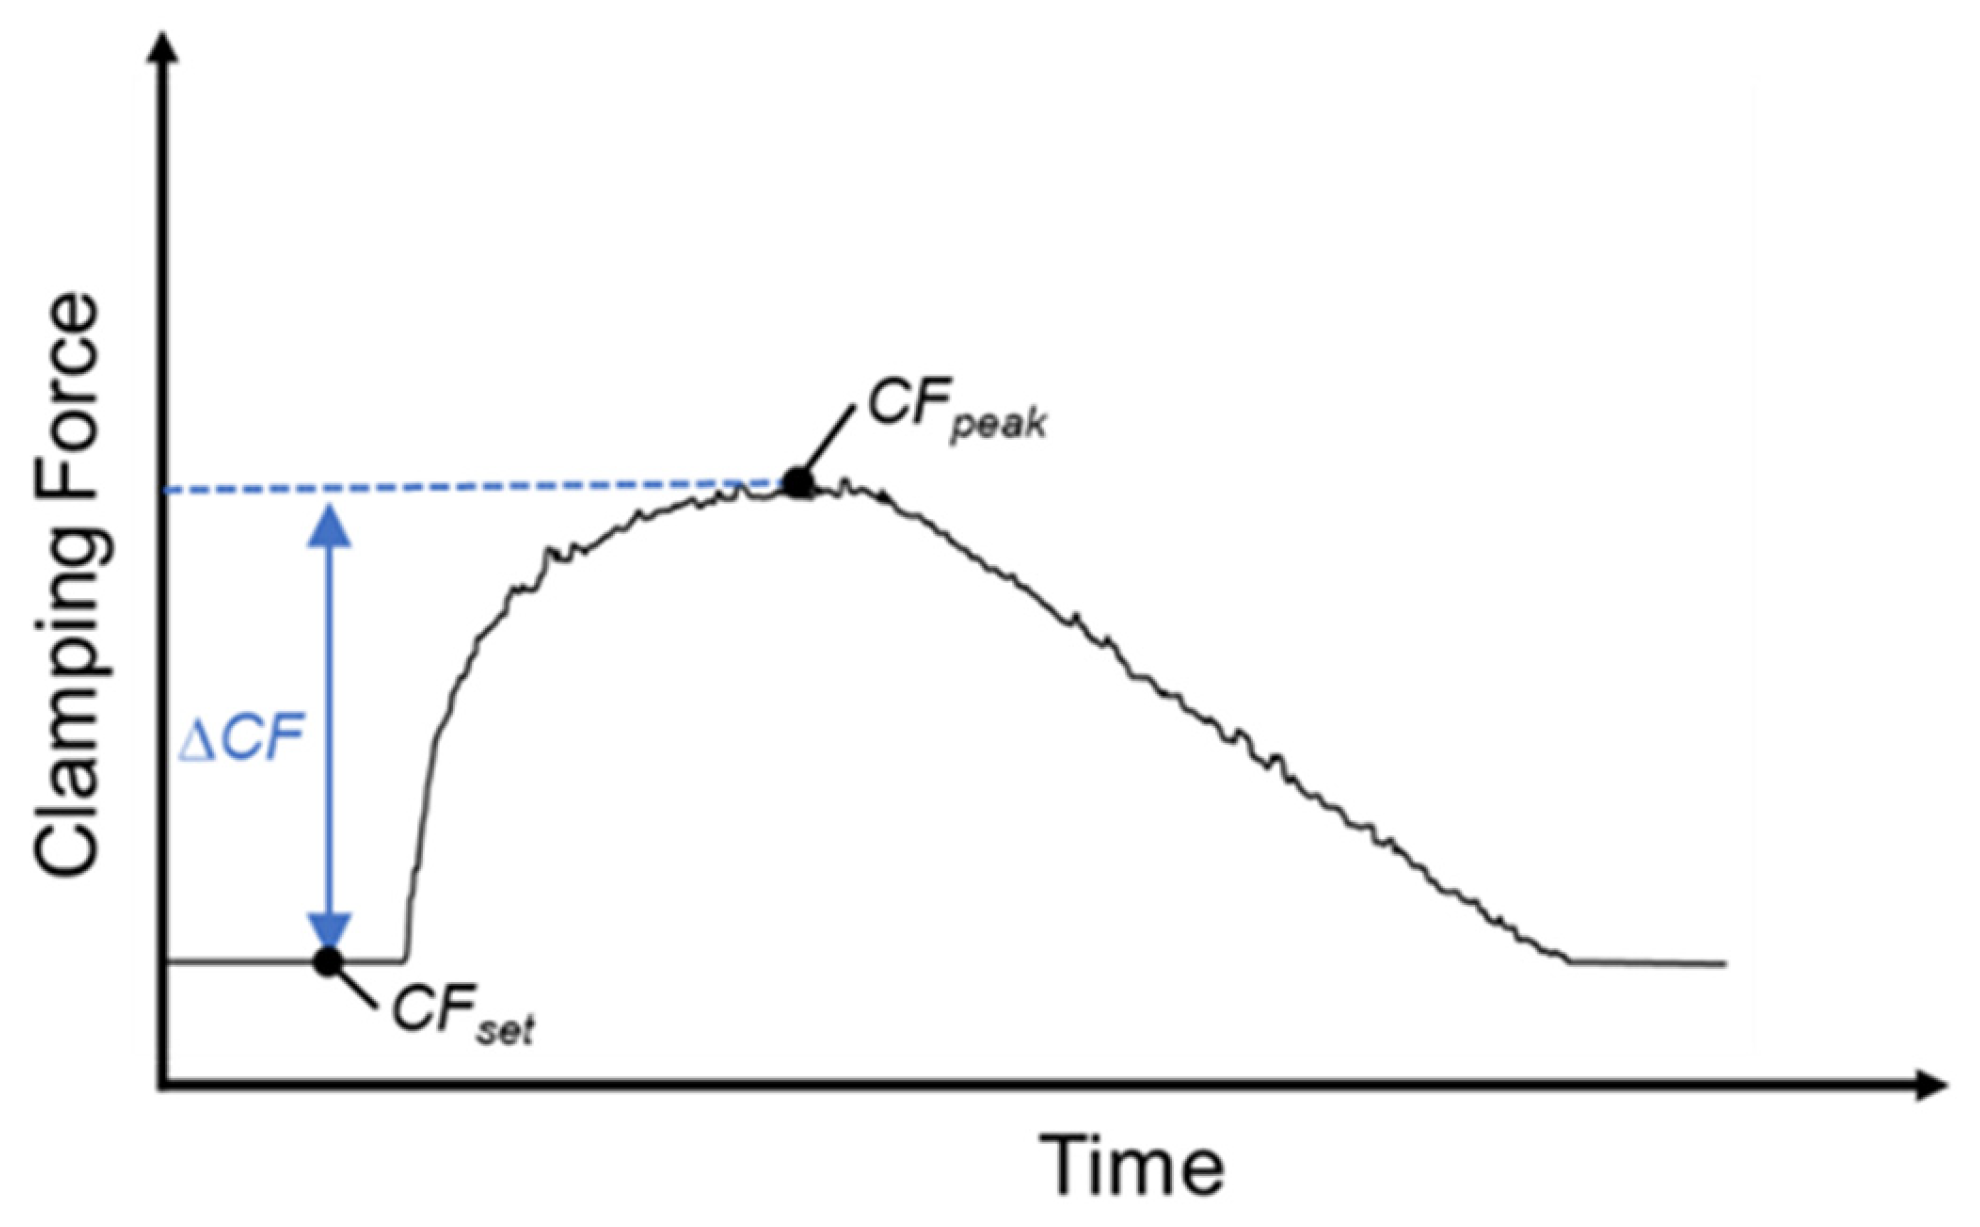
2.2. Clamping Force Difference Value
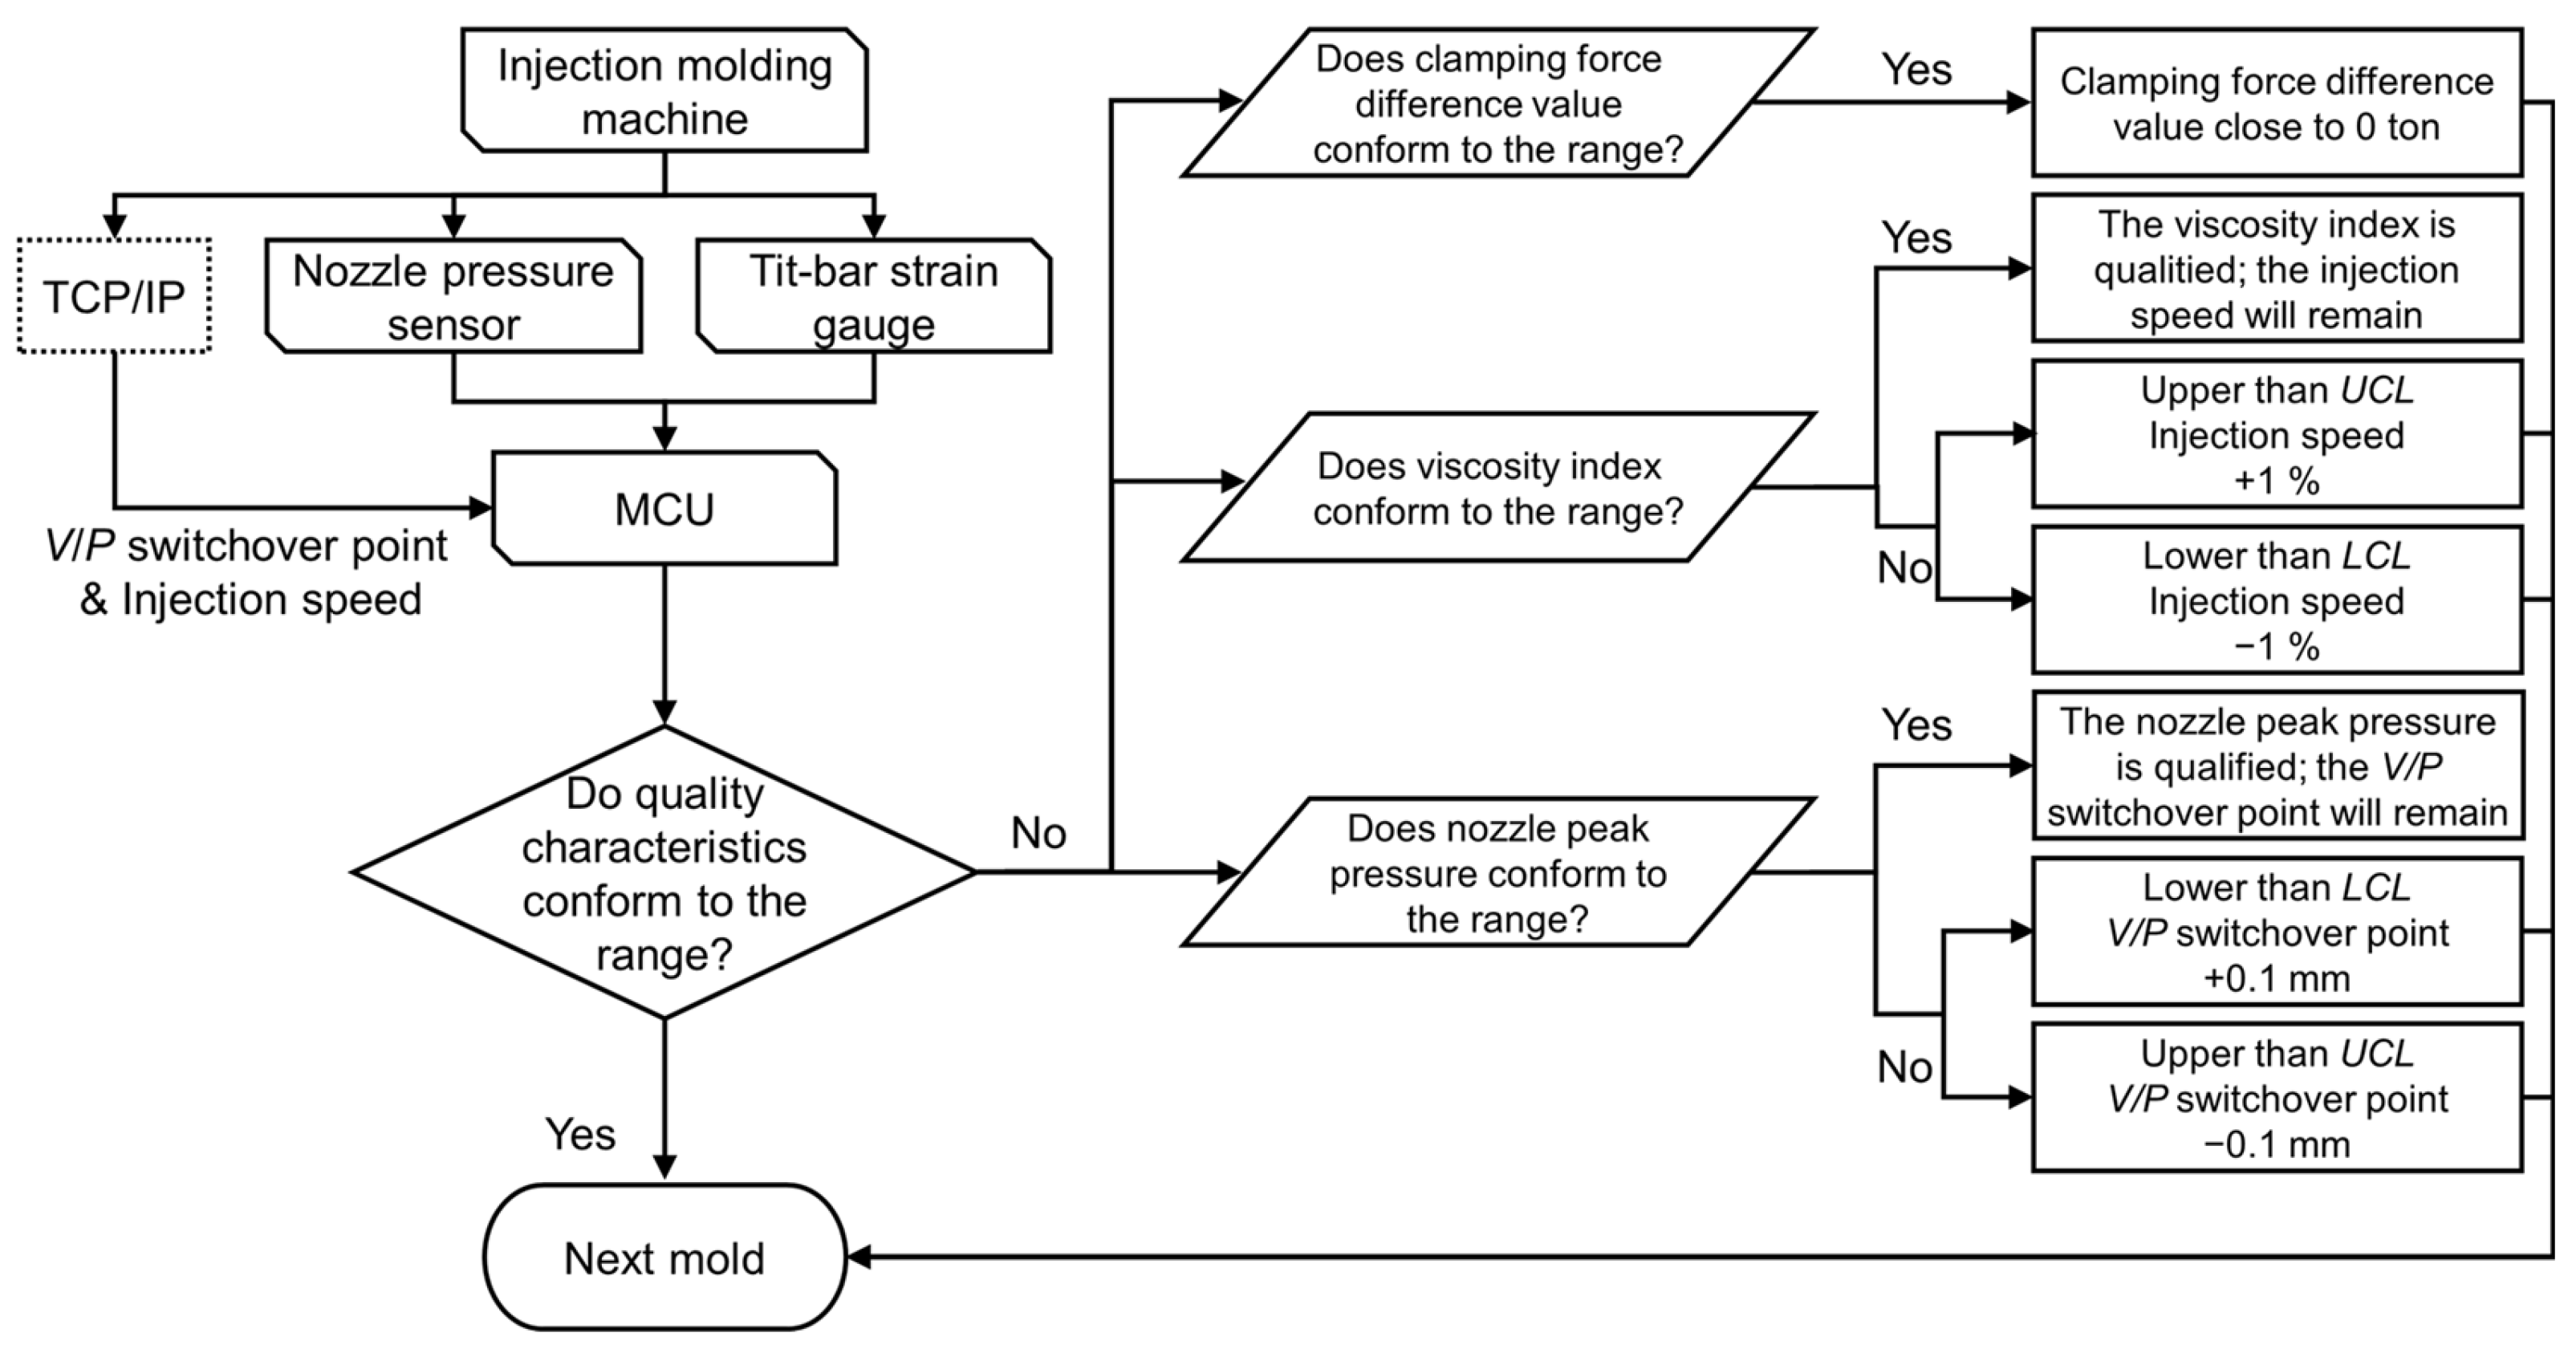
2.3. Adaptive Process Control System
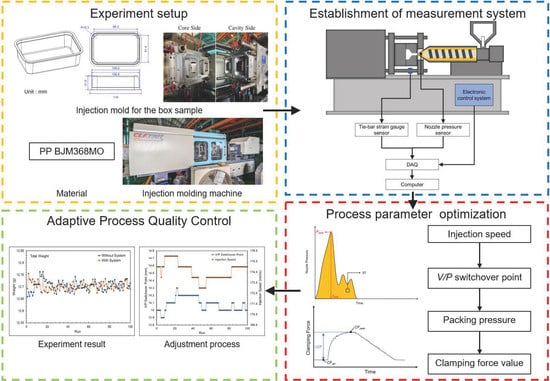
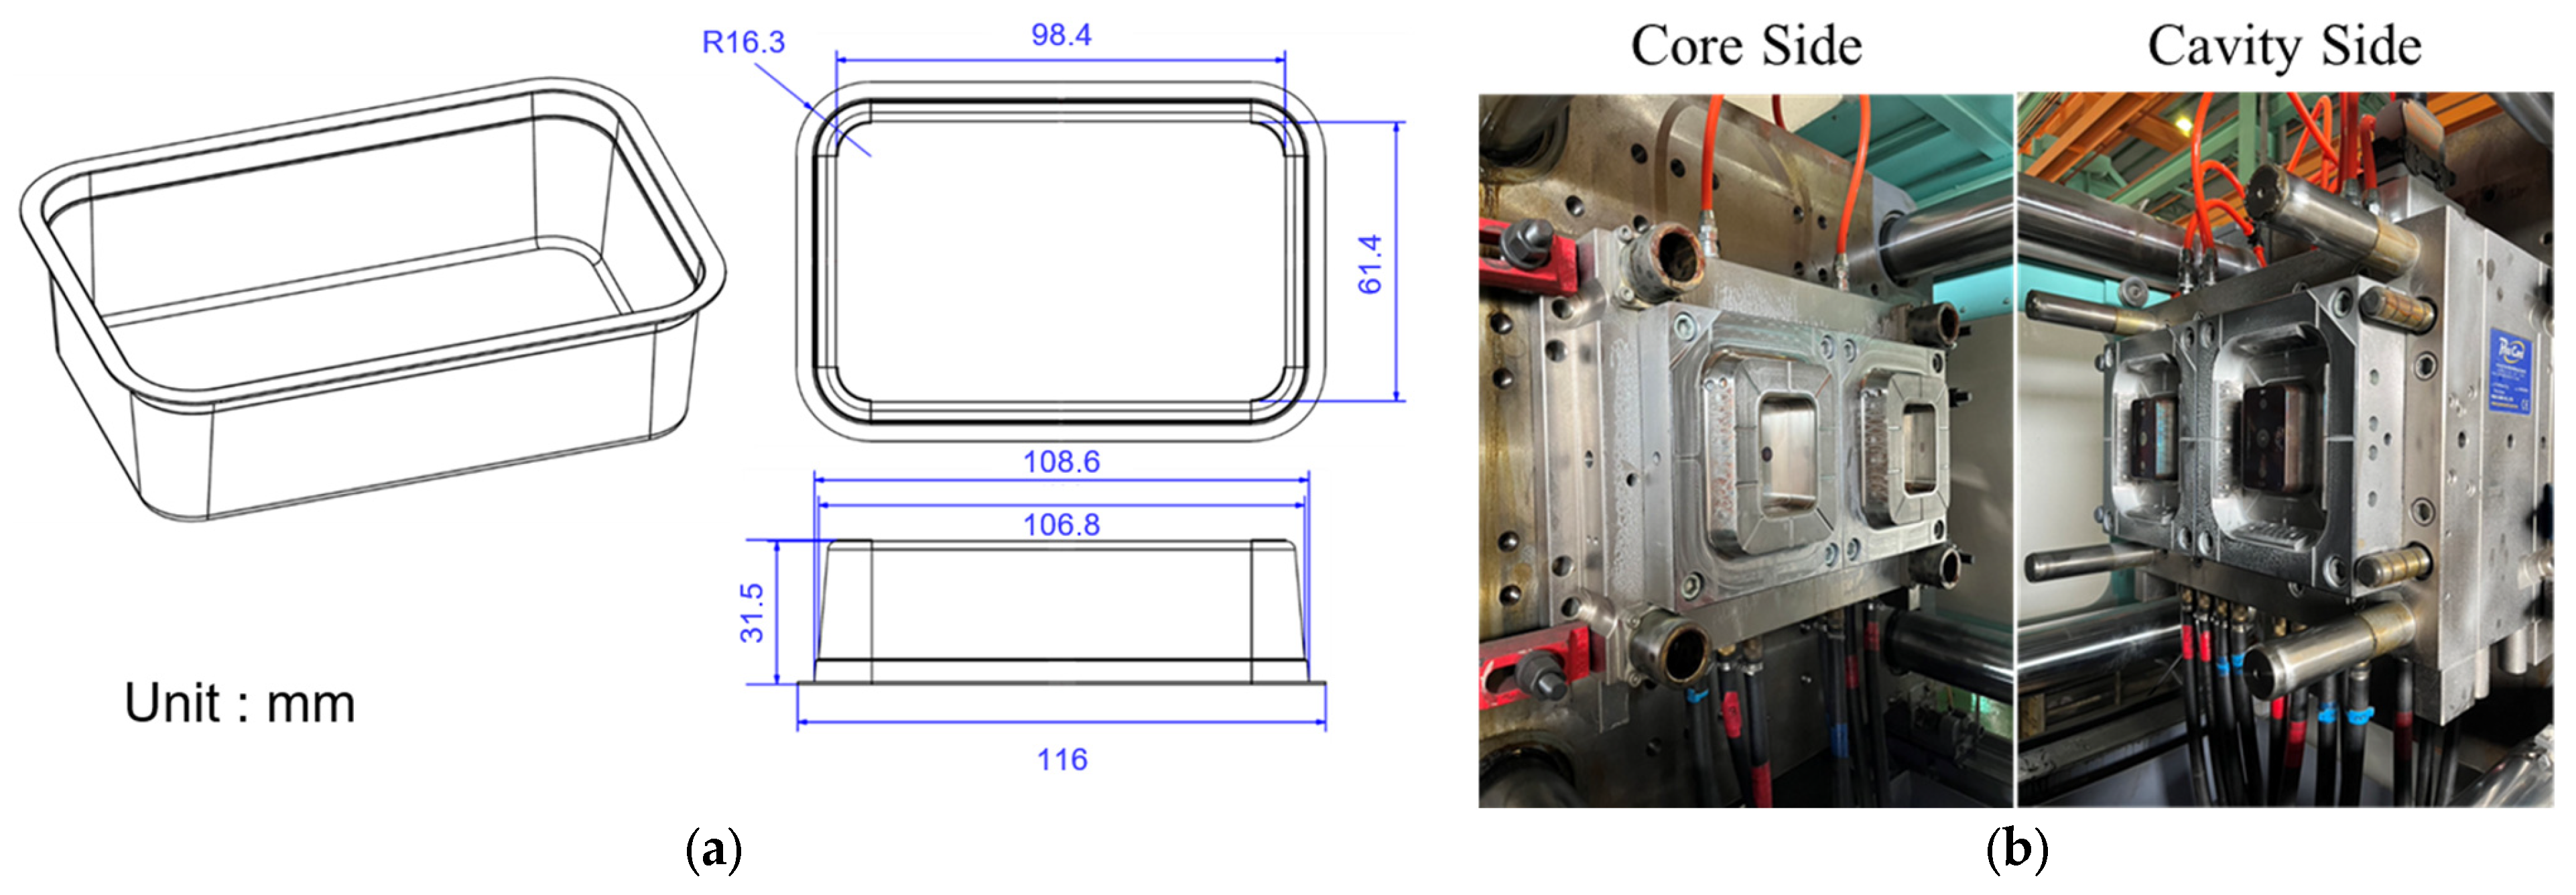
3. Experiment Setups
3.1. Materials
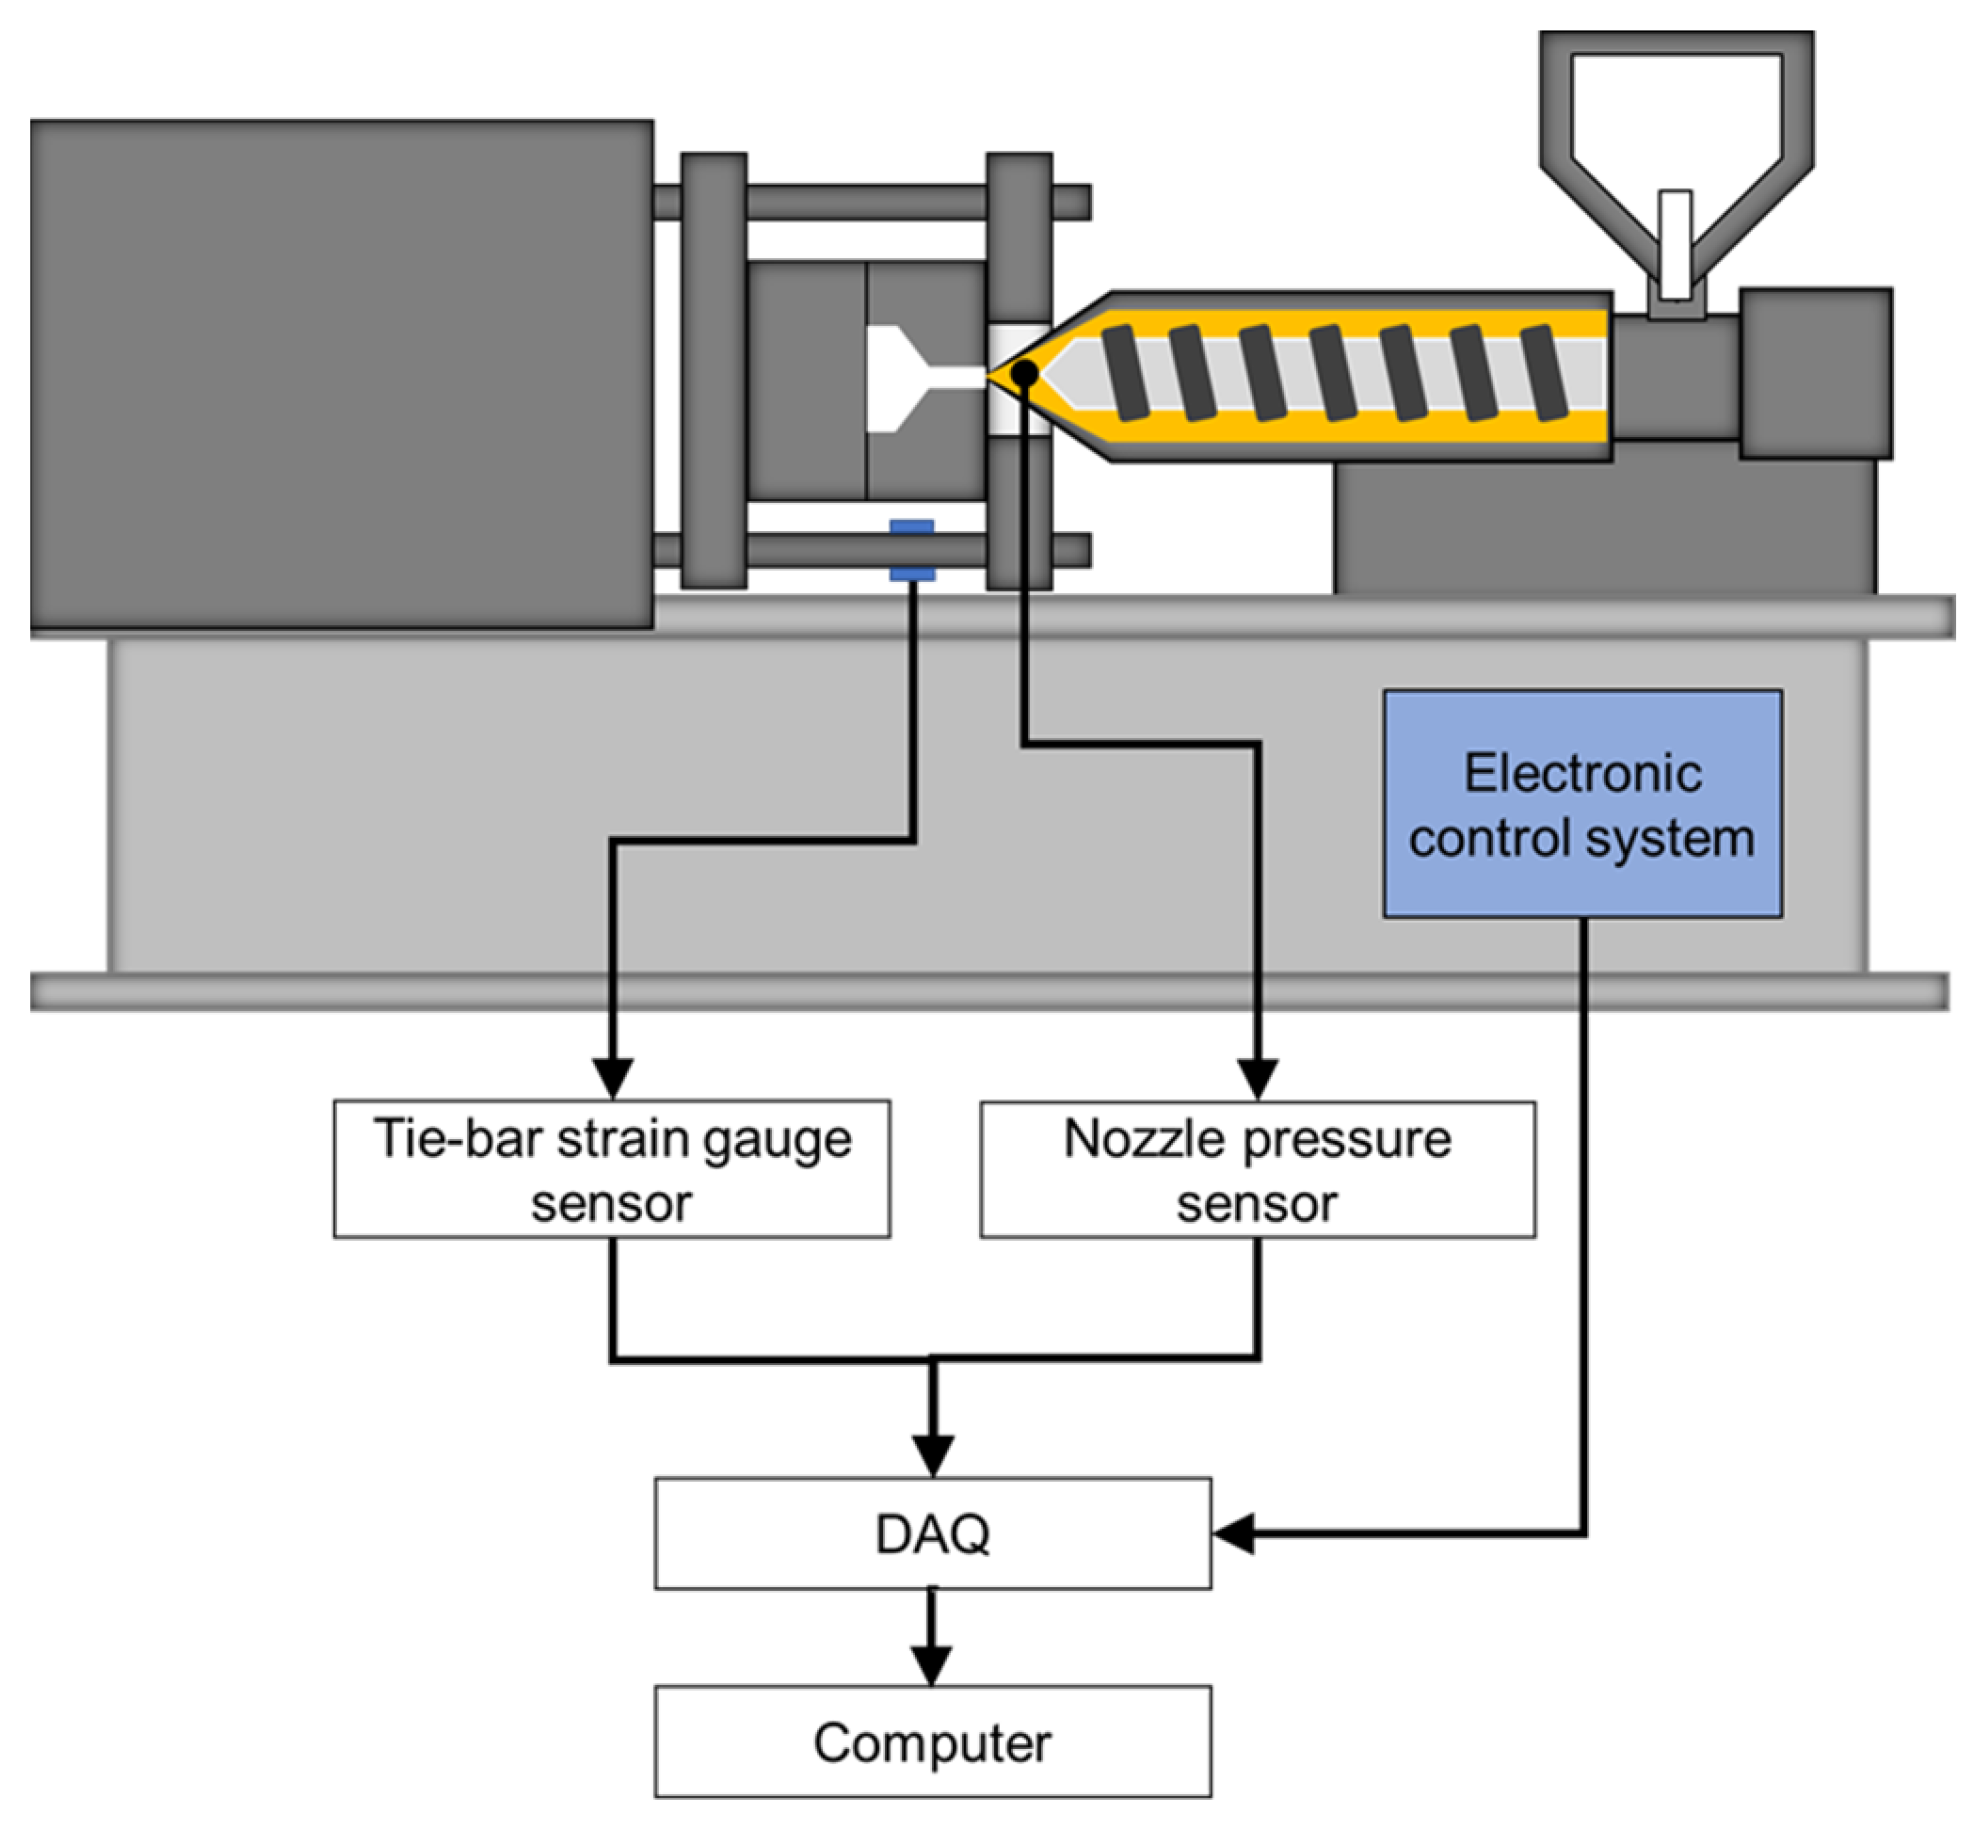
3.2. Equipment
4. Results and Discussion
4.1. Parameter Optimization Process
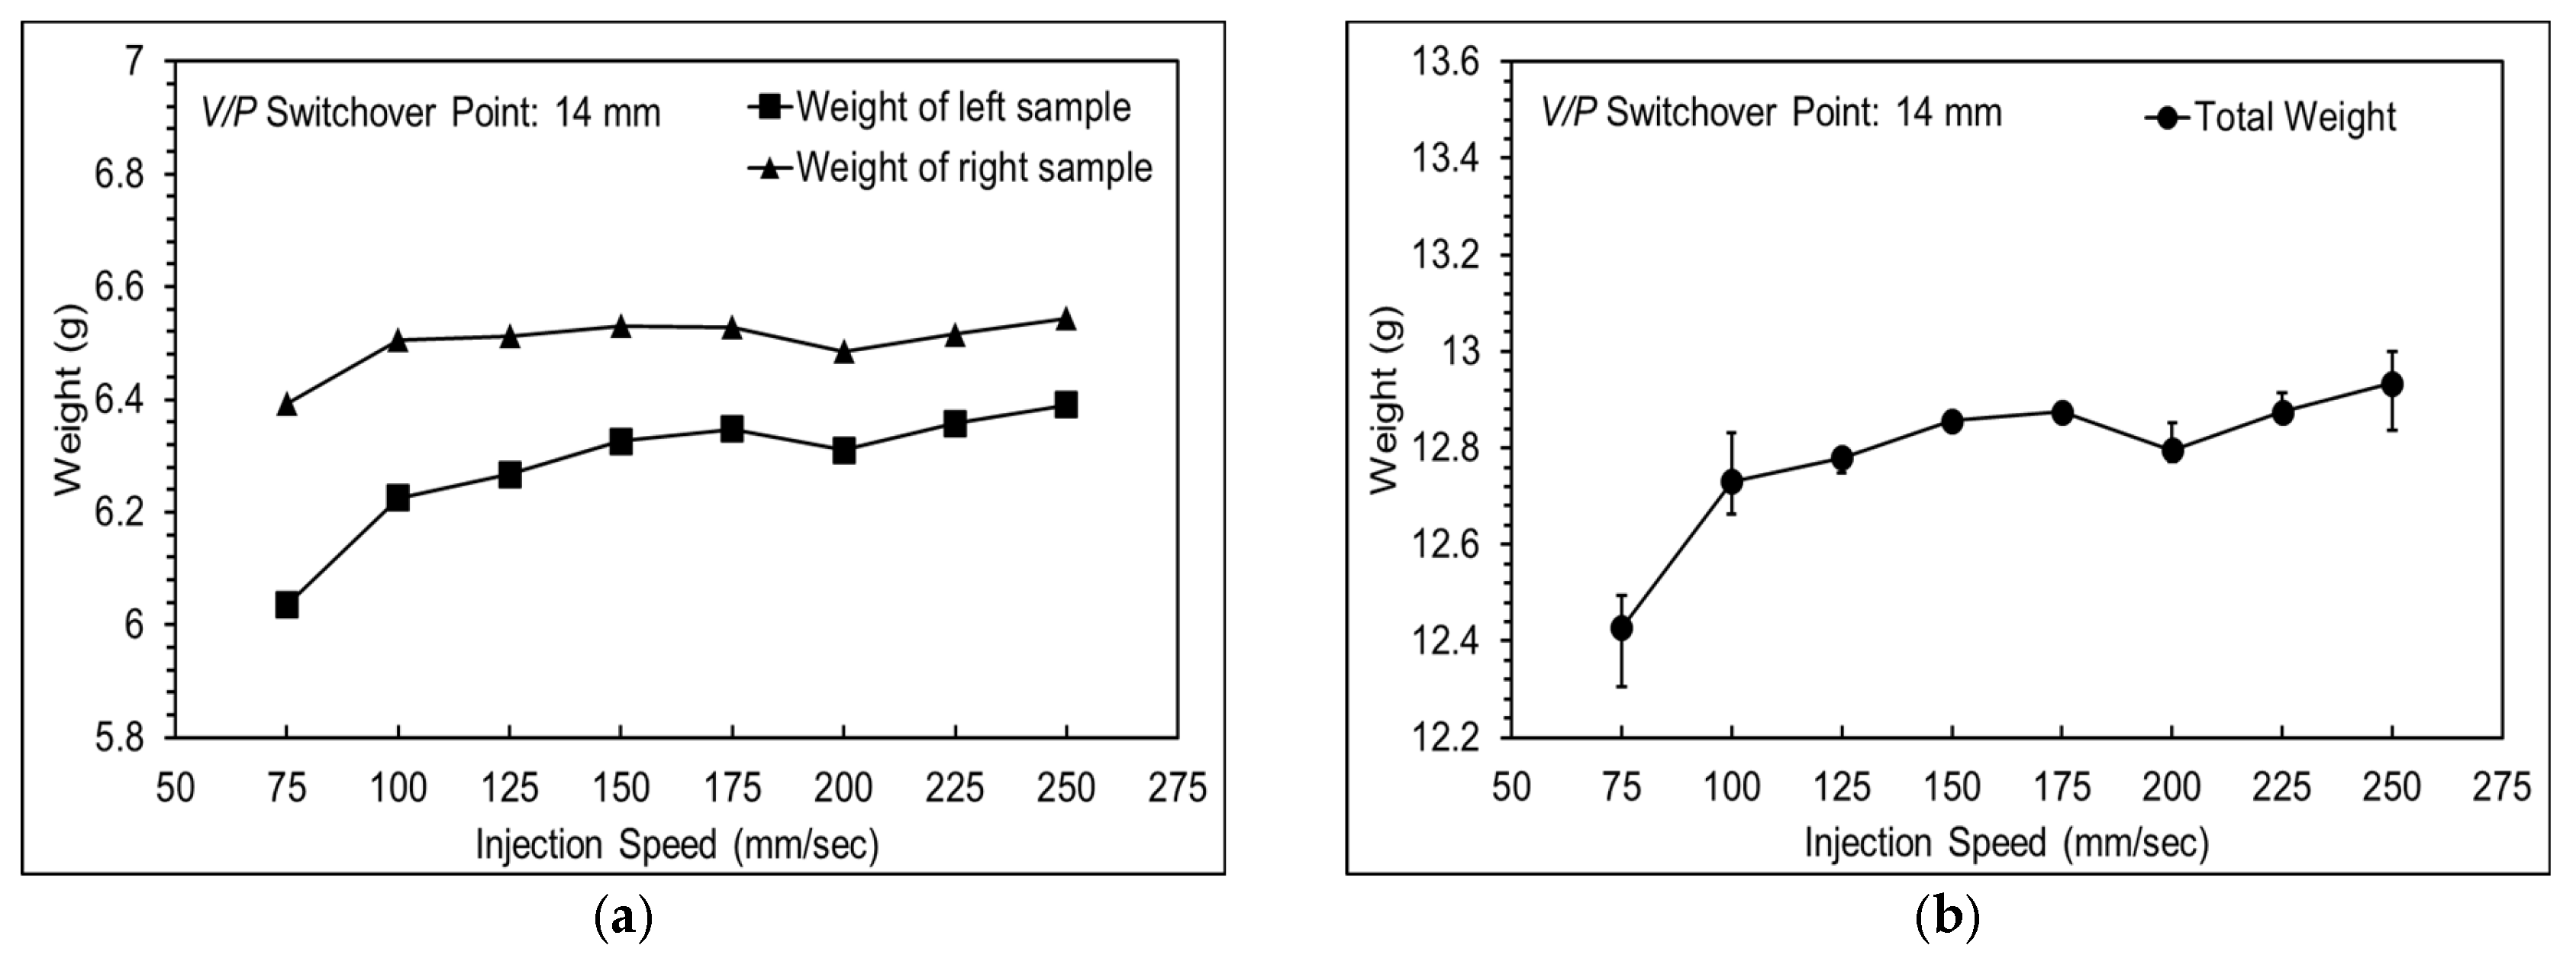
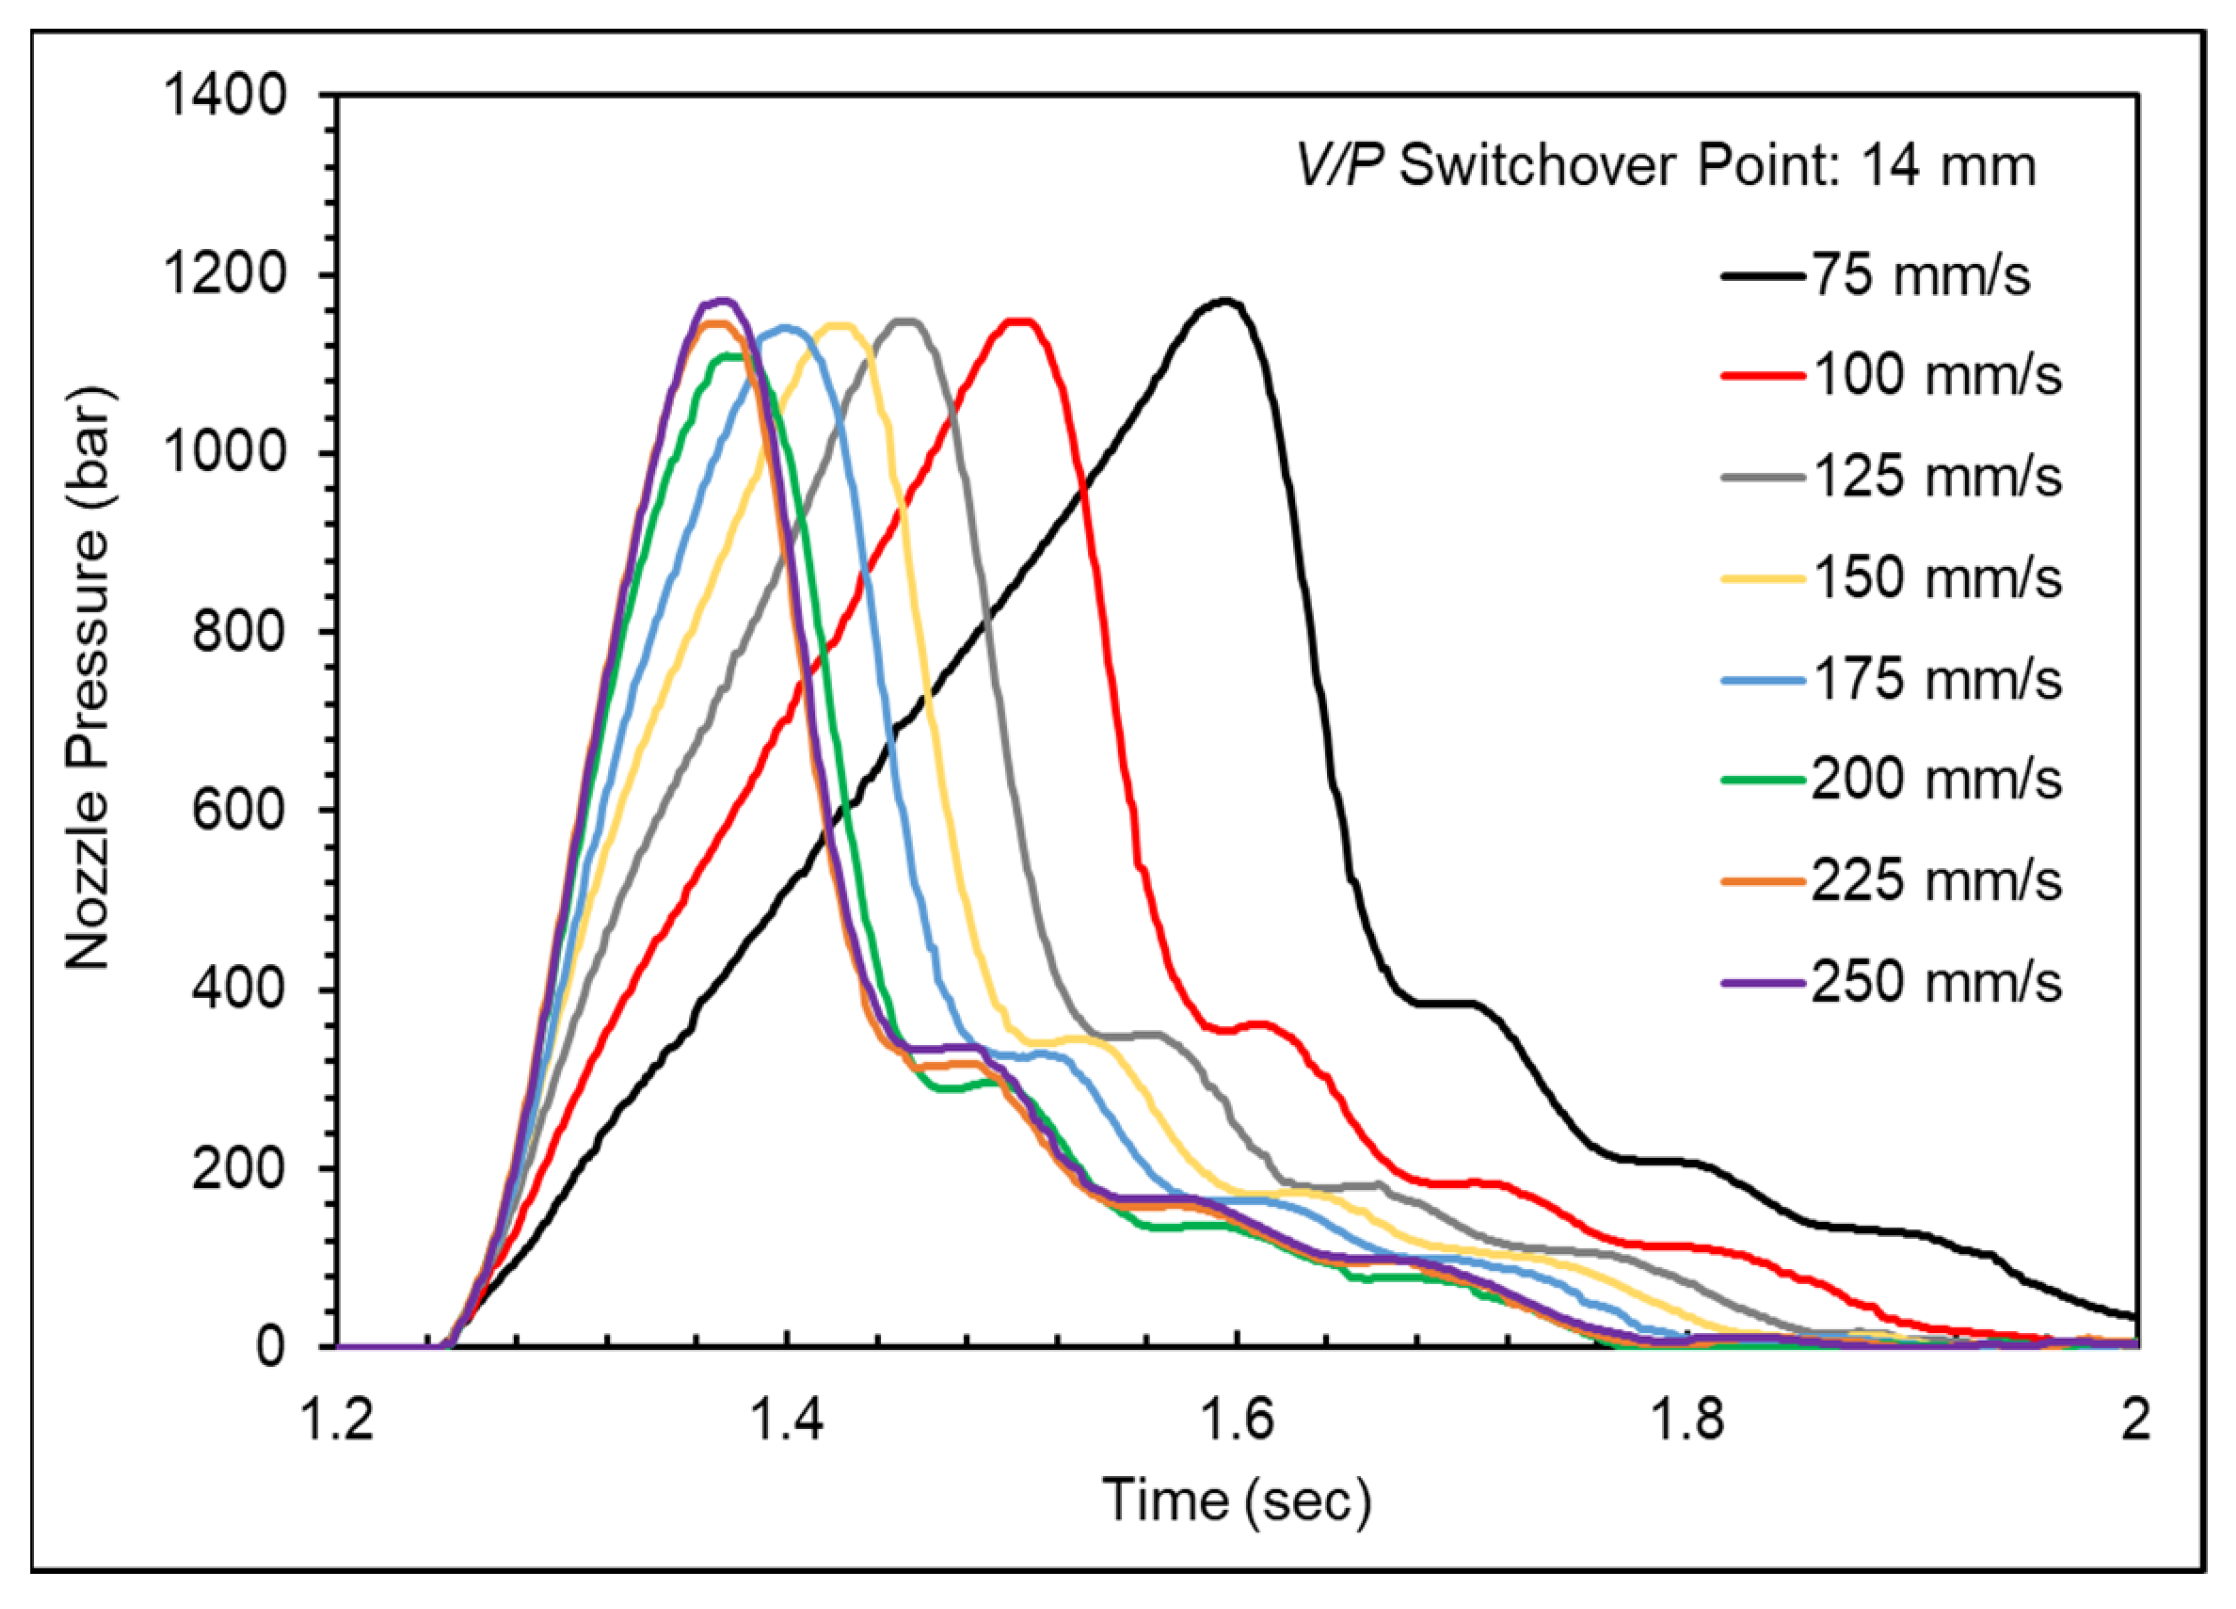
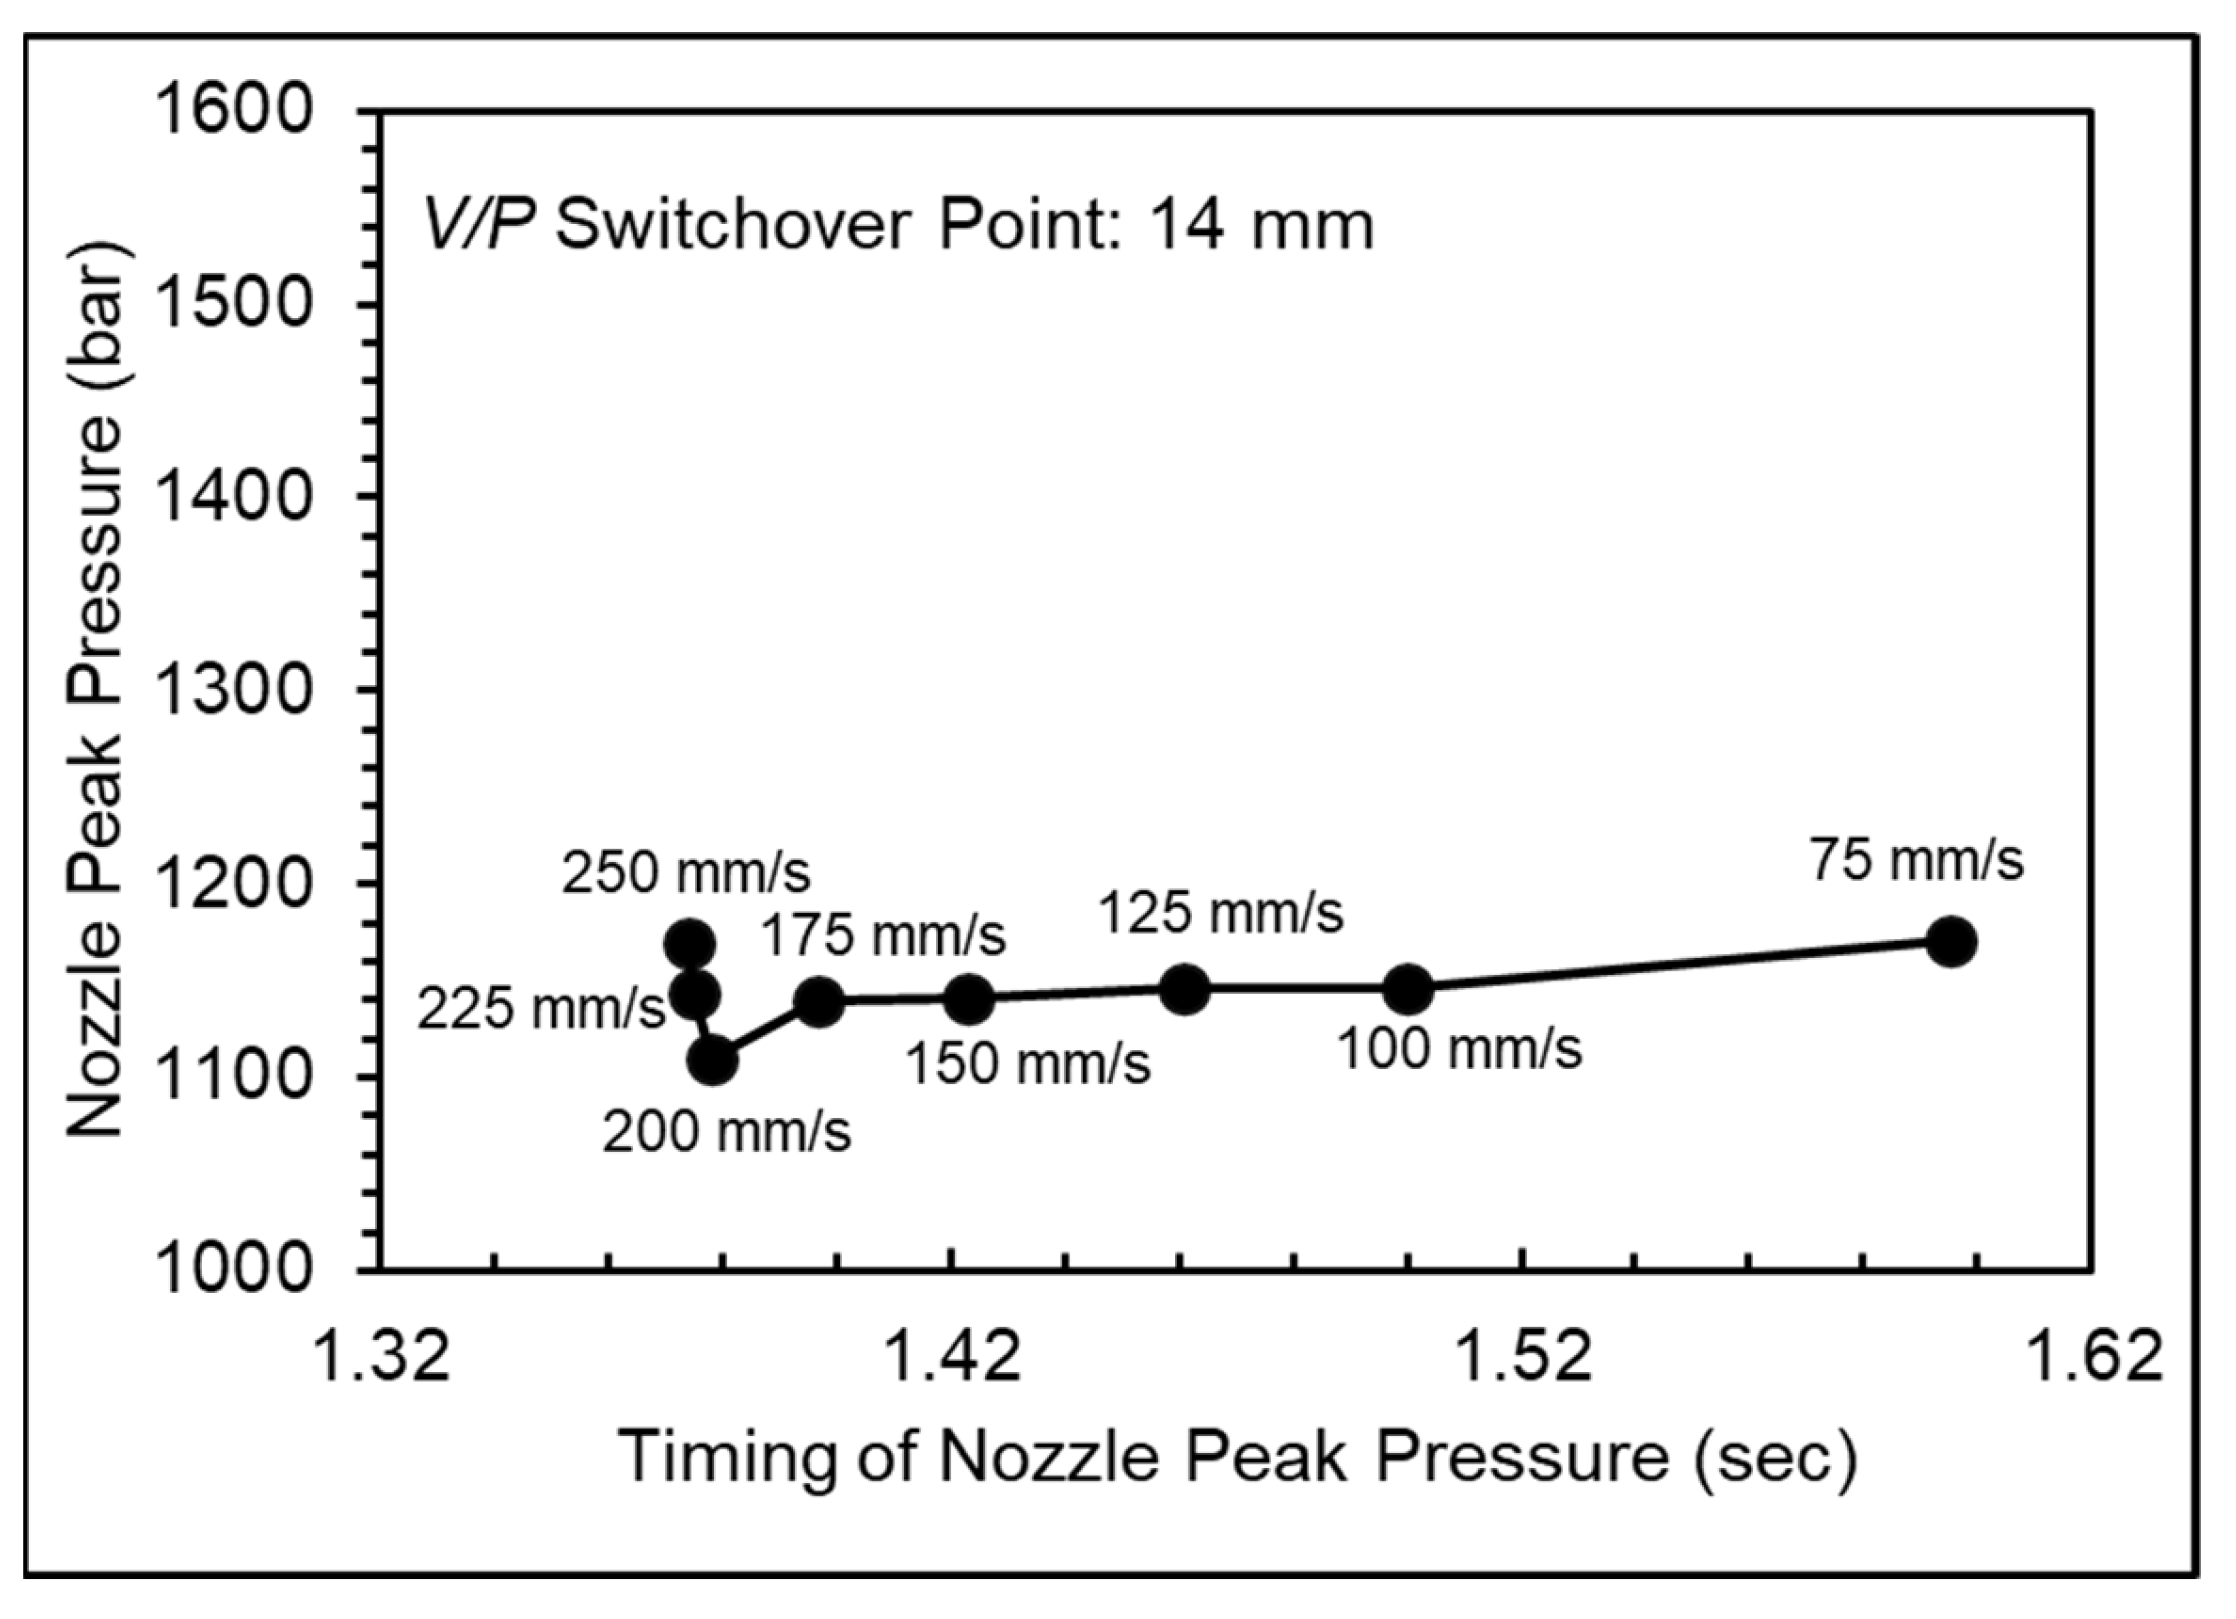
4.1.1. Injection Speed Experiments
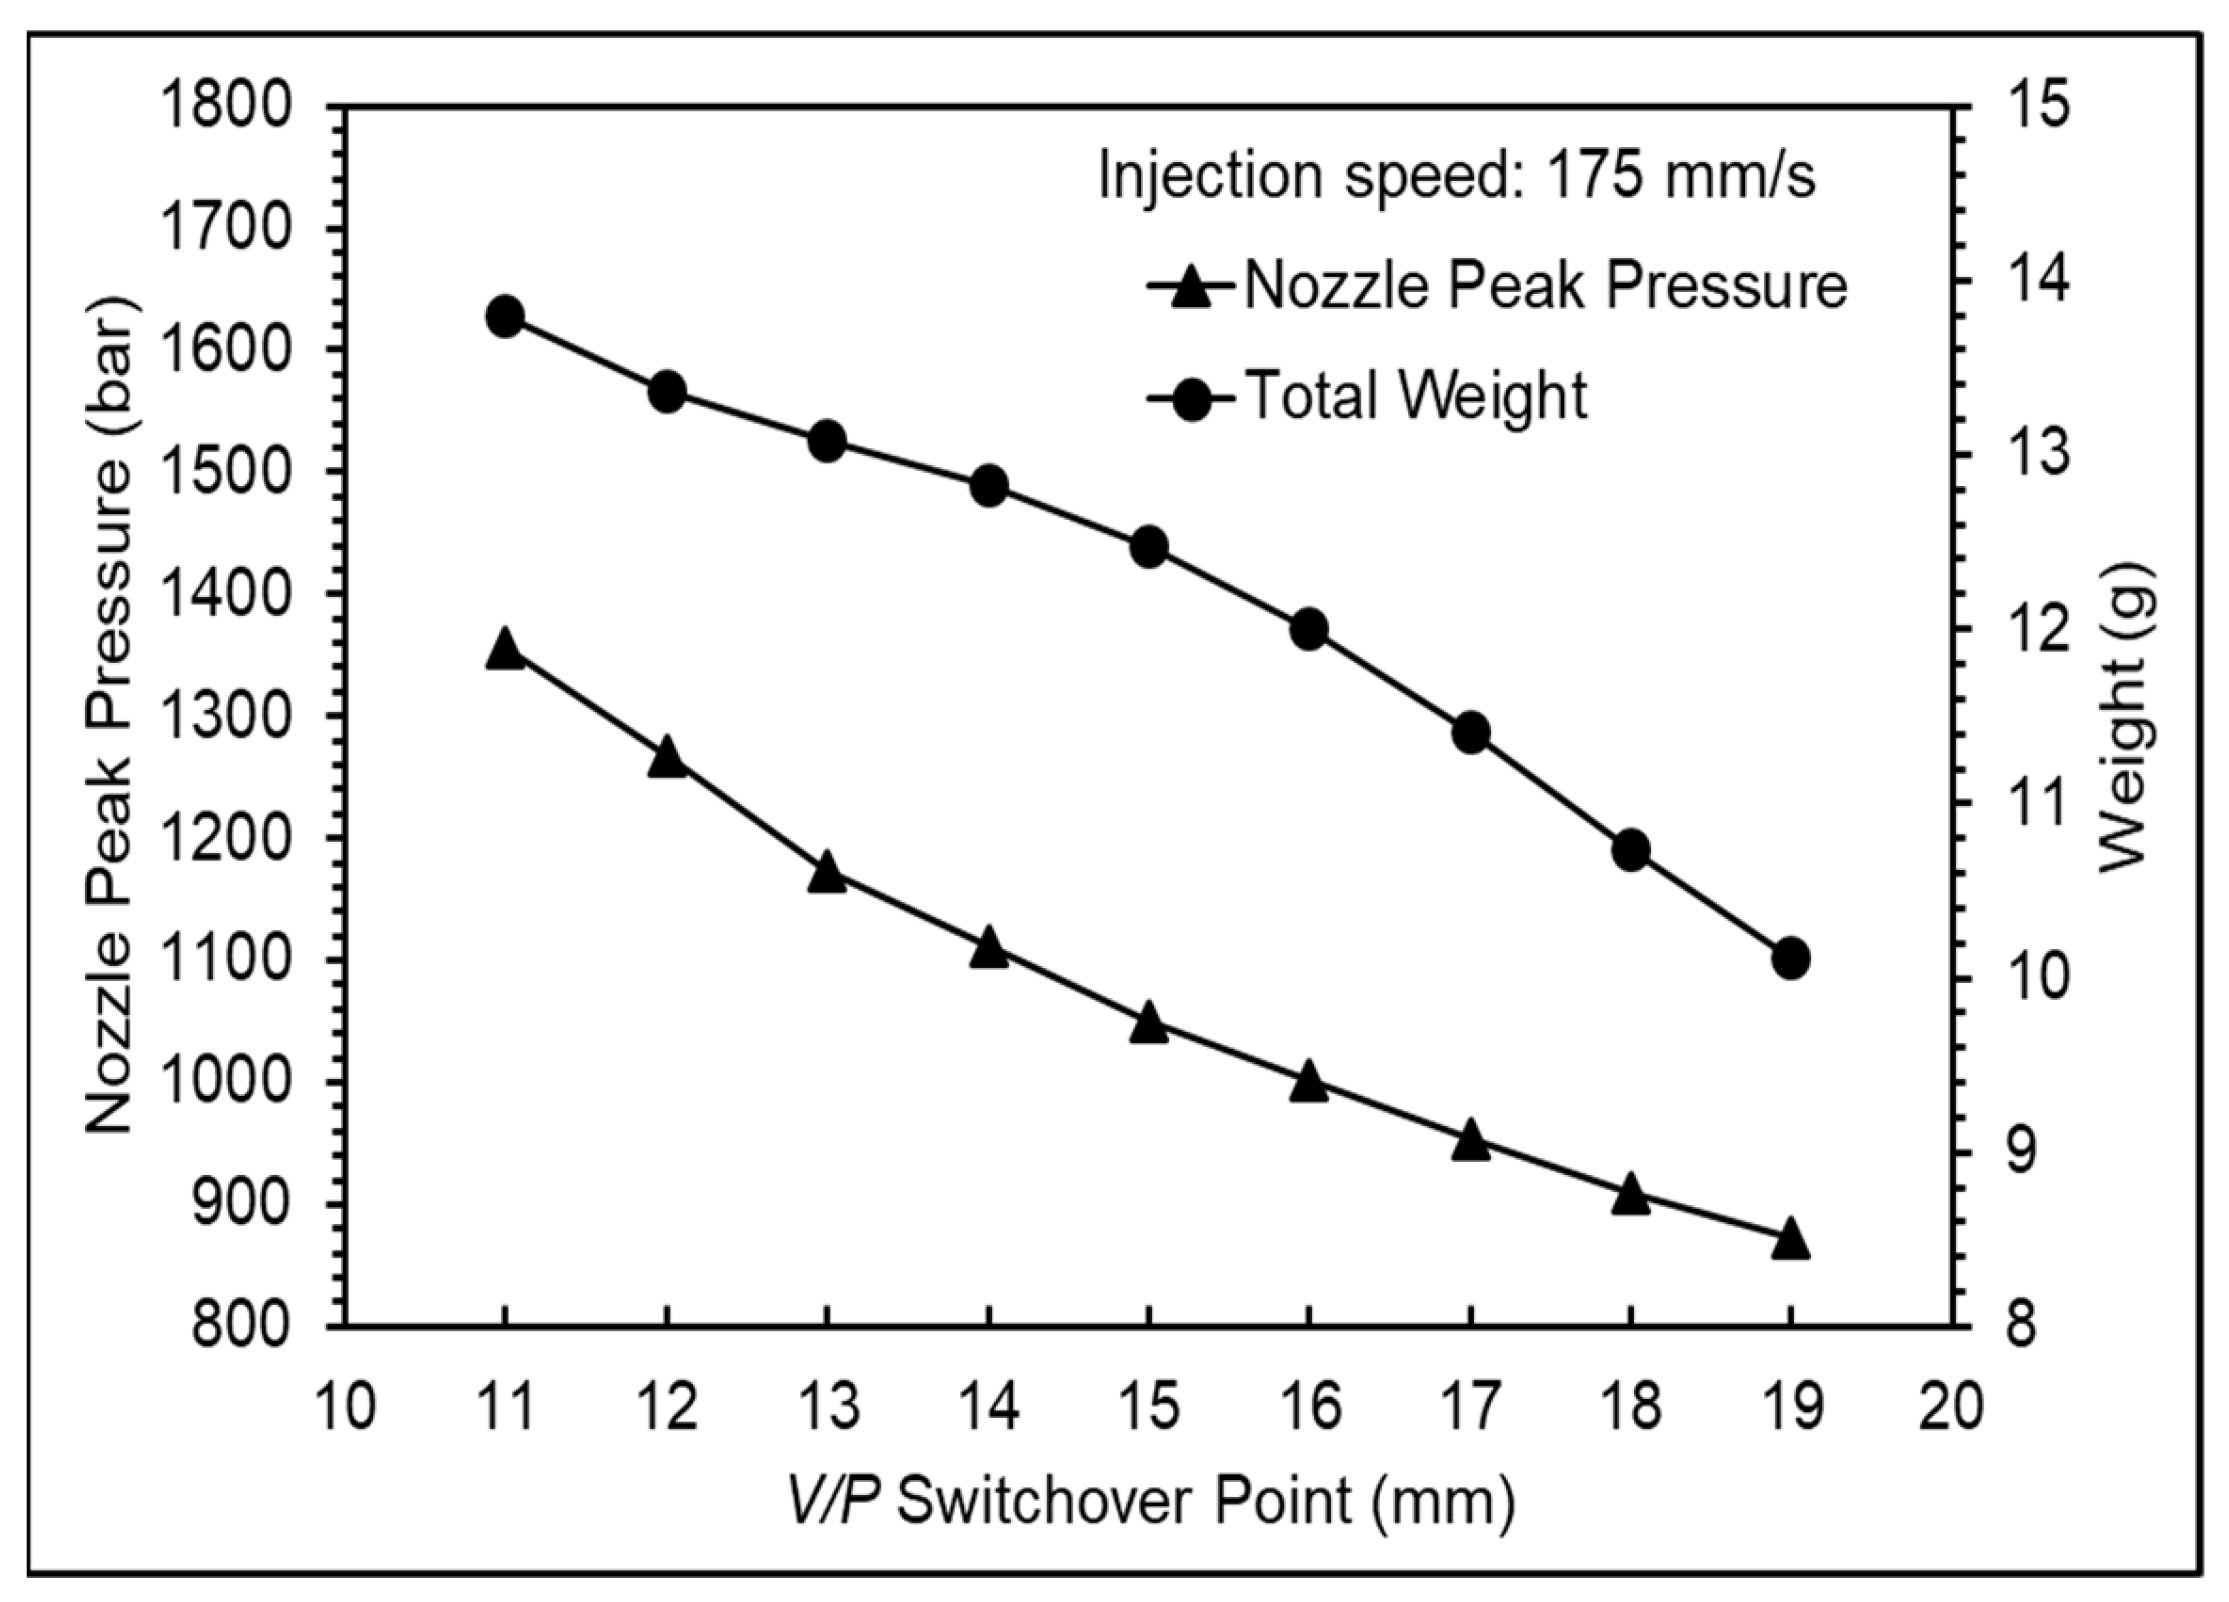
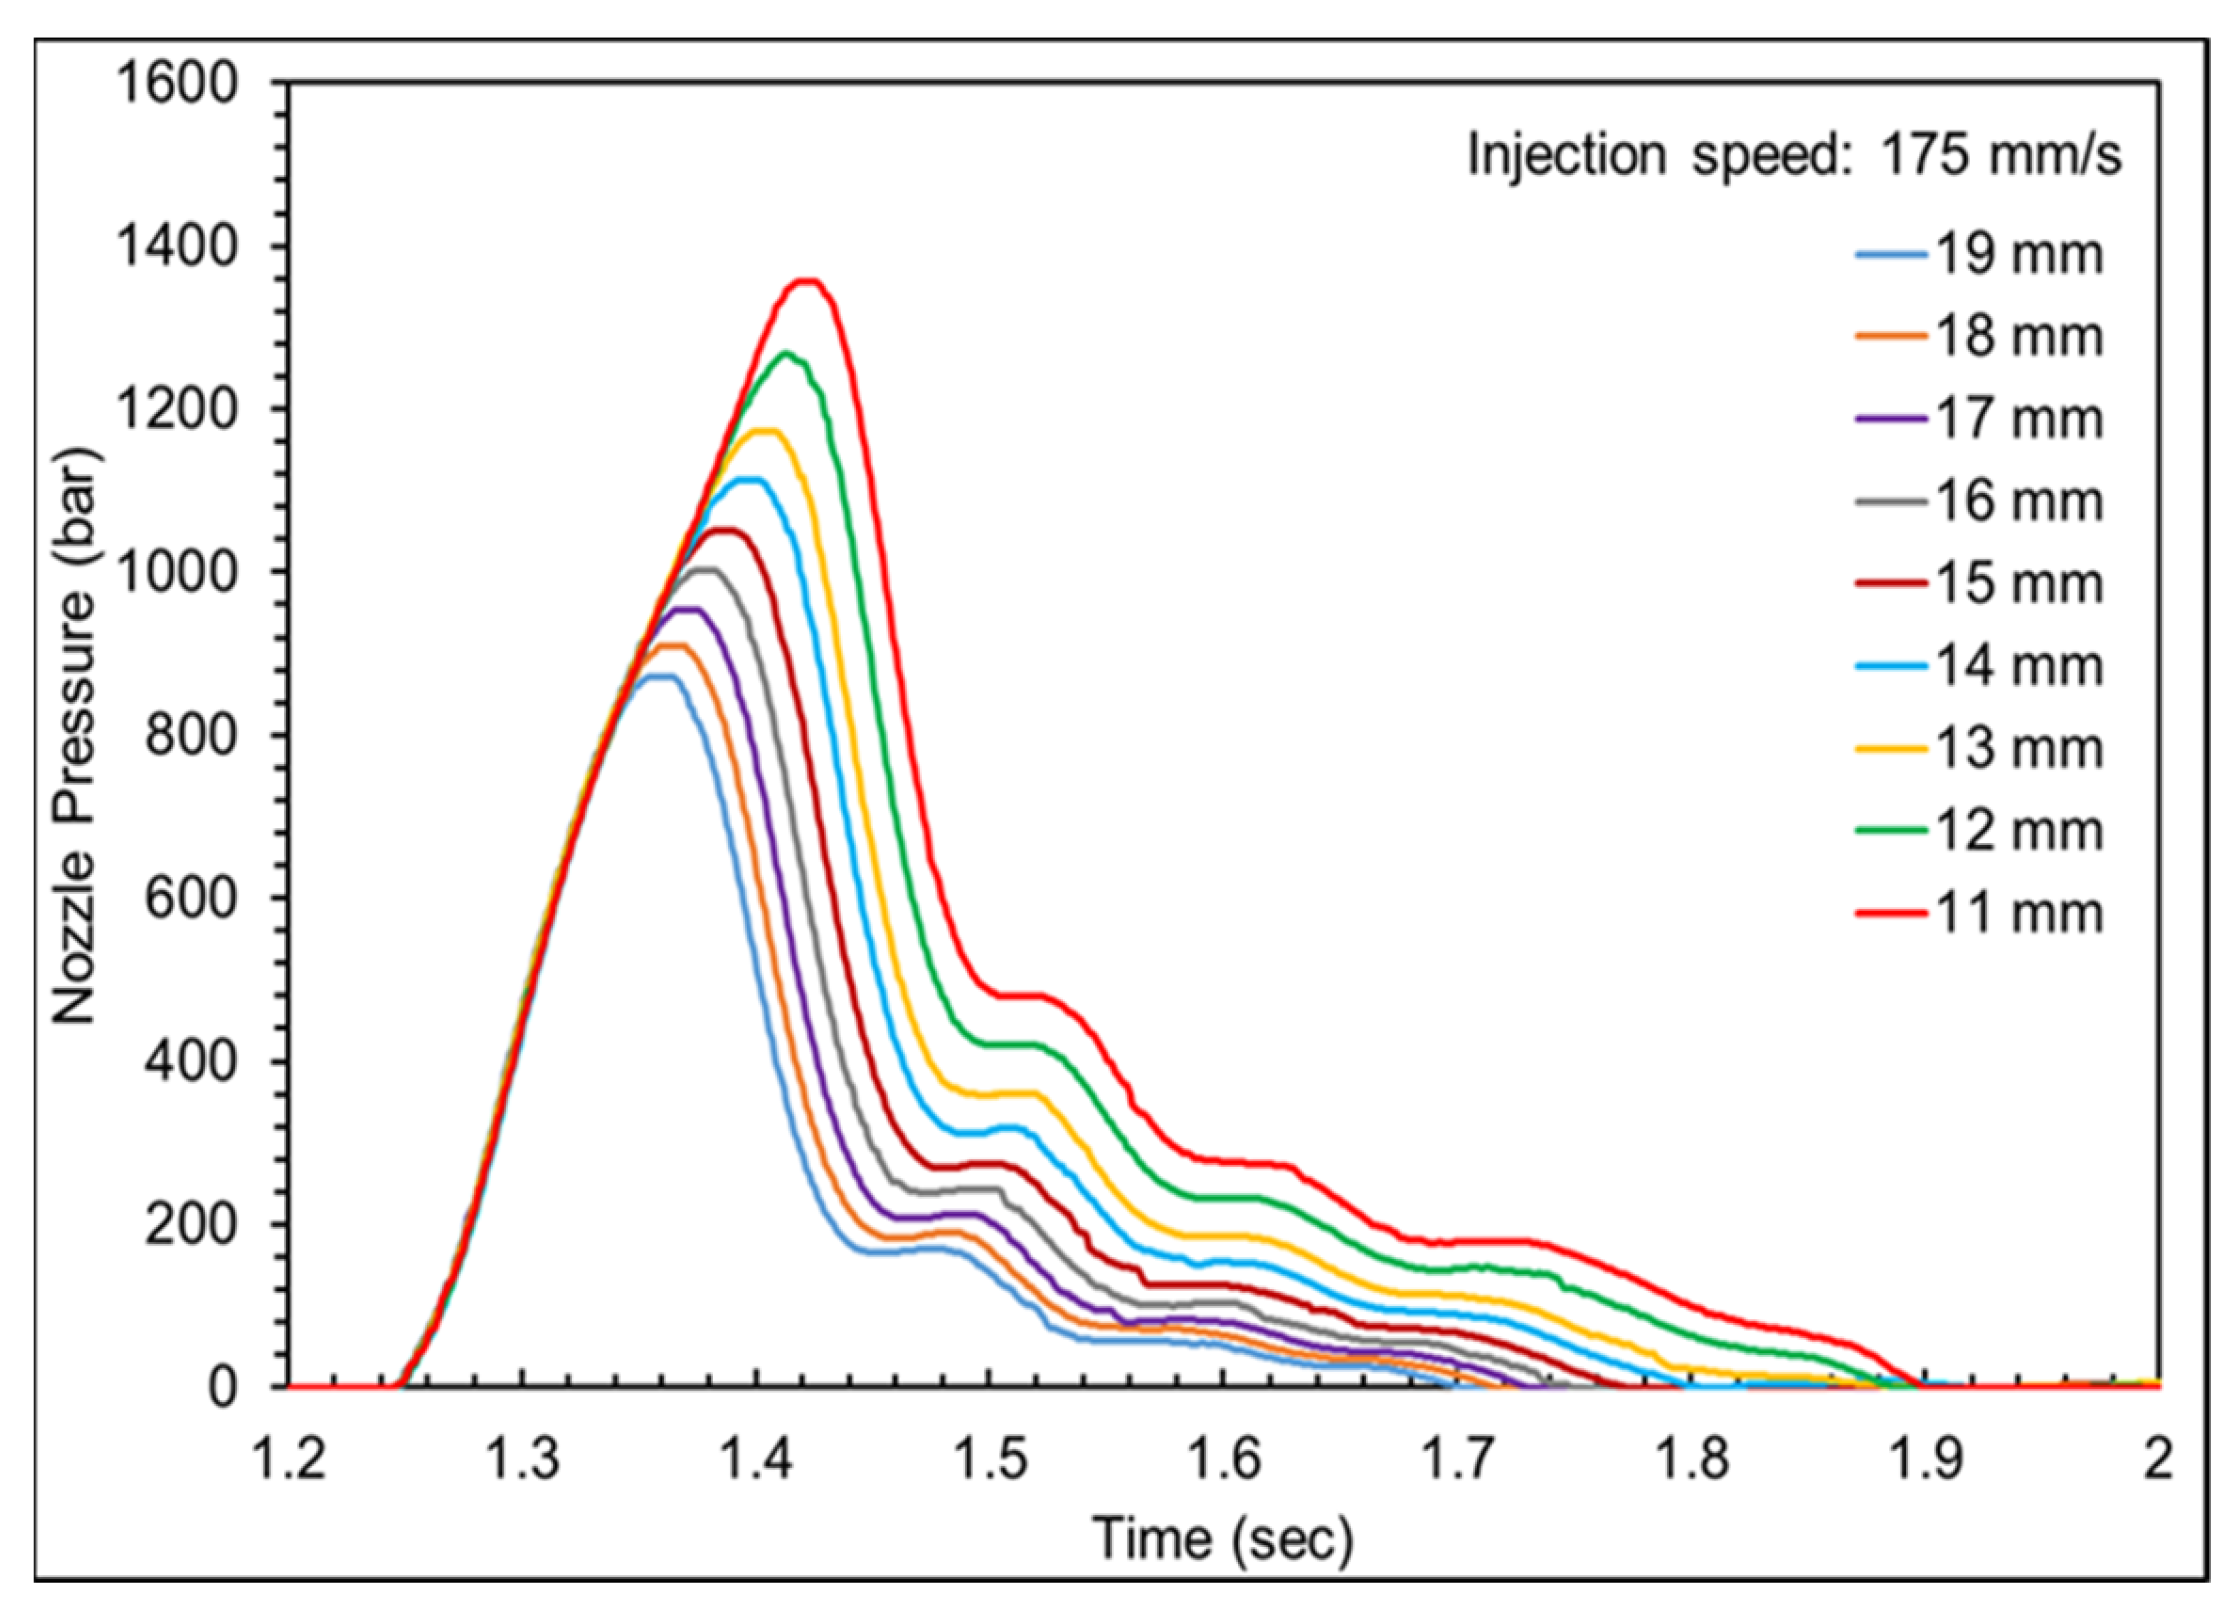
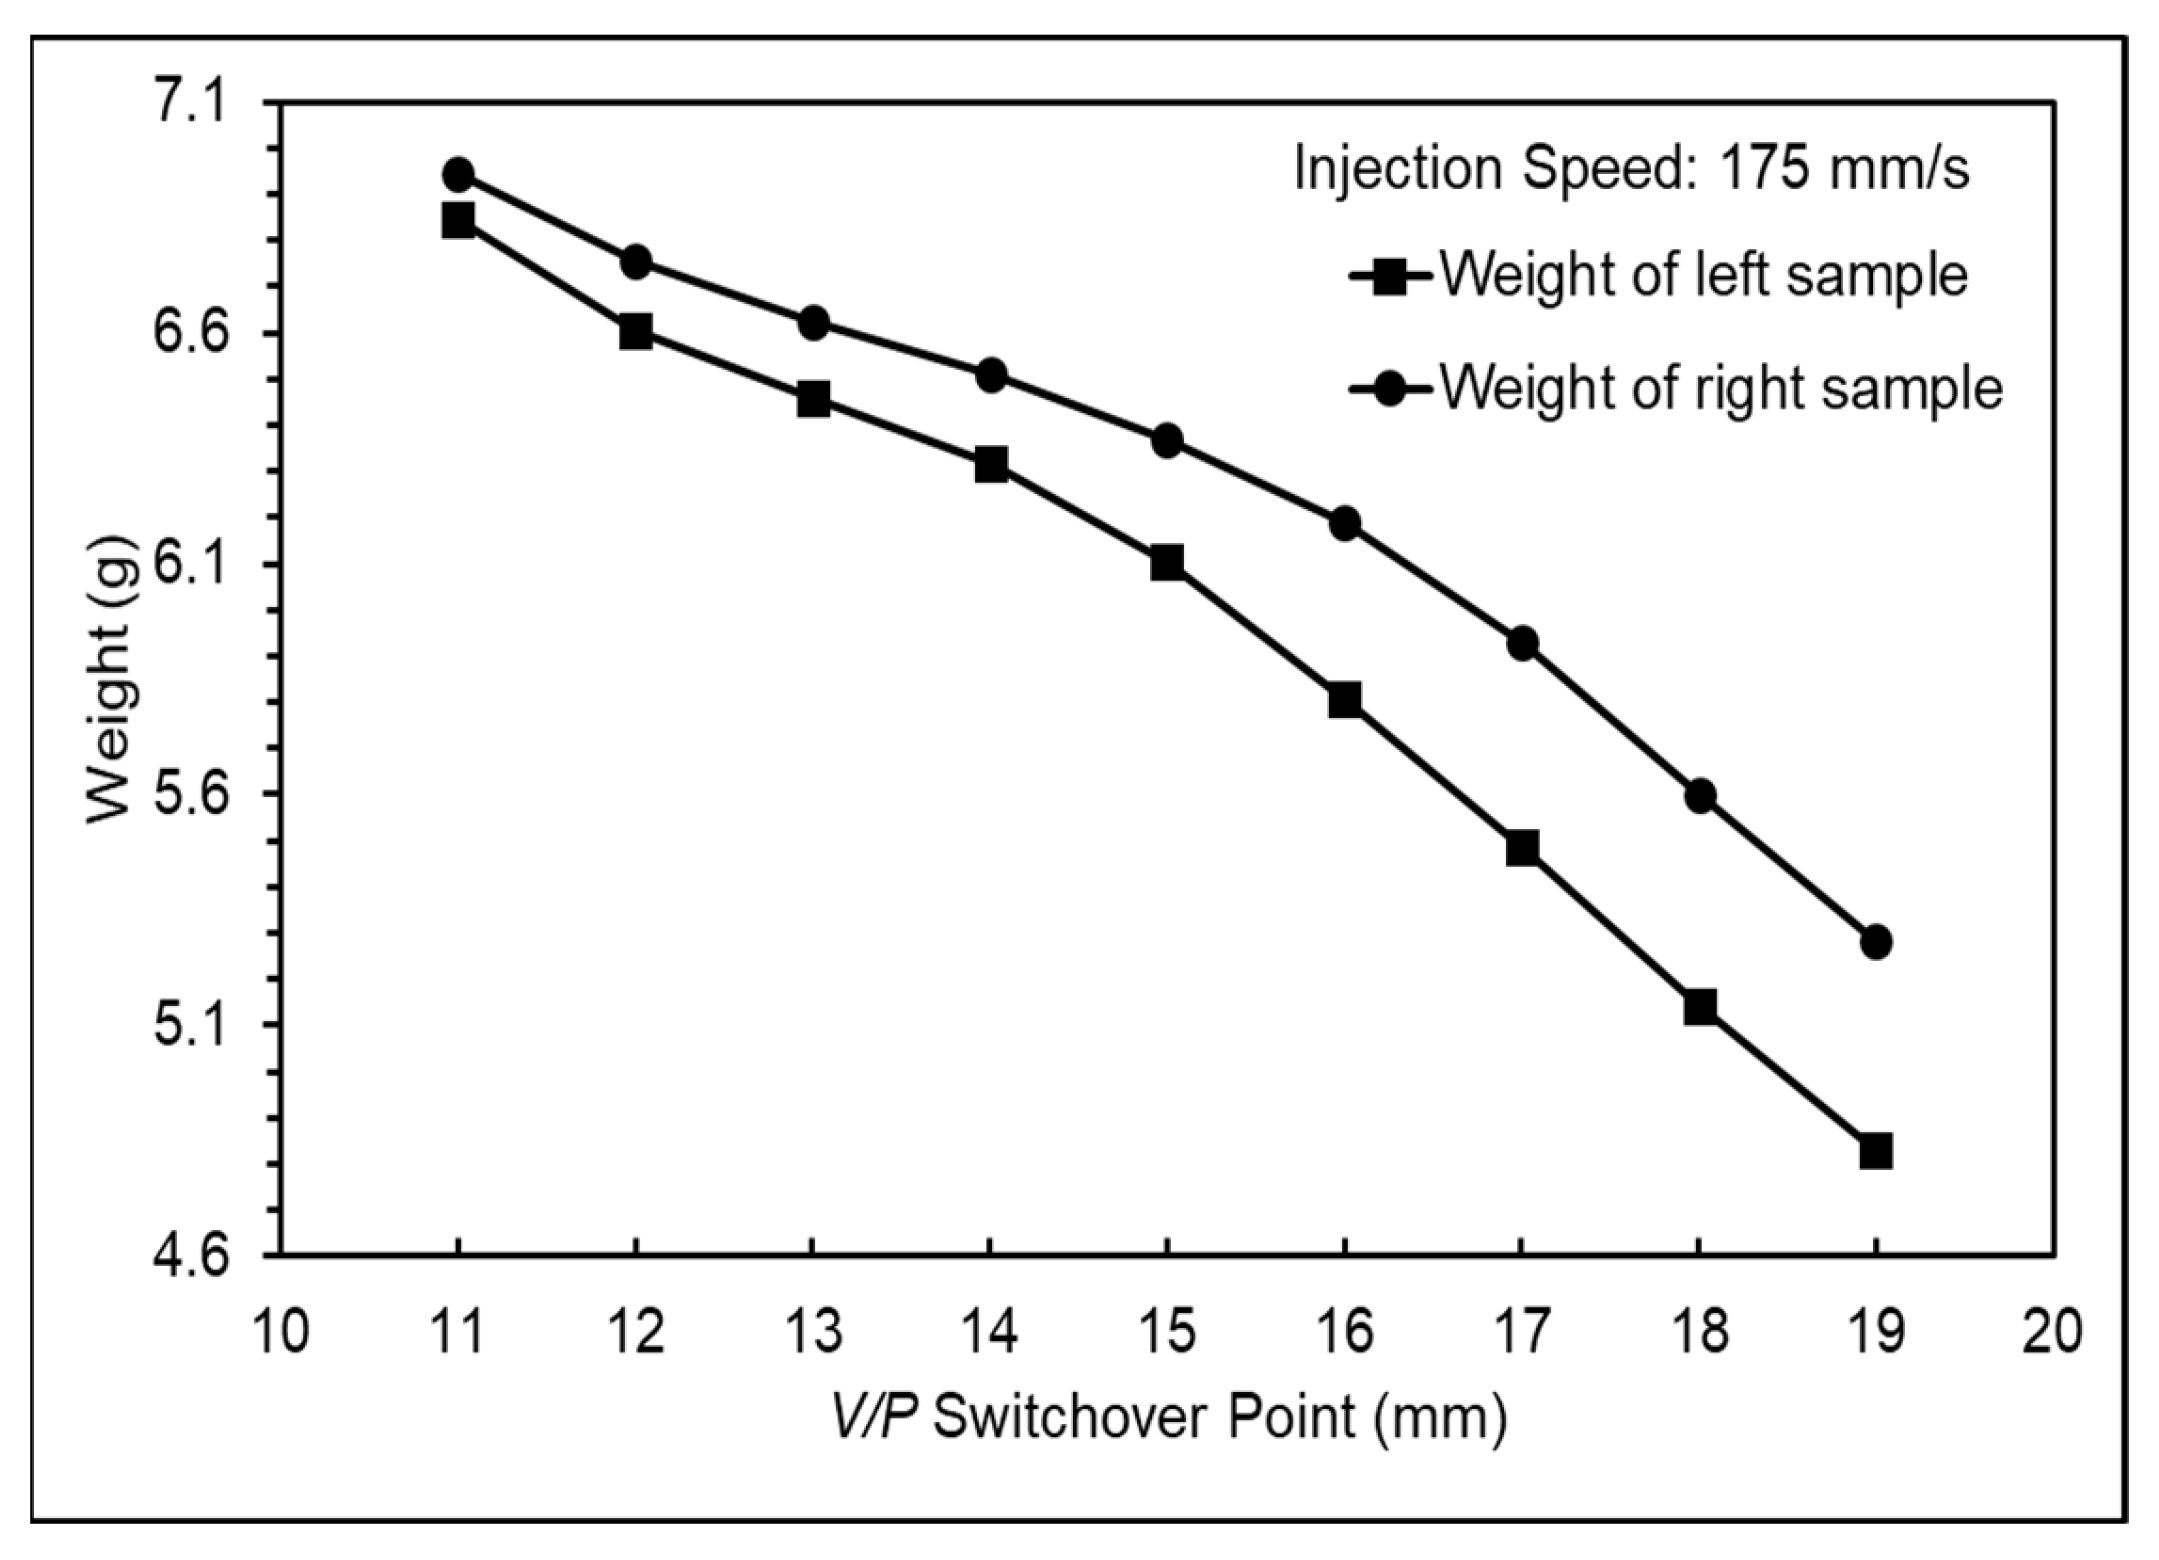
4.1.2. V/P Switchover Point Experiments
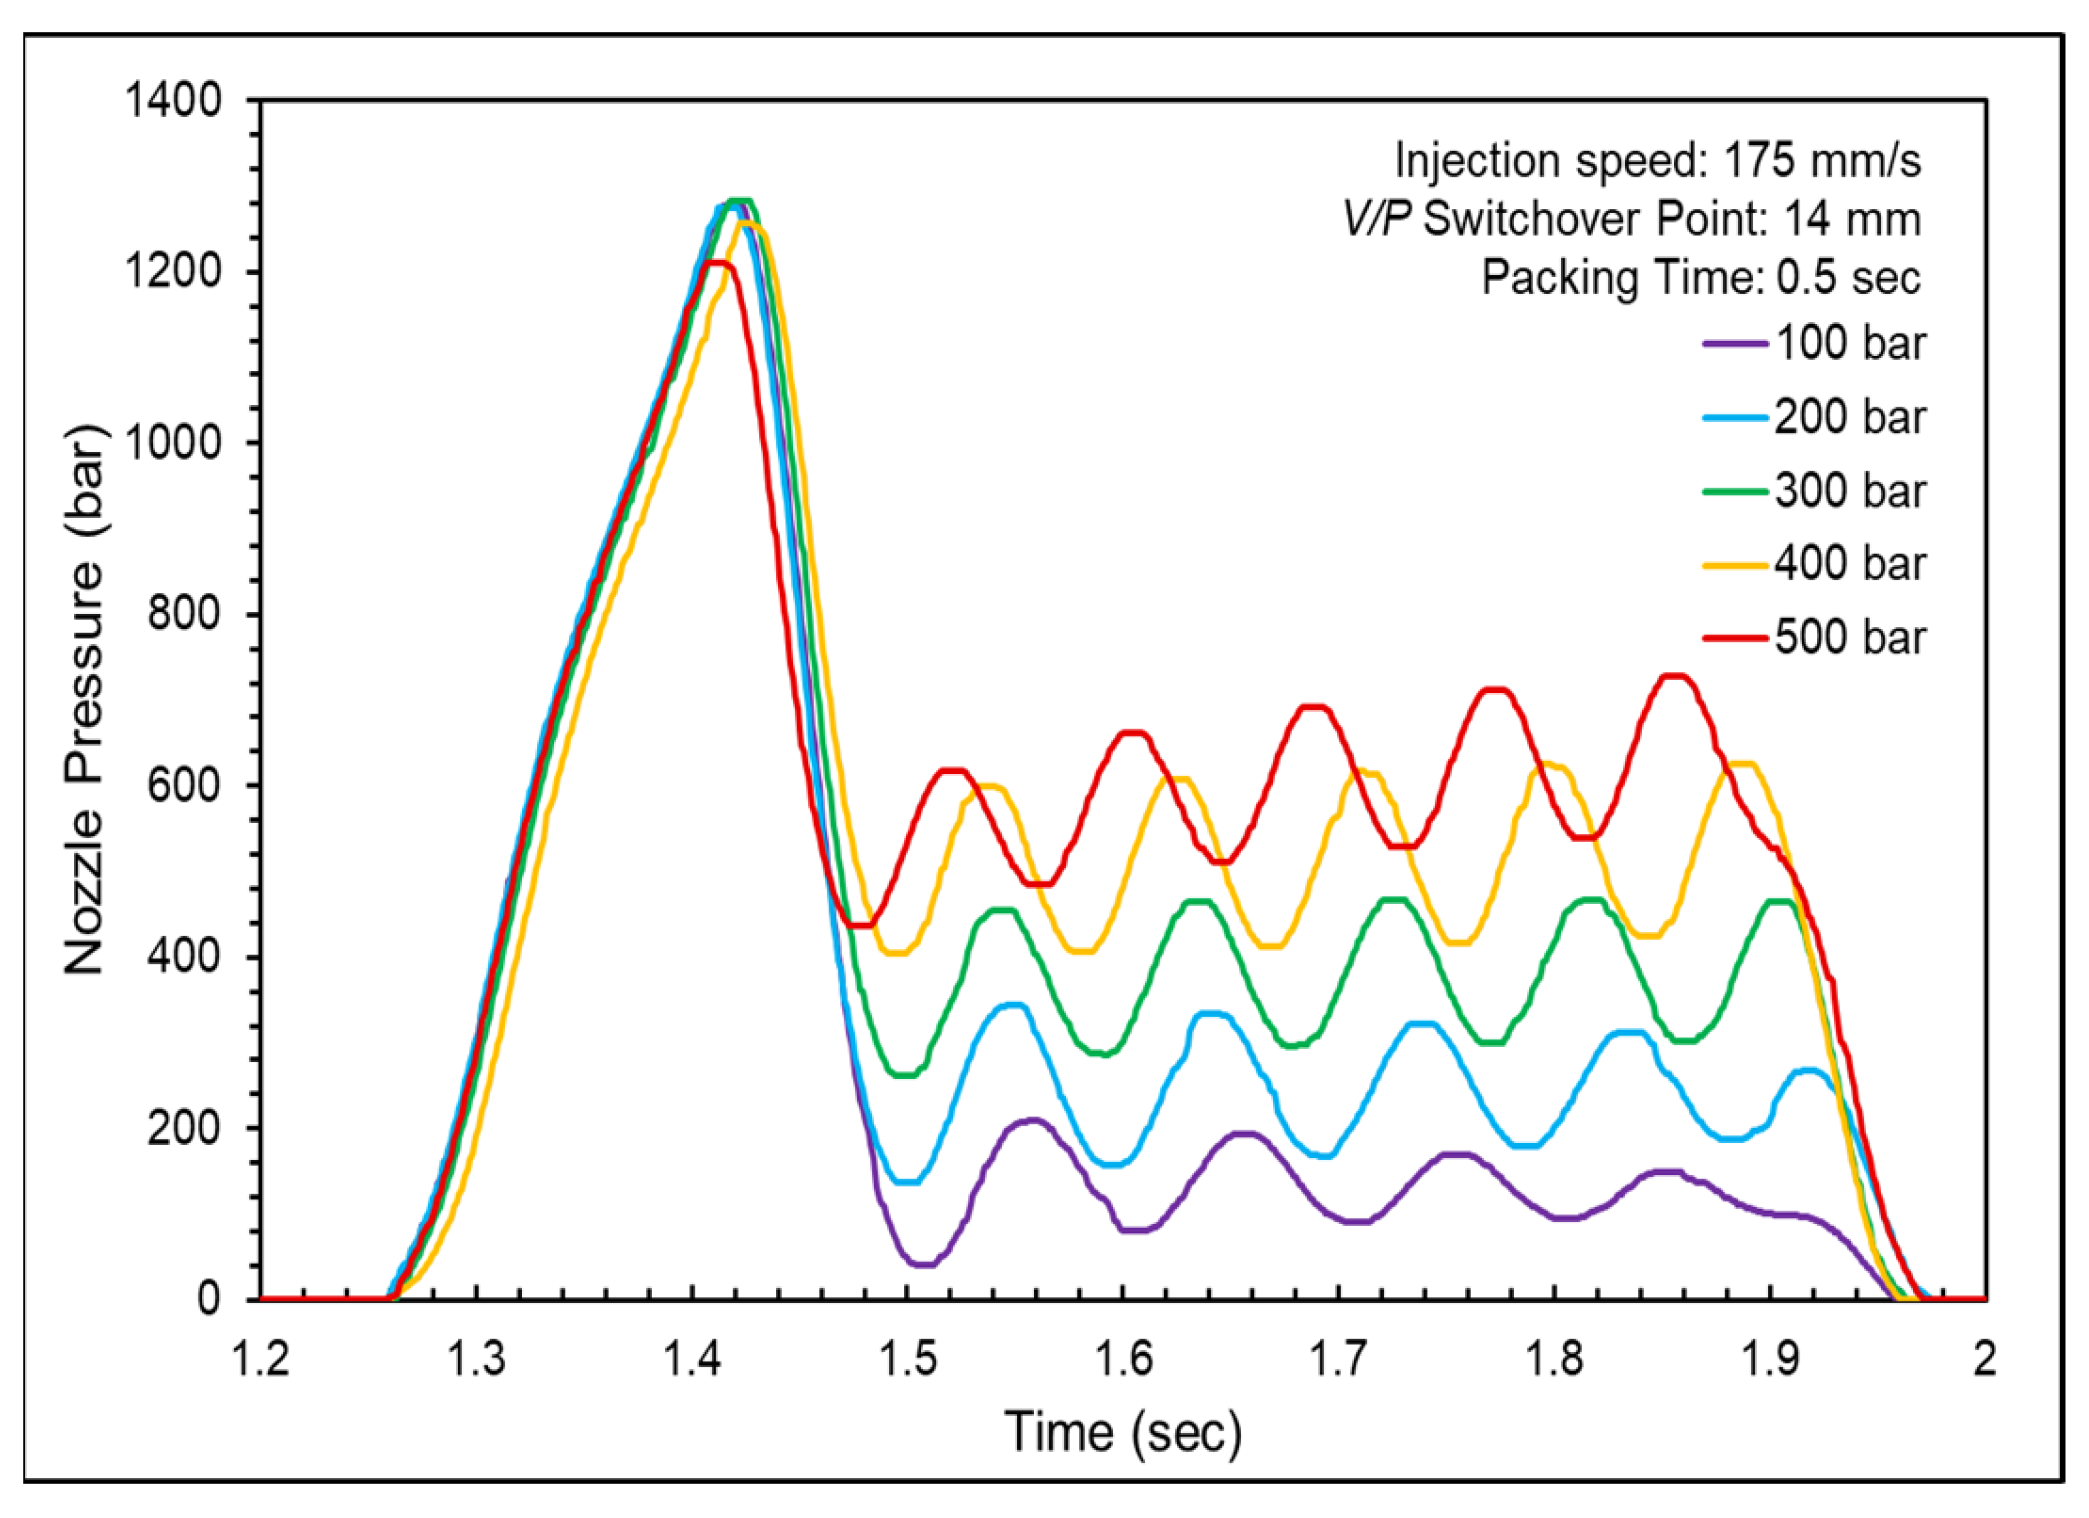
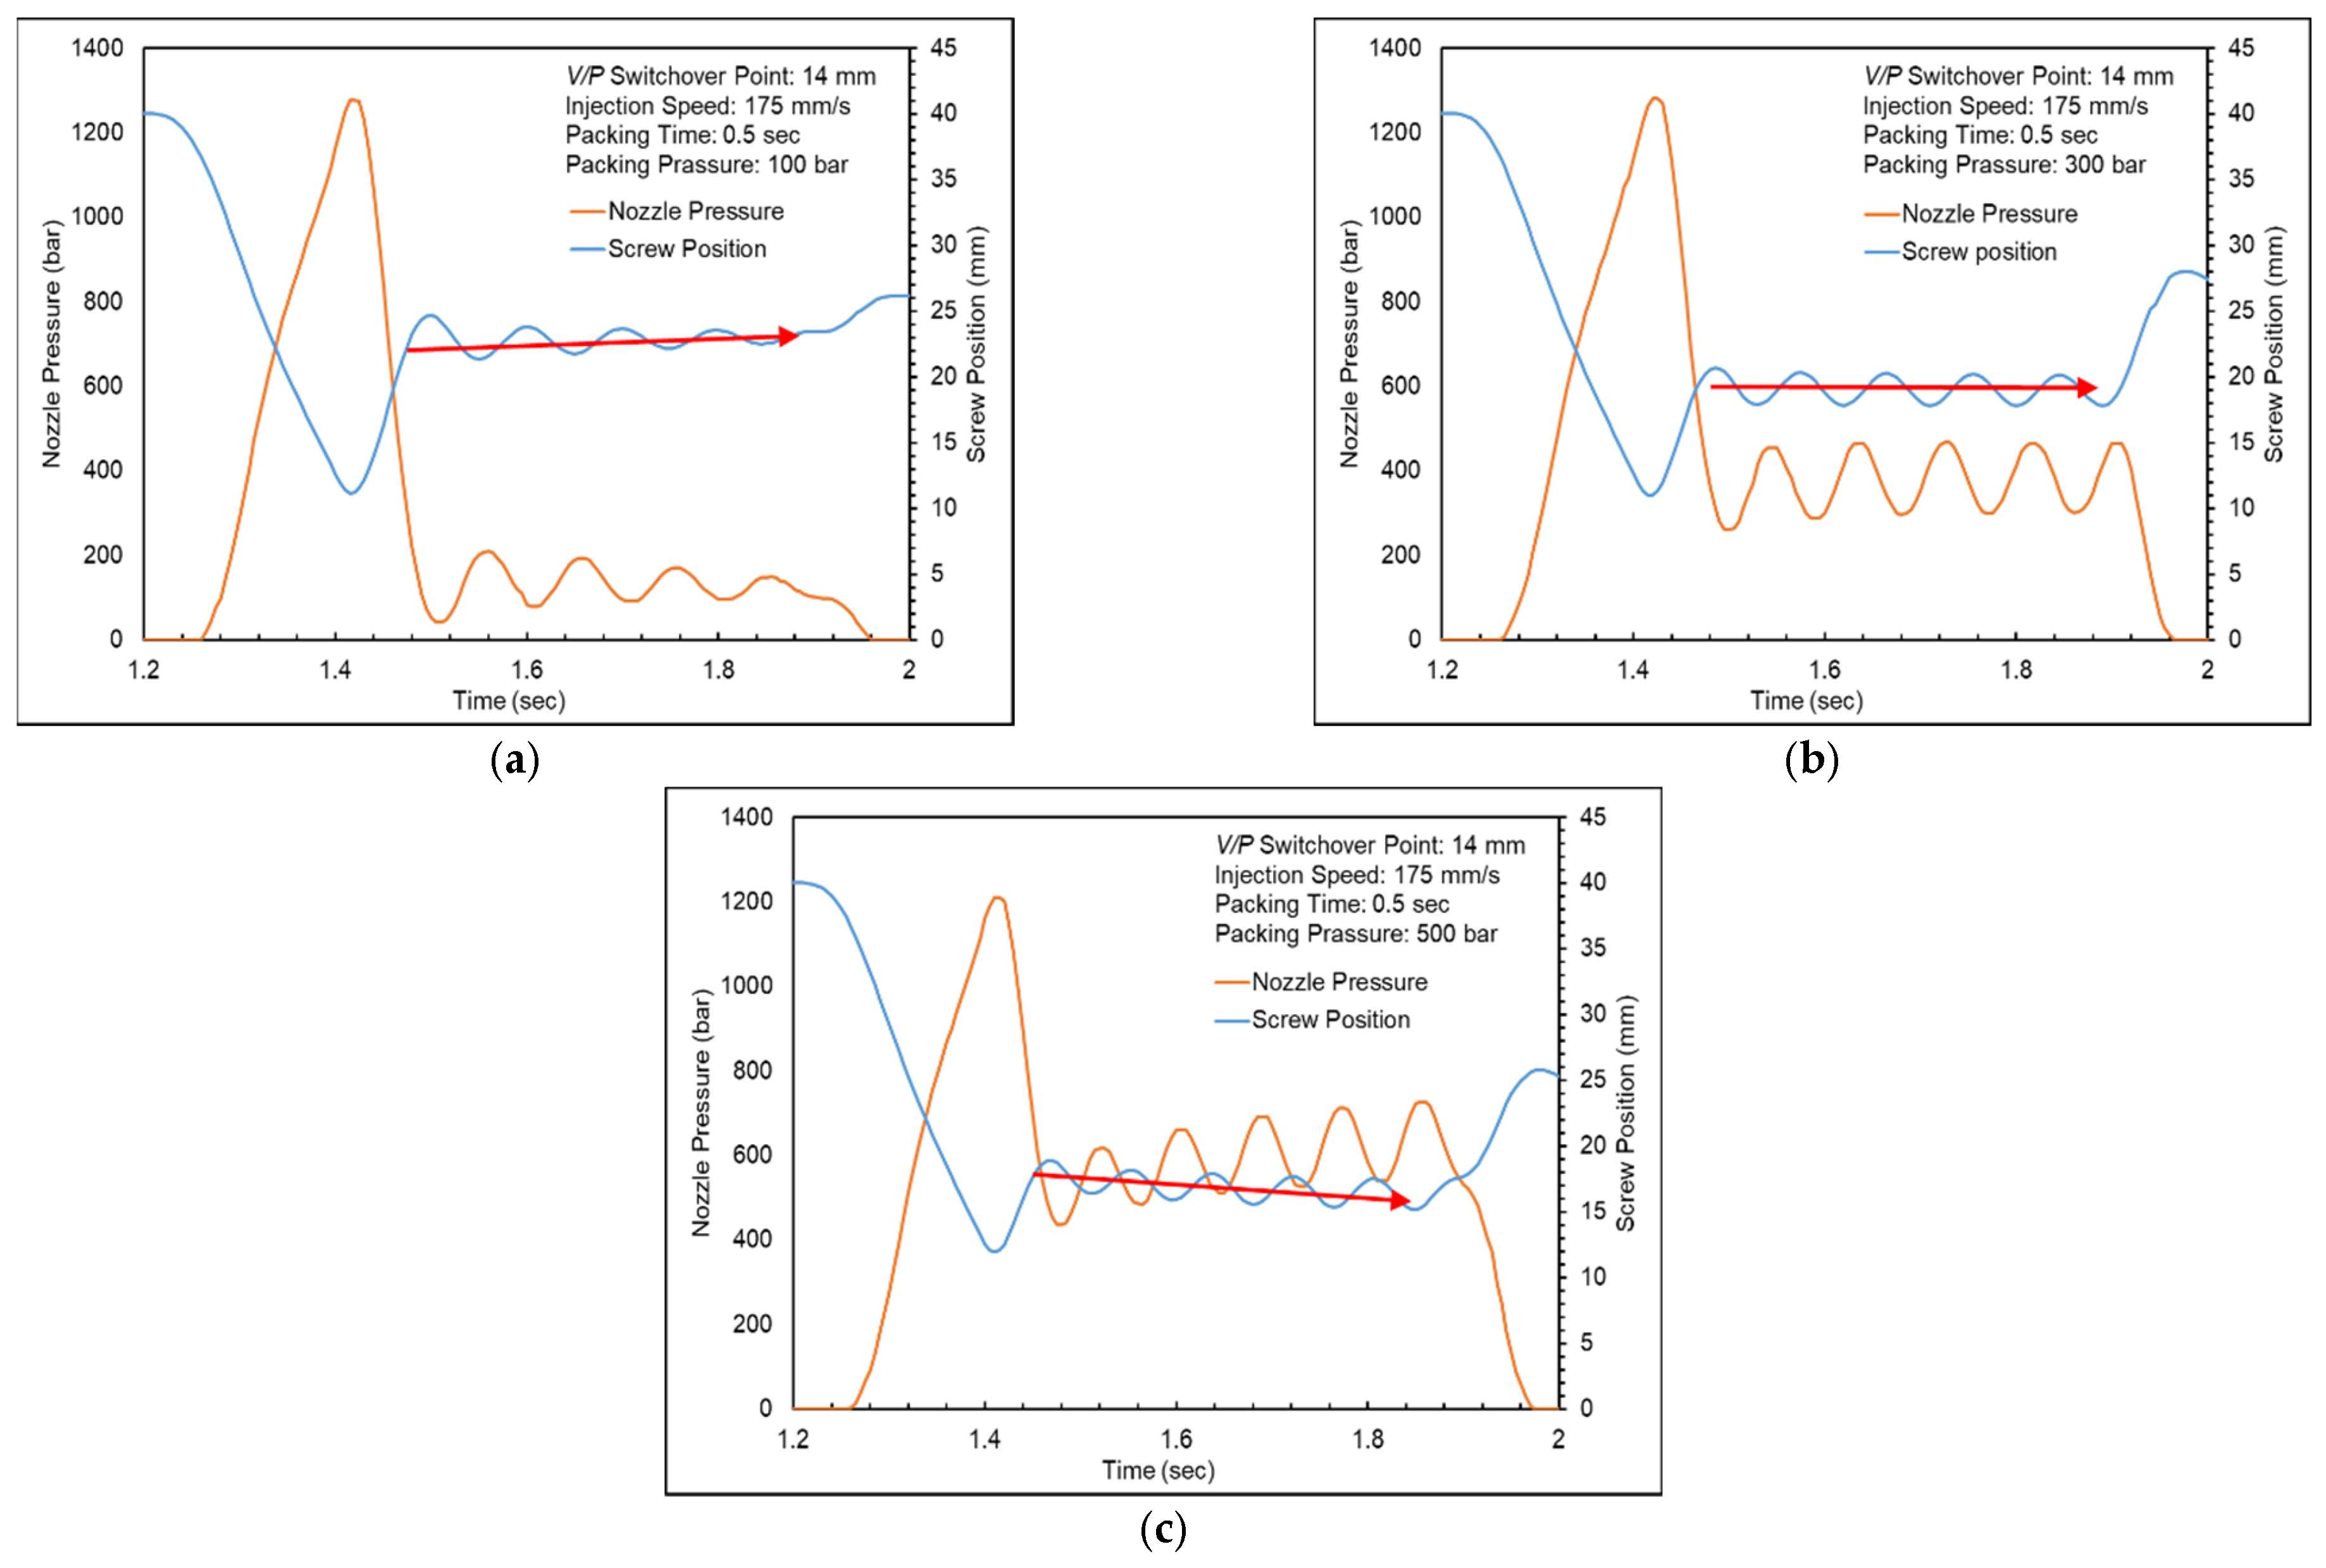
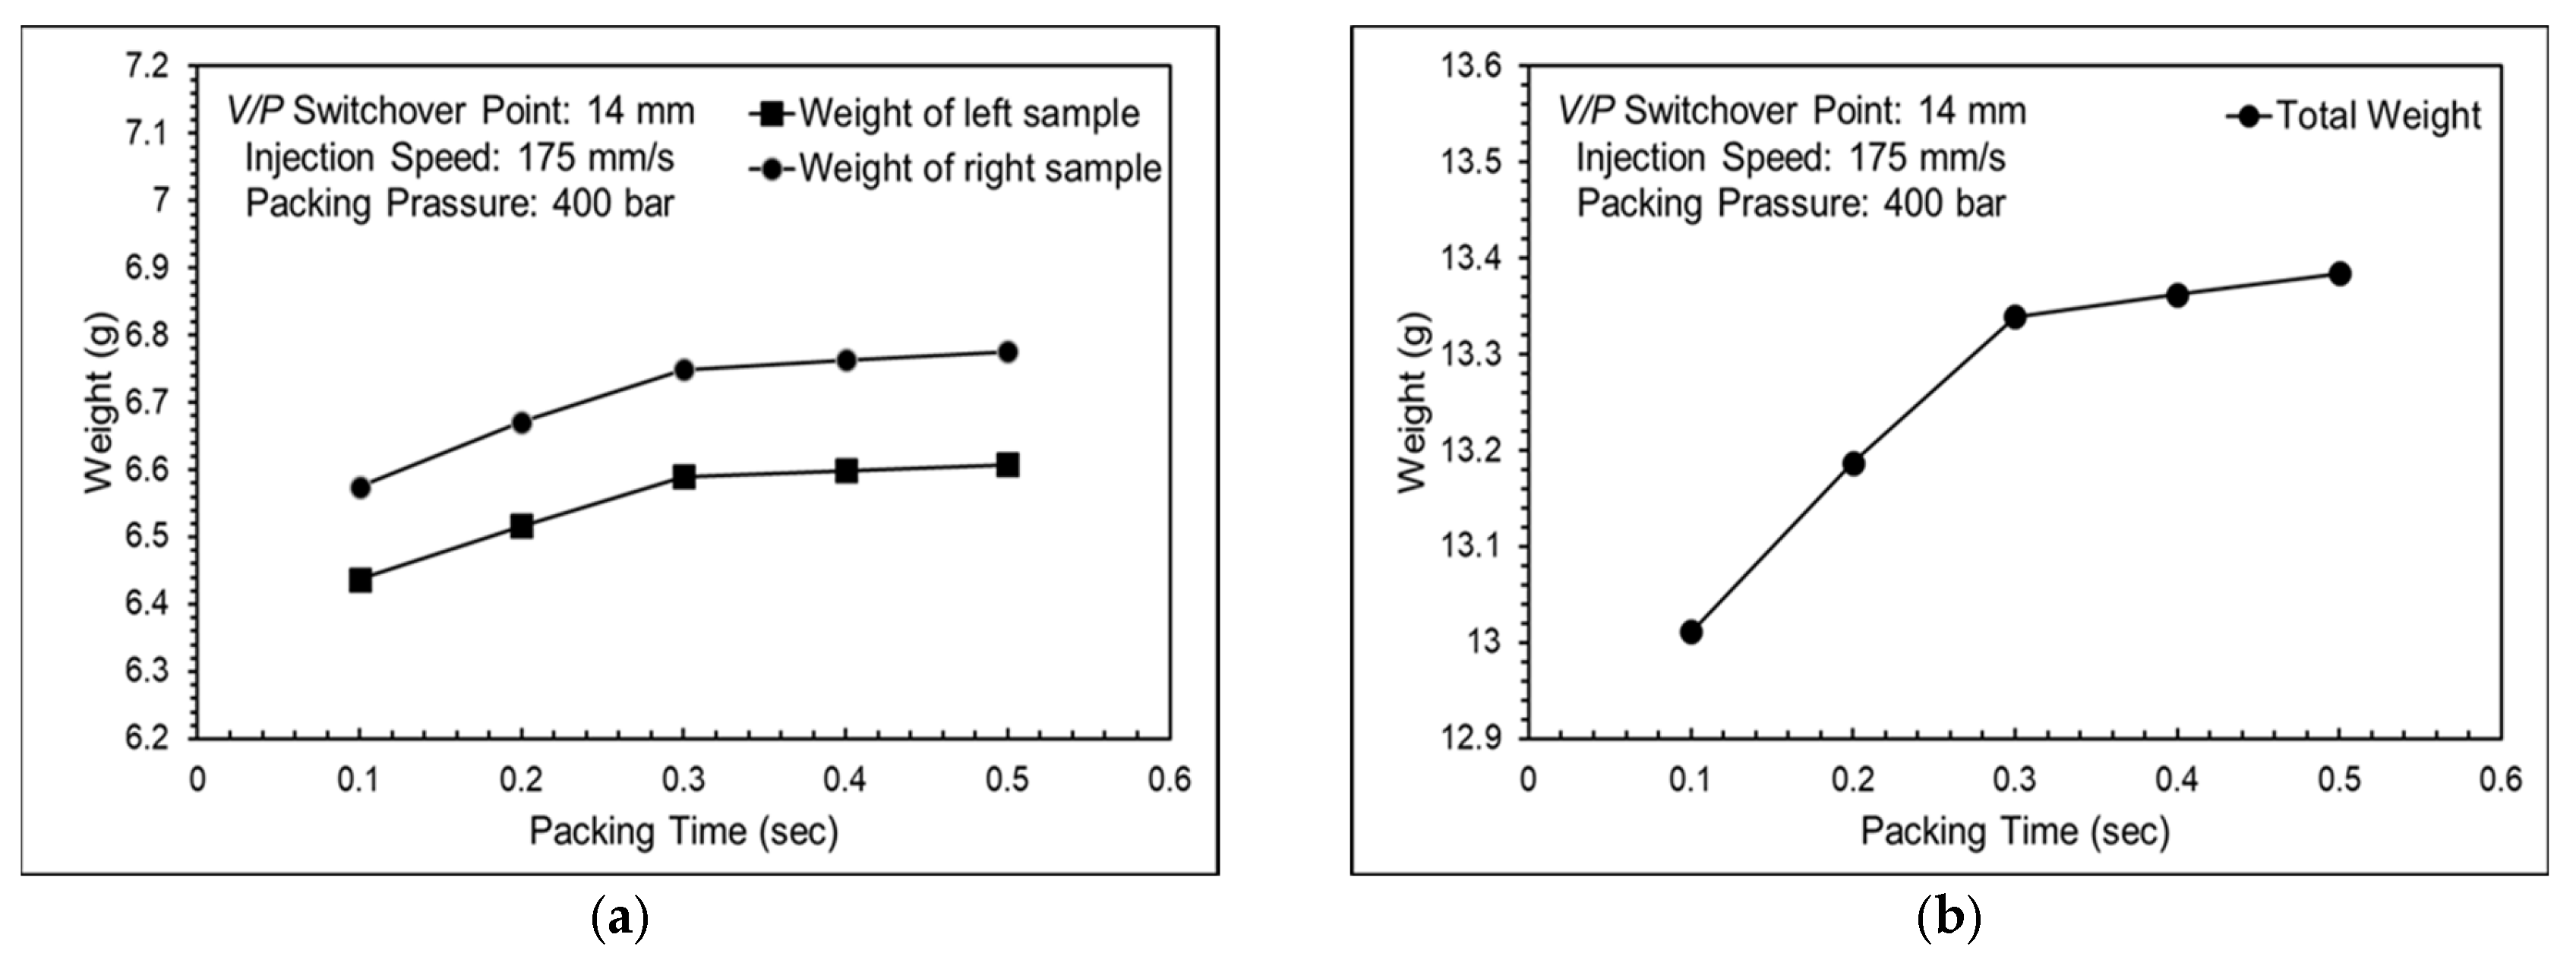
4.1.3. Packing Experiments
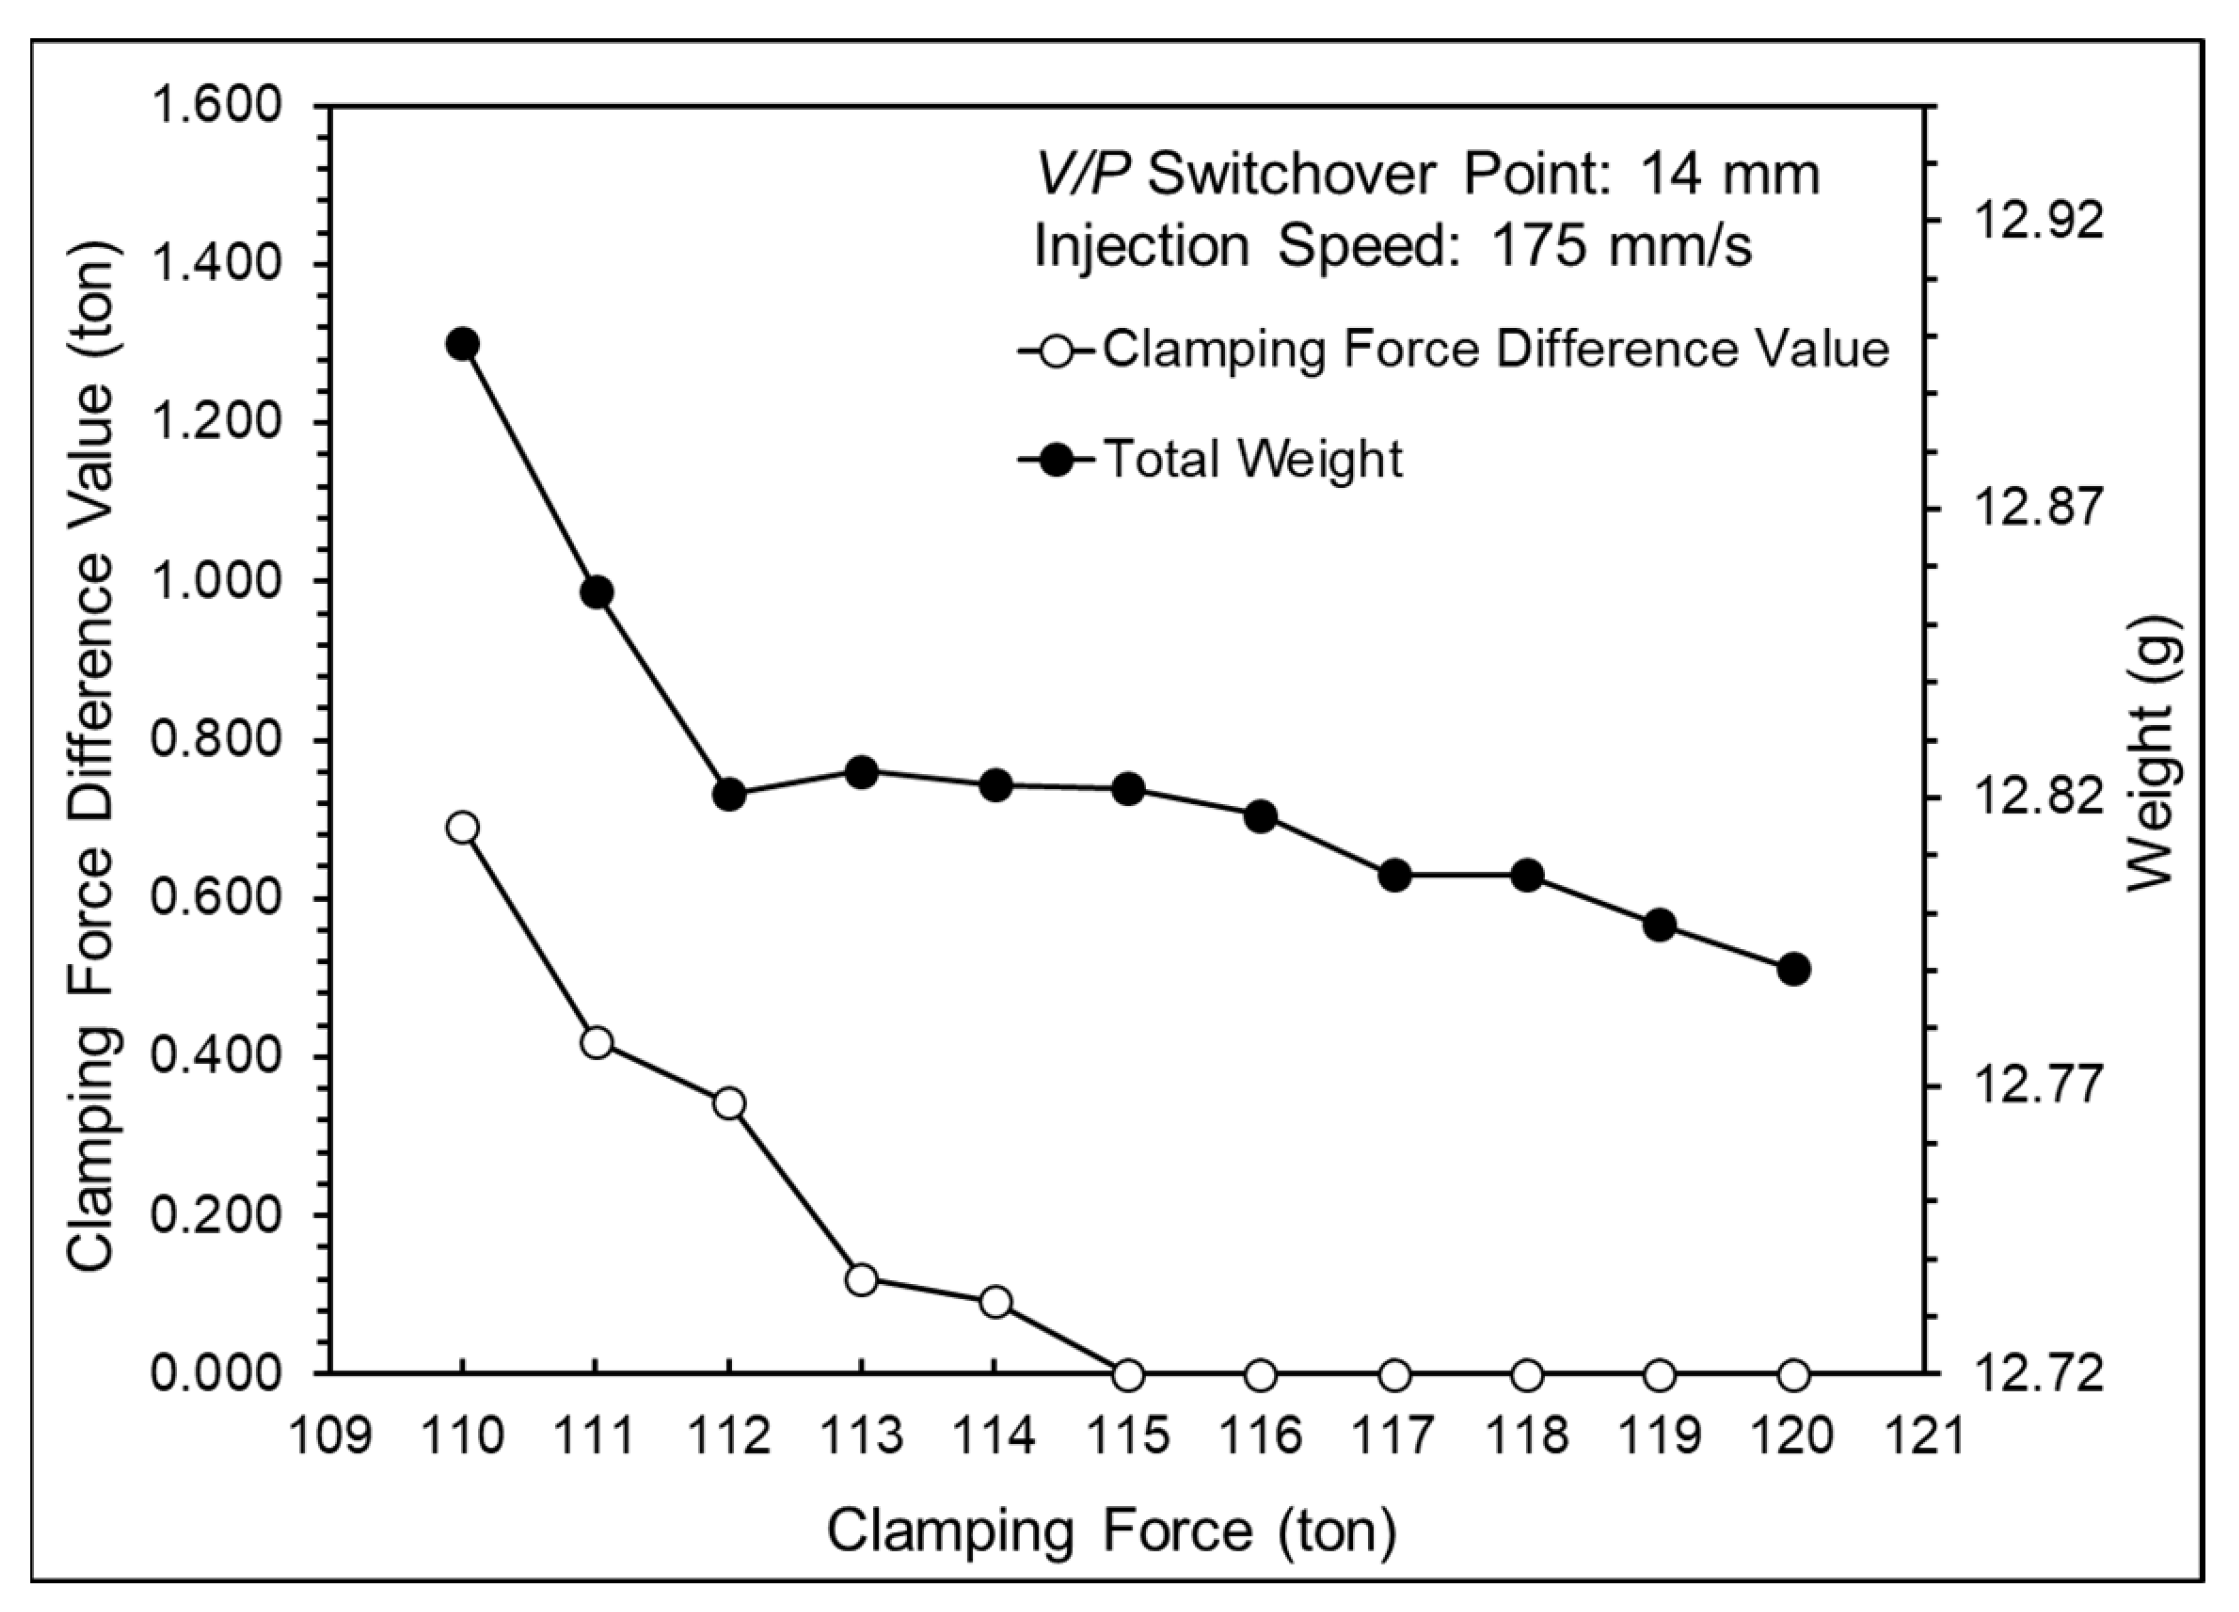
4.1.4. Clamping Force Experiments
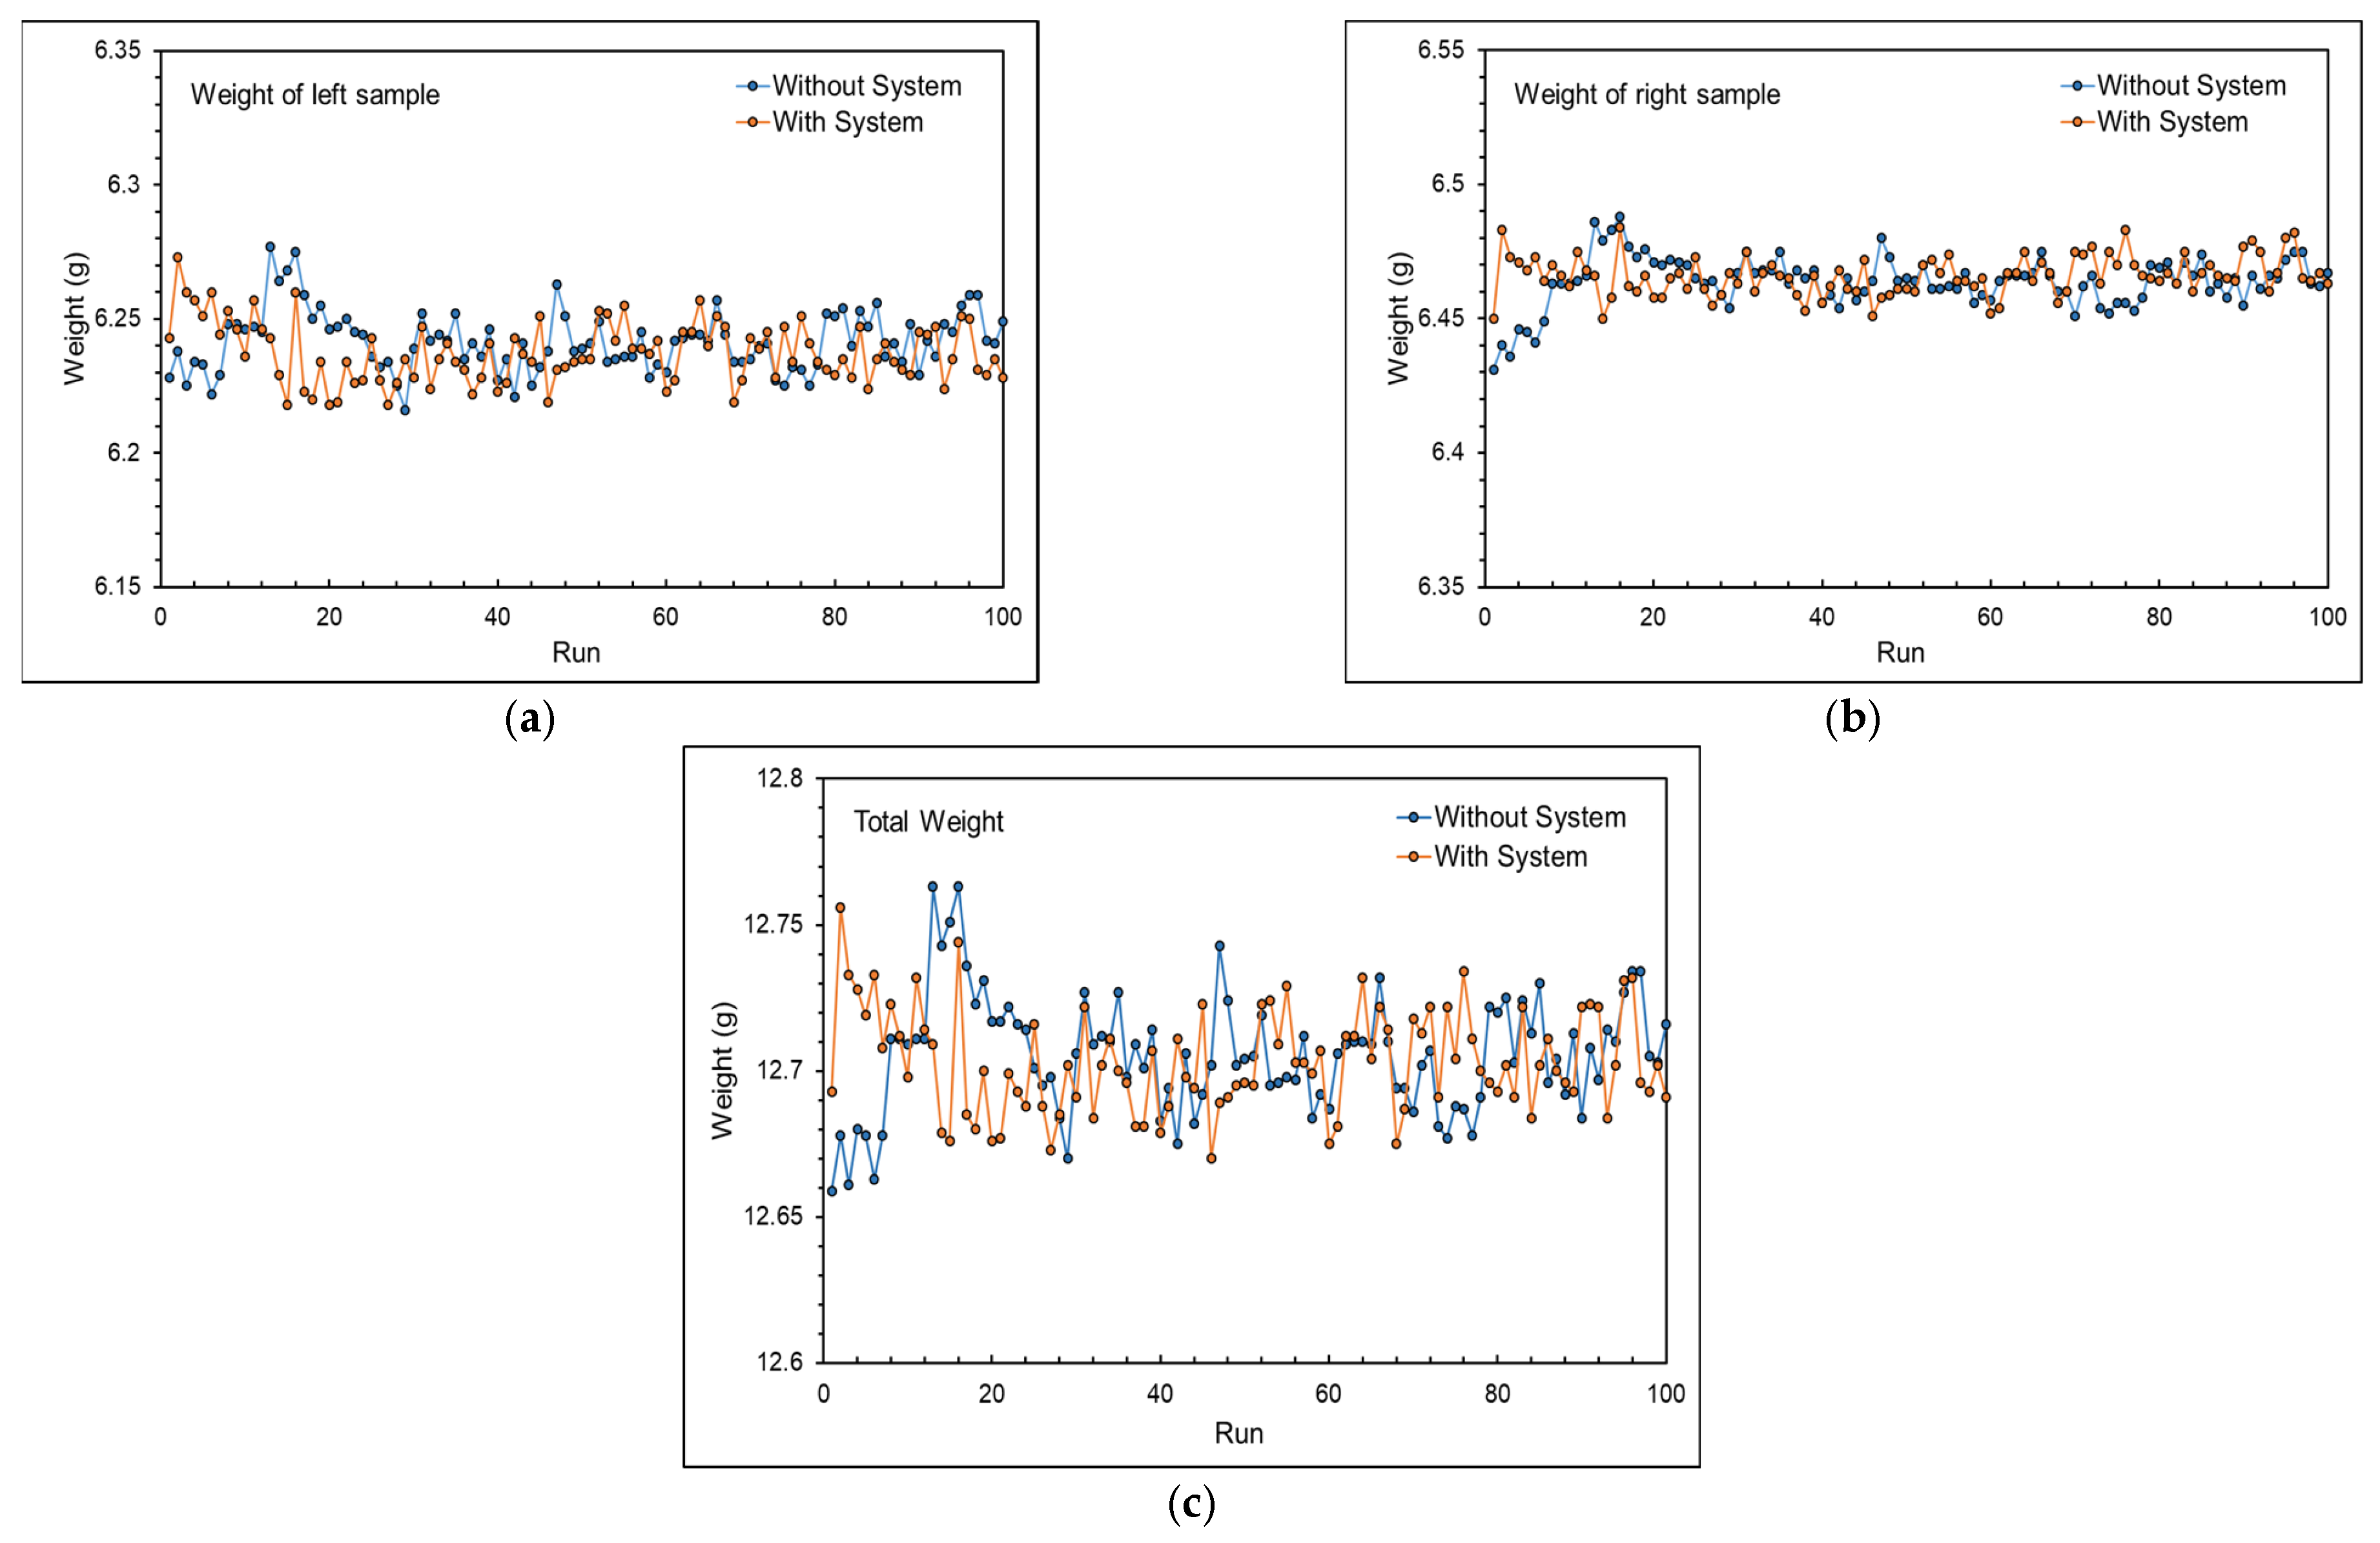
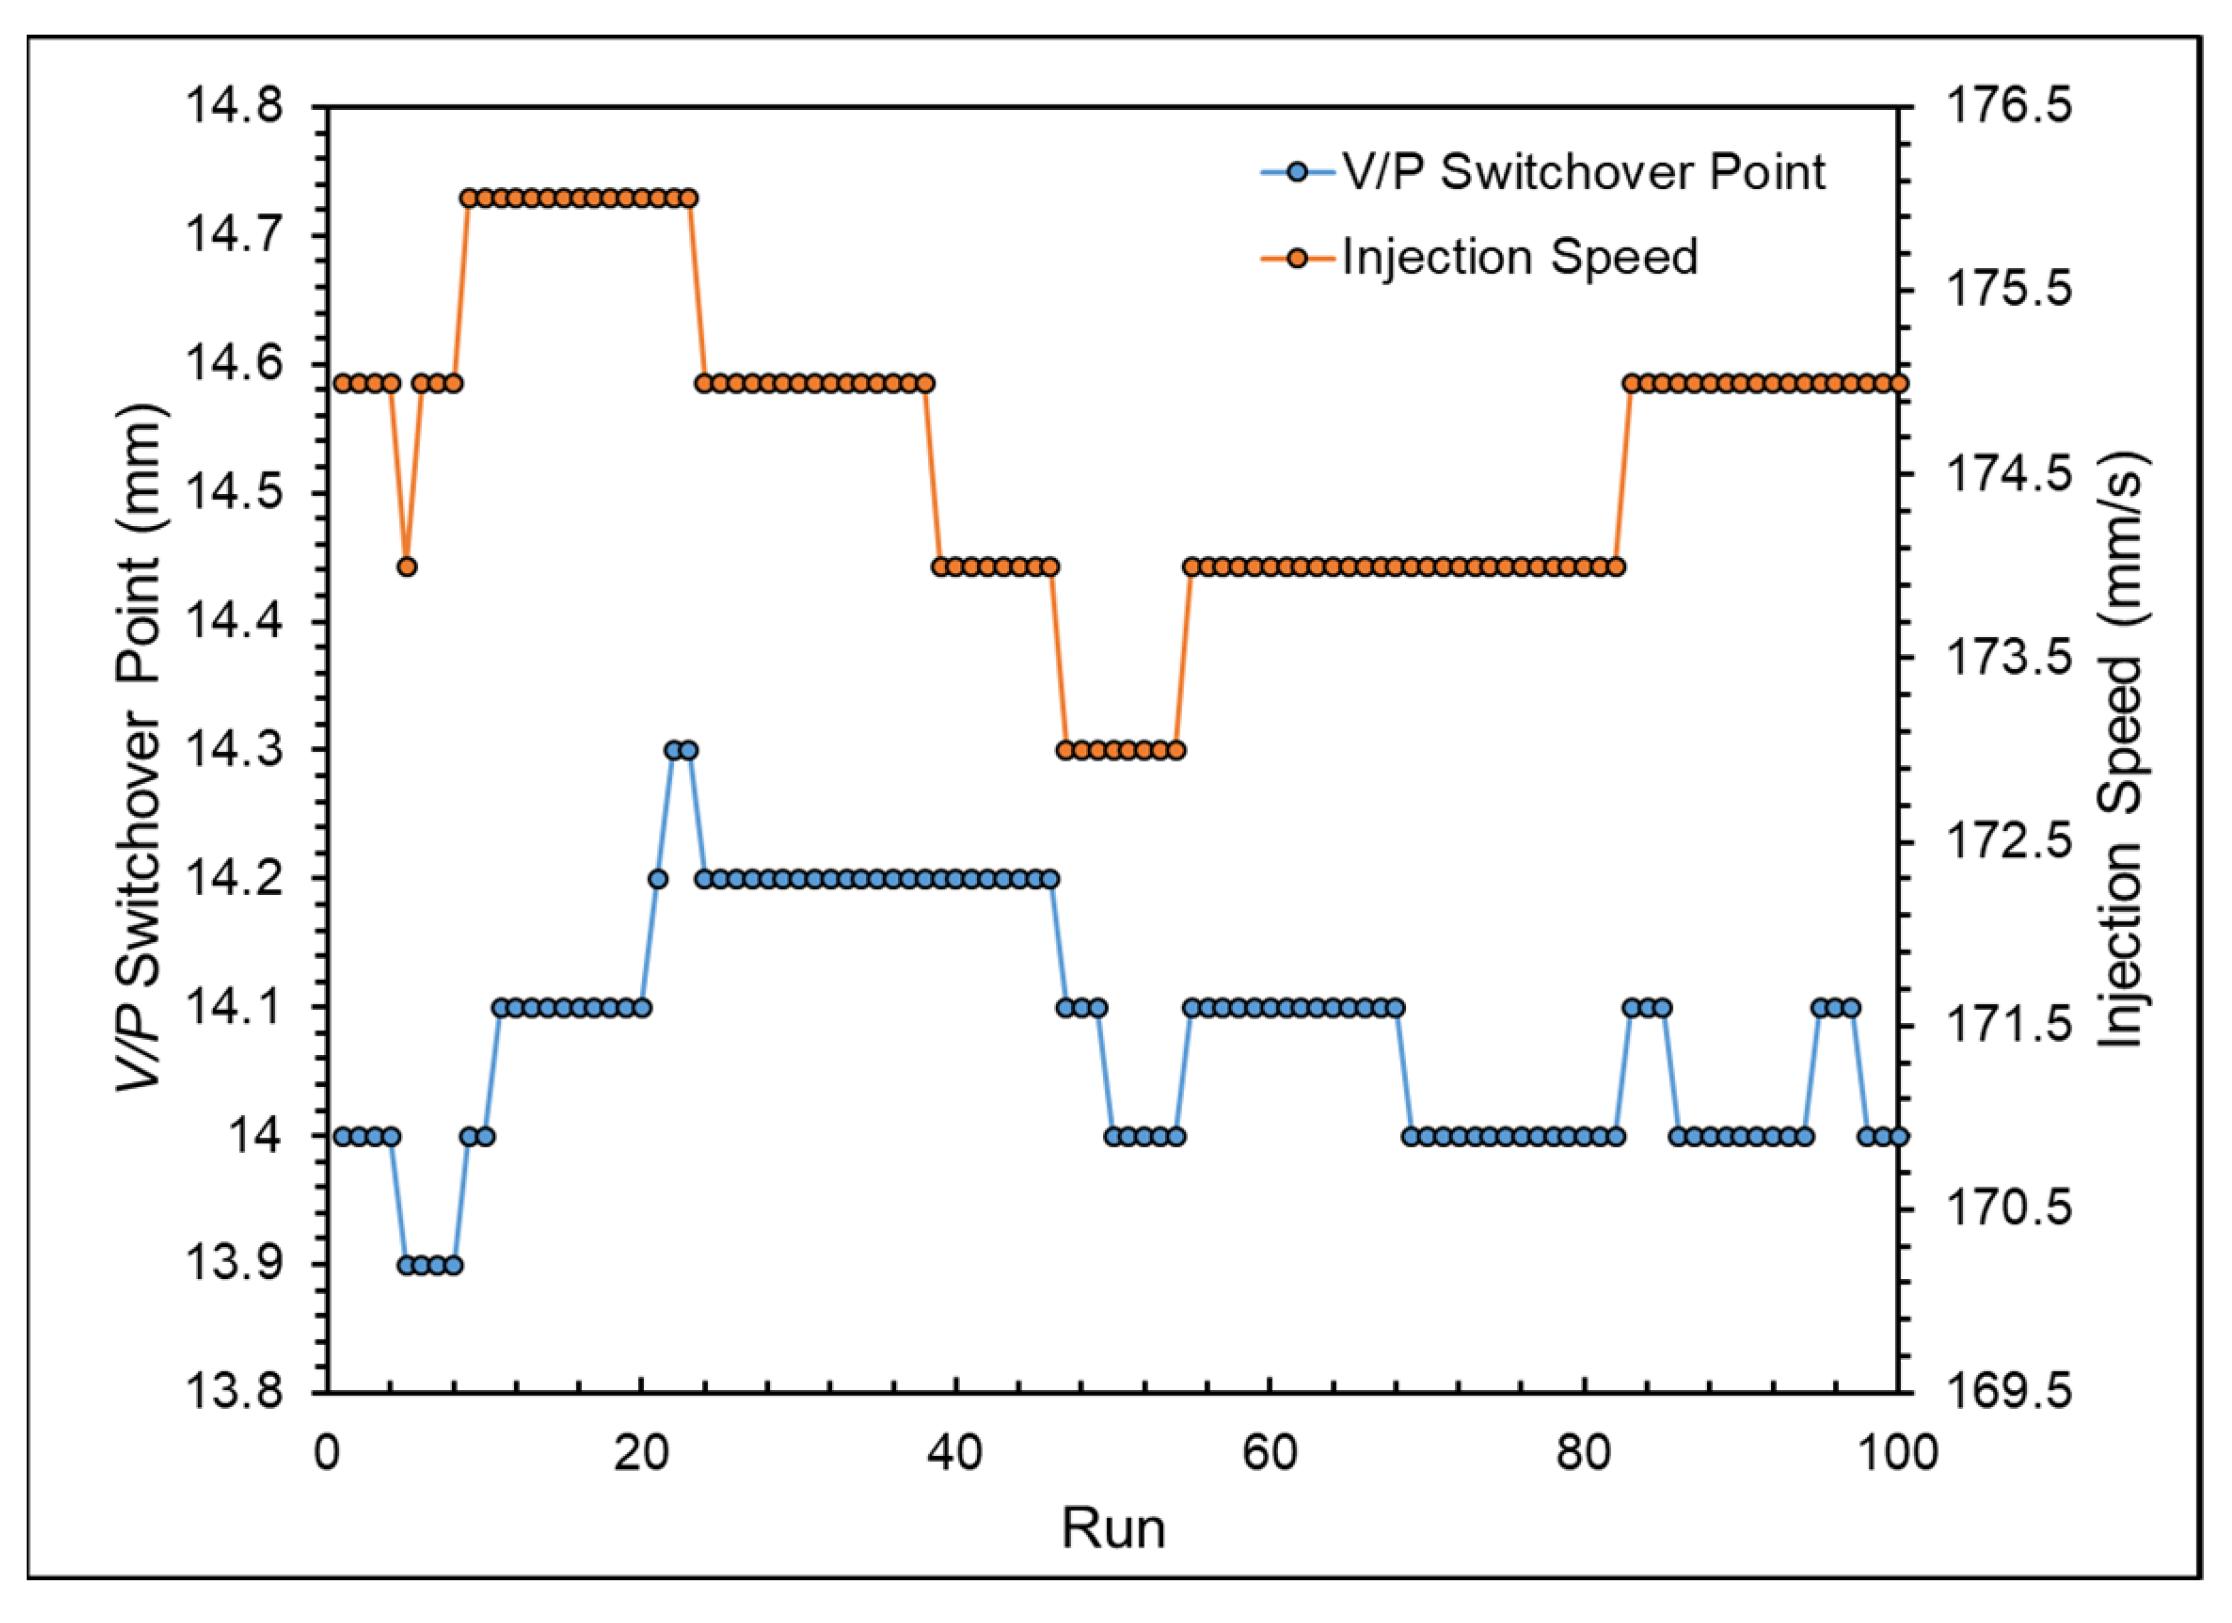
4.2. Adaptive Process Control Experiments
5. Conclusions
- An appropriate injection speed was defined based on the nozzle peak pressure, timing of the pressure peak, and product weight to reduce production time and ensure the stability of product weight during production.
- Since this study utilized a hot runner mold, the transition from the filling stage to the compression stage could not be observed, so the appropriate V/P switchover point was determined by observing the behavior of the melt through the nozzle peak pressure and product weight.
- The compensation effect of the melt during the packing stage for molded products was not ideal, with the packing pressure settings leading to deformations in the gate area, causing product defects.
- An appropriate clamping force was defined when the clamping force difference value was zero.
- The utilization of an adaptive control system effectively stabilized product weight, reducing weight variations and standard deviation from 0.819% and 0.02 g to 0.677% and 0.0178 g, respectively.
Author Contributions
Funding
Institutional Review Board Statement
Data Availability Statement
Conflicts of Interest
References
- Mathur, S.; Kumar, R.; Mathur, V. Mathematical Modeling and Fuzzy Analysis of Hot Runner in Comparison to Cold Runner in Injection Moulding. J. Adv. Manuf. Syst. 2019, 18, 657–676. Available online: https://www.worldscientific.com/doi/abs/10.1142/S0219686719500343 (accessed on 3 April 2024). [CrossRef]
- Giboz, J.; Dubelley, F.; Carrier, S.; Tenchine, L.; Molmeret, Y.; Mele, P. Real-time analysis of polymer flow under real processing conditions applied to microinjection molding. J. Manuf. Process. 2022, 75, 565–572. Available online: https://www.sciencedirect.com/science/article/pii/S1526612522000470?casa_token=OyZ0e-ukbEUAAAAA:TMRLDFDjTTsV1mq42QIT6F9pYl9M8zubmFWJ0JaApGVQg8mRowibdowQiTMHRSY0UnzxPHH3Zw (accessed on 3 April 2024). [CrossRef]
- Yokoi, H.; Kanetoh, Y.; Takamatsu, R.; Endo, T.; Chang, H.; Chayamichi, T. Visualization Analysis of Injection Molding Phenomena in Hot-runner System. AIP Conf. Proc. 2016, 1713, 040008. Available online: https://pubs.aip.org/aip/acp/article/1713/1/040008/850214/Visualization-analysis-of-injection-molding (accessed on 3 April 2024).
- Huang, M.S.; Chen, J.Y.; Xiao, Y.Q. Quality Monitoring of Micro-shrinkage Defects in Thick-walled Injection Molded Components. Measurement 2022, 201, 111733. Available online: https://www.sciencedirect.com/science/article/pii/S0263224122009381 (accessed on 3 April 2024). [CrossRef]
- Wang, L.; Zhang, Y.; Jiang, L.; Yang, X.; Zhou, Y.; Wang, X.; Li, Q.; Shen, C.; Turng, L.S. Effect of Injection Speed on the Mechanical Properties of Isotactic Polypropylene Micro Injection Molded Parts Based on a Nanoindentation Test. J. Appl. Polym. Sci. 2019, 136, 47329. Available online: https://onlinelibrary.wiley.com/doi/full/10.1002/app.47329 (accessed on 3 April 2024). [CrossRef]
- Yang, Y.; Chen, X.; Lu, N.; Gao, F. Injection Molding Process Control, Monitoring, and Optimization; Carl Hanser Verlag GmbH & Co. KG: Munich, Germany, 2016. [Google Scholar]
- Spina, R. Injection Moulding of Automotive Components: Comparison Between Hot Runner Systems for a Case Study. J. Mater. Process. Technol. 2004, 155, 1497–1504. Available online: https://www.sciencedirect.com/science/article/pii/S0924013604006144 (accessed on 3 April 2024). [CrossRef]
- Wang, Q.; Zhao, X.; Zhang, J.; Zhang, P.; Wang, X.; Yang, C.; Wang, J.; Wu, Z. Research on Quality Characterization Method of Micro-injection Products Based on Cavity Pressure. Polymers 2021, 13, 2755. Available online: https://www.mdpi.com/2073-4360/13/16/2755 (accessed on 3 April 2024). [CrossRef] [PubMed]
- Zhao, Y.; Zhao, P.; Zhang, J.; Huang, J.; Xia, N.; Fu, J. On-line Measurement of Clamping Force for Injection Molding Machine Using Ultrasonic Technology. Ultrasonics 2019, 91, 170–179. Available online: https://www.sciencedirect.com/science/article/pii/S0041624X18304281 (accessed on 3 April 2024). [CrossRef] [PubMed]
- Chen, J.Y.; Yang, K.J.; Huang, M.S. Online Quality Monitoring of Molten Resin in Injection Molding. Int. J. Heat Mass Transf. 2018, 122, 681–693. Available online: https://www.sciencedirect.com/science/article/pii/S001793101734783X (accessed on 3 April 2024). [CrossRef]
- Moayyedian, M.; Mamedov, A. Multi-objective Optimization of Injection Molding Process for Determination of Feasible Moldability Index. Procedia CIRP 2019, 84, 769–773. Available online: https://www.sciencedirect.com/science/article/pii/S2212827119308571 (accessed on 3 April 2024). [CrossRef]
- Chen, J.Y.; Liu, C.Y.; Huang, M.S. Tie-bar Elongation Based Filling-to-packing Switchover Control and Prediction of Injection Molding Quality. Polymers 2019, 11, 1168. Available online: https://www.mdpi.com/2073-4360/11/7/1168 (accessed on 3 April 2024). [CrossRef] [PubMed]
- Xu, Y.; Liu, G.; Dang, K.; Fu, N.; Jiao, X.; Wang, J.; Xie, P.; Yang, W. A Novel Strategy to Determine the Optimal Clamping Force Based on the Clamping Force Change during Injection Molding. Polym. Eng. Sci. 2021, 61, 3170–3178. Available online: https://4spepublications.onlinelibrary.wiley.com/doi/full/10.1002/pen.25829 (accessed on 3 April 2024). [CrossRef]
- Párizs, R.D.; Török, D.; Ageyeva, T.; Kovács, J.G. Multiple In-mold Sensors for Quality and Process Control in Injection Molding. Sensors 2023, 23, 1735. Available online: https://www.mdpi.com/1424-8220/23/3/1735 (accessed on 3 April 2024). [CrossRef] [PubMed]
- Huang, M.S.; Nian, S.C.; Lin, G.T. Influence of V/P Switchover Point, Injection Speed, and Holding Pressure on Quality Consistency of Injection-molded Parts. J. Appl. Polym. Sci. 2021, 138, 51223. Available online: https://onlinelibrary.wiley.com/doi/full/10.1002/app.51223 (accessed on 3 April 2024). [CrossRef]
- Kruppa, S.; Holzinger, G.P. In Situ Characterization of Polymer Melt and Molded Part Quality; KraussMaffei Technologies GmbH: Munich, Germany, 2013. [Google Scholar]
- Nian, S.C.; Fang, Y.C.; Huang, M.S. In-mold and Machine Sensing and Feature Extraction for Optimized IC-tray Manufacturing. Polymers 2019, 11, 1348. Available online: https://www.mdpi.com/2073-4360/11/8/1348 (accessed on 3 April 2024). [CrossRef] [PubMed]
- Aminabadi, S.S.; Tabatabai, P.; Steiner, A.; Gruber, D.P.; Friesenbichler, W.; Habersohn, C.; Berger-Weber, G. Industry 4.0 In-line AI Quality Control of Plastic Injection Molded Parts. Polymers 2022, 14, 3551. Available online: https://www.mdpi.com/2073-4360/14/17/3551 (accessed on 3 April 2024). [CrossRef] [PubMed]
- Huang, M.S.; Ke, K.C.; Liu, C.Y. Cavity Pressure-based Packing Pressure Adjustment for Enhancing the Consistency of Injection Molding Quality. J. Appl. Polym. Sci. 2021, 138, 50357. Available online: https://onlinelibrary.wiley.com/doi/full/10.1002/app.50357 (accessed on 3 April 2024). [CrossRef]
- Xu, Y.; Xie, P.; Fu, N.; Jiao, X.; Wang, J.; Liu, G.; Dou, X.; Zha, Y.; Dang, K.; Yang, W. Self-optimization of the V/P Switchover and Packing Pressure for Online Viscosity Compensation during Injection Molding. Polym. Eng. Sci. 2022, 62, 1114–1123. Available online: https://4spepublications.onlinelibrary.wiley.com/doi/full/10.1002/pen.25910 (accessed on 3 April 2024). [CrossRef]
- Schiffers, S.; Kruppa, S.; Moser, S. The right changeover point for each shot. J. Kunststoffe 2014, 11, 26–29. [Google Scholar]
- Su, C.W.; Su, W.J.; Cheng, F.J.; Liou, G.Y.; Hwang, S.J.; Peng, H.S.; Chu, H.Y. Optimization Process Parameters and Adaptive Quality Monitoring Injection Molding Process for Materials with Different Viscosity. Polym. Test. 2022, 109, 107526. Available online: https://www.sciencedirect.com/science/article/pii/S0142941822000526 (accessed on 3 April 2024). [CrossRef]
- Liou, G.Y.; Su, W.J.; Cheng, F.J.; Chang, C.H.; Tseng, R.H.; Hwang, S.J.; Peng, H.S.; Chu, H.Y. Optimize Injection-Molding Process Parameters and Build an Adaptive Process Control System Based on Nozzle Pressure Profile and Clamping Force. Polymers 2023, 15, 610. Available online: https://www.mdpi.com/2073-4360/15/3/610 (accessed on 3 April 2024). [CrossRef] [PubMed]
- Huang, M.S.; Lin, C.Y. A Novel Clamping Force Searching Method Based on Sensing Tie-bar Elongation for Injection Molding. Int. J. Heat Mass Transf. 2017, 109, 223–230. Available online: https://www.sciencedirect.com/science/article/pii/S0017931016329970 (accessed on 3 April 2024). [CrossRef]


| BJM368MO | Unit | Value |
|---|---|---|
| Melt Flow Index | g/10 min | 70 |
| Density | g/cm3 | 0.905 |
| Shrinkage | % | 1.2 |
| Initial Parameters | |||
|---|---|---|---|
| Injection pressure (bar) | 1580 | Cooling time (s) | 3 |
| Melt temperature (°C) | 230 | V/P switchover point (mm) | 14 |
| Mold temperature (°C) | 25 | Packing time (s) | 0 |
| Hot runner temperature (°C) | 230 | Clamping force (ton) | 166 |
| Optimization Experiment Parameters | |||
| Injection speed (mm/s) | 75, 100, 125, 150, 175, 200, 225, 250 | ||
| V/P switchover point (mm) | 11, 12, 13, 14, 15, 16, 17, 18, 19 | ||
| Packing pressure (bar) | 100, 200, 300, 400, 500 | ||
| Packing time (s) | 0.1, 0.2, 0.3, 0.4, 0.5 | ||
| Clamping force (ton) | 110, 111, 112, 113, 114, 115, 116, 117, 118, 119, 120 | ||
| Experimental Parameters | |||
|---|---|---|---|
| Injection pressure (bar) | 1580 | Cooling time (s) | 3 |
| Melt temperature (°C) | 230 | Injection speed (mm/s) | 175 |
| Mold temperature (°C) | 25 | V/P switchover point (mm) | 14 |
| Hot runner temperature (°C) | 230 | Packing time (s) | 0 |
| Clamping force (ton) | 138 | ||
| Weight | Without System (%) | With System (%) |
|---|---|---|
| Left sample | 0.977 | 0.882 |
| Right sample | 0.882 | 0.526 |
| Total | 0.819 | 0.677 |
| Weight | Without System (g) | With System (g) |
|---|---|---|
| Left sample | 0.0113 | 0.0112 |
| Right sample | 0.0095 | 0.0073 |
| Total | 0.02 | 0.0178 |
Disclaimer/Publisher’s Note: The statements, opinions and data contained in all publications are solely those of the individual author(s) and contributor(s) and not of MDPI and/or the editor(s). MDPI and/or the editor(s) disclaim responsibility for any injury to people or property resulting from any ideas, methods, instructions or products referred to in the content. |
© 2024 by the authors. Licensee MDPI, Basel, Switzerland. This article is an open access article distributed under the terms and conditions of the Creative Commons Attribution (CC BY) license (https://creativecommons.org/licenses/by/4.0/).
Share and Cite
Cheng, F.-J.; Chang, C.-H.; Wen, C.-H.; Hwang, S.-J.; Peng, H.-S.; Chu, H.-Y. Out-of-Mold Sensor-Based Process Parameter Optimization and Adaptive Process Quality Control for Hot Runner Thin-Walled Injection-Molded Parts. Polymers 2024, 16, 1057. https://doi.org/10.3390/polym16081057
Cheng F-J, Chang C-H, Wen C-H, Hwang S-J, Peng H-S, Chu H-Y. Out-of-Mold Sensor-Based Process Parameter Optimization and Adaptive Process Quality Control for Hot Runner Thin-Walled Injection-Molded Parts. Polymers. 2024; 16(8):1057. https://doi.org/10.3390/polym16081057
Chicago/Turabian StyleCheng, Feng-Jung, Chen-Hsiang Chang, Chien-Hung Wen, Sheng-Jye Hwang, Hsin-Shu Peng, and Hsiao-Yeh Chu. 2024. "Out-of-Mold Sensor-Based Process Parameter Optimization and Adaptive Process Quality Control for Hot Runner Thin-Walled Injection-Molded Parts" Polymers 16, no. 8: 1057. https://doi.org/10.3390/polym16081057
APA StyleCheng, F.-J., Chang, C.-H., Wen, C.-H., Hwang, S.-J., Peng, H.-S., & Chu, H.-Y. (2024). Out-of-Mold Sensor-Based Process Parameter Optimization and Adaptive Process Quality Control for Hot Runner Thin-Walled Injection-Molded Parts. Polymers, 16(8), 1057. https://doi.org/10.3390/polym16081057