Article

A Screen-Printed Voltammetric Sensor Modified with Electropolymerized Molecularly Imprinted Polymer (eMIP) to Determine Gallic Acid in Non-Alcoholic and Alcoholic Beverages

by
Camilla Zanoni
,
Lucrezia Virginia Dallù
,
Clementina Costa
,
Alessandra Cutaia
and
Giancarla Alberti
*
Department of Chemistry, University of Pavia, Via Taramelli 12, 27100 Pavia, Italy
*
Author to whom correspondence should be addressed.
Polymers 2024, 16(8), 1076; https://doi.org/10.3390/polym16081076
Submission received: 11 March 2024 / Revised: 6 April 2024 / Accepted: 8 April 2024 / Published: 12 April 2024

Abstract

:
This paper presents a low-cost disposable sensor for gallic acid (GA) detection in non-alcoholic and alcoholic beverages using a screen-printed cell (SPC) whose working electrode (in graphite) is modified with electrosynthesized molecularly imprinted polypyrrole (eMIP). Our preliminary characterization of the electrochemical process shows that gallic acid (GA) undergoes irreversible oxidation at potentials of about +0.3 V. The peak potential is not affected by the presence of the eMIP film and alcohol percentages (ethanol) up to 20%. The GA determination is based on a differential pulse voltammetry (DPV) analysis leveraging its oxidation peak. The calibration data and the figures of merit of the analytical method (LOD, LOQ, and linear range) are calculated. To validate the feasibility of the sensor’s application for the dosing of GA in real matrices, some non-alcoholic and alcoholic beverages are analyzed. The results are then compared with those reported in the literature and with the total polyphenol content determined by the Folin–Ciocalteu method. In all cases, the concentrations of GA align with those previously found in the literature for the beverages examined. Notably, the values are consistently lower than the total polyphenol content, demonstrating the sensor’s selectivity in discriminating the target molecule from other polyphenols present.

1. Introduction

Polyphenols have aroused interest due to their substantial health benefits, such as their anti-inflammatory and antihistaminic effects, protection against cardiovascular diseases, and potential antitumor activities [1].
Gallic acid (GA, 3,4,5-trihydroxy benzoic acid) is a natural polyphenol mainly present in fruits (for example, grapes, cranberries, and bananas) and beverages such as tea and wines. GA is a joint ingredient in herbal supplements, homeopathic remedies, and pharmaceutical products. Thanks to its remarkable antioxidant activities, it inhibits the interaction of radicals with health-benefitting molecules by yielding H-atoms from its phenol functionalities to free radicals [2,3,4]. It is also often employed in electroanalysis as a standard for determining the total polyphenol content, i.e., the antioxidant capacity index of foods [5,6]. Moreover, the quantification of GA is frequently an index of the authenticity of fruit juices or alcoholic beverages [7].
Monitoring GA concentration is crucial, and several analytical methods have been proposed, such as high-performance liquid chromatography (HPLC) [8], capillary electrophoresis [9], diffuse reflectance spectrometry [10], and chemiluminescence [11]. However, some of these techniques involve complex and laborious sample pre-treatment steps before an analysis can be conducted, coupled with expensive instrumentation.
Electrochemical methods are suitable alternatives to overcome these drawbacks since they provide a low-cost, selective, and sensitive way to detect several analytes.
GA can be efficiently determined by electroanalytical methods since it is an electroactive compound undergoing irreversible oxidation. Moreover, thanks to the development of materials science, the modification of electrode surfaces with conductive or molecularly imprinted polymers (MIPs) or metal nanoparticles allows for the selective sensing of GA [12]. Different electrochemical sensors and methods have been proposed, mainly based on modifying classical macroelectrodes, such as glassy carbon, carbon paste, or gold with acrylic molecularly imprinted polymer films [13,14,15]. Despite their good analytical performances, lengthy and expensive electrode surface modifications are required, limiting their use for research purposes.
As an alternative, the present work presents the employment of screen-printed cells whose working electrode is modified by an electropolymerized molecularly imprinted polypyrrole.
In the last decades, screen-printed cells (SPCs) have grown significantly in demand due to the advantages of screen-printing technology in terms of its low price, versatility, and user-friendliness [16]. Moreover, screen-printed electrodes (SPEs) are among the most adaptable devices for on-site sensing due to their rapid response, low power needs, and respectable level of sensitivity [17]. The outstanding adaptability of SPEs is mainly determined by the numerous methods by which the electrodes’ surface can be modified. The inks’ composition and the electrodes’ surface can be modified by noble metal nanoparticles, polymers, or bioreceptors [18]. SPEs have been indicated as effective sensor substrates for developing disposable MIP-based devices for in situ and point-of-care testing applications.
MIPs are well-known synthetic receptors that simulate the typical recognition system of their biological counterparts (i.e., enzymes for substrates or antibodies for antigens) [19]. Molecular imprinting polymerization is based on a three-reagent synthesis comprising functional monomers, a crosslinker, and the target analyte, the latter acting as a template. After the polymerization, the analyte/template is removed, and specific recognition cavities are formed inside the polymer, matching the shape and size of the analyte. Therefore, when contacted with a sample solution, the empty MIP can rebind the target molecule or closely related compounds specifically [20,21,22,23]. MIPs are attractive for their recognition ability, similar to that of natural receptors. They can be prepared for several target analytes and possess a higher level of physical and chemical stability than bioreceptors [24,25].
The surface imprinting method has recently been highlighted as the most convenient way for depositing MIPs directly on SPEs [26,27,28,29,30,31,32,33,34]. Among different strategies, electropolymerization is very efficient since it grants excellent control of the MIP growth on the electrode’s surface; the thickness can be modulated easily and finely by controlling the polymerization conditions [35,36,37].
The most frequently electropolymerized monomers are pyrrole, aniline, and thiophene derivatives [38,39]. Polypyrrole has often been employed thanks to its water solubility, good stability, conductivity, and redox properties [40].
An electrochemical procedure that can be applied to improve electrosynthesized molecularly imprinted polypyrroles is overoxidation, which is obtained by applying to the MIP film an anodic potential more positive than that necessary for polymerization. The overoxidation is helpful since it allows for the formation of oxygen-containing groups, such as hydroxyl, carbonyl, and carboxyl, which can form hydrogen bonds that can be involved in various electrostatic interactions with template molecules, promoting the formation of highly selective cavities [39]. Sometimes, overoxidation can be used to improve the template removal or the renovation of the sensor’s performance after measurements have been taken [35].
In this scenario, a voltammetric sensor for gallic acid detection is developed and tested to determine the analyte in non-alcoholic and alcoholic beverages. In particular, a molecularly imprinted overoxidized polypyrrole film was electrosinthesized over the working electrode surface (in graphite ink) of screen-printed cells using GA as the template. Differential pulse voltammetry (DPV) is used for our quantitative analysis. Interference tests and an analysis of tea and wine samples were performed to evaluate the selectivity and applicability of the proposed sensor.
Compared to already-presented MIP-modified electrodes for GA detection [13,14,15], the advantages of our sensor are its cheaper electrodes and apparatus, the reduced quantity of reagents and solvents required, the lack of a pre-treatment step for samples, and the possibility of in situ or online analysis thanks to portable instrumentation.

2. Materials and Methods

2.1. Reagents and Instruments

Pyrrole solution (98%, Merk Life Science S.r.l., Milan, Italy) was purified by a Hickman distillation head until a transparent solution was obtained and it was stored in darkness at 4 °C. Gallic acid (97.5–102.5% titration), lithium perchlorate (LiClO4, purum p.a., ≥98.0%), sodium chloride (NaCl, ACS reagent, 99.5%, catechin (ACS reagent, ≥98.0%)), L-ascorbic acid (analytical standard), 2-furaldheyde (ACS reagent, ≥98.0), L-tartaric acid (ACS reagent, ≥99.0%), Folin–Cicolteau reagent, and ethanol (for analysis, ACS reagent), from Merk Life Science S.r.l., Milan, Italy were used as received.
For electrode surface characterization, solutions of potassium hexacyanoferrate(III), potassium chloride, and sodium chloride (Merk Life Science S.r.l., Milan, Italy) were used.
“Tavernello, cantine Caviro 2020” (10.5% white wine), “Tavernello cantine Caviro 2020” (11.5% red wine), “Belvento Velarosa 2022” (13.5% rosè wine), “Giacomo Sperone” (17% marsala wine), and “Lipton” green tea were acquired from a local supermarket (Pavia, Italy).
Screen-printed cells (SPCs) with working and counter electrodes in graphite and a pseudo-reference by Ag/AgCl-ink (Topflight Italia S.P.A., Vidigulfo, Pavia, Italy) were used.
The potentiostat/galvanostat EmStat4s (PalmSens BV, Houten, The Netherlands) was employed for the voltammetric and EIS (electrochemical impedance spectroscopy) measurements.

2.2. Modification of SPCs by eMIP and eNIP

Before modification, the SPCs were cleaned with ethyl alcohol and dried under a hood at room temperature.
The eMIP-based electrode was obtained by electropolymerization on the surface of the cleaned working electrode of the SPC by five cycles of cyclic voltammetry (CV), scanning the potential from −0.6 V to 0.8 V at a scan speed 0.1 V/s, in an aqueous solution of 0.1 M LiClO4, 15 mM pyrrole, and 0.1 M gallic acid. The overoxidation of the molecularly imprinted polypyrrole film was achieved by chronopotentiometry at a potential of +1.2 V for 120 s in 10 mL of 0.1 M lithium perchlorate solution.
To eliminate the template from the eMIP, a two-step procedure was used: washing it in ethanol for 20 min, followed by 20 cyclic voltammetry scans from −1 to +1 V (with a scan speed of 0.1 V/s) in 0.1 M lithium perchlorate solution at pH of 3 to remove the entrapped template entirely, i.e., until the oxidation peak of gallic acid disappeared.
Electropolymerized, not-imprinted polymer (e-NIP) was prepared following the same procedure but without including gallic acid (template) in the polymerization mixture.

2.3. Voltammetric and Amperometric Measurements

The electroactive surface, before and after modifying the electrodes with the eMIP or eNIP, was measured from the parameters of the cyclic voltammetry scans in a probe solution of 5 mM K3Fe(CN)6/0.1 M KCl at pH of 7, in a potential range −1 V ÷ +1 V, and with different scan speeds from 0.025 to 0.5 V/s.
The intensity of the cathodic or anodic peak was registered and plotted vs. the square root of the scan rate; the effective area was calculated from the slope (K) of the obtained straight line and by applying the following equation [41,42]:
A = K 2.69 · 10 5 · C * · n 3 / 2 · D 1 / 2
n is the number of exchanged electrons (for K3Fe(CN)6 n = 1), D is the diffusion coefficient (for K3Fe(CN)6, D = 3.09 × 10⁻⁶ cm2/s), and C* is the concentration (5 mM) of the electrochemical probe.
The double-layer capacitance [42,43,44] before and after modification of the electrodes was measured by performing cyclic voltammetry in 0.1 M NaCl solution, varying the scan speeds from 0.025 to 0.5 V/s. in a potential interval in which non-Faradaic current is probable, for example, from +0.05 V to −0.05 V. The difference between the cathodic and anodic current values registered at 0.02 V was plotted against the scan speed; the capacitance corresponds to the slope of the straight line obtained. The double-layer capacitance can be obtained by dividing this value by two.
Before and after modification of the electrode surface, electrochemical impedance spectroscopy (EIS) measurements were also taken to characterize the electrode surface further and describe the electrochemical processes at the electrolyte–electrode interface [45,46]. The EIS measurements were taken in 10 mL of a probe solution (in this case, 5 mM K3Fe(CN)6/0.1 M KCl at pH of 7). The impedance was registered in the 100 kHz–10 mHz frequency range with a sinusoidal potential modulation of 0.05 V superimposed on a DC potential of 0.2 V.
The most known and used electrochemical probes for EIS are K4Fe(CN)6, K3Fe(CN)6, and an equimolar mixture of both. Generally, K4Fe(CN)6 alone is not used since the Warburg effect is too strong and the charge transfer resistance is not well modeled. K3Fe(CN)6 permits a reasonable resolution of the process at the interface which can be emphasized by changing the concentration of the probe. The mixture of K4Fe(CN)6/K3Fe(CN)6 is the most used since it combines the advantages of each probe; for example, in the presence of this mixture, the interface and the diffusion processes can be detected [47]. In the present study, after preliminary measurements using the mixture of K4Fe(CN)6/K3Fe(CN)6 followed by measurements of K3Fe(CN)6 alone, similar results were obtained, so all the subsequent experiments were performed with the last probe.
Gallic acid’s electrochemical oxidation was characterized using cyclic voltammetry and exhaustive coulometry [48,49,50]. In particular, the number of electrons involved in the entire electrochemical process was determined using exhaustive coulometry [48,49,50] by electrolyzing gallic acid at a potential slightly above (from 50 to 100 mV) the oxidation peak in a three-electrode cell under a gentle flow of nitrogen. A Pt gauze was employed as a working electrode, a Pt wire was the counter electrode, and Ag/AgCl/3 M KCl was the reference electrode. The number of electrons was computed from the quantity of charges, Q = I × t, required for the exhaustive electrolyzation of the analyte (i.e., until the current reached 5% of the initial value).
The parameters characterizing the first stage of the oxidation process, i.e., corresponding to the first and well-defined CV wave, were derived from the cyclic voltammograms registered in 10 mL LiClO4 0.1 M/GA 2.5 mM solution at pH of 3 from −1 V to +1 V with different scan speeds from 0.01 to 2 V/s.
The diffusion coefficient D (cm2/s) was calculated from the slope of the graph intensity of the anodic peak current (Ip, A) vs. square root of the scan rate (v, V/s) and by applying Equation (2) as follows, which holds true for irreversible processes [51]:
I p = 2.99 · 10 5 · n · n α · α a · A · C * · D · v
where n is the number of exchanged electrons in the first oxidation step, nα is the number of electrons exchanged in the slowest limiting step (for a one-electron process, nα = 1), αa is the anodic transfer coefficient, A is the active area (cm2), C* is the molar concentration of the analyte in the solution, and D is the diffusion coefficient (cm2/s).
A rough estimate of the formal potential (E0′) for an irreversible process was obtained from the intercept of the plot anodic peak potential (Ep, V) vs. scan rate (v, V/s) [49,52].
The anodic transfer coefficient (αa, V) for an irreversible process can be calculated by applying Equation (3) as follows [51,53]:
E p E p / 2 = 1.857 · R · T α a · n · F = 47.7 α a · n   mV   at   25   ° C
where Ep is the potential of the oxidation peak (V), Ep/2 is the potential value at ip/2, R is the gas constant (J/mol K), T is the temperature (K), F is the Faraday constant (C/mol), and n is the number of lost electrons.
The charge transfer kinetic constant k0 was computed by applying Equation (4) as follows [54], knowing E0′ and D:
E p = E 0 R · T α a · n · F · 0.78 ln k 0 D + ln α a · n · F · v R · T
where Ep is the potential of the anodic peak, R is the gas constant (J/molK), T is the temperature (K), αa is the charge transfer coefficient (V), F is the Faraday constant (C/mol), D is the diffusion coefficient (cm2/s), n is the number of electrons involved in the rate-determining steps, and v is the scan rate (V/s).
Gallic acid (GA) was quantitatively determined by differential pulse voltammetry (DPV) in 10 mL of LiClO4 0.1 M at pH of 3 or in hydro-alcoholic solutions with different percentages of ethanol and by applying the following experimental conditions:
Estart = −1 V; Eend = 1 V; Estep = 0.015 V; Epulse = 0.02 V; tpulse = 0.2 s; and scan rate = 0.05 V/s.

3. Results

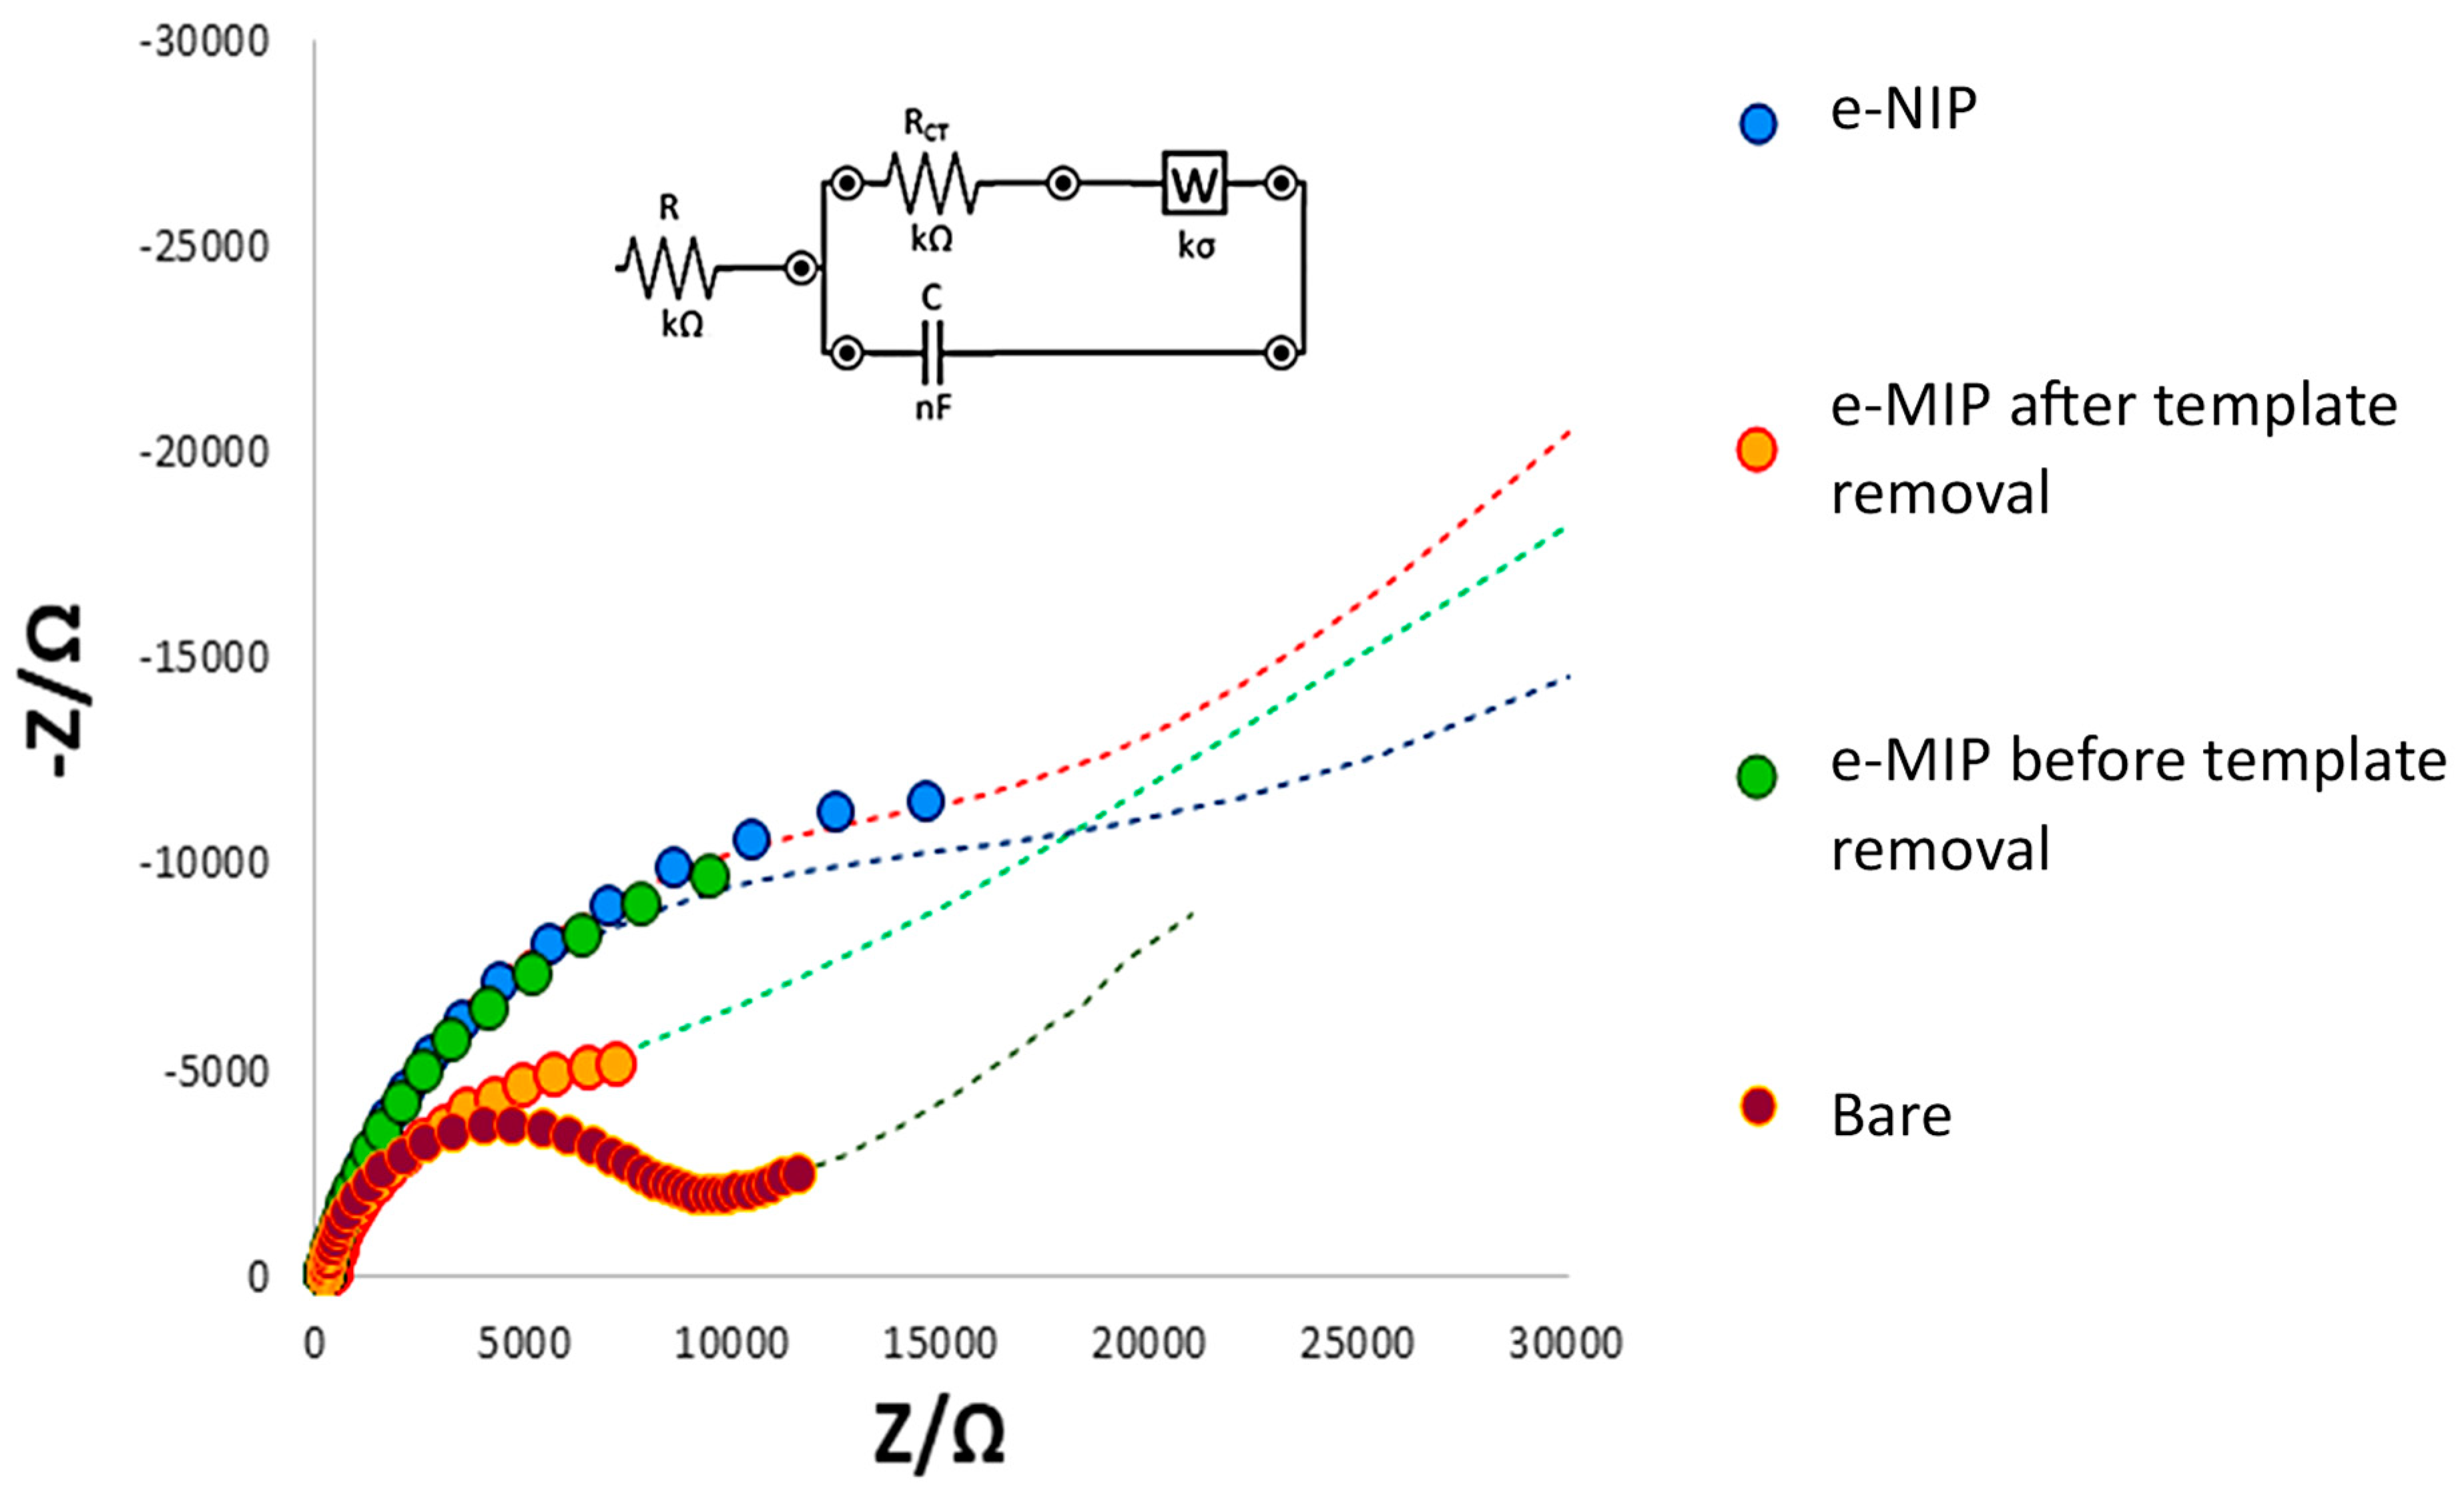
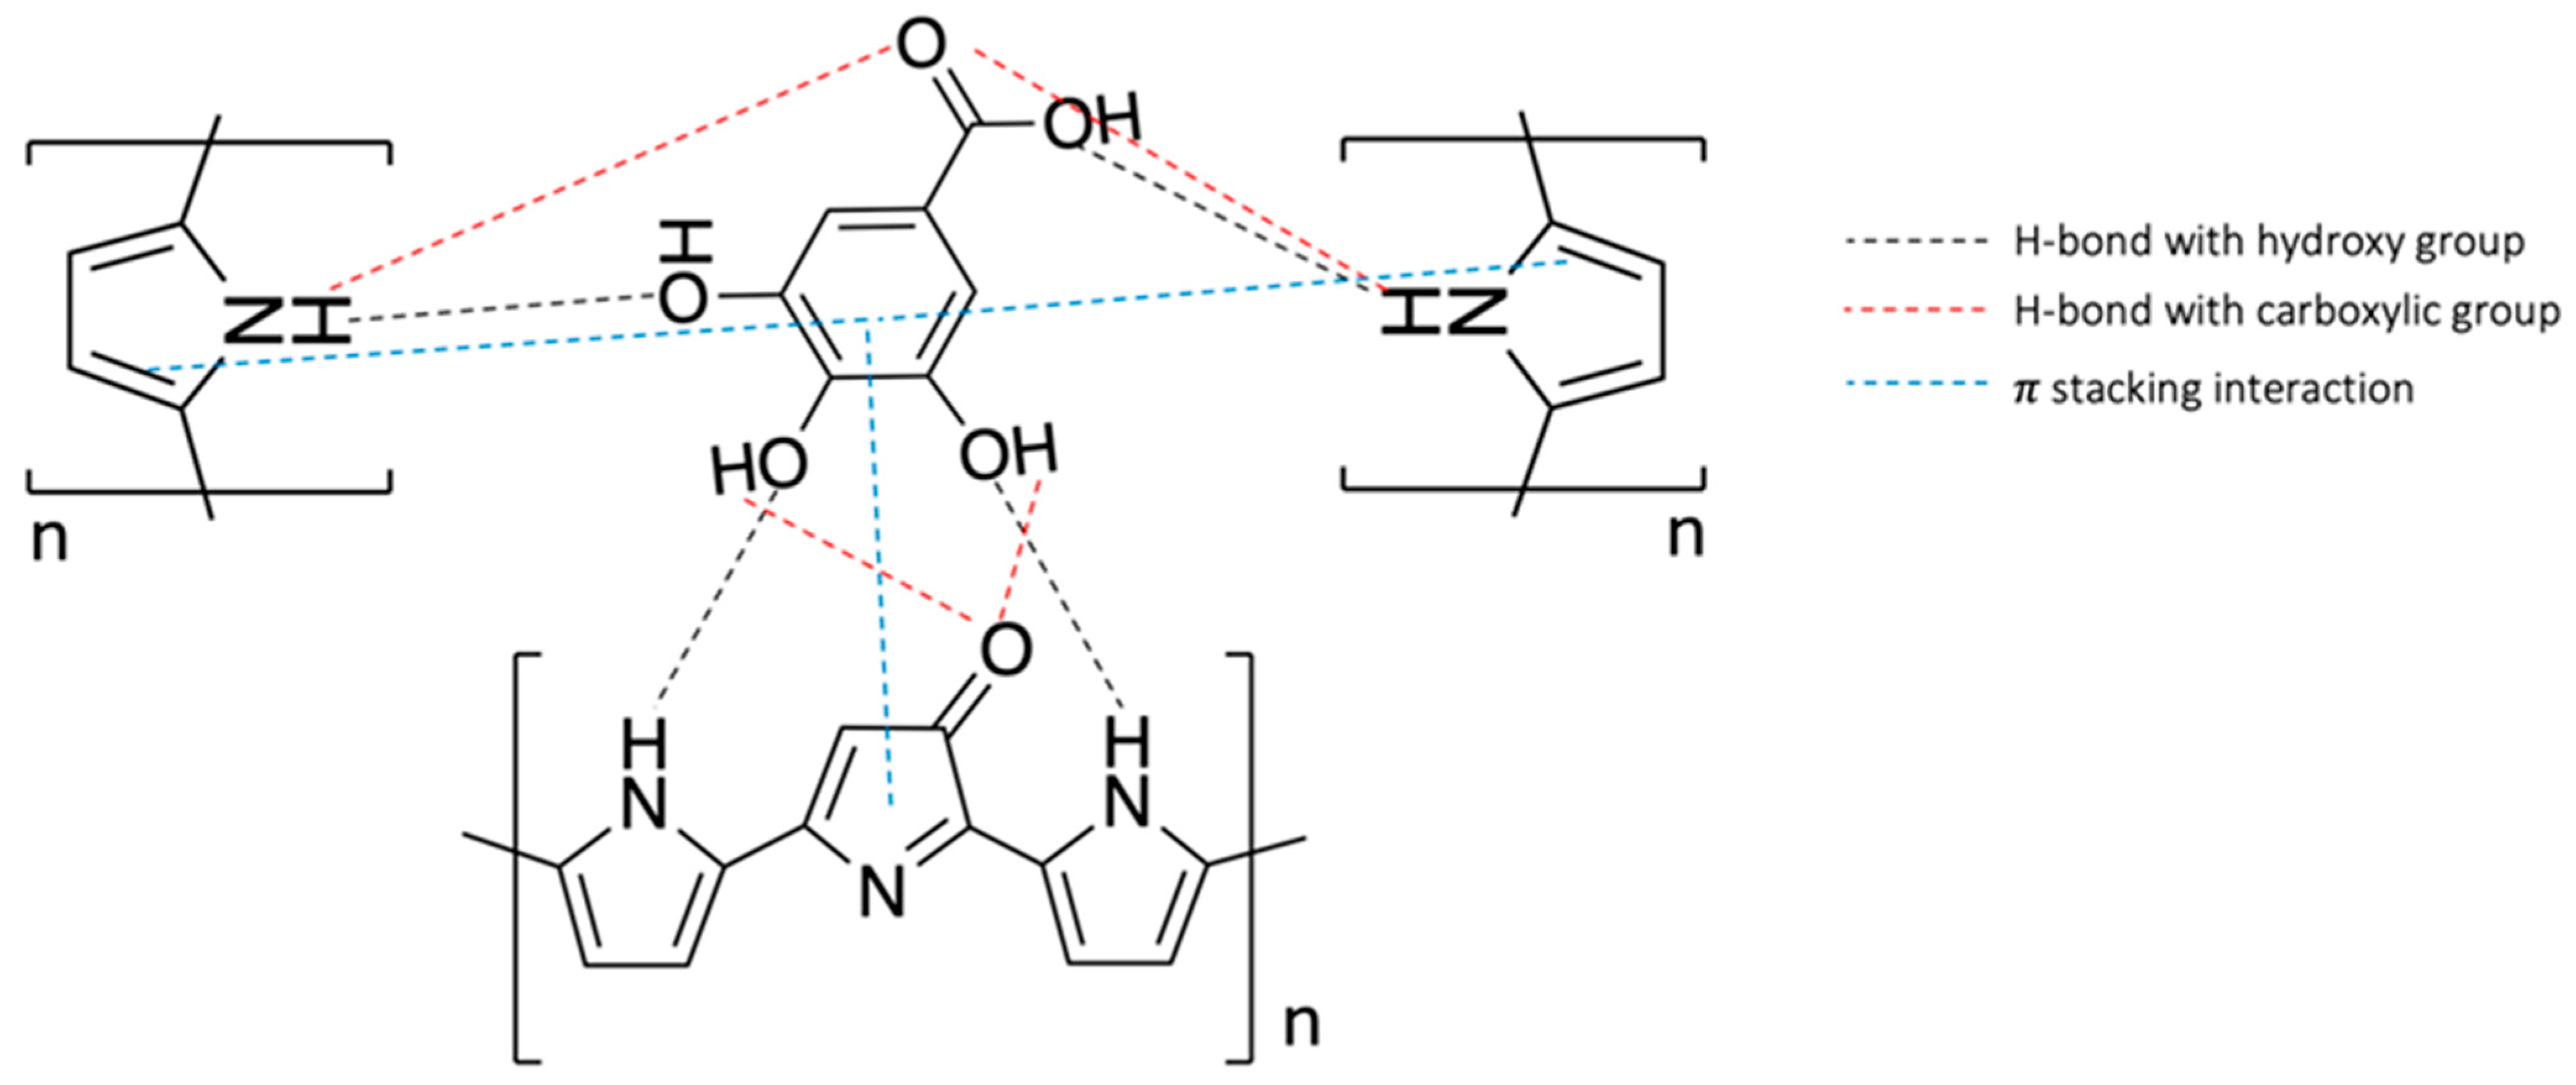
3.1. SPC’s Working Electrode Modification by eMIP and Its Characterization

The molecularly imprinted polypyrrole was prepared using a molar ratio template/functional monomer equal to 1:15, according to previous studies that suggested avoiding molar ratios higher than 1:5, since fewer imprinted sites should be obtained; conversely, molar ratios lower than 1:20 involve a high quantity of templates, which, during the synthesis, can influence the micro-environment of the reaction, hindering the polymerization [55]. As a reasonable compromise between a limited number of recognition cavities (achievable with < five CV scans) and a very thick polymer film with less accessible recognition sites (achievable with > seven to ten CV scans) [56], five CV scans were selected.
The polypyrrole-imprinted film was then overoxidized. Overoxidation involves the formation of ketone groups in the polypyrrole network and disrupts the conjugation without a significant loss of the polymer from the electrode [57]. Moreover, the film thickness tuning is improved, and the background currents are low and stable [36,38,39].
In the eMIP-modified electrode, the template molecules are entrapped in the polypyrrole network through non-covalent interactions, i.e., hydrogen bonds between the hydroxyl and carboxylic groups of the gallic acid and the -NH functionalities of the pyrrole units. A scheme of the possible interaction mechanism is shown in Figure 1.
Regarding the electrochemical characterization of the working electrode surface before and after modification with eMIP or eNIP, the electrochemically active area and the double-layer capacitance were determined. Table 1 summarizes our results. Additionally, an electrochemical impedance spectroscopy (EIS) analysis was conducted.
The active area was determined by CV measurements in an electrochemical probe solution (K3Fe(CN)6) at various scan speeds. The height of the oxidation or reduction current peak was plotted vs. the square root of the scan rate. From the slope of the straight line (K) and by applying the Randles–Sevcik equation (Equation (1)), the active area was computed.
Table 1 shows that the active area decreases after the electrode is coated with a polymer, and, as presumed, the electroactive surface of the eNIP-based electrode is lower than that of the eMIP. Actually, the absence of the recognition cavities in the eNIP leads to a decrease in the electroactive surface.
Regarding the double-layer capacitance, a value of 0.7 (5) μF was obtained for the bare electrode, which is significantly low if compared to that generally achievable with glassy carbon electrodes. This may be due to the different structures of the graphite used as ink for screen printing, in which basal planes prevail instead of the edge planes present in pyrolytic graphite electrodes which show faster electrochemical kinetics, as previously suggested [44]. The double-layer capacitance increased from the bare electrode to the eNIP- and eMIP-modified electrodes (see Table 1); this indicates that the presence of the polymer film increases its ability to gather electrical charges on the electrode’s surface.
Although EIS is a valuable technique for determining the double-layer capacitance for a stable and robust system, it was not applied for this purpose in the present study because screen-printed electrodes suffer from low reproducibility since the surface of each electrode is unique in regards to its impedimetric measurements. Furthermore, if the electrodes are modified with electrosinthesized eMIP, the polymeric film on each electrode can change in morphology and, consequently, capacitance. Conversely, screen-printed electrodes are stable and reliable when used in voltammetric measurements; for this reason, the cyclic voltammetry technique is applied here to determine the double-layer capacitance.
The bare and modified electrode surfaces were also characterized by EIS measurements. Our results illustrated through the EIS plot may be related to the physico-chemical properties of the electrode’s surface; indeed, the electrochemical responses can be modeled by an equivalent electrical circuit (Randles circuit). Figure 2 shows the Nyquist plot of the bare and modified electrodes (imaginary impedance -Z vs. real impedance Z).
All processes on the bare eMIP- and eNIP-modified electrode surfaces can be modeled by the Randles circuit, reported in the inset in Figure 2. R represents the interface electrode/electrolyte resistance, while RCT is the charge transfer resistance (the diameter of the semi-circle in the Nyquist plot). W is the Warburg element, representing the analyte diffusion in the bulk of the solution, and C is the capacitor at the electrode/electrolyte interface.
The linear part of the Nyquist plot (the straight line at 45°) characteristic for a mass diffusion-limited process appears only for the bare electrode. Moreover, it has the lowest RCT since the graphite ink of the electrode is a good current conductor. The RCT increases if a polymeric film on the working electrode surface is present, which blocks the electrons’ transfer. Since the eMIP features recognition cavities, a lower RCT is recognized for the eMIP-based electrode after template removal compared to that of the same electrode before the elimination of the template that has occupied cavities; indeed, the RCT increases (the diameter of the semicircle increases) by passing from the eMIP after template removal to the eMIP before template removal and finally to the eNIP. Consequently, the diffusion becomes less evident (the linear part of the plot). This behavior is explained by considering that when the analyte molecules are present within the polymer cavities and even more so when the electrode is coated with eNIP, the access of the electrochemical probe to the electrode surface is prevented, thus increasing the resistance to electronic transfer.
Table 2 shows the fitting parameters of the Randles circuital elements schematizing the Nyquist plots of Figure 2.

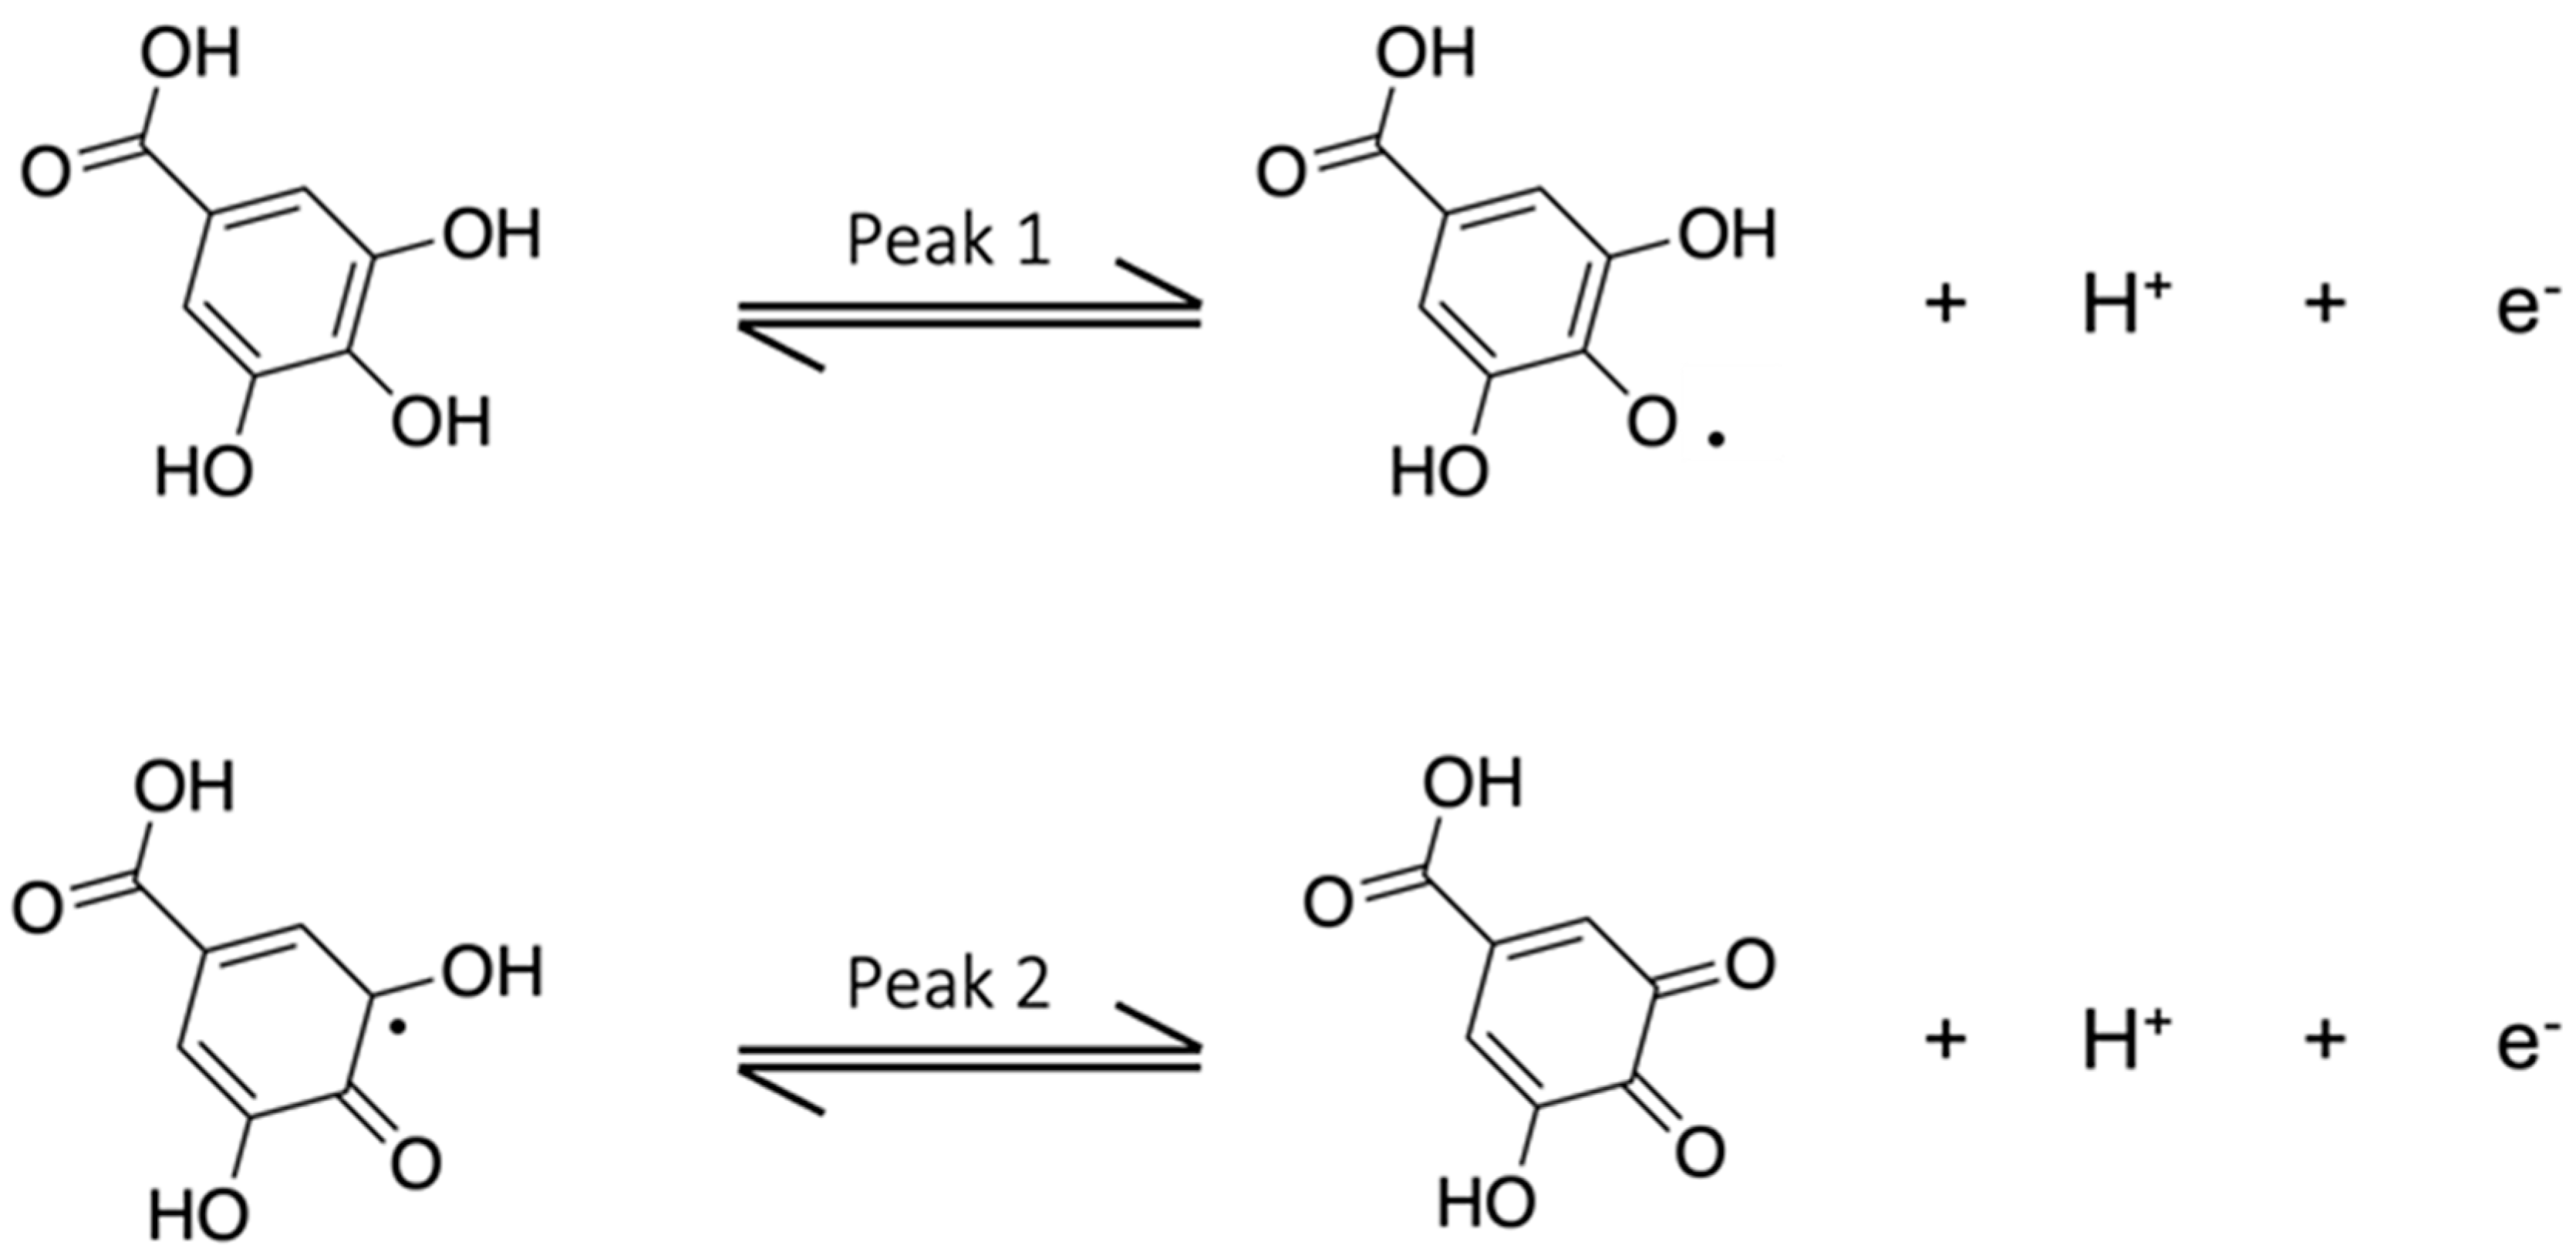
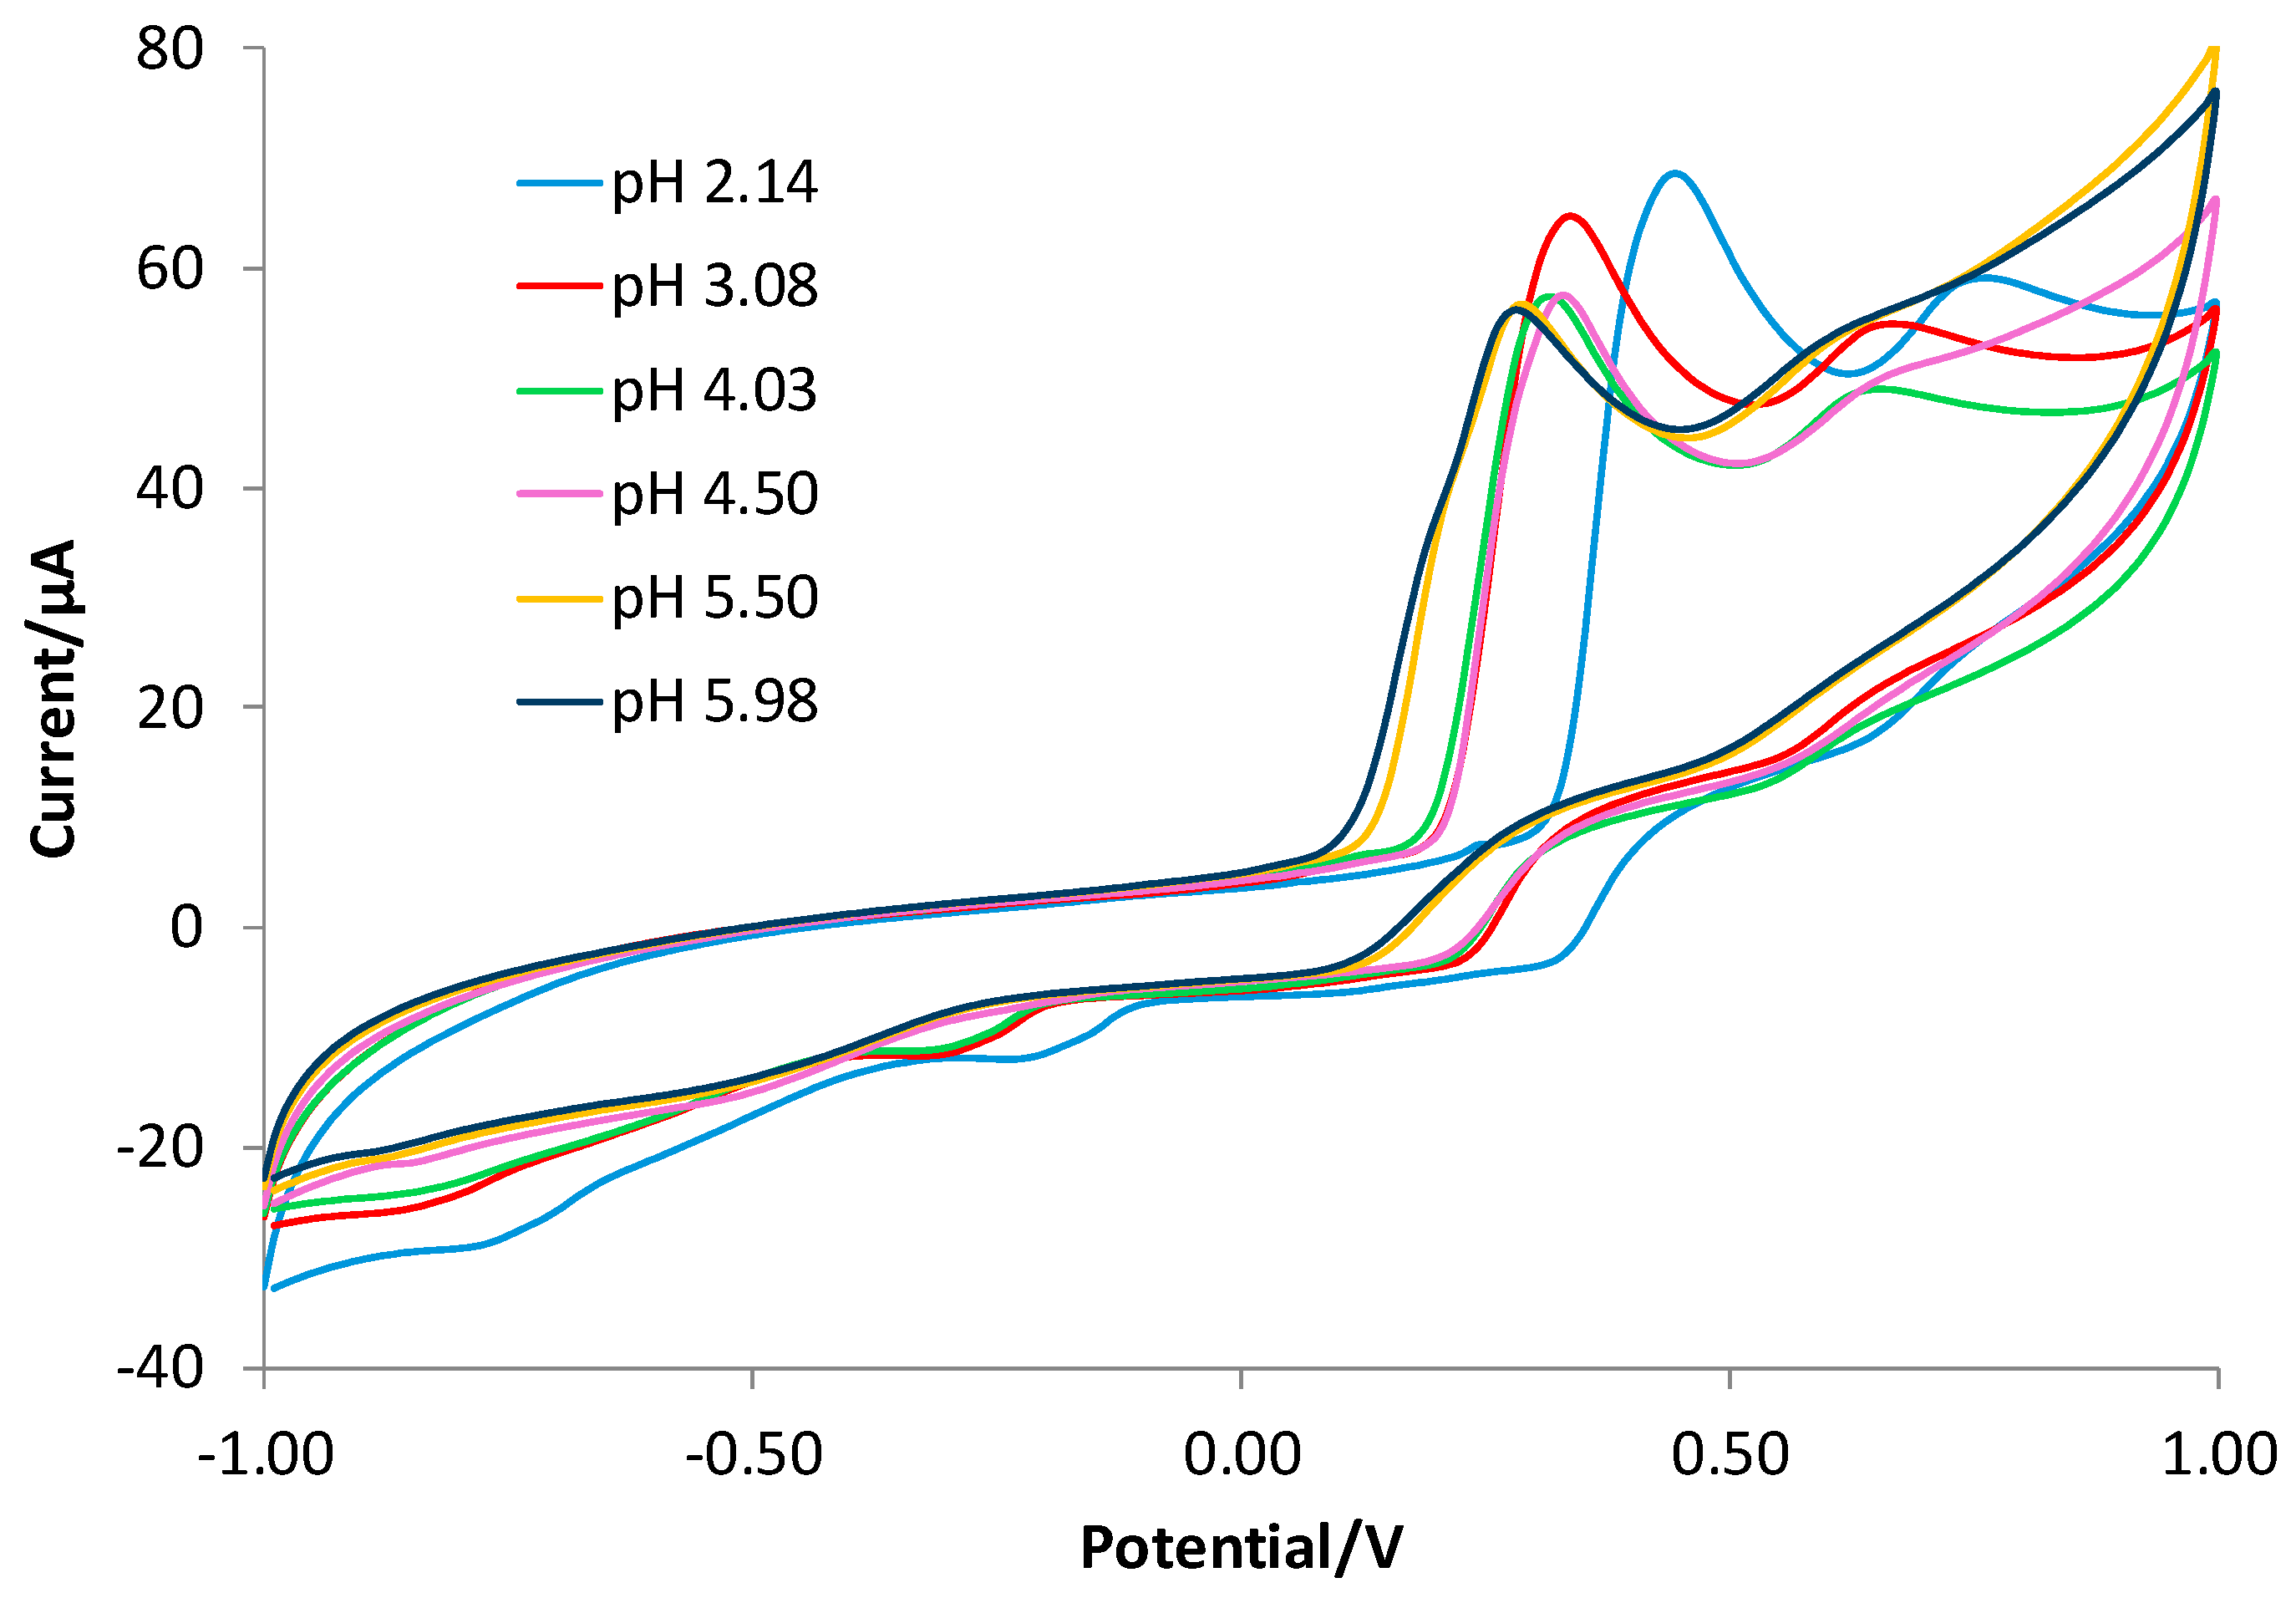
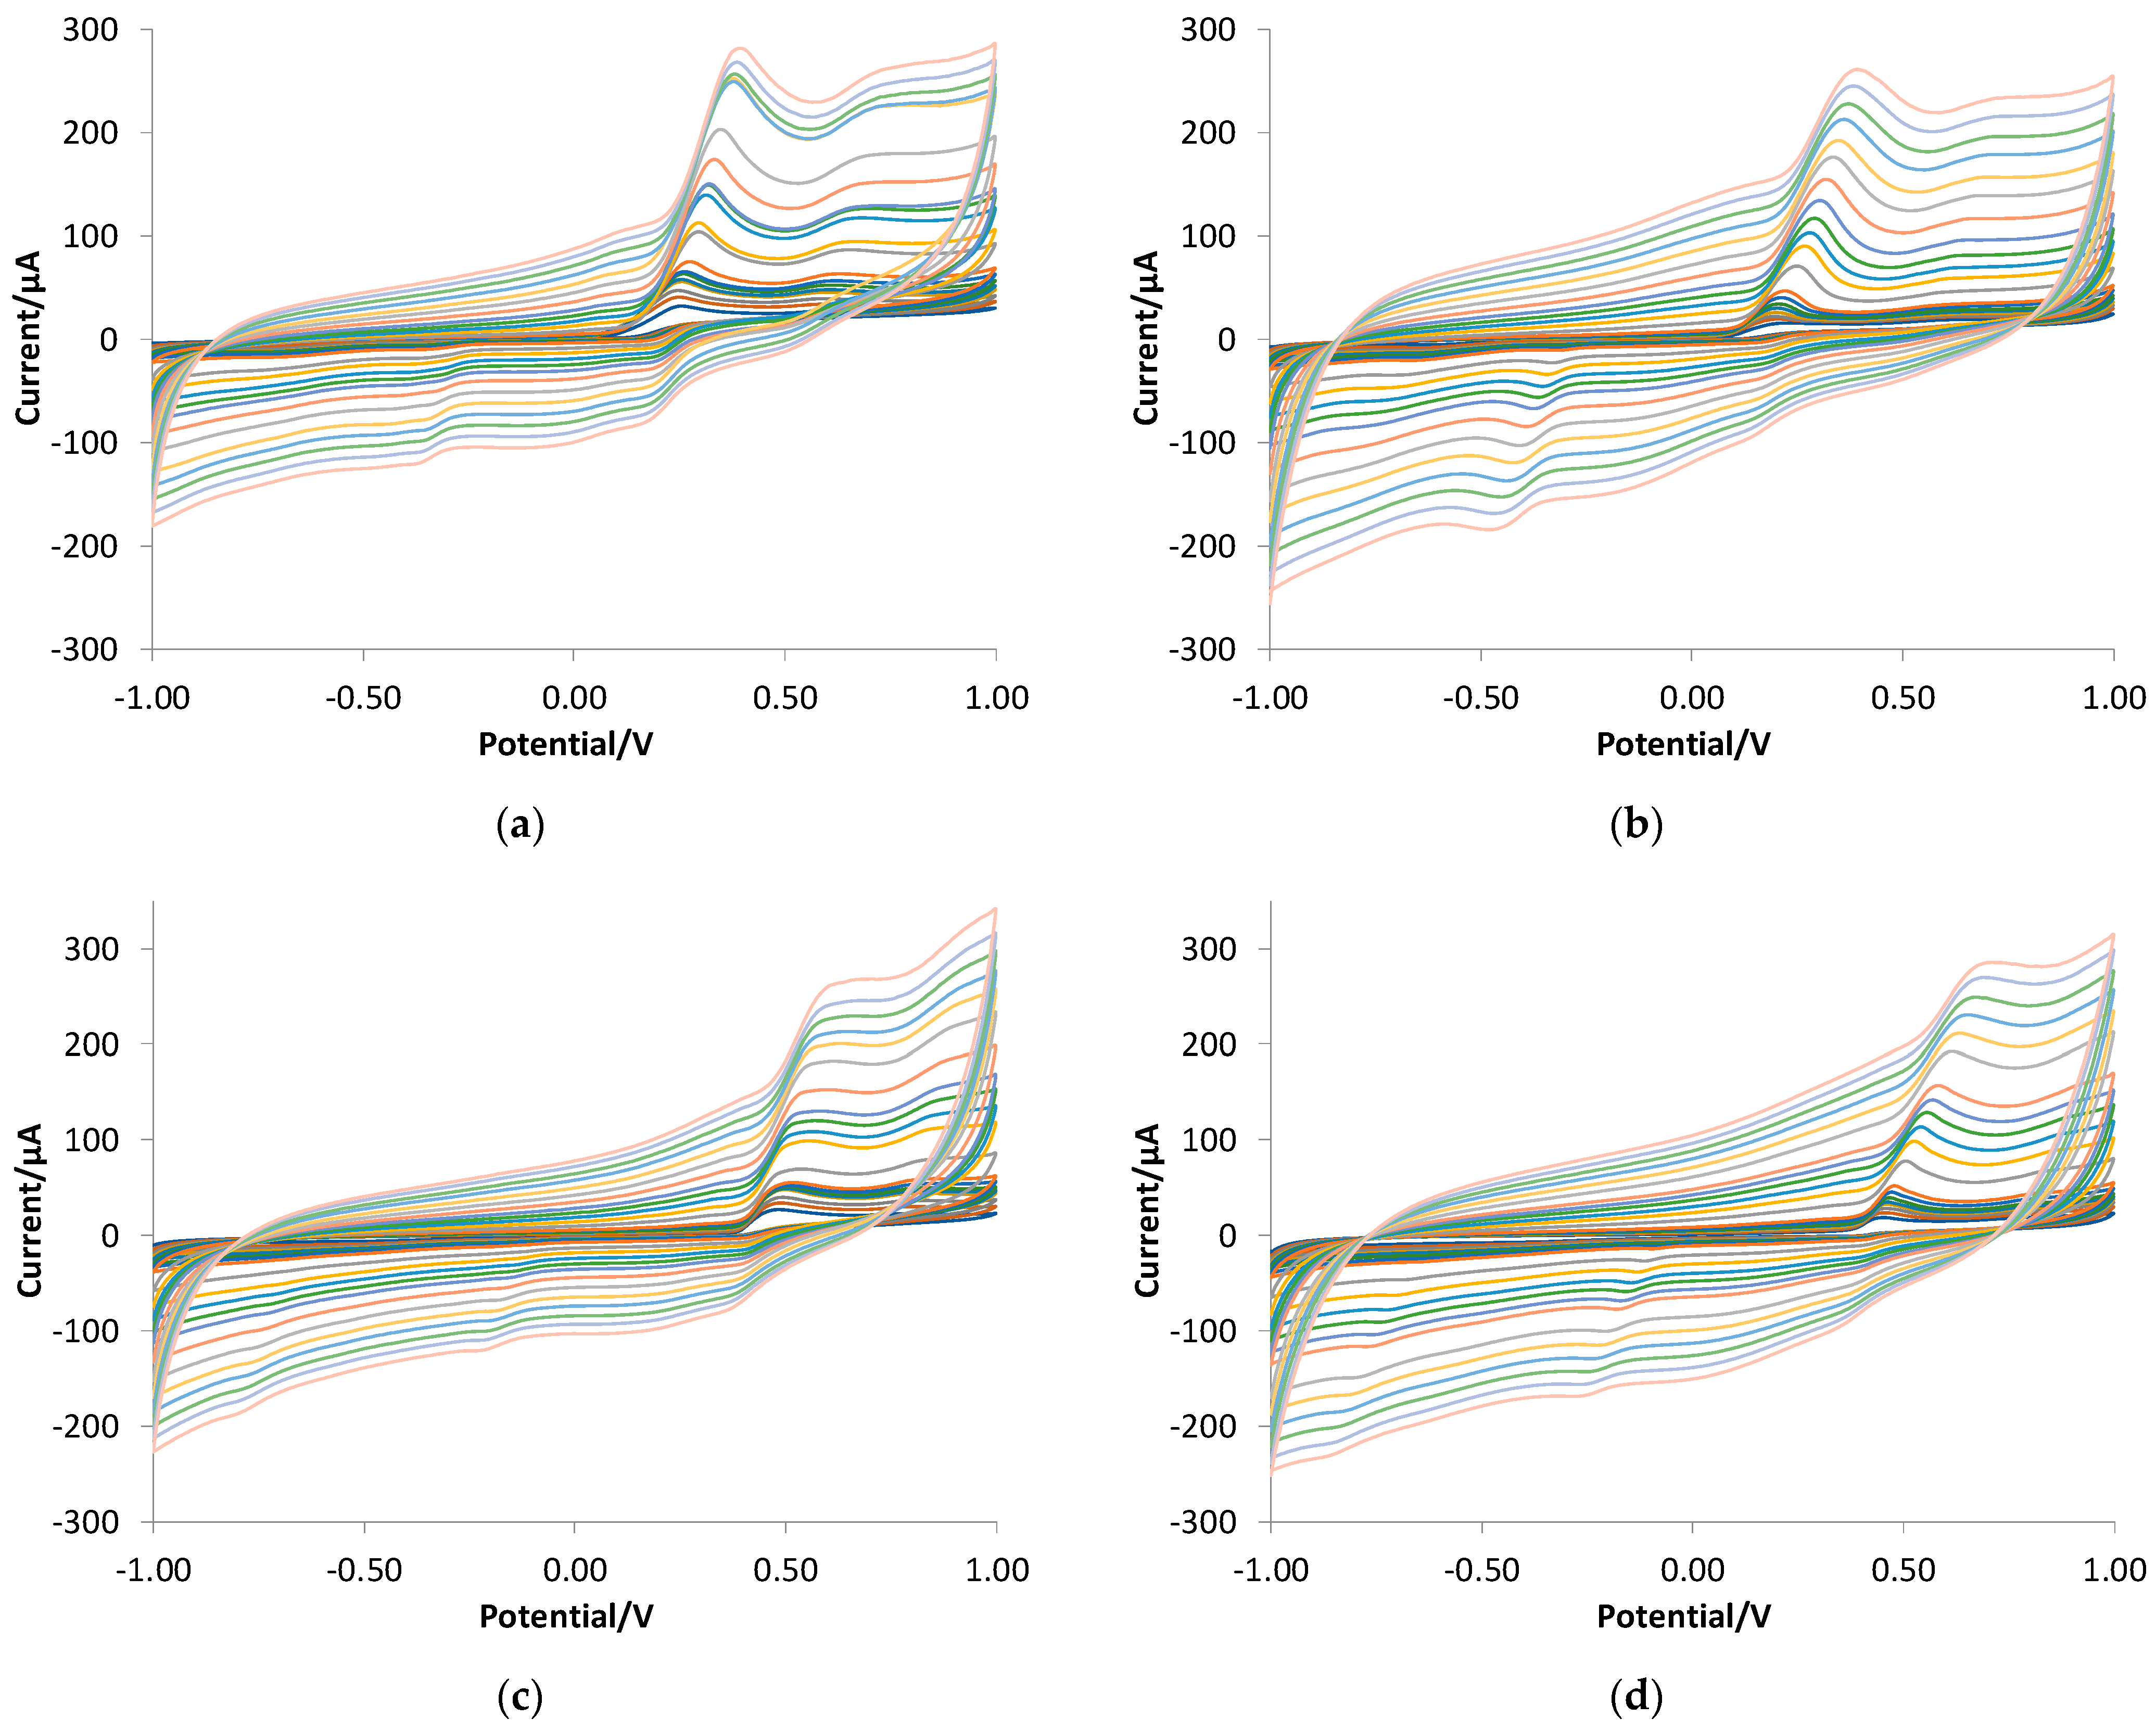
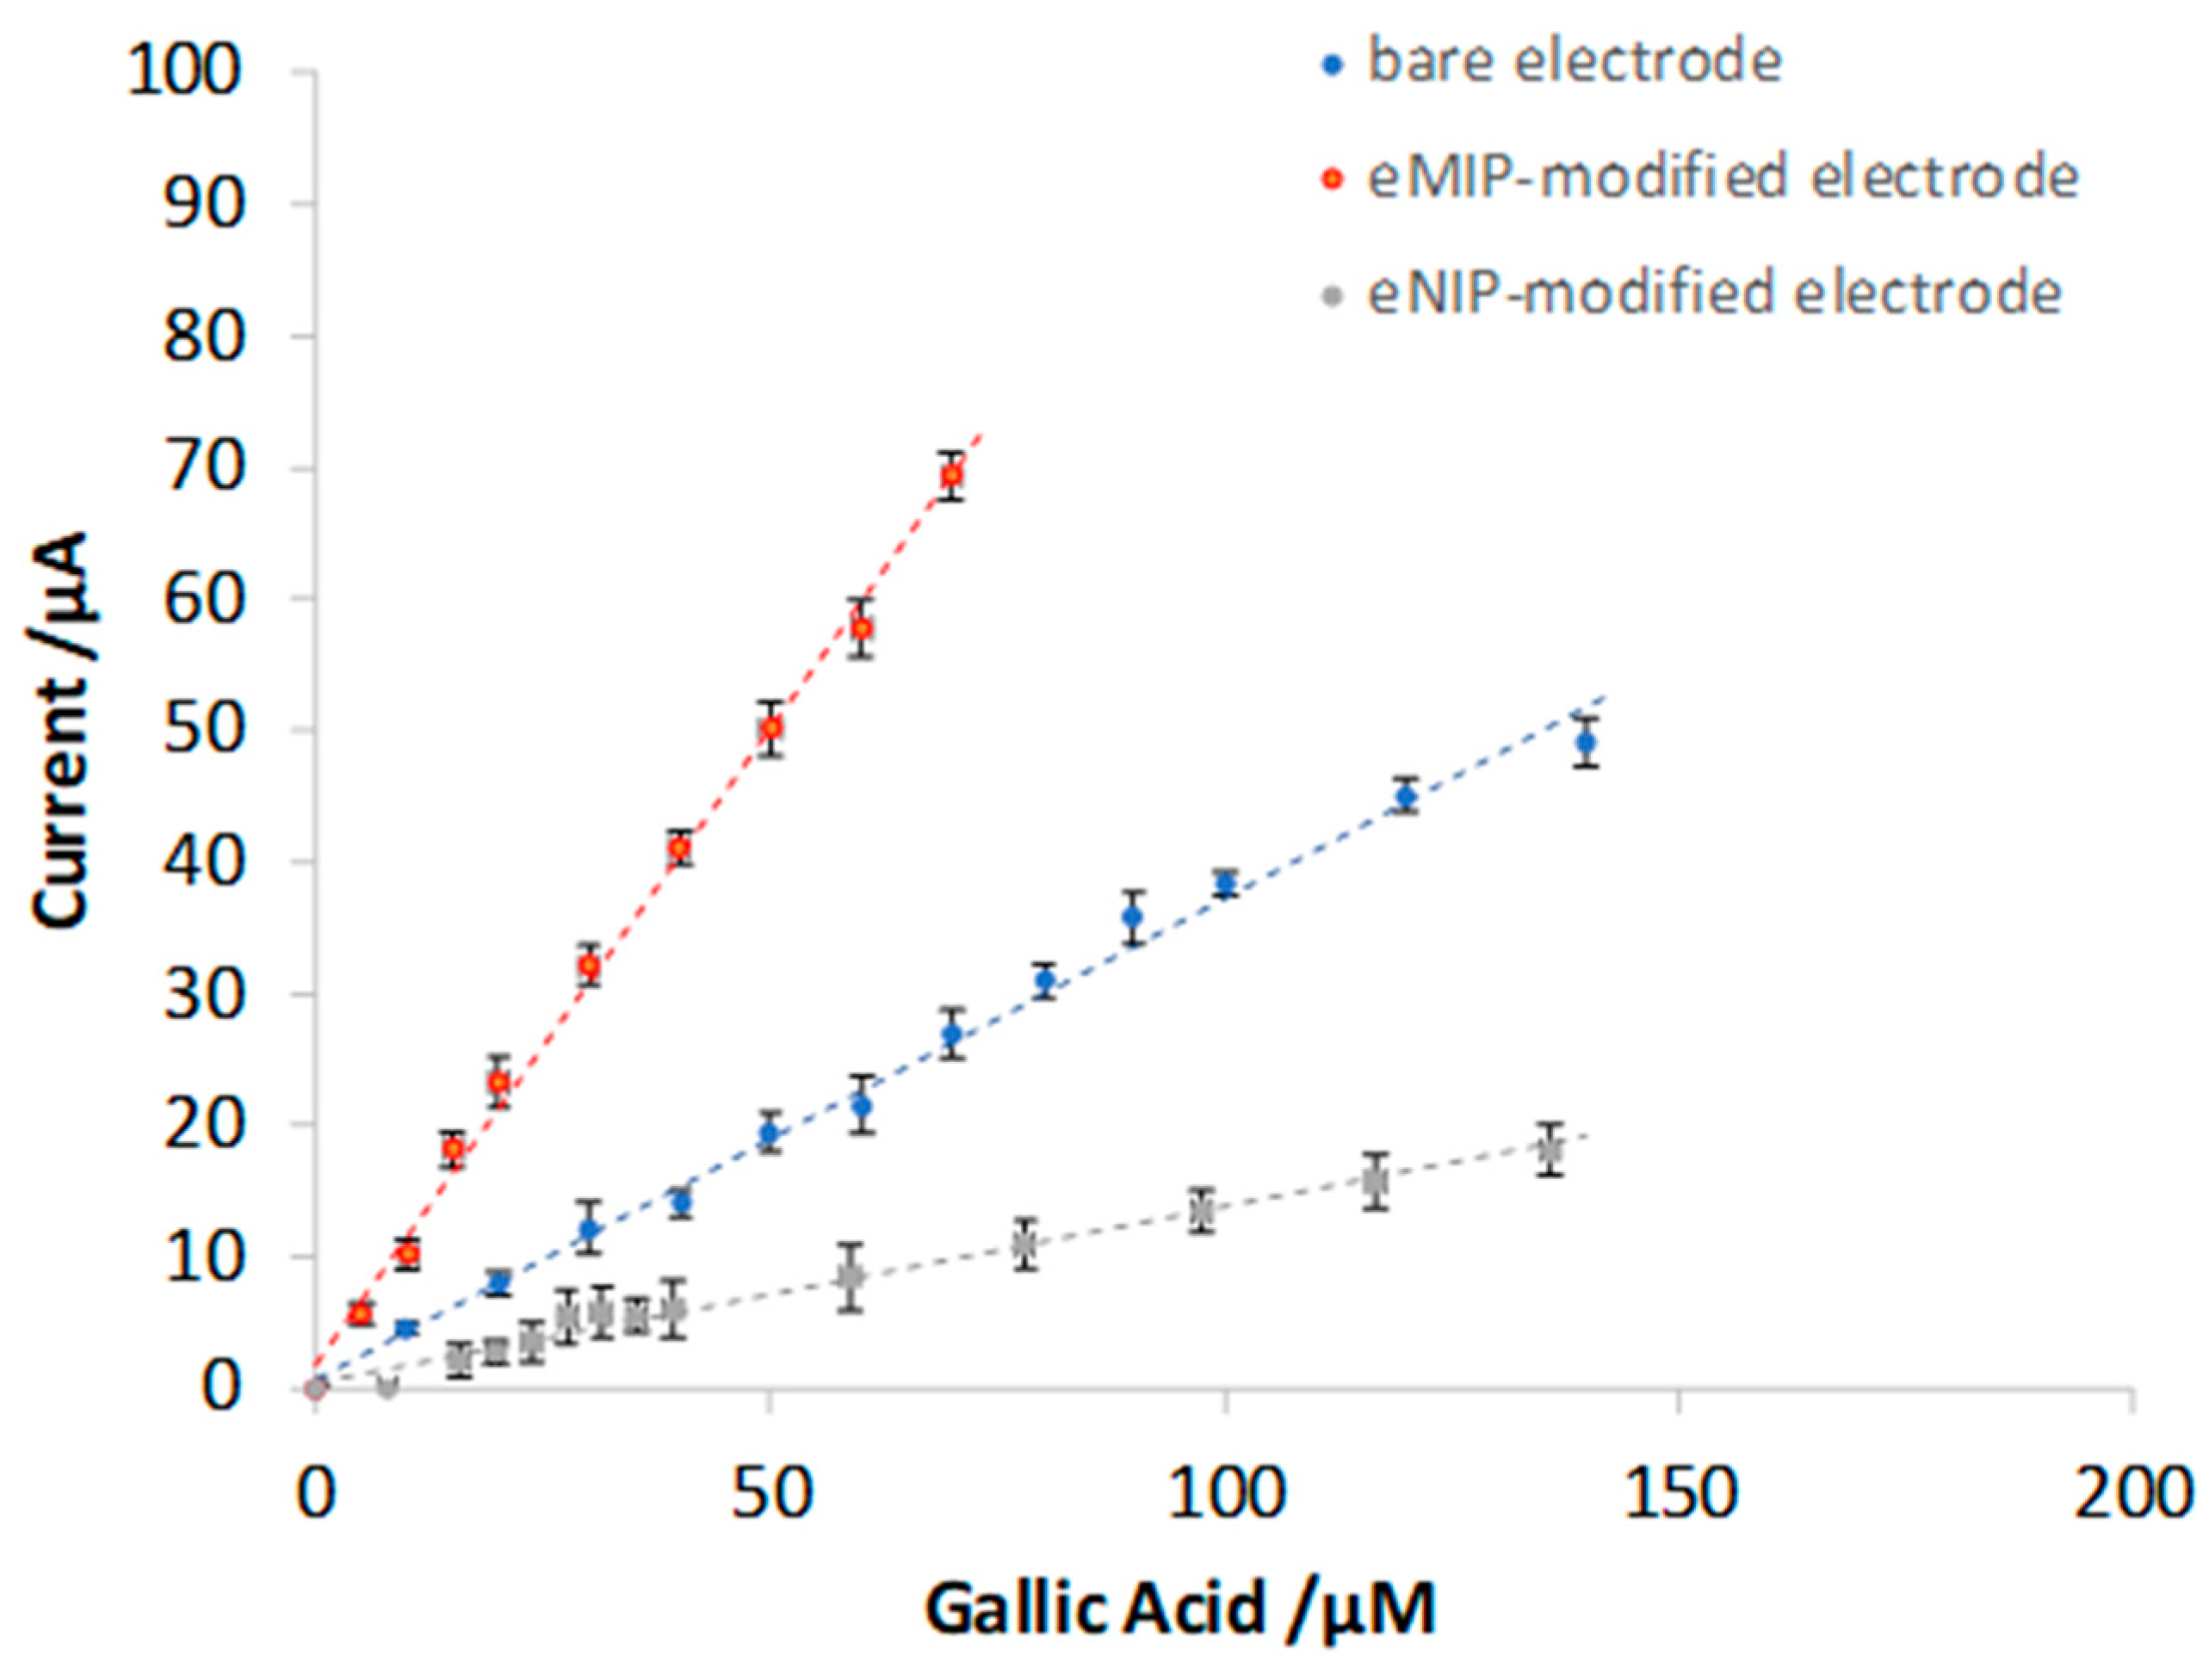
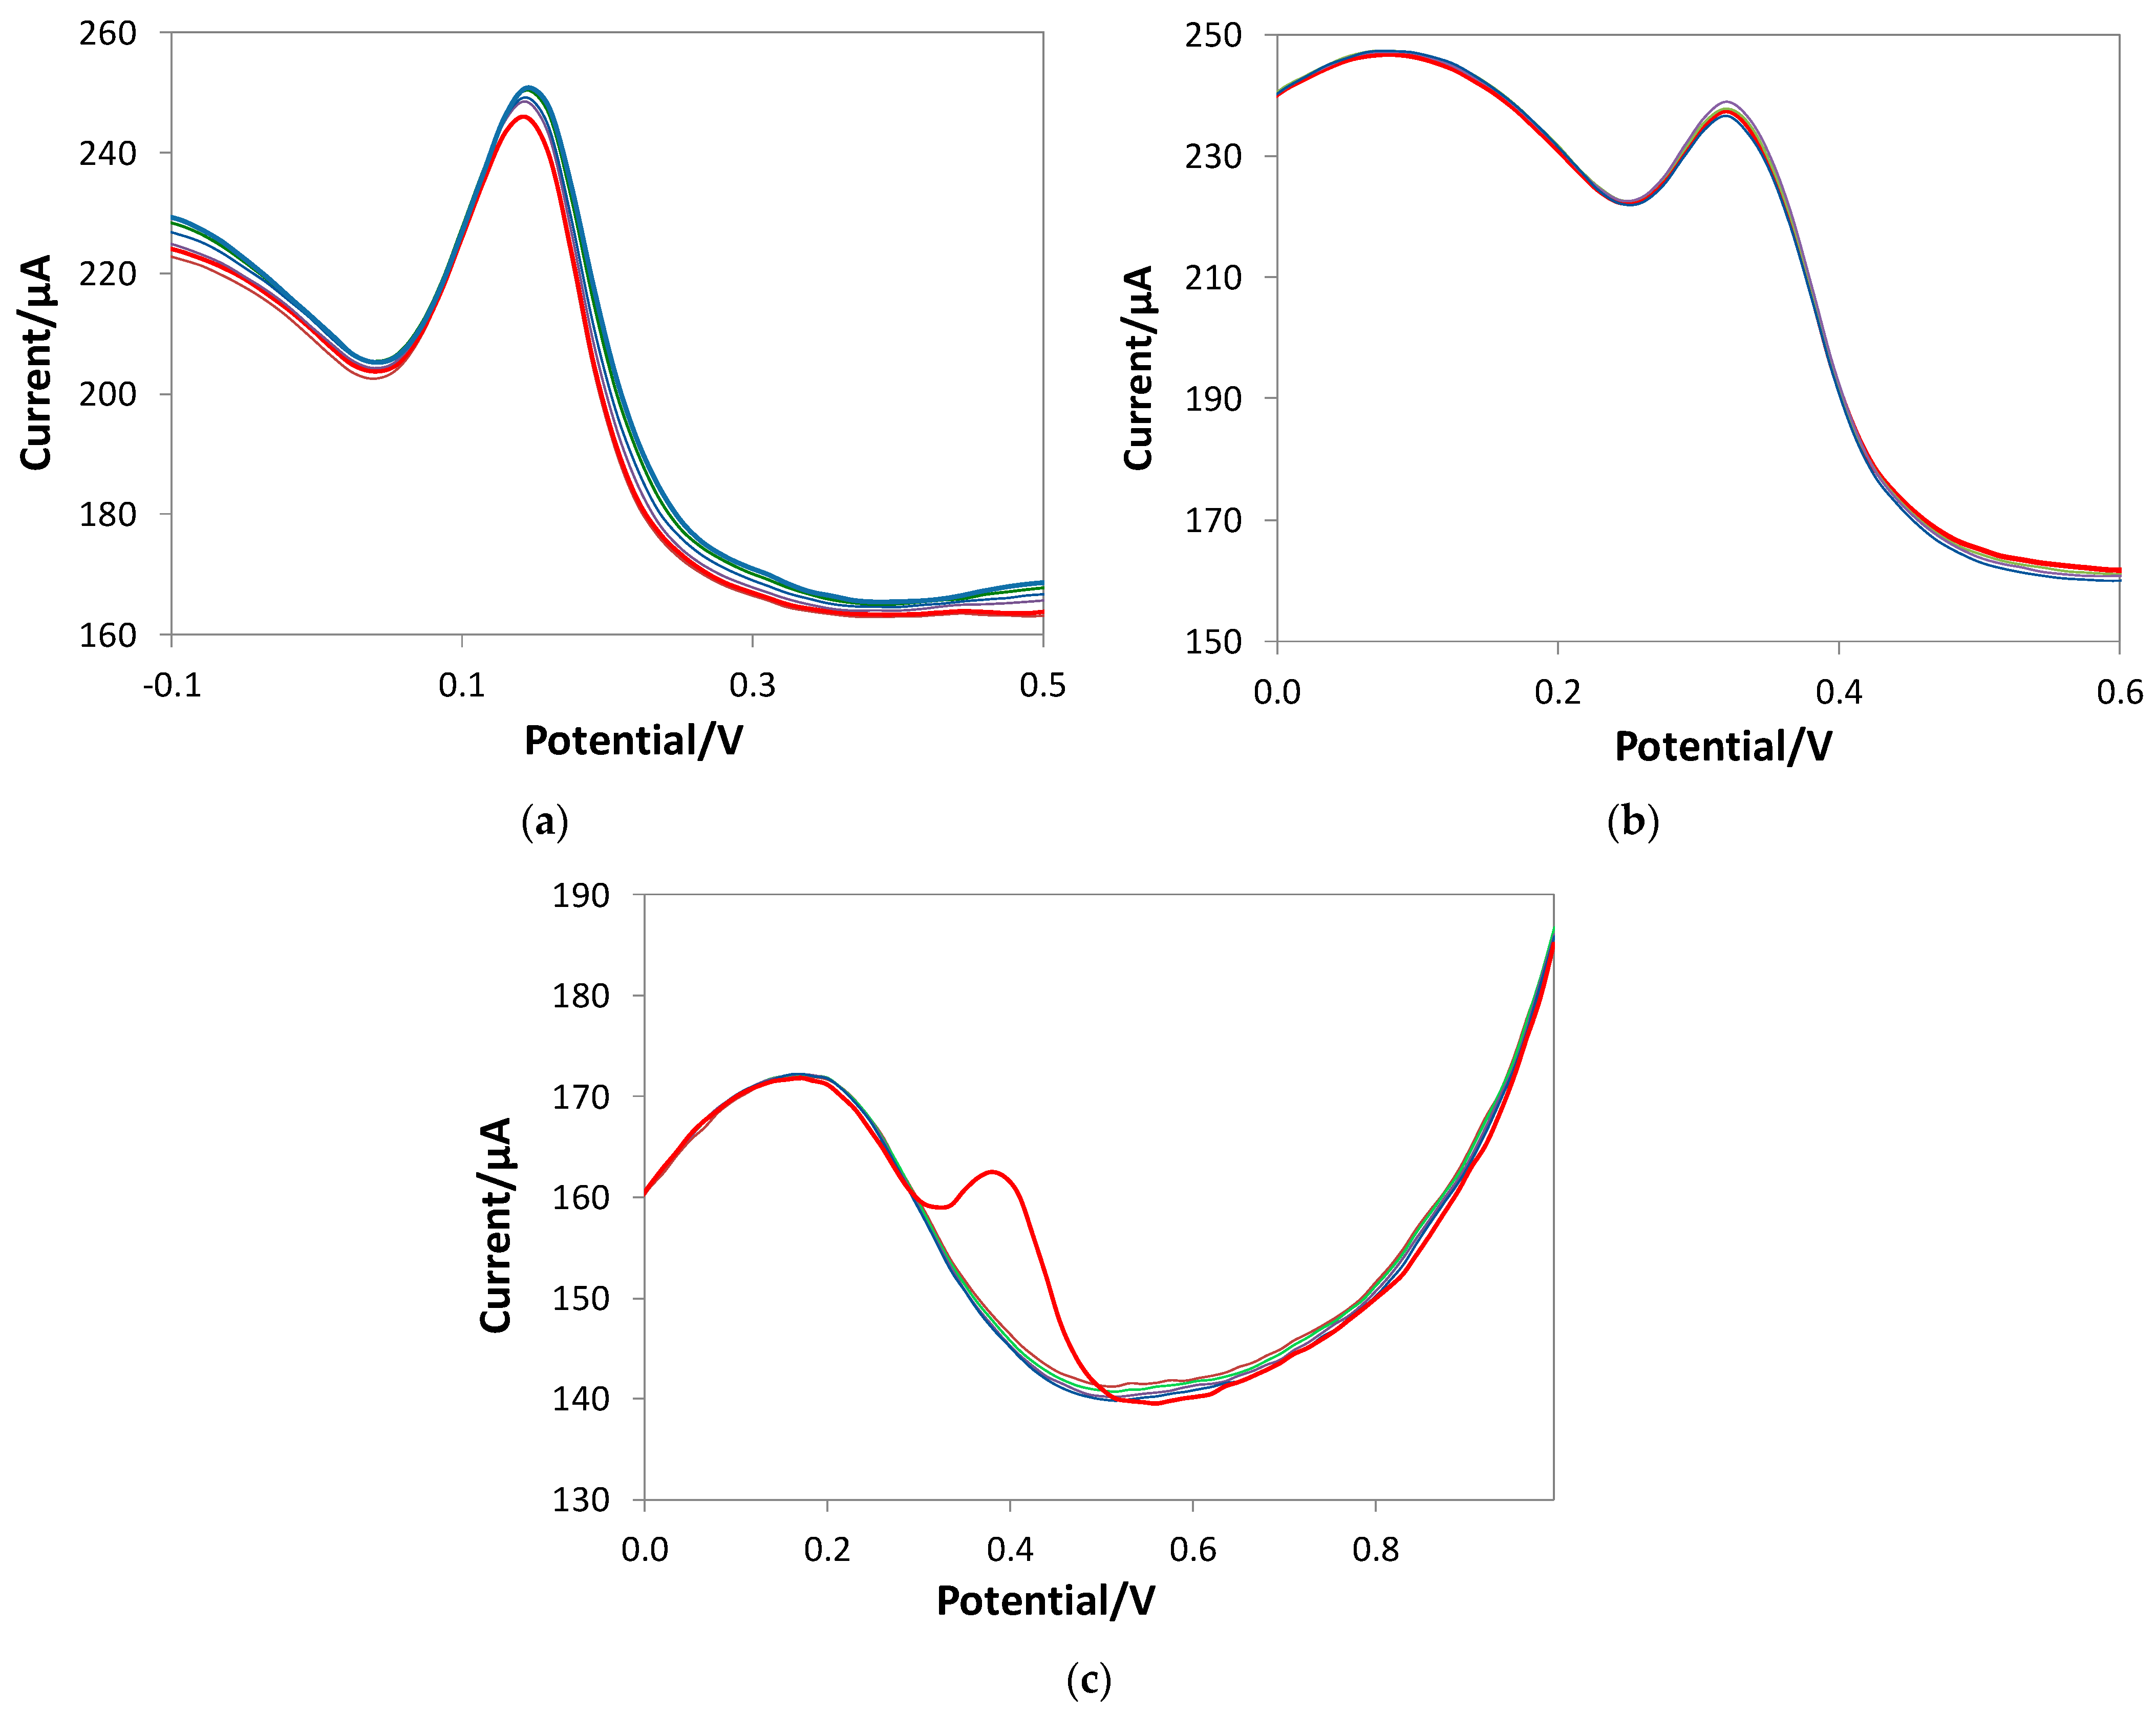
3.2. Characterization of the Gallic Acid Oxidation Reaction at the Bare and eMIP-Modified Electrodes

The electrochemical oxidation reaction of gallic acid was studied using the bare and eMIP-modified electrodes, both in LiClO4 0.1 M solution at a pH of 3 and hydro-alcoholic media containing LiClO4 0.1 M and 20% ethanol, to verify if the polymeric film or the presence of ethanol could affect the process. The effect of the pH was also evaluated only on the bare electrode in the pH range of 2–6; higher pH values were not considered since the polymerization of gallic acid occurs in these conditions, as previously reported [58,59].
Exhaustive coulometry (EC) was used to evaluate the number of electrons involved in the redox process. The electrode was immersed in 10 mL of 2.5 mM gallic acid solution; the potential was set to +0.7 V and kept fixed for two hours. From the obtained total charge quantity, i.e., 5.08 C, for 25 µmol of electrolyzed GA, it was found that the total number of electrons involved is equal to 2.1, which can be reasonably rounded to 2. It is necessary to observe that the first oxidation peak around + 0.25 V (in the aqueous medium) is the most intense and appreciable one from the CV measurements. The second oxidation peak, which is at more positive potentials (about + 0.6 V in the aqueous solution), is much less intense and is confused with background noise, especially for the measurements taken with the eMIP electrode. This peak is, therefore, unusable for quantitative analysis, as has also been reported by other authors [60]. The following mechanism (Figure 3) can thus be assumed, according to previously published works [60]:
Figure 4 shows the CV graphs obtained with the bare electrode at different pHs.
In Figure 4, the two irreversible waves were observed in the entire pH interval considered (2–6). By decreasing the solution’s acidity, a shift toward less positive potentials occurred for both CV waves, as already verified [59], and the second peak became less clear. Since the aim of the present study was the development of a sensor for GA determination in beverages whose pH is around 3, and also observing from Figure 4 that the higher current value for the first wave is obtained at a pH lower than 4, the following measurements were performed at a pH of 3.
Figure 5 reports the CV graph obtained with the bare and eMIP-modified electrodes in LiClO4 0.1 M solutions at a pH of 3, with and without ethanol (20%) and at different scan rates, to characterize the first step of the oxidation process (i.e., the peak corresponding to the first and well-defined CV wave). Table 3 summarizes the results.
The linearity of the plot Ep vs. log v suggested that the first stage of GA oxidation follows an EC mechanism, as previously reported [60,61]. The charge transfer coefficient αa is obtained from Equation (3). Acceptable αa values for compounds with irreversible behavior are between 0 and 1. Faster charge transfer processes are characterized by lower values of the charge transfer coefficient, and vice versa for slower charge transfer processes. The results are given in the first column of Table 3. Since the values of αa are all in the range of 0–1, irreversible behavior can be claimed. The values obtained with the bare electrode and the electrode coated with the eMIP are not significantly different, demonstrating that the polymer does not interfere with the electrochemical process. Even in the presence of ethanol, there is no significant change in the αa value.
For an irreversible process, the graph of Ep vs. the v intercept can be considered a rough estimate of the formal potential E0. The results are shown in Table 3 in the second column. Even in this case, the values obtained with the two electrodes do not differ significantly, as expected, since the eMIP cavities do not interfere with the electrochemical process but are a “preferential way” to access the analyte to the electrode surface. However, the value of E0 is almost double in the presence of ethanol, which means that the solvent hinders the process. Therefore, it is necessary to apply more positive potentials to cause the oxidation of gallic acid.
The diffusion coefficient D can be determined from the slope of the graph of I vs. v1/2 applied to Equation (2). The results are shown in Table 2 in the third column. The D values are not significantly different for the bare and eMIP electrodes; the presence of ethanol also does not substantially change the diffusion coefficient of the analyte to the electrode.
Applying Equation (4), the charge transfer kinetic constant k0 can be derived; the obtained values are given in Table 2 in the fourth column. Even in this case, the values are similar between the bare electrode and that modified with eMIP.

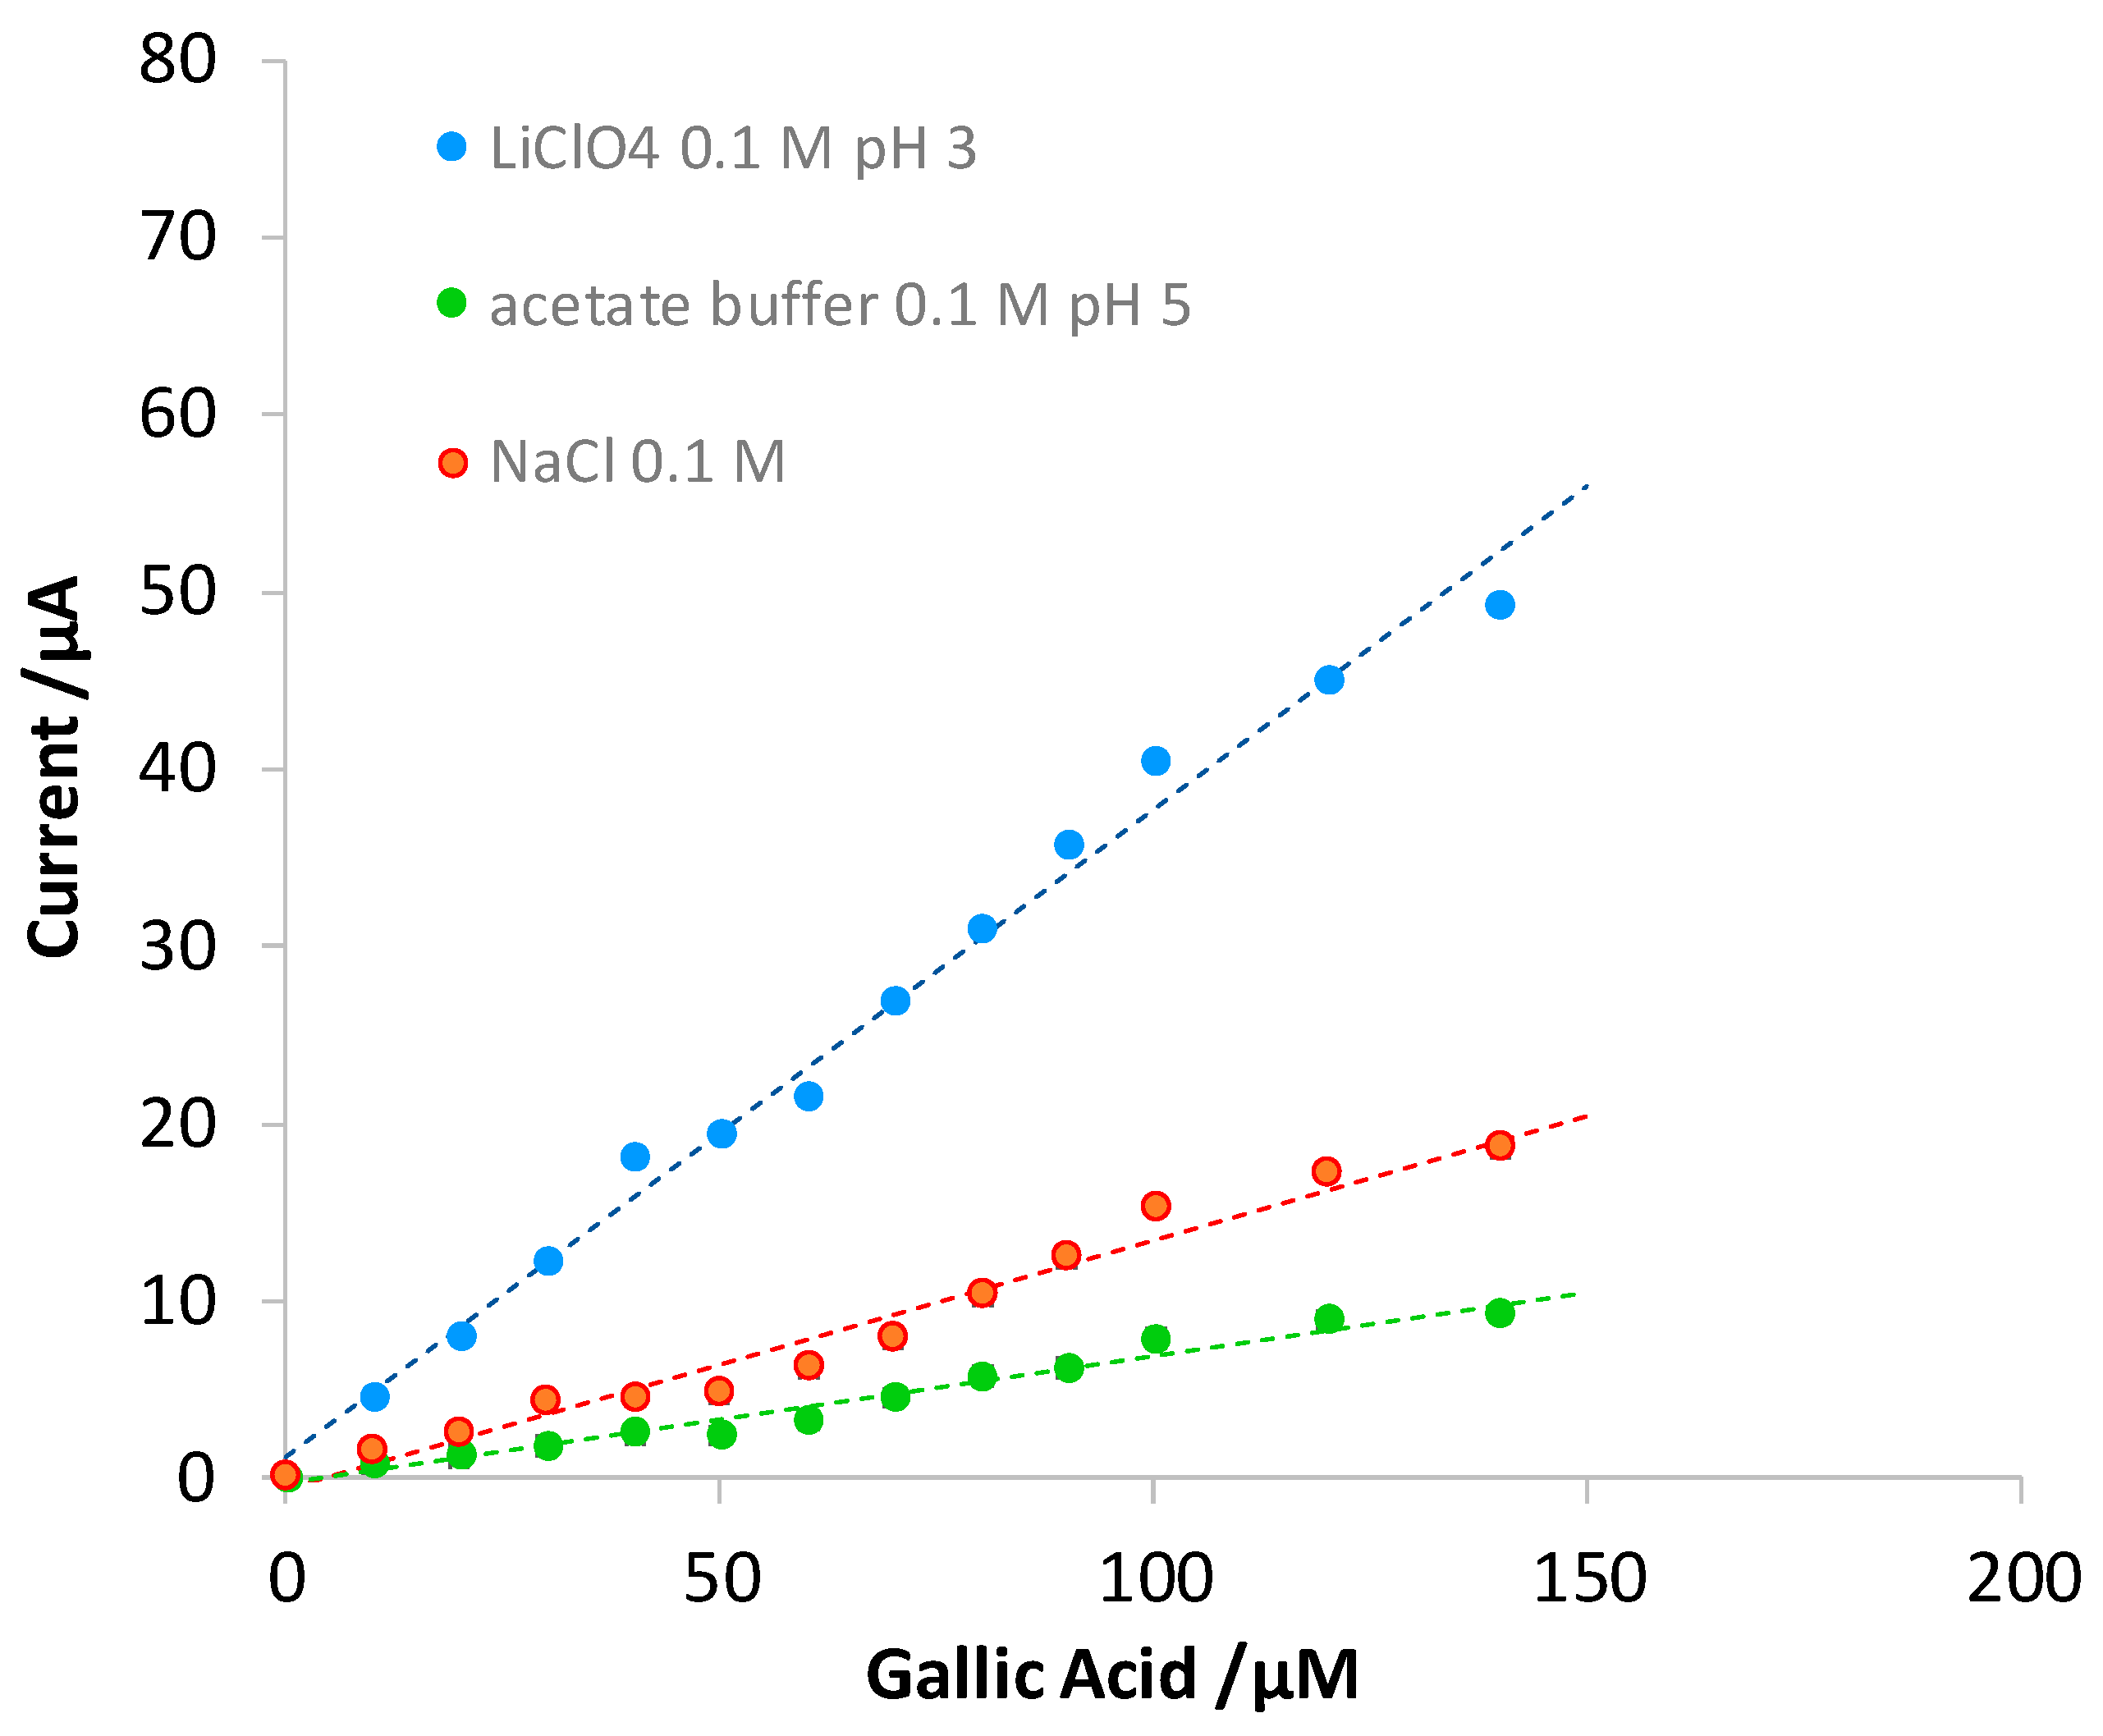
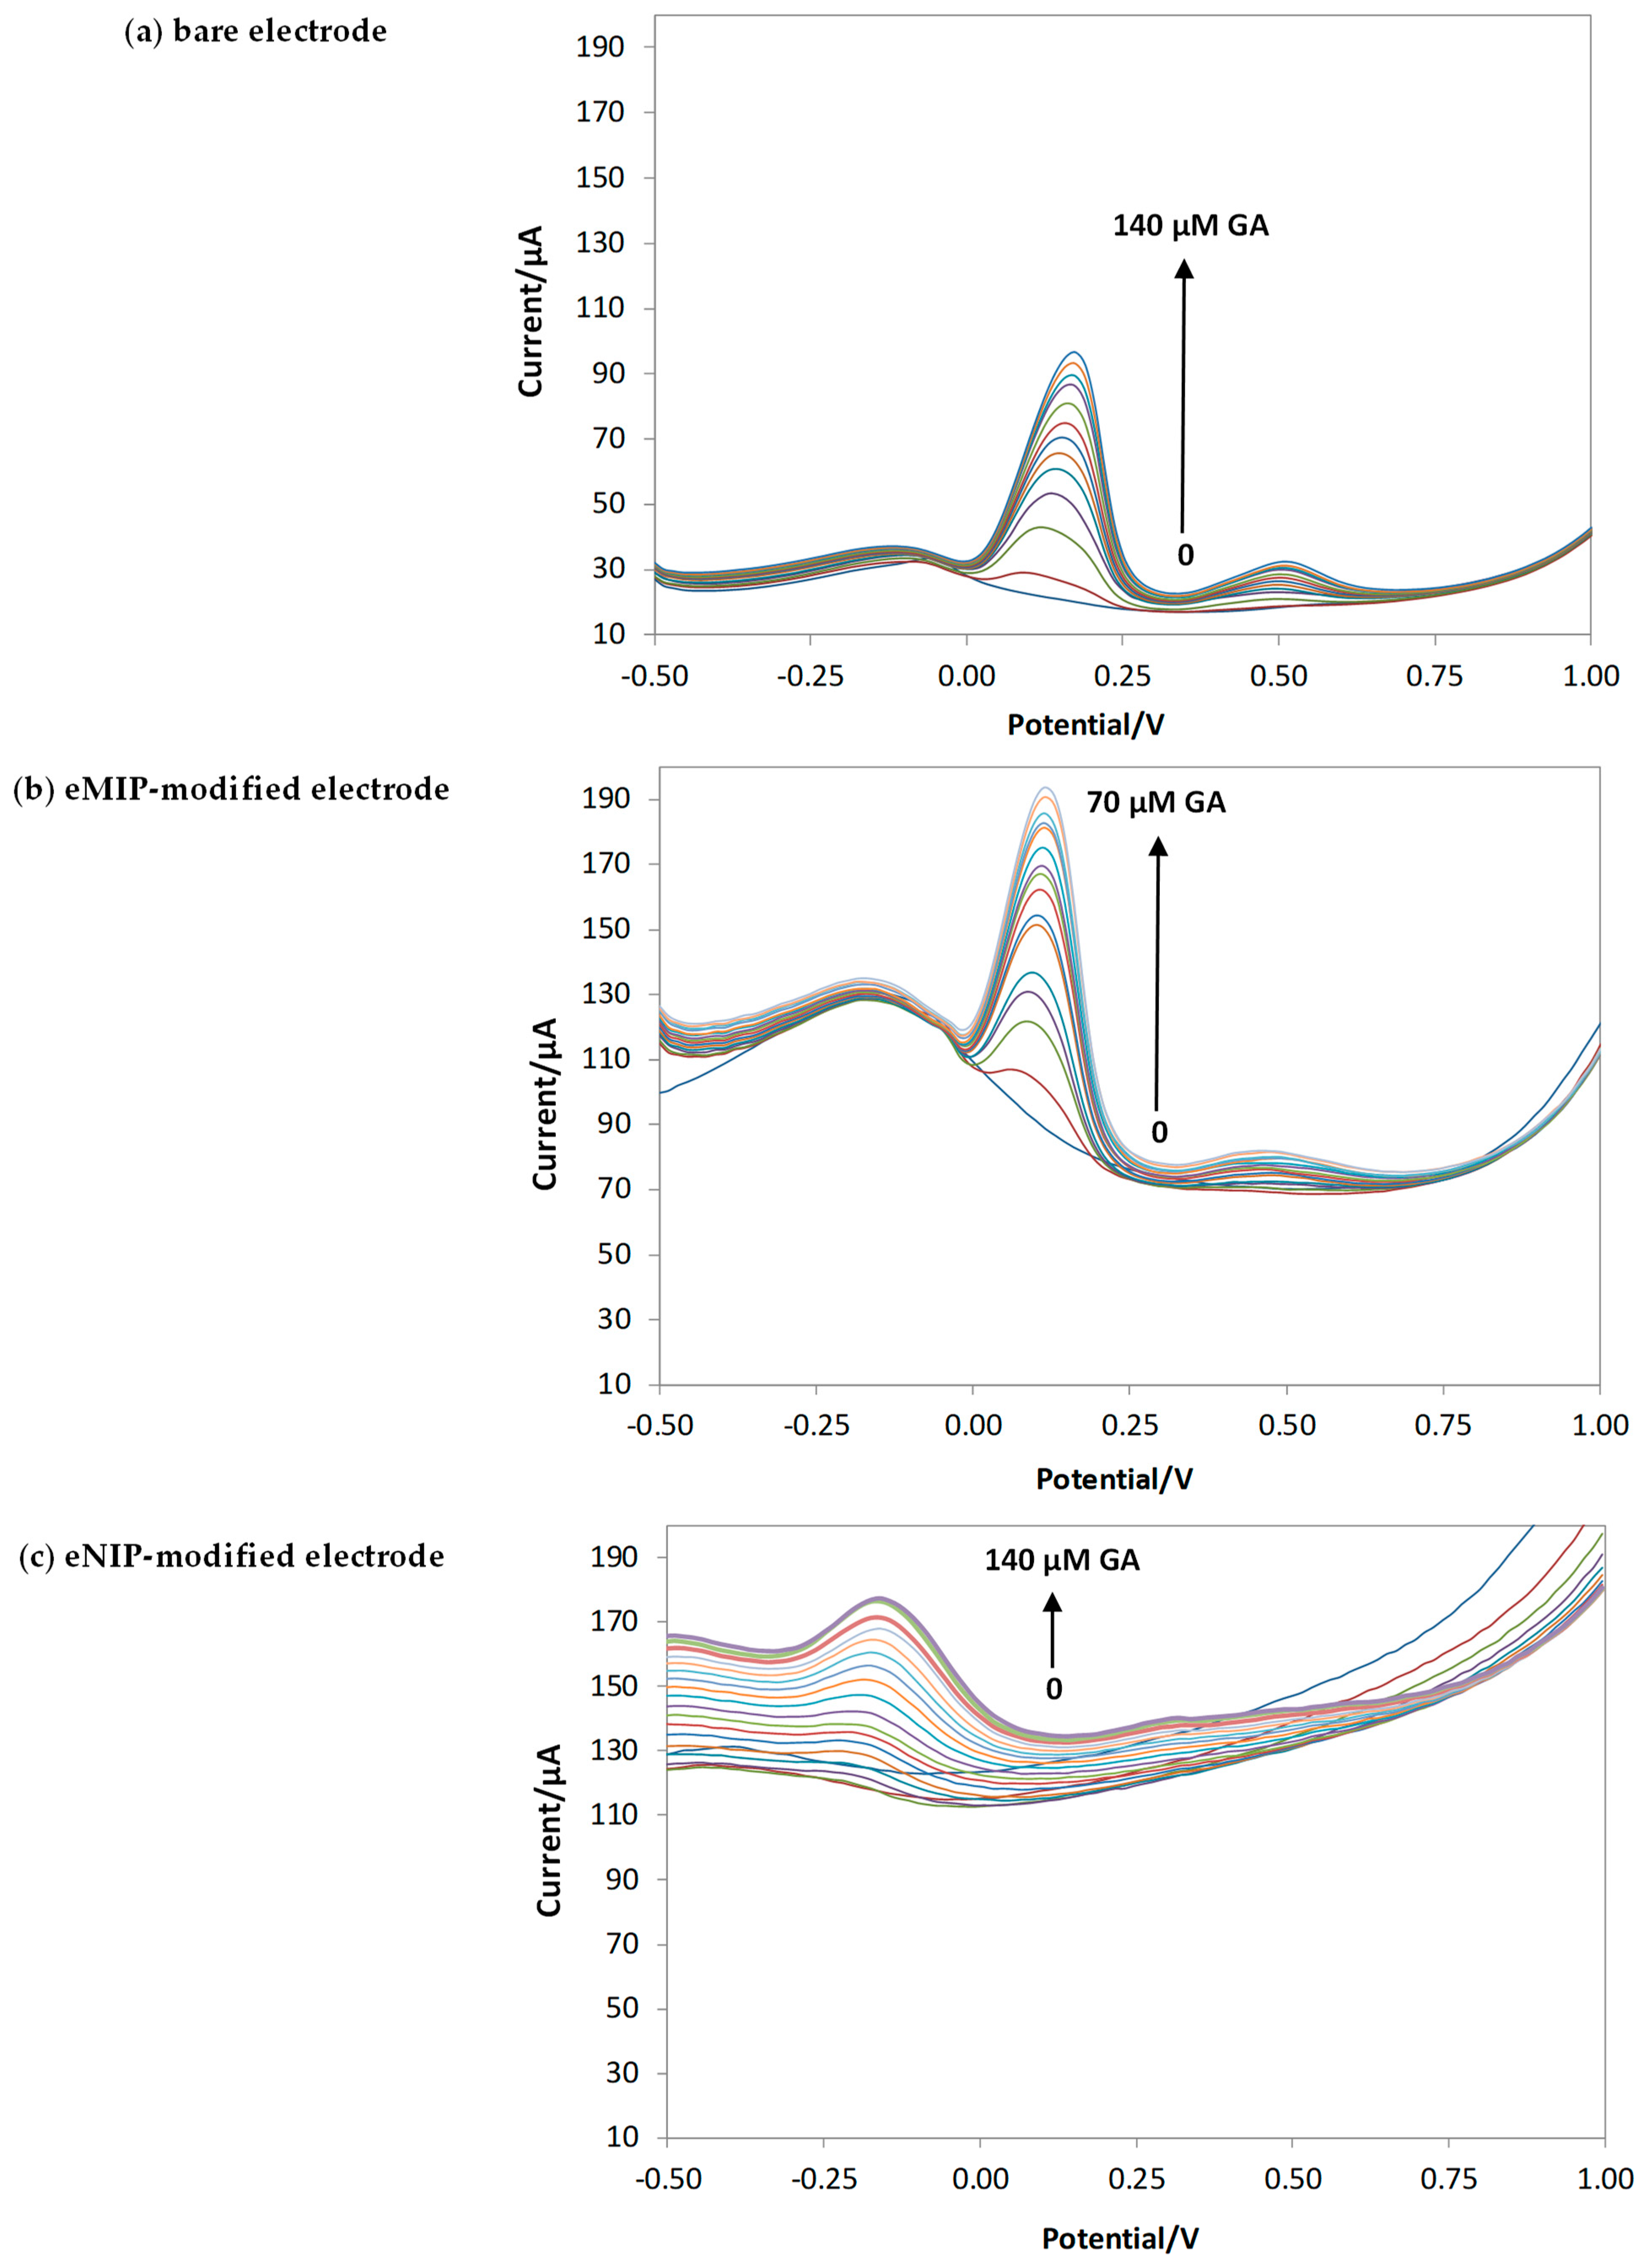
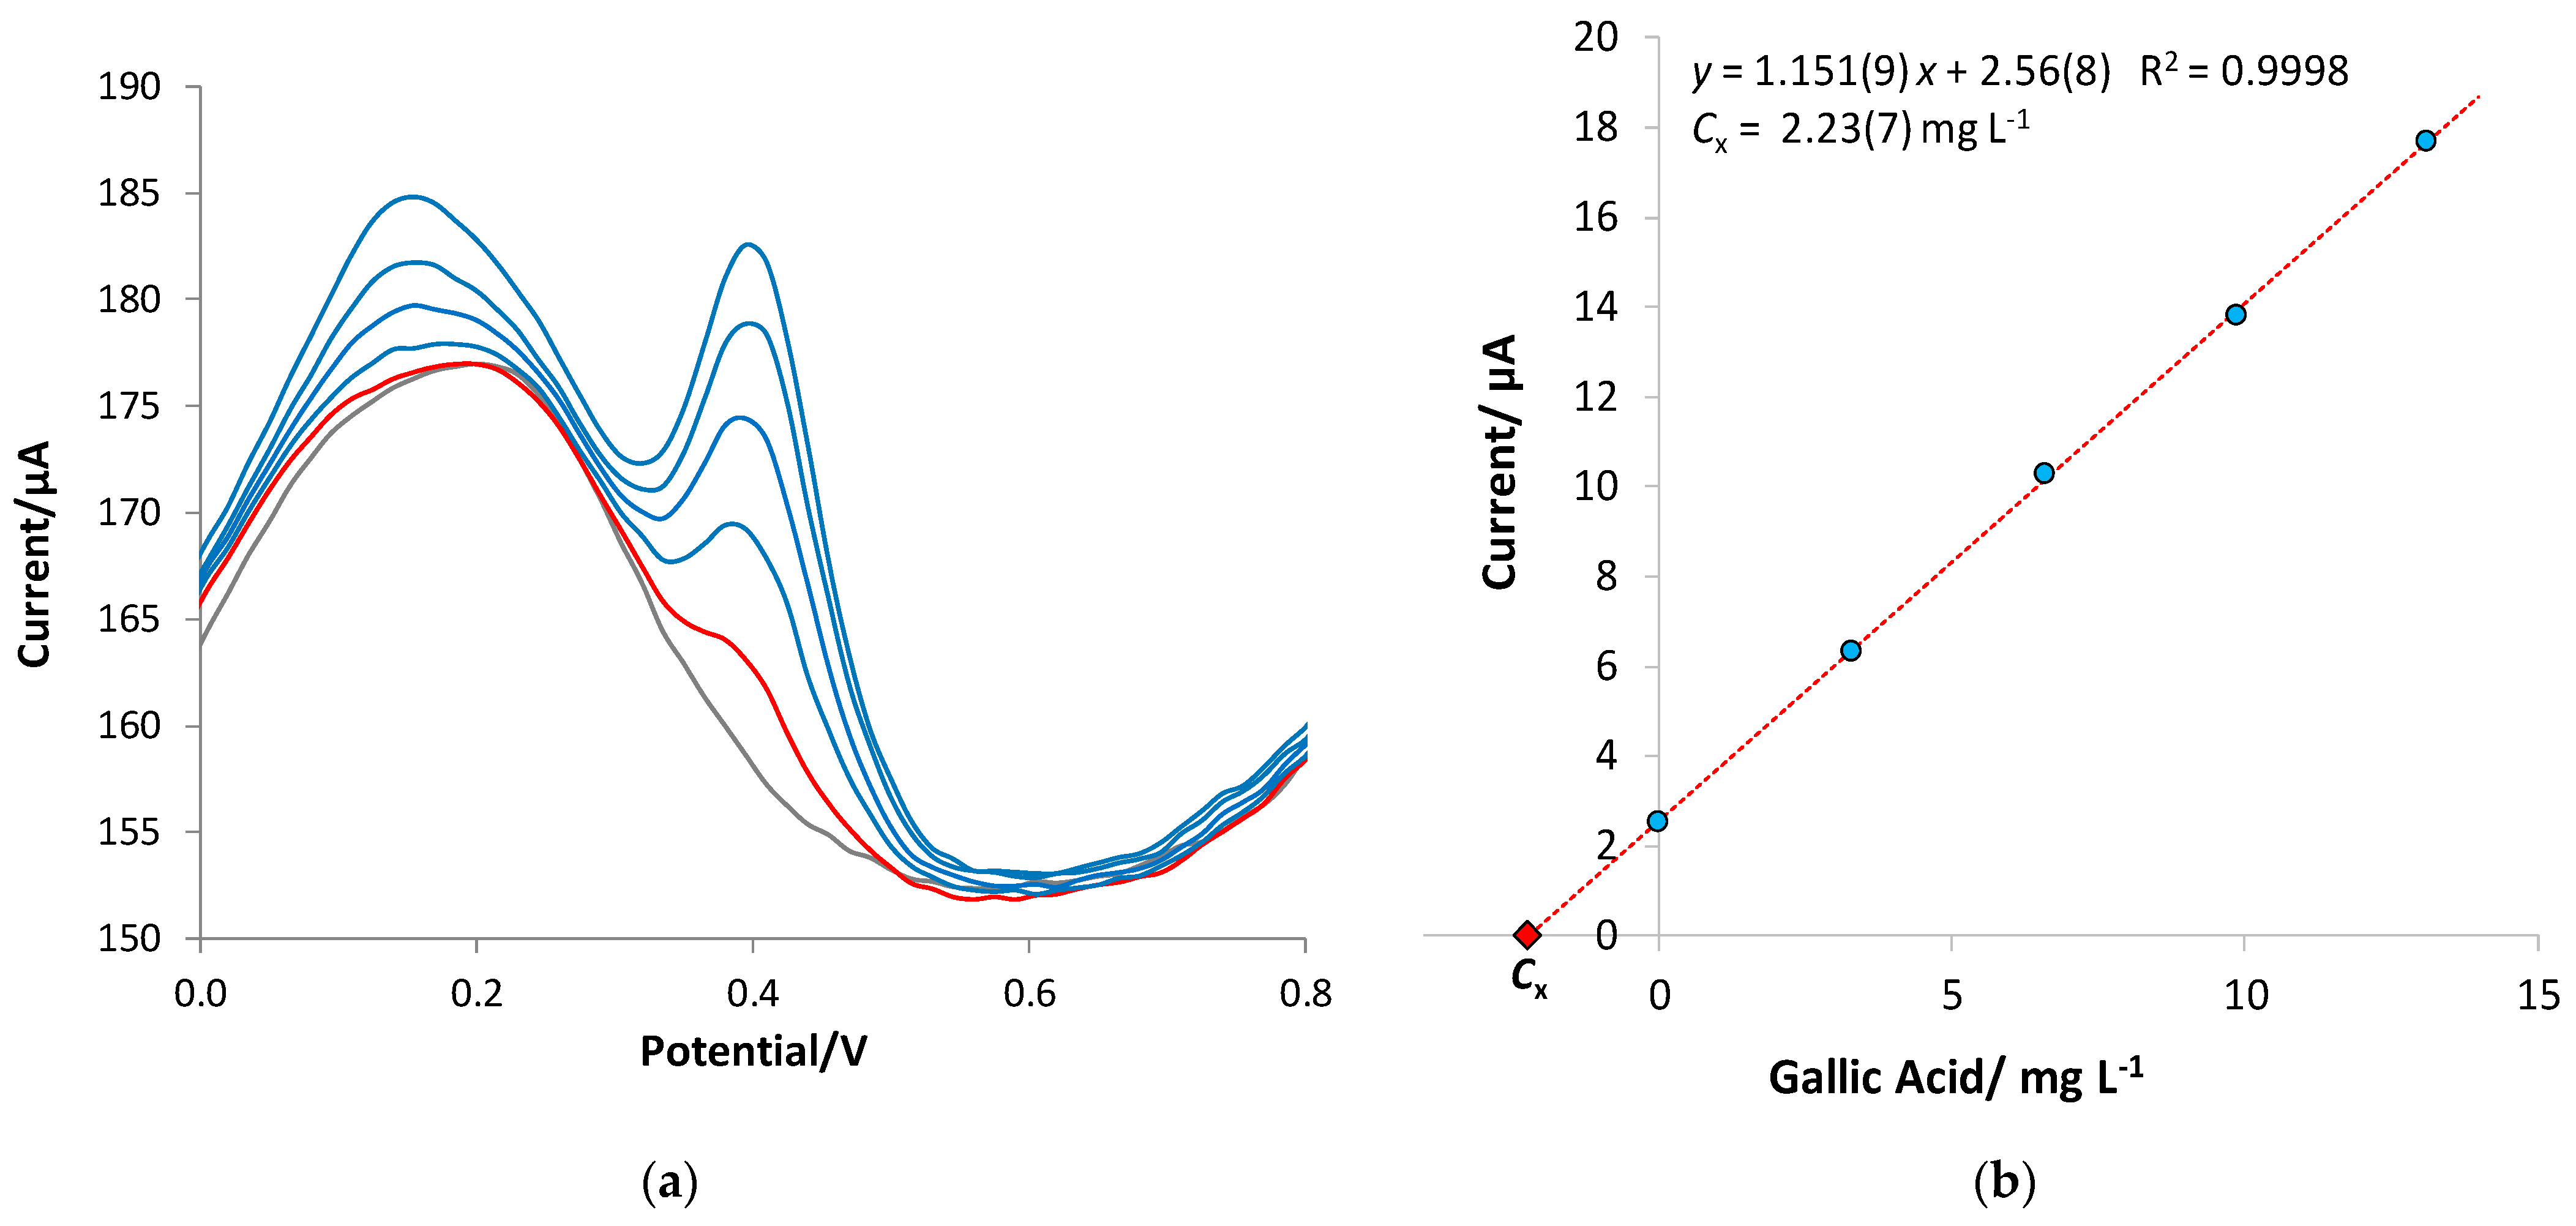
3.3. Quantitative Analysis of Gallic Acid by DPV

Preliminary tests were conducted to identify which ionic medium was the most suitable for developing the voltammetric method for the quantitative determination of gallic acid. Precisely, three different ionic media were compared: acetate buffer 0.1 M at a pH of 4, NaCl 0.1 M, and LiClO4 0.1 M. From the results, it was noted that the analysis is more sensitive when using LiClO4 0.1 M (see Figure 6); moreover, the sensitivity is not affected when acidifying the solution up to a pH of 3.5. It was therefore chosen to work with LiClO4 0.1 M at a pH of about 3–3.5 to simulate the wines’ acidity.
To assess the effect of the presence of ethanol on the DPV measurement both in terms of the shift in the peak potential and the value of the current intensity of the anodic peak, measurements were carried out in 0.2 mM gallic acid solution in LiClO4 0.1 M at a pH of 3 containing a percentage of ethanol ranging from 0 to 40%. The results obtained are summarized in the histograms of Figure 7.
The graphs of Figure 7 show that the presence of up to 10% ethanol in the solution does not affect either the potential or peak current. With the increase in the alcohol content, the peak potential progressively shifts, and the current is drastically reduced.
For this reason, it is crucial to quantify gallic acid in beverages, perform calibrations in the appropriate hydroalcoholic medium, and carry out standard addition methods. Since the recorded currents of 40% or more of ethanol are of very low intensity, the voltammetric method is expected to be applied only to beverages with a lower alcohol content; otherwise, a dilution of the sample is needed.
As stated before, the method for quantitative analysis is based on the direct measurement of the analyte using differential pulse voltammetry (DPV), using an oxidation peak at about +0.2 V.
Calibration curves were set up to evaluate the analytical method’s figures of merit (sensitivity, LOD, LOQ, and linear range), while the standard addition method was used to assess the gallic acid content in real samples.
Figure 8 shows the voltammograms obtained with bare electrodes and eMIP- and eNIP-modified electrodes and Figure 9 reports the calibration curves in the linear range (three replicates for each type of electrode).
Table 4 summarizes the calibration data (the equation of the straight lines) and the analytical method’s figures of merit for the three different electrodes (LOD, LOQ, and linear range).
From the slope of the calibration curve, the LOD and LOQ were computed by applying the following equations:
LOD = 3.3 · s y / x slope
LOQ = 10 · s y / x slope
where sy/x is the standard deviation of the y-residuals; this value can be assumed to be the same as the standard deviation of the replicate measurements of blank solutions [62].
The best sensitivity and the lowest LOD are obtained with the electrode modified with eMIP. The slope of the electrode modified with eNIP is much lower, which is desirable since, in this case, the electrode is covered by a polymer film with a low porosity that hinders the arrival of the analyte to the electrode’s surface.
The limit of quantification with the sensor modified by the eMIP equal to about 20 μM corresponds to a GA content of ~3 mg/L. This value affirms the validity of the method for the dosage of gallic acid in alcoholic and non-alcoholic beverages since the amount of GA is much higher in these matrices.
To evaluate the selectivity of the method based on the eMIP-modified sensor, tests were carried out considering three potential interferents: catechin as a different polyphenol, ascorbic acid, a substance used as an antioxidant for food and beverages, and 2-furaldehyde, an oily aldehyde with an aromatic smell and a bitter almond taste. The last molecule is one of the products made by toasting wooden barrels through the conversion of wood sugars and enters the wine during its aging process in the barrique. Catechin and ascorbic acid oxidize at potentials similar to those of gallic acid, while 2-furaldehyde is not electroactive in the potential range used (since it is reduced to a potential of about −0.4 V). Figure 10 shows the voltammograms obtained in solutions containing a fixed concentration of GA (the red line in the voltammograms) and increasing concentrations of the interferent.
The voltammograms obtained show that the eMIP-modified electrode is highly selective in the presence of electroactive and non-electroactive substances under the measurement’s operating conditions. In fact, as can be observed in Figure 10a,b, the addition of catechin or ascorbic acid after registering the voltammogram of gallic acid does not alter the position and the intensity of the peak signal; therefore, the presence of the eMIP film hinders the oxidation reaction of the interfering molecules. The effect of a non-electroactive compound, such as 2-furalhdeyde (Figure 10c), was also considered to verify that the eMIP cavities were not clogged by such molecules, preventing the oxidation of gallic acid. Even in this case, the sensor responded only after the addition of GA to a solution containing up to a ten-times-higher concentration of 2-furalhdeyde.
To test the feasibility of the eMIP-modified sensor to determine GA in real matrices, some examples of soft drinks (green tea) and alcoholic beverages (white wine, rosé wine, red wine, and marsala wine) were analyzed. The method of standard additions was used for the GA quantification of diluted portions of the samples, using hydroalcoholic solutions as a diluent with the % of ethanol equal to that declared on the product label (three replicates with different dilution ratios). For example, Figure 11 shows the voltammograms and corresponding standard addition graph for a red wine sample.
The total polyphenol content of the same drinks was evaluated using the Folin–Ciocalteau method (expressed as mg/L GAE, gallic acid equivalents).
Table 5 summarizes the results of the analyses and a comparison of our data with the data reported in the literature.
The amount of gallic acid found in all the samples examined is similar to the concentrations previously reported in the literature. The values are always lower than the content of total polyphenols. This experimental evidence further demonstrates the good selectivity of the sensor, which can discriminate the gallic acid from the other polyphenols present in the tested beverages. Obviously, the results must be compared with chromatographic methods such as HPLC-MS to corroborate the data. Only a few samples were analyzed, and we did not compare this technique with classical techniques. In fact, this is the first trial to test the method’s feasibility, and at this stage, we did not intend to proceed with validation.

4. Conclusions

In this work, a modified electrochemical sensor for the analysis of gallic acid in non-alcoholic and alcoholic beverages was developed and applied.
The sensor consists of a screen-printed cell for a voltammetric analysis in which the graphite ink working electrode was coated with a molecularly imprinted polymer film obtained by pyrrole electropolymerization in the presence of gallic acid as a template (eMIP). To obtain reproducible measurements with stable and low-intensity background currents, it was necessary to overoxidize the polymer film.
From the preliminary characterization of the electrochemical process, it has been observed that gallic acid irreversibly oxidizes to potentials of about +0.2 V, and the peak potential is not affected by the presence of eMIP film and alcohol percentages (ethanol) up to 10% by volume. Higher alcohol percentages lead to a shift in potential to more positive values and a decrease in current. Therefore, it was concluded that the application of the voltammetric technique for the analysis of alcoholic beverages requires quantification either by a matrix calibration or by the standard addition method. Furthermore, the method is ineffective for quantitative analyses in spirits with an ethanol content of 40% or more; in those cases, dilution of the sample is necessary.
The selected voltammetric method is differential pulse voltammetry (DPV).
We calculated the calibration data and the figures of merit of the analytical method, from which it was verified that the sensitivity of the eMIP-modified sensor is higher than that of the unmodified electrode (bare); moreover, the LOD obtained is sufficient to quantify gallic acid in non-alcoholic and alcoholic beverages.
The feasibility of the sensor’s application for the dosing of GA in real matrices was carried out by analyzing non-alcoholic and alcoholic beverages and comparing the results with those reported in the literature and with the content of total polyphenols determined by the Folin–Ciocalteau method. In all cases, a concentration of gallic acid in line with what was previously found in the literature for the beverages examined was determined, and the values were always lower for the content of total polyphenols. This first trial demonstrates the sensor has a pretty good selectivity and can discriminate the target molecule from other polyphenols present.

Author Contributions

Conceptualization, G.A.; methodology, G.A. and C.Z.; formal analysis, G.A. and C.Z.; investigation, L.V.D., A.C. and C.C.; data curation, G.A. and C.Z.; writing—original draft preparation, G.A.; writing—review and editing, C.Z., L.V.D., A.C. and C.C. All authors have read and agreed to the published version of the manuscript.

Funding

This research received no external funding.

Institutional Review Board Statement

Not applicable.

Data Availability Statement

Data are contained within the article.

Acknowledgments

We thank the Ministero dell’Università e della Ricerca (MUR) and the University of Pavia for their support through the program “Dipartimenti di Eccellenza 2023–2027”.

Conflicts of Interest

The authors declare no conflicts of interest.

References

  1. Brewer, M.S. Natural antioxidants: Sources, compounds, mechanisms of action, and potential applications. Compr. Rev. Food Sci. Food Saf. 2011, 10, 221–247. [Google Scholar] [CrossRef]
  2. Roidoung, S.; Dolan, K.D.; Siddiq, M. Gallic acid as a protective antioxidant against anthocyanin degradation and color loss in vitamin-C fortified cranberry juice. Food Chem. 2016, 210, 422–427. [Google Scholar] [CrossRef]
  3. Wang, L.; Halquist, M.S.; Sweet, D.H. Simultaneous determination of gallic acid and gentisic acid in organic anion transporter expressing cells by liquid chromatography–tandem mass spectrometry. J. Chromatogr. B 2013, 937, 91–96. [Google Scholar] [CrossRef]
  4. Koçak, Ç.C.; Karabiberoğlu, Ş.U.; Dursun, Z. Highly sensitive determination of gallic acid on poly (l-Methionine)-carbon nanotube composite electrode. J. Electroanal. Chem. 2019, 853, 113552. [Google Scholar] [CrossRef]
  5. Wang, Q.; Zhou, K.; Ning, Y.; Zhao, G. Effect of the structure of gallic acid and its derivatives on their interaction with plant ferritin. Food Chem. 2016, 213, 260–267. [Google Scholar] [CrossRef]
  6. Węgiel, J.; Burnat, B.; Skrzypek, S. A graphene oxide modified carbon ceramic electrode for voltammetric determination of gallic acid. Diam. Relat. Mater. 2018, 88, 137–143. [Google Scholar] [CrossRef]
  7. Ng, L.K.; Lafontaine, P.; Harnois, J. Gas chromatographic–mass spectrometric analysis of acids and phenols in distilled alcohol beverages. Application of anion-exchange disk extraction combined with in-vial elution and silylation. J. Chromatogr. A 2000, 873, 29–38. [Google Scholar] [CrossRef]
  8. Song, R.; Cheng, Y.; Tian, Y.; Zhang, Z.J. A validated solid-phase extraction HPLC method for the simultaneous determination of gallic acid, catechin and epicatechin in rhubarb decoction. Chin. J. Nat. Med. 2012, 10, 275–278. [Google Scholar] [CrossRef]
  9. Yue, M.E.; Jiang, T.F.; Shi, Y.P. Determination of gallic acid and salidroside in Rhodiola and its preparation by capillary electrophoresis. J. Anal. Chem. 2006, 61, 365–368. [Google Scholar] [CrossRef]
  10. Dmitrienko, S.G.; Medvedeva, O.M.; Ivanov, A.A.; Shpigun, O.A.; Zolotov, Y.A. Determination of gallic acid with 4-nitrobenzenediazonium tetrafluoroborate by diffuse reflectance spectrometry on polyurethane foam. Anal. Chim. Acta 2002, 469, 295–301. [Google Scholar] [CrossRef]
  11. Shah, S.N.A.; Li, H.; Lin, J.M. Enhancement of periodate-hydrogen peroxide chemiluminescence by nitrogen doped carbon dots and its application for the determination of pyrogallol and gallic acid. Talanta 2016, 153, 23–30. [Google Scholar] [CrossRef]
  12. Ermis, N.; Zare, N.; Darabi, R.; Alizadeh, M.; Karimi, F.; Singh, J.; Shahidi, S.A.; Dragoi, E.N.; Camarada, M.B.; Baghayeri, M. Recent advantage in electrochemical monitoring of gallic acid and kojic acid: A new perspective in food science. J. Food Meas. Charact. 2023, 17, 3644–3653. [Google Scholar] [CrossRef]
  13. Qin, F.; Hu, T.; You, L.; Chen, W.; Jia, D.; Hu, N.; Qi, W. Electrochemical detection of gallic acid in green tea using molecularly imprinted polymers on TiO2@ CNTs nanocomposite modified glassy carbon electrode. Int. J. Electrochem. Sci. 2022, 17, 220426. [Google Scholar] [CrossRef]
  14. Yang, T.; Zhang, Q.; Chen, T.; Wu, W.; Tang, X.; Wang, G.; Feng, J.; Zhang, W. Facile potentiometric sensing of gallic acid in edible plants based on molecularly imprinted polymer. J. Food Sci. 2020, 85, 2622–2628. [Google Scholar] [CrossRef]
  15. Shojaei, S.; Nasirizadeh, N.; Entezam, M.; Koosha, M.; Azimzadeh, M. An electrochemical nanosensor based on molecularly imprinted polymer (MIP) for detection of gallic acid in fruit juices. Food Anal. Method 2016, 9, 2721–2731. [Google Scholar] [CrossRef]
  16. Suresh, R.R.; Lakshmanakumar, M.; Arockia Jayalatha, J.B.B.; Rajan, K.S.; Sethuraman, S.; Krishnan, U.M.; Rayappan, J.B.B. Fabrication of screen-printed electrodes: Opportunities and challenges. J. Mater. Sci. 2021, 56, 8951–9006. [Google Scholar] [CrossRef]
  17. Li, M.; Li, Y.-T.; Li, D.-W.; Long, Y.-T. Recent developments and applications of screen-printed electrodes in environmental assays—A review. Anal. Chim. Acta 2012, 734, 31–44. [Google Scholar] [CrossRef] [PubMed]
  18. Renedo, O.D.; Alonso-Lomillo, M.A.; Martínez, M.A. Recent developments in the field of screen-printed electrodes and their related applications. Talanta 2007, 73, 202–219. [Google Scholar] [CrossRef]
  19. Haupt, K.; Linares, A.V.; Bompart, M.; Bui, B.T.S. Molecularly Imprinted Polymers. In Topics in Current Chemistry; Springer: Berlin/Heidelberg, Germany, 2011; Volume 325, pp. 1–28. [Google Scholar]
  20. Beltran, A.; Borrull, F.; Marcé-Recasens, R.M.; Cormack, P. Molecularly-imprinted polymers: Useful sorbents for selective extractions. TrAC Trends Anal. Chem. 2010, 29, 1363–1375. [Google Scholar] [CrossRef]
  21. Alexander, C.; Andersson, H.; Andersson, L.I.; Ansell, R.J.; Kirsch, N.; Nicholls, I.A.; O’Mahony, J.; Whitcombe, M.J. Molecular imprinting science and technology: A survey of the literature for the years up to and including 2003. J. Mol. Recognit. 2006, 19, 106–180. [Google Scholar]
  22. Kupai, J.; Razali, M.; Buyuktiryaki, S.; Kecili, R.; Szekely, G. Long-term stability and reusability of molecularly imprinted polymers. Polym. Chem. 2016, 8, 666–673. [Google Scholar] [CrossRef] [PubMed]
  23. Kadhem, A.J.; Gentile, G.J.; Fidalgo de Cortalezzi, M.M. Molecularly Imprinted Polymers (MIPs) in Sensors for Environmental and Biomedical Applications: A Review. Molecules 2021, 26, 6233. [Google Scholar] [CrossRef] [PubMed]
  24. Chen, L.; Wang, X.; Lu, W.; Wu, X.; Li, J. Molecular imprinting: Perspectives and applications. Chem. Soc. Rev. 2016, 45, 2137–2211. [Google Scholar] [CrossRef] [PubMed]
  25. Leibl, N.; Haupt, K.; Gonzato, C.; Duma, L. Molecularly Imprinted Polymers for Chemical Sensing: A Tutorial Review. Chemosensors 2021, 9, 123. [Google Scholar] [CrossRef]
  26. Prasad, B.B.; Pandey, I.; Srivastava, A.; Kumar, D.; Tiwari, M.P. Multiwalled carbon nanotubes-based pencil graphite electrode modified with an electrosynthesized molecularly imprinted nanofilm for electrochemical sensing of methionine enantiomers. Sens. Actuators B Chem. 2013, 176, 863–874. [Google Scholar] [CrossRef]
  27. Cabral-Miranda, G.; Gidlund, M.; Sales, M.G.F. Backside-surface imprinting as a new strategy to generate specific plastic antibody materials. J. Mater. Chem. B 2014, 2, 3087–3095. [Google Scholar] [CrossRef] [PubMed]
  28. Moreira, F.T.; Sharma, S.; Dutra, R.A.; Noronha, J.P.; Cass, A.E.; Sales, M.G.F. Protein-responsive polymers for point-of-care detection of cardiac biomarker. Sens. Actuators B Chem. 2014, 196, 123–132. [Google Scholar] [CrossRef]
  29. Pacheco, J.P.G.; Silva, M.S.V.; Freitas, M.; Nouws, H.P.A.; Delerue-Matos, C. Molecularly imprinted electrochemical sensor for the point-of-care detection of a breast cancer biomarker (CA 15-3). Sens. Actuators B Chem. 2018, 256, 905–912. [Google Scholar] [CrossRef]
  30. Rebelo, P.; Costa-Rama, E.; Seguro, I.; Pacheco, J.G.; Nouws, H.P.A.; Cordeiro, M.N.D.S.; Delerue-Matos, C. Molecularly imprinted polymer-based electrochemical sensors for environmental analysis. Biosens. Bioelectron. 2021, 172, 112719. [Google Scholar] [CrossRef]
  31. Lopes, F.; Pacheco, J.; Rebelo, P.; Delerue-Matos, C. Molecularly imprinted electrochemical sensor prepared on a screen printed carbon electrode for naloxone detection. Sens. Actuators B Chem. 2017, 243, 745–752. [Google Scholar] [CrossRef]
  32. Seguro, I.; Rebelo, P.; Pacheco, J.G.; Delerue-Matos, C. Electropolymerized, Molecularly Imprinted Polymer on a Screen-Printed Electrode—A Simple, Fast, and Disposable Voltammetric Sensor for Trazodone. Sensors 2022, 22, 2819. [Google Scholar] [CrossRef]
  33. Couto, R.A.; Mounssef, B., Jr.; Carvalho, F.; Rodrigues, C.M.; Braga, A.A.; Aldous, L.; Gonçalves, L.M.; Quinaz, M.B. Methylone screening with electropolymerized molecularly imprinted polymer on screen-printed electrodes. Sens. Actuators B Chem. 2020, 316, 128133. [Google Scholar] [CrossRef]
  34. Rebelo, P.; Pacheco, J.G.; Voroshylova, I.V.; Melo, A.; Cordeiro, M.N.D.; Delerue-Matos, C. A simple electrochemical detection of atorvastatin based on disposable screen-printed carbon electrodes modified by molecularly imprinted polymer: Experiment and simulation. Anal. Chim. Acta 2022, 1194, 339410. [Google Scholar] [CrossRef]
  35. Gonçalves, L.M. Electropolymerized molecularly imprinted polymers: Perceptions based on recent literature for soon-to-be world-class scientists. Curr. Opin. Electrochem. 2021, 25, 100640. [Google Scholar] [CrossRef]
  36. Crapnell, R.D.; Hudson, A.; Foster, C.W.; Eersels, K.; Grinsven, B.v.; Cleij, T.J.; Banks, C.E.; Peeters, M. Recent Advances in Electrosynthesized Molecularly Imprinted Polymer Sensing Platforms for Bioanalyte Detection. Sensors 2019, 19, 1204. [Google Scholar] [CrossRef]
  37. Unger, C.; Lieberzeit, P.A. Molecularly imprinted thin film surfaces in sensing: Chances and challenges. React. Funct. Polym. 2021, 161, 104855. [Google Scholar] [CrossRef]
  38. Ramanavičius, S.; Morkvėnaitė-Vilkončienė, I.; Samukaitė-Bubnienė, U.; Ratautaitė, V.; Plikusienė, I.; Viter, R.; Ramanavičius, A. Electrochemically Deposited Molecularly Imprinted Polymer-Based Sensors. Sensors 2022, 22, 1282. [Google Scholar] [CrossRef] [PubMed]
  39. Ramanavicius, S.; Ramanavicius, A. Charge transfer and biocompatibility aspects in conducting polymer-based enzymatic biosensors and biofuel cells. Nanomaterials 2021, 11, 371. [Google Scholar] [CrossRef] [PubMed]
  40. Sadki, S.; Schottland, P.; Brodie, N.; Sabouraud, G. The mechanisms of pyrrole electropolymerization. Chem. Soc. Rev. 2000, 29, 12. [Google Scholar]
  41. Burak, D.; Emregul, E.; Emregul, K.C. Copper–zinc alloy nanoparticle based enzyme-free superoxide radical sensing on a screen-printed electrode. Talanta 2015, 134, 206–214. [Google Scholar]
  42. Pesavento, M.; Merli, D.; Biesuz, R.; Alberti, G.; Marchetti, S.; Milanese, C. A MIP-based low-cost electrochemical sensor for 2-furaldehyde detection in beverages. Anal. Chim. Acta 2021, 1142, 201–210. [Google Scholar] [CrossRef] [PubMed]
  43. Pesavento, M.; D’Agostino, G.; Alberti, G.; Biesuz, R.; Merli, D. Voltammetric platform for detection of 2,4,6-trinitrotoluene based on a molecularly imprinted polymer. Anal. Bioanal. Chem. 2013, 405, 3559–3570. [Google Scholar] [CrossRef]
  44. Akhoundian, M.; Alizadeh, T.; Ganjali, M.R.; Rafiei, F. A new carbon paste electrode modified with MWCNTs and nano-structured molecularly imprinted polymer for ultratrace determination of trimipramine: The crucial effect of electrode components mixing on its performance. Biosens. Bioelectron. 2018, 111, 27–33. [Google Scholar] [CrossRef] [PubMed]
  45. Magar, H.S.; Hassan, R.Y.A.; Mulchandani, A. Electrochemical Impedance Spectroscopy (EIS): Principles, Construction, and Biosensing Applications. Sensors 2021, 21, 6578. [Google Scholar] [CrossRef] [PubMed]
  46. Craven, J.E.; Kinnamon, D.S.; Prasad, S. Randles Circuit Analysis Toward Investigating Interfacial Effects on Microchannel Electrodes. IEEE Sens. Lett. 2018, 2, 15–18. [Google Scholar] [CrossRef]
  47. Koç, Y.; Morali, U.; Erol, S.; Avci, H. Investigation of electrochemical behavior of potassium ferricyanide/ferrocyanide redox probes on screen printed carbon electrode through cyclic voltammetry and electrochemical impedance spectroscopy. Turkish J. Chem. 2021, 45, 1895–1915. [Google Scholar]
  48. Milanesi, C.; Protti, S.; Chiodi, D.; Profumo, A.; Merli, D. Electrochemical characterization and voltammetric determination of aryl piperazine emerging as designer drugs. J. Electroanal. Chem. 2021, 895, 115480. [Google Scholar] [CrossRef]
  49. Capucciati, A.; Burato, A.; Bersani, C.; Protti, S.; Profumo, A.; Merli, D. Electrochemical Behavior and Voltammetric Determination of Two Synthetic Aroyl Amides Opioids. Chemosensors 2023, 11, 198. [Google Scholar] [CrossRef]
  50. Merli, D.; Lio, E.; Protti, S.; Coccia, R.; Profumo, A.; Alberti, G. Molecularly Imprinted Polymer-based voltammetric sensor for amino acids/indazole derivatives synthetic cannabinoids detection. Anal. Chim. Acta 2024, 1288C, 342151. [Google Scholar] [CrossRef]
  51. Bard, A.J.; Faulkner, L.R. Electrochemical Methods: Fundamentals and Applications; Wiley: New York, NY, USA, 1980. [Google Scholar]
  52. Yunhua, W.; Xiaobo, J.; Shengshui, H. Studies on electrochemical oxidation of azithromycin and its interactions with bovine serum albumin. Bioelectrochemistry 2004, 64, 91–97. [Google Scholar]
  53. Guidelli, R.; Compton, R.G.; Feliu, J.M.; Gileadi, E.; Lipkowski, J.; Schmickler, W.; Trasatti, S. Defining the transfer coefficient in electrochemistry: An assessment (IUPAC Technical Report). Pure Appl. Chem. 2014, 86, 245–258. [Google Scholar] [CrossRef]
  54. Mizoguchi, T.; Adams, R.N. Anodic Oxidation Studies of N,N-Dimethylaniline. I. Voltammetric and Spectroscopic Investigations at Platinum Electrodes. J. Am. Chem. Soc. 1962, 84, 2058–2061. [Google Scholar] [CrossRef]
  55. Araújo, S.; Arantes, C.; Faria, V.; Souza, A.O.; Pimentel, M.; Barbosa, L.; Richter, M.; Munoz, A.A.; dos Santos, T.P. Electrochemistry of 5F-MDMB-PICA synthetic cannabinoid using a borondoped diamond electrode with short anodic-cathodic pretreatment: A simple screening method for application in forensic analysis. Electrochim. Acta 2023, 454, 142356. [Google Scholar] [CrossRef]
  56. Ding, S.; Lyu, Z.; Li, S.; Ruan, X.; Fei, M.; Zhou, Y.; Niu, X.; Zhu, W.; Du, D.; Lin, Y. Molecularly imprinted polypyrrole nanotubes based electrochemical sensor for glyphosate detection. Biosens. Bioelectron. 2021, 191, 113434. [Google Scholar] [CrossRef] [PubMed]
  57. Maouche, N.; Guergouri, M.; Gam-Derouich, S.; Jouini, M.; Nessark, B.; Chehimi, M.M. Molecularly imprinted polypyrrole films: Some key parameters for electrochemical picomolar detection of dopamine. J. Electroanal. Chem. 2012, 685, 21–27. [Google Scholar] [CrossRef]
  58. Christensen, P.A.; Hamnett, A. In situ spectroscopic investigations of the growth, electrochemical cycling and overoxidation of polypyrrole in aqueous solution. Electrochim. Acta 1991, 36, 1263–1286. [Google Scholar] [CrossRef]
  59. Tóth, I.Y.; Szekeres, M.; Turcu, R.; Sáringer, S.; Illés, E.; Nesztor, D.; Tombácz, E. Mechanism of in situ surface polymerization of gallic acid in an environmental-inspired preparation of carboxylated core–shell magnetite nanoparticles. Langmuir 2014, 30, 15451–15461. [Google Scholar] [CrossRef]
  60. Abdel-Hamid, R.; Newair, E.F. Electrochemical behavior of antioxidants: I. Mechanistic study on electrochemical oxidation of gallic acid in aqueous solutions at glassy-carbon electrode. J. Electroanal. Chem. 2011, 657, 107–112. [Google Scholar] [CrossRef]
  61. Falahi, S.; Falahi, S.; Zarejousheghani, M.; Ehrlich, H.; Joseph, Y.; Rahimi, P. Electrochemical Sensing of Gallic Acid in Beverages Using a 3D Bio-Nanocomposite Based on Carbon Nanotubes/Spongin-Atacamite. Biosensors 2023, 13, 262. [Google Scholar] [CrossRef]
  62. Miller, J.N.; Miller, J.C. Calibration methods in instrumental analysis: Regression and correlation. In Statistics and Chemometrics for Analytical Chemistry, 6th ed.; Pearson Education Limited: Harlow Essex, UK, 2010; pp. 124–126. [Google Scholar]
  63. Clarke, S.; Bosman, G.; du Toit, W.; Aleixandre-Tudo, J.L. White wine phenolics: Current methods of analysis. J. Sci. Food Agric. 2023, 103, 7–25. [Google Scholar] [CrossRef]
  64. Vilasi, F.; La Torre, G.L.; Dugo, G.; Pellicanò, T.M. Contenuto di antiossidanti e tecniche colturali e di allevamento della vite. Enol.-Milano 2008, 44, 109. [Google Scholar]
  65. Dugo, G.; Giuffrida, D.; Magnisi, R.; Vilasi, F.; Pellicanò, T.M.; La Torre, G.L. Determinazione HPLC/MS di composti antiossidanti in vini siciliani da dessert. Enologo-Milano 2004, 40, 89–94. [Google Scholar]
  66. Lin, J.K.; Lin, C.L.; Liang, Y.C.; Lin-Shiau, S.Y.; Juan, I.M. Survey of catechins, gallic acid, and methylxanthines in green, oolong, pu-erh, and black teas. J. Agric. Food Chem. 1998, 46, 3635–3642. [Google Scholar] [CrossRef]
Figure 1. Scheme of the possible interaction mechanism between GA and overoxidate polypyrrole.
Polymers 16 01076 g001
Figure 2. Nyquist plot and Randles equivalent circuit of the bare electrode, eMIP-modified electrode after template removal, eMIP-modified electrode before the template removal, and eNIP-modified electrode. Measurements in 0.1 M KCl/0.05 M K3Fe(CN)6 electrochemical probe solution.
Polymers 16 01076 g002
Figure 3. The electrochemical oxidation reaction of gallic acid. (Reproduced with permission from [60], open access Creative Common CC license 4.0, MDPI).
Polymers 16 01076 g003
Figure 4. CV registered with the bare electrode in 2.5 mM GA solutions at different pH values. (blue line) LiClO4 0.1 M acidified at pH of 2.14; (red line) LiClO4 0.1 M acidified at pH of 3.08; (green line) LiClO4 0.1 M acidified at pH of 4.03; (violet line) acetate buffer 0.1 M at pH of 4.50; (yellow line) acetate buffer at pH of 5.50; (black line) dihydrogen phosphate 0.1 M at pH of 5.98.
Polymers 16 01076 g004
Figure 5. CV registered in 2.5 mM GA solutions at different scan rates (from 0.01 to 2 V/s). (a) Bare electrode in LiClO4 0.1 M at pH of 3; (b) eMIP-modified electrode in LiClO4 0.1 M at pH of 3; (c) bare electrode in LiClO4 0.1 M at pH of 3 + ethanol 20%; (d) eMIP-modified electrode in LiClO4 0.1 M at pH of 3 + ethanol 20%.
Polymers 16 01076 g005
Figure 6. Comparison of three calibration curves in terms of DPV measurements in different ionic media.
Polymers 16 01076 g006
Figure 7. Histograms reporting peak potential (V) and peak current (μa) for 0.2 mM GA solution in LiClO4 0.1 M at pH of 3 containing different percentages of ethanol from 0 to 40%. DPV measurements: potential scan from −1 V to +1 V, potential step of 0.015 V, pulse time of 0.02 s, and scan speed of 0.05 v/s.
Polymers 16 01076 g007
Figure 8. DPV in LiClO4 0.1 M at pH of 3 with increasing concentrations of GA. Potential scan from −1 V to 1 V, potential step of 0.015 V, pulse width of 0.2 V, pulse duration of 0.02 s, and scan speed of 0.05 v/s.
Polymers 16 01076 g008
Figure 9. Calibration curves for bare electrodes and eMIP- and eNIP-modified electrodes. The error bars correspond to the standard deviation of the measurements performed with three electrodes of each type.
Polymers 16 01076 g009
Figure 10. DPV voltammograms recorded in LiClO4 0.1 M at pH of 3 and ethanol 10%, with a fixed GA concentration (red line) and increasing quantities of interferent. DPV measurements: potential scan from −1 V to +1 V, potential step of 0.015 V, pulse width of 0.2 V, pulse duration of 0.02 s, and scan speed of 0.05 v/s. (a) Interferent: catechin; (b) Interferent: ascorbic acid; (c) Interferent: 2-furalhdeyde.
Polymers 16 01076 g010
Figure 11. Example of standard addition method applied to a red wine sample. (a) DPV voltammograms; and (b) standard addition graph of 0.15 mL of red wine diluted with 10 mL of hydroalcoholic solution with 13% ethanol. Cx = 2.23 (7) mg L−1 GA in the diluted sample corresponding to 150 (5) mg L−1 GA in the red wine.
Polymers 16 01076 g011
Table 1. Active area values were calculated using Equation (1). The electrochemical probe solution was 5 mM K3Fe(CN)6/0.1 M KCl, with a pH of 7.5. Potential scan was from −1 to +1 V; and scan rate was from 0.025 to 0.5 V/s. Double-layer capacitance was measured by CV in 0.1 M NaCl solution. Potential scan was from −0.05 to +0.05 V; and scan rate was from 0.025 to 0.5 V/s.
Active Area (mm2) Capacitance (μF)
bare electrode3.8 (2)0.7 (5)
eMIP-modified electrode2.4 (2)4.11 (3)
eNIP-modified electrode1.3 (1)1.49 (3)
mean values obtained by plotting both the cathodic and the anodic peaks vs. (scan rate)0.5; the number in parenthesis is the standard deviation on the last digit.
Table 2. Randles circuital elements schematizing the Nyquist plots of Figure 2.
R (kΩ)RCT (kΩ)C (µF)W (kσ)
bare electrode0.296.53.84.0
eMIP-modified electrode after template removal0.514.277.03.1
eMIP-modified electrode before template removal0.7010.015.40.2
eNIP-modified electrode0.8115.518.81.9
Table 3. Characterization of the oxidation process at the electrode surface. The parameters are obtained from CV scans (from −1 V to +1 V) at different scan rates (from 0.01 V/s to 2 V/s).
αa (V)E0′ (V)D (cm2/s)k0
bare electrode
(LiClO4 0.1M, gallic acid 2.5 mM)
0.670.262 (4)7.4 (4) × 10−94.9 × 10⁻⁴
eMIP-modified electrode
(LiClO4 0.1M, gallic acid 2.5 mM)
0.780.216 (6)4.7 (2) × 10−94.6 × 10⁻⁴
bare electrode
(LiClO4 0.1M, EtOH 20% gallic acid 2.5 mM)
0.590.500 (3)2.9 (6) × 10−92.7 × 10⁻⁴
eMIP-modified electrode
(LiClO4 0.1M, EtOH 20% gallic acid 2.5 mM)
0.790.493 (7)5.0 (2) × 10−94.7 × 10⁻⁴
The number in parenthesis is the standard deviation on the last digit.
Table 4. Straight line parameters, detection limit (LOD), quantification limit (LOQ), and linear range for bare electrodes and eMIP- and eNIP-modified electrodes. LOD and LOQ have been calculated from the parameters of the lines interpolating the mean values of the measurements of three electrodes for each type (the dotted lines in Figure 6). The number in parenthesis is the standard deviation on the last digit.
ElectrodeSlope
(µA μM−1)
Intercept
(µA)
R2LOD
(µM)
LOQ
(µM)
Linear Range
(µM)
Bare0.37 (1)0.7 (6)0.994123512–140
eMIP0.97 (2)1.8 (8)0.9965165–70
eNIP0.134 (5)0.4 (3)0.985185518–140
Table 5. Gallic acid concentration in the real samples was analyzed and compared with the total polyphenol content (Folin–Ciocalteau method) and the mean values of gallic acid concentration reported in the literature. Numbers in parentheses are the standard deviations on the last digit.
BeverageGallic Acid
mg L−1
Total Polyphenols
GAE, mg L−1
Gallic Acid
Mean Value, mg L−1
Ref.
White wine14 (4)181.310[63]
Red wine145 (15)1285.17.76–172.01[64]
Rosè wine120 (13)1081.17.76–172.01[64]
Marsala17 (2)281 13[65]
Green tea138 (26)1535 104[66]
Disclaimer/Publisher’s Note: The statements, opinions and data contained in all publications are solely those of the individual author(s) and contributor(s) and not of MDPI and/or the editor(s). MDPI and/or the editor(s) disclaim responsibility for any injury to people or property resulting from any ideas, methods, instructions or products referred to in the content.

