
Microstructure and Release Behavior of Alginate–Natural Hydrocolloid Composites: A Comparative Study


Abstract
:
1. Introduction
2. Materials and Methods
2.1. Materials
2.2. Encapsulation of Tartrazine
2.3. Physical Properties of Hydrogel Solutions and Microbeads
2.4. Characterization of Microbeads
2.5. Encapsulation Efficiency
2.6. Release Kinetics
3. Results and Discussion
3.1. The Physicochemical Properties of Hydrogel Solutions and Microbeads
3.2. Morphology of Microbeads
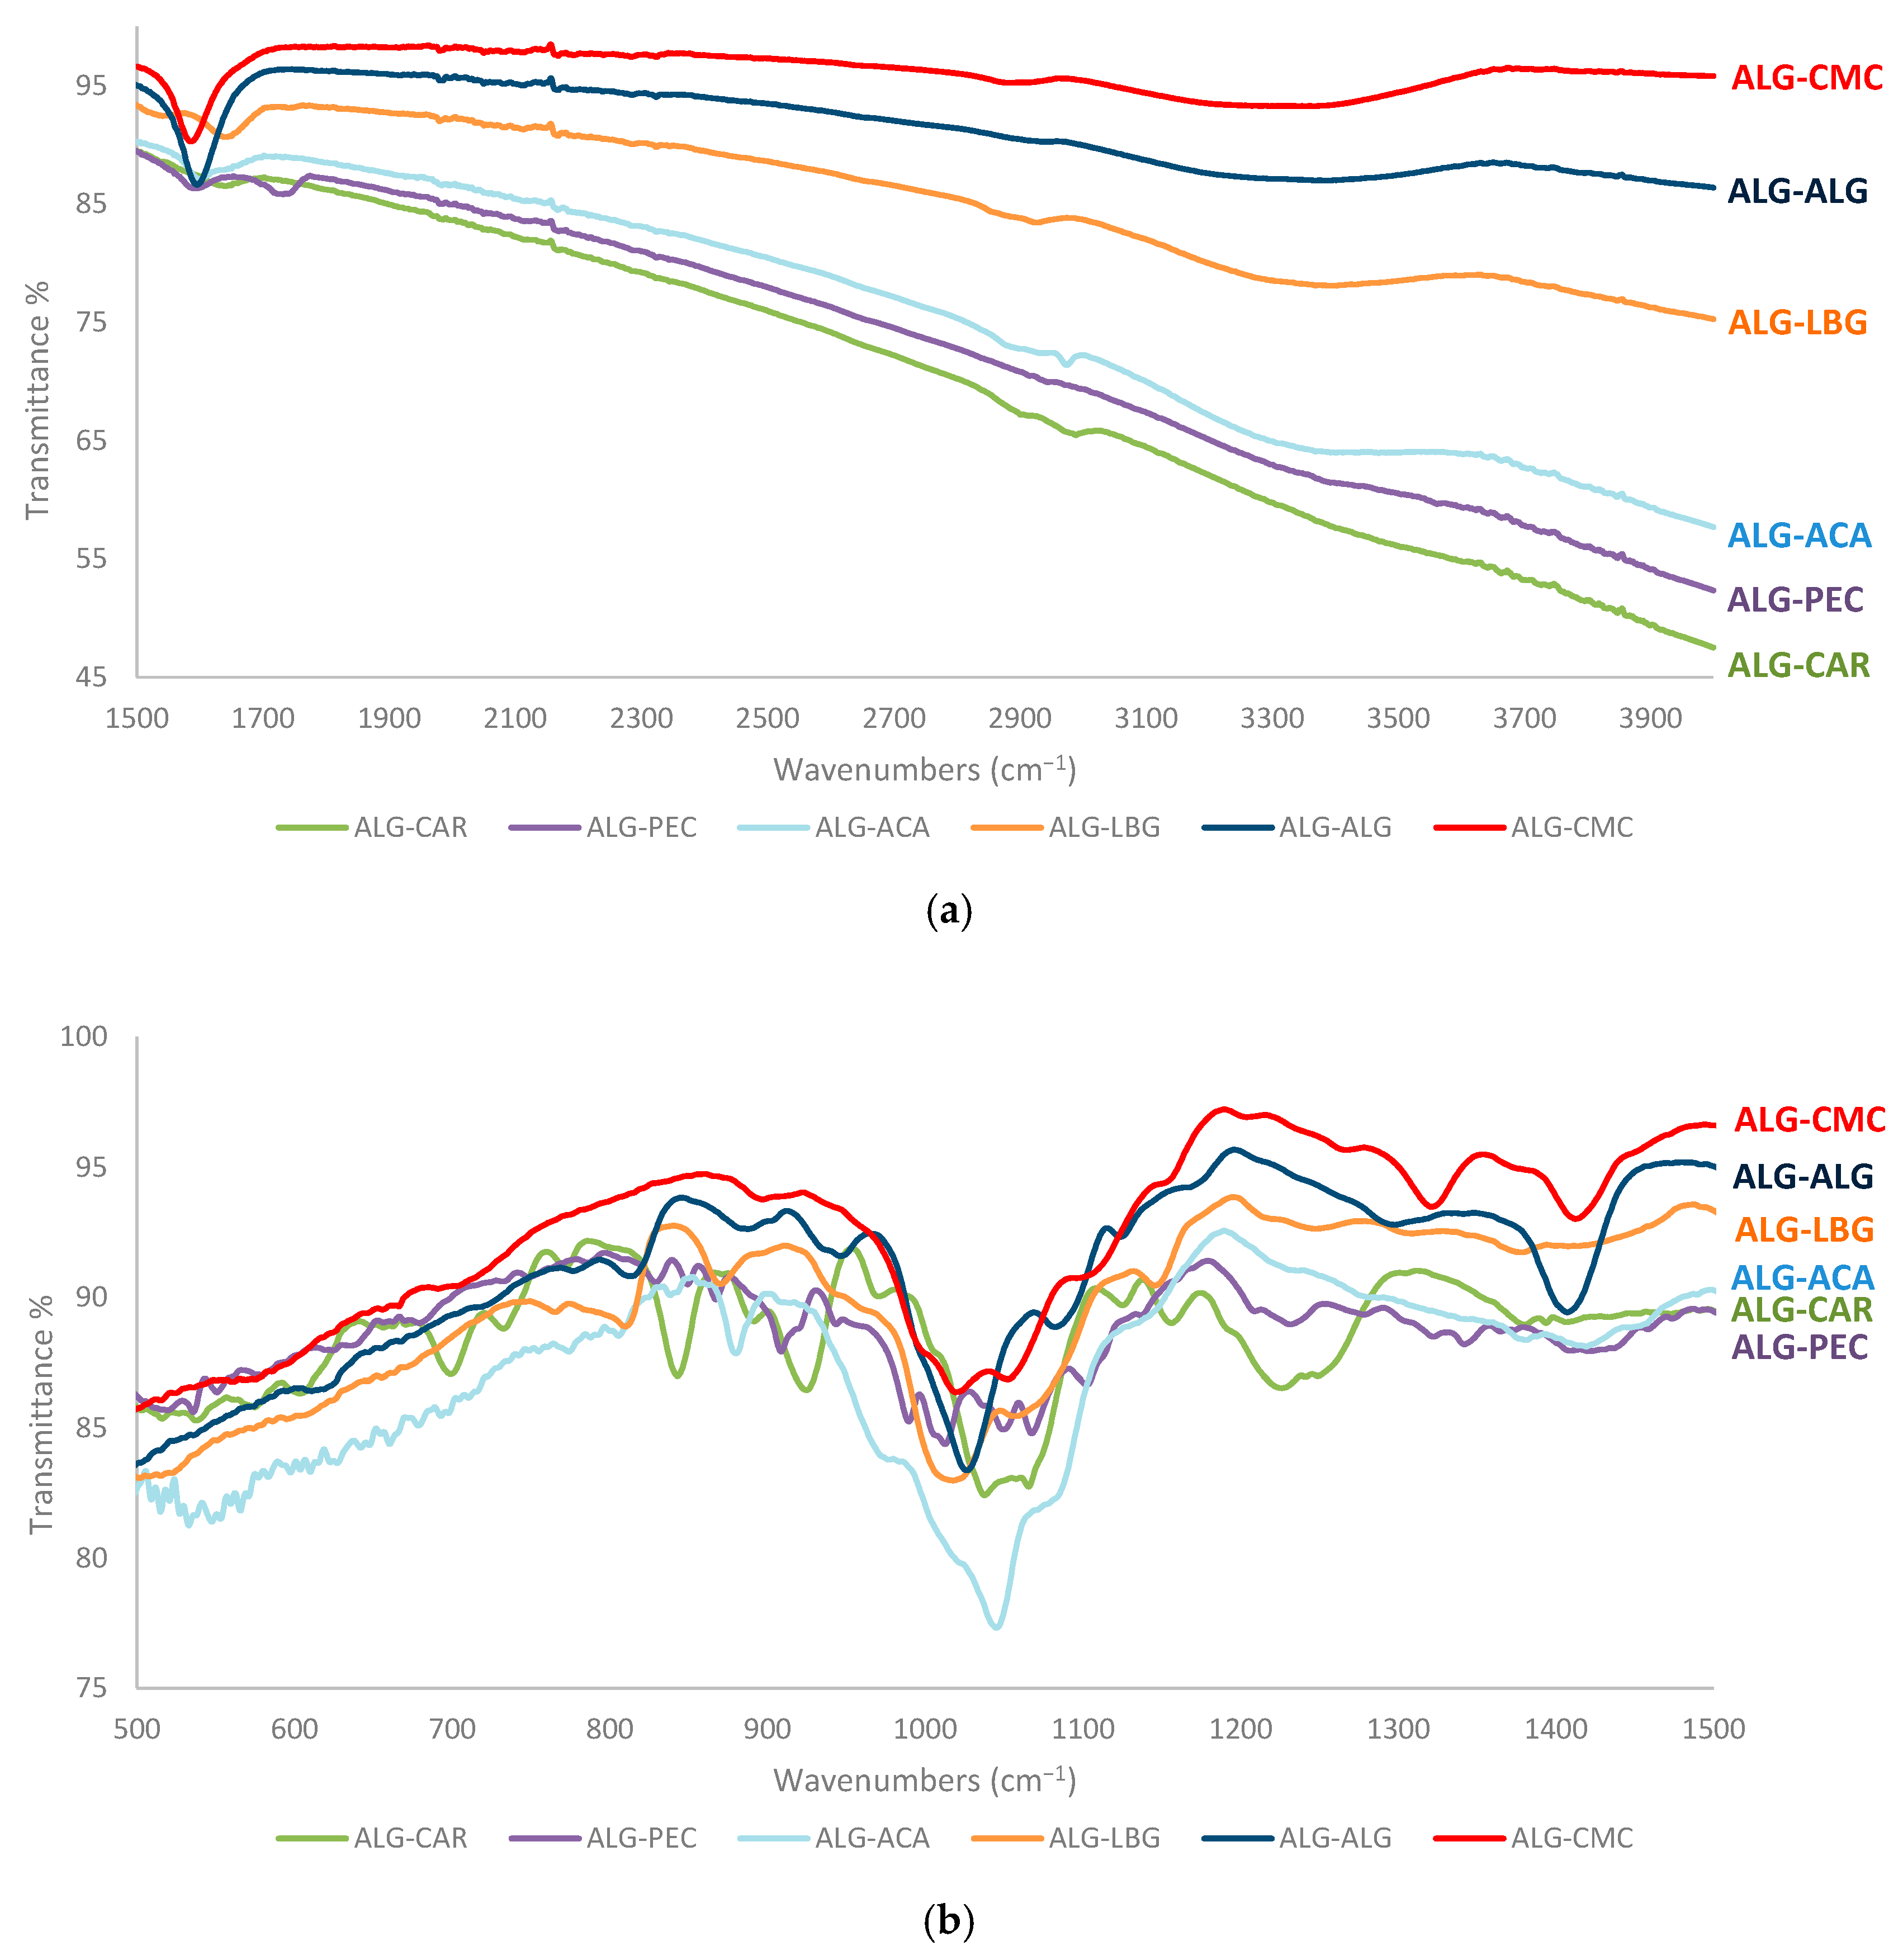
3.3. FTIR
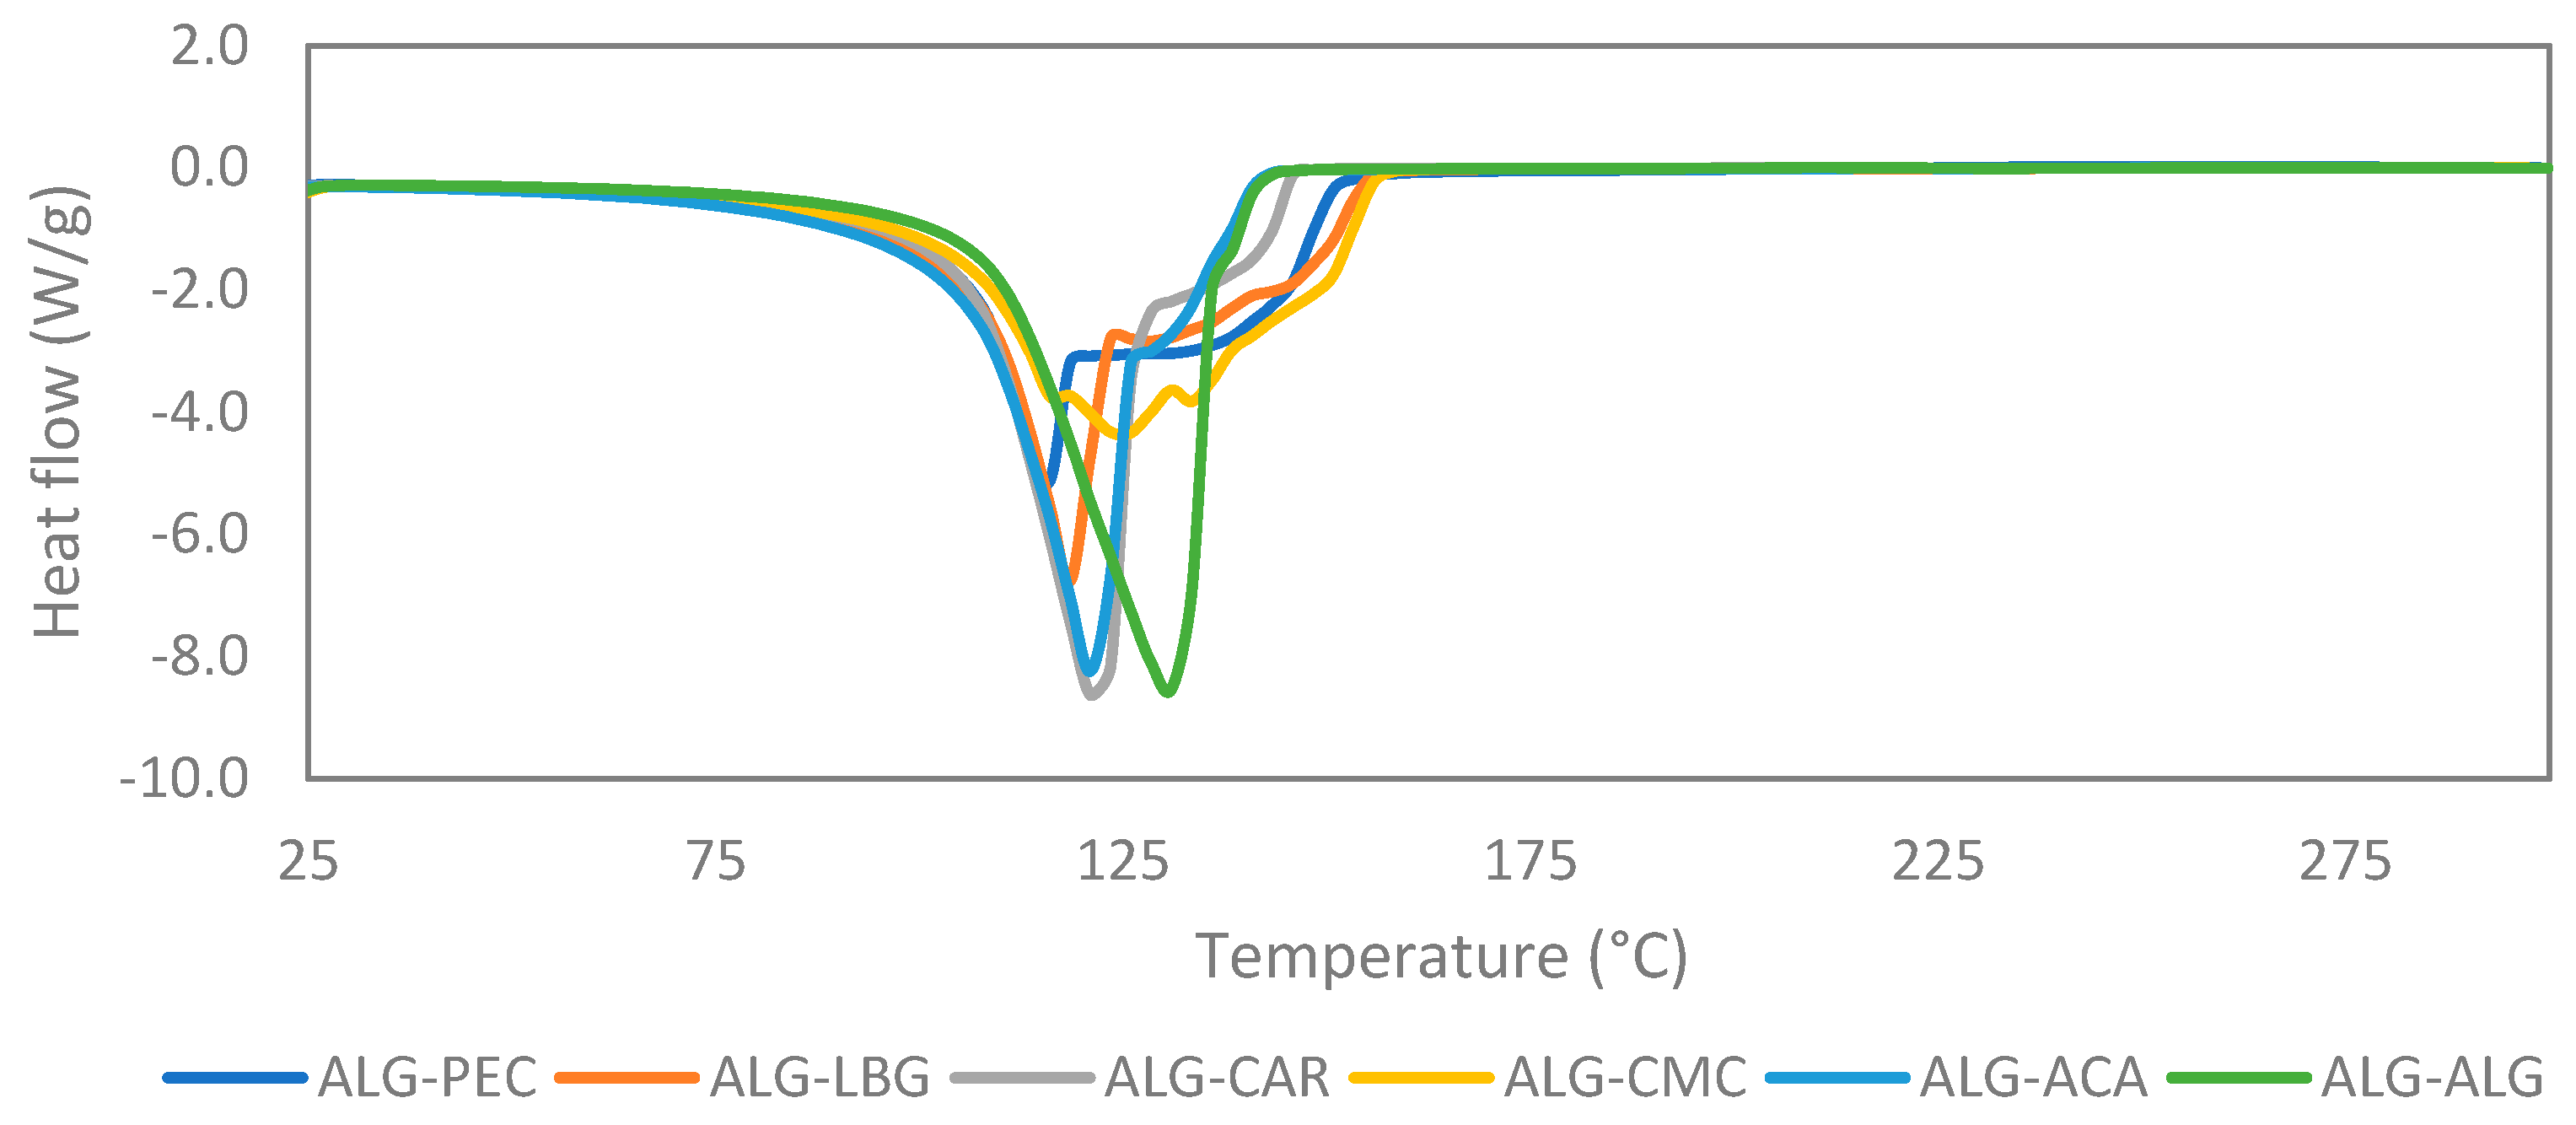
3.4. DSC
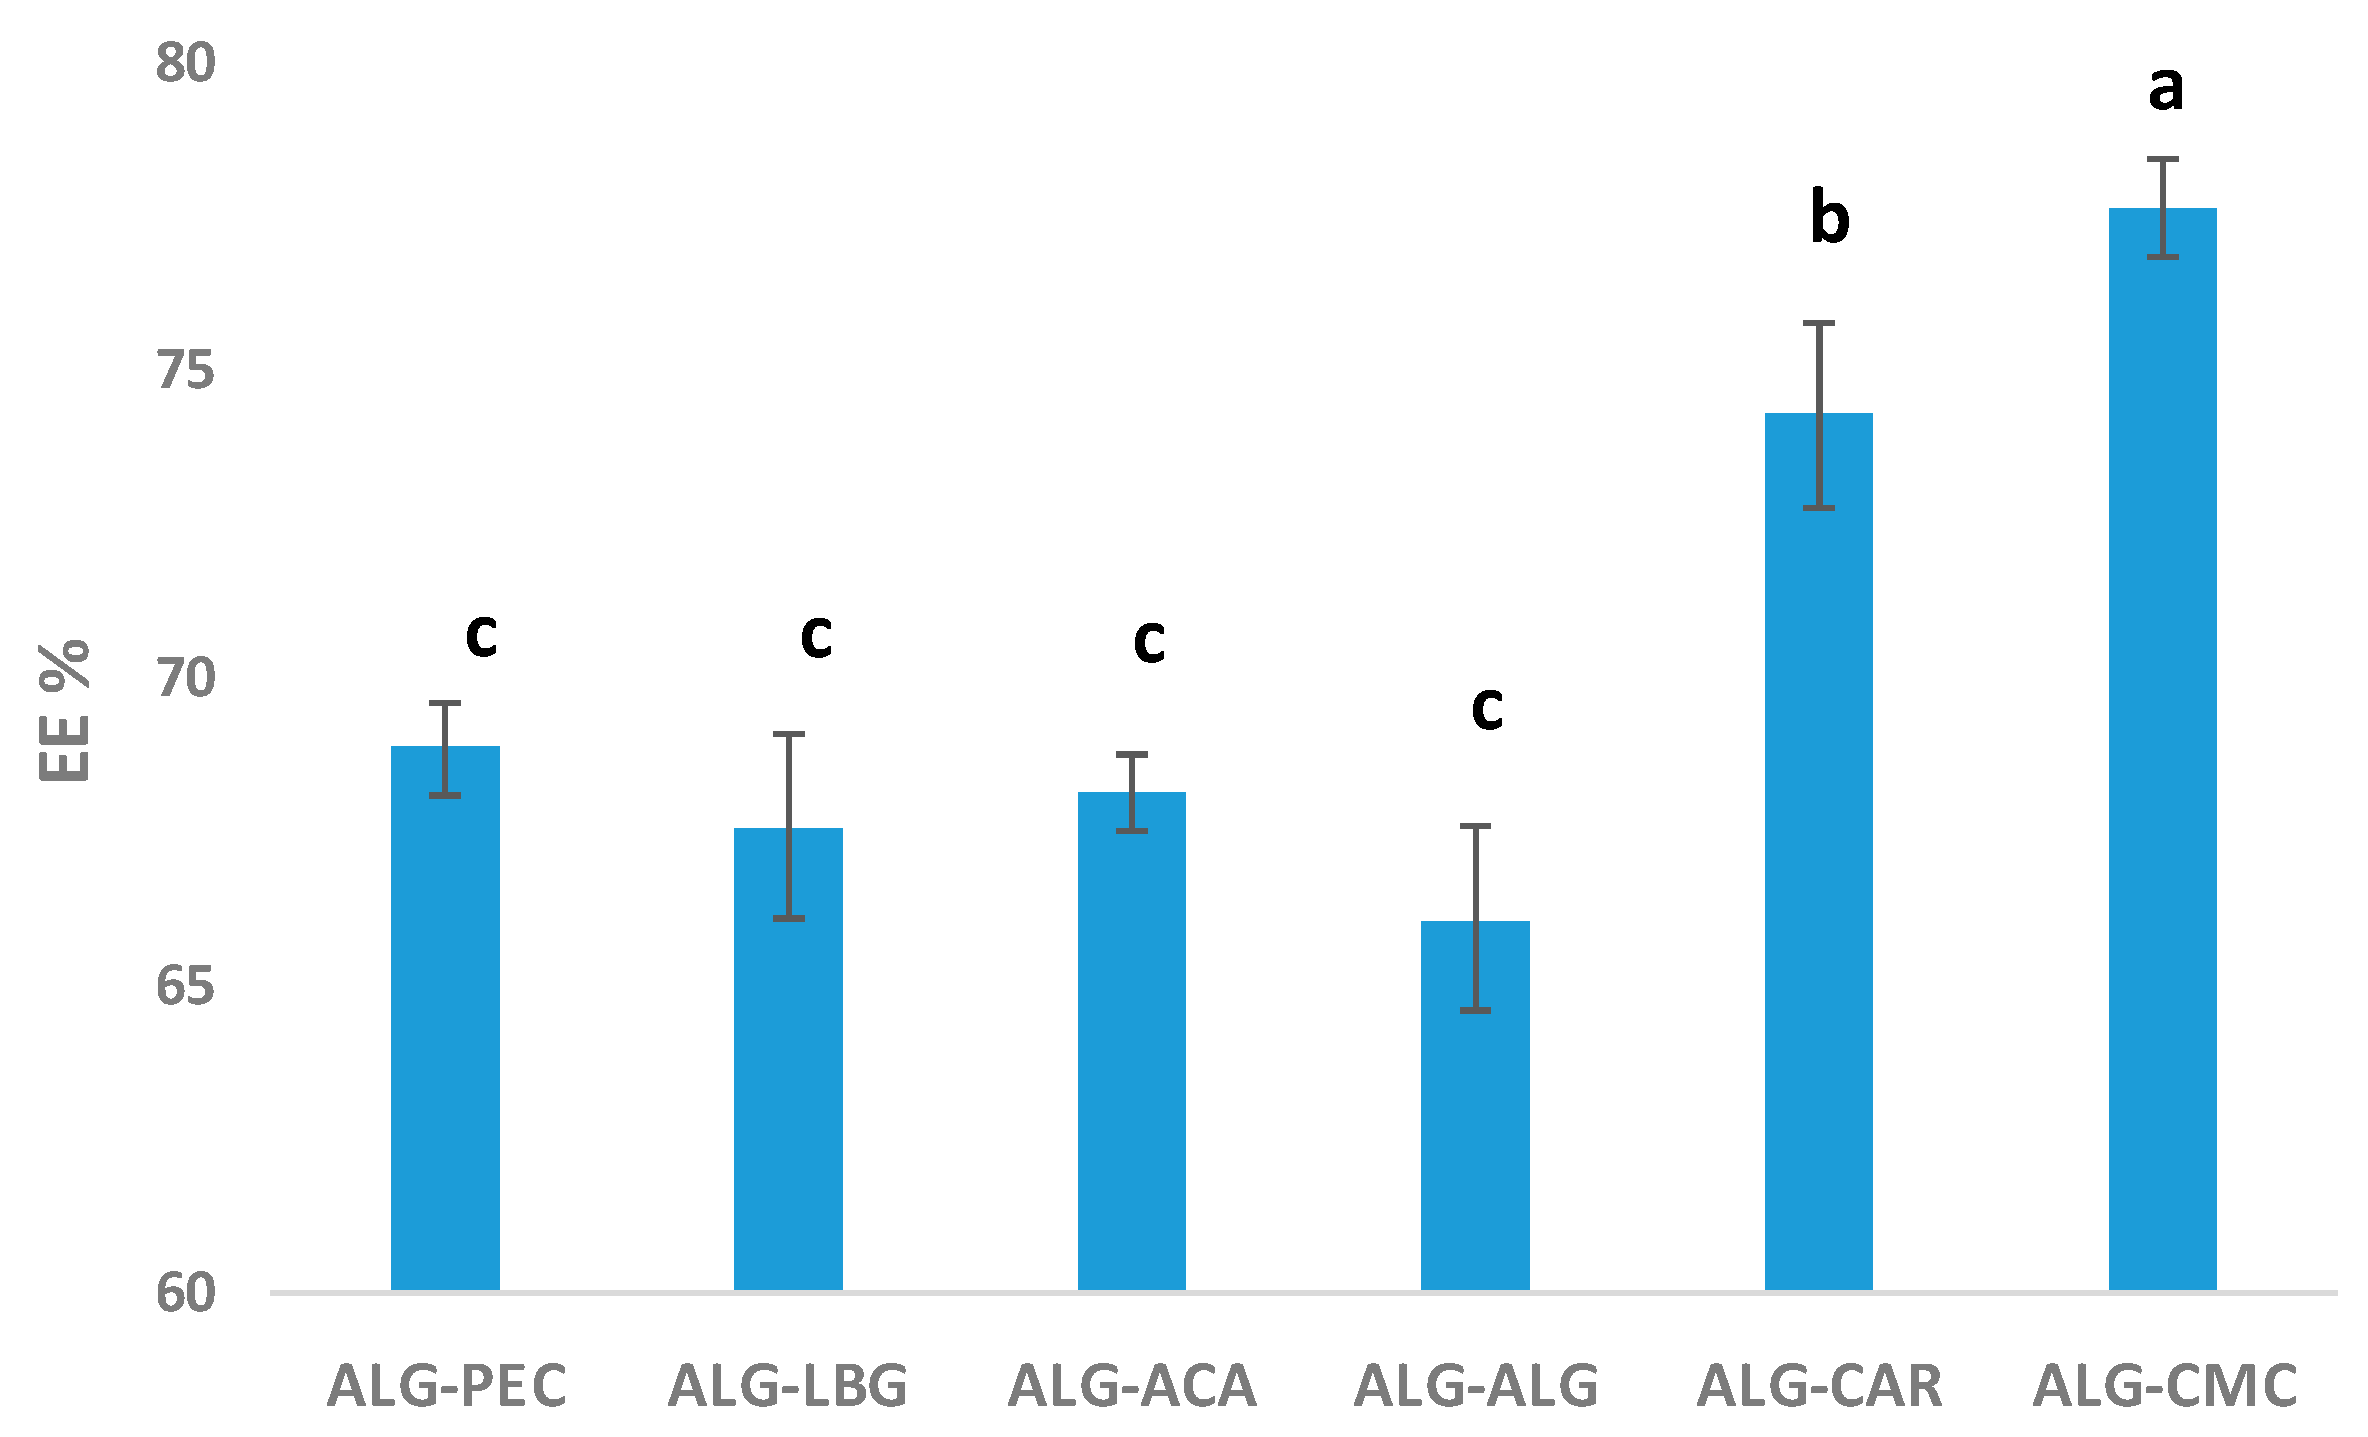
3.5. Encapsulation Efficiency (EE)
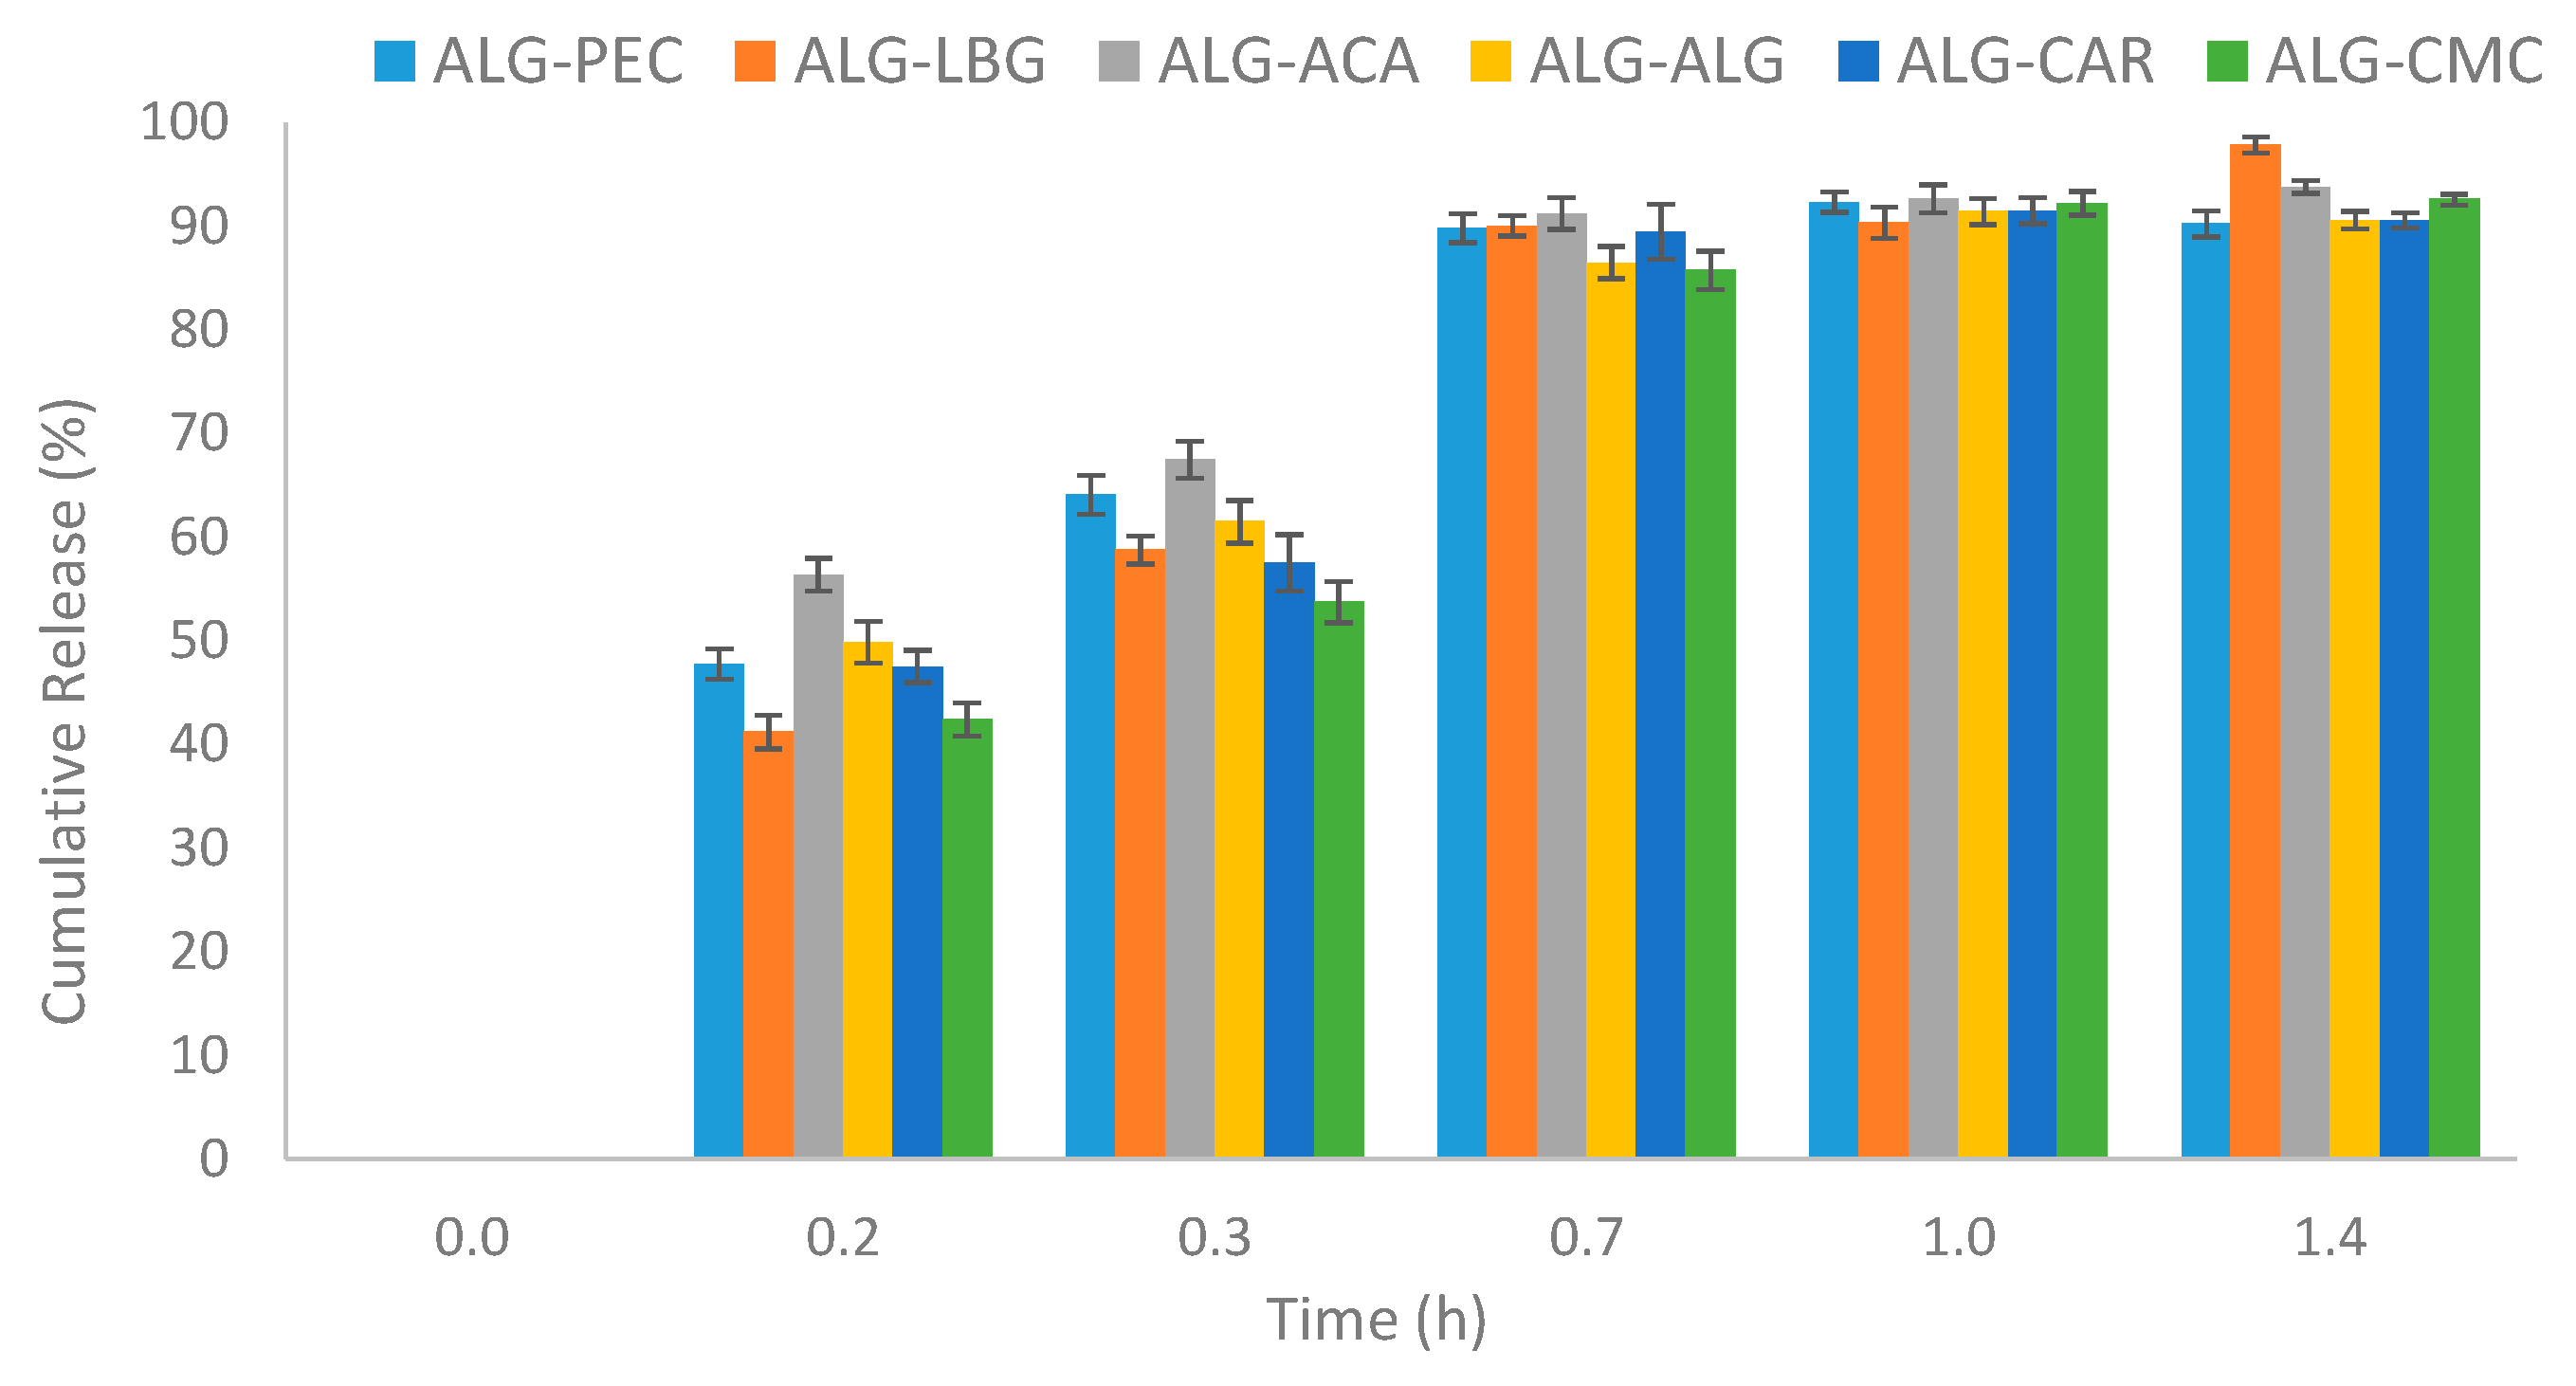
3.6. Release Mechanism
4. Conclusions
Supplementary Materials
Author Contributions
Funding
Institutional Review Board Statement
Data Availability Statement
Acknowledgments
Conflicts of Interest
References
- Khalid, S.; Qadir, M.; Massud, A.; Ali, M.; Rasool, M. Effect of degree of cross-linking on swelling and drug release behaviour of poly(methyl methacrylate-co-itaconic acid) [P(MMA/IA)] hydrogels for site specific drug delivery. J. Drug Deliv. Sci. Technol. 2009, 19, 413–418. [Google Scholar] [CrossRef]
- Boostani, S.; Jafari, S.M. Controlled Release of Nanoencapsulated Food Ingredients. In Release and Bioavailability of Nanoencapsulated Food Ingredients; Academic Press: Cambridge, MA, USA, 2020; pp. 27–78. ISBN 9780128156650. [Google Scholar]
- Weng, Y.; Ranaweera, S.; Zou, D.; Cameron, A.P.; Chen, X.; Song, H.; Zhao, C.-X. Improved enzyme thermal stability, loading and bioavailability using alginate encapsulation. Food Hydrocoll. 2022, 137, 108385. [Google Scholar] [CrossRef]
- Su, L.; Wu, S.; Zhu, W.; Liang, B.; Zhang, X.; Yang, J. Enhanced geopolymerization of MSWI fly ash through combined activator pretreatment: A sustainable approach to heavy metal encapsulation and resource recovery. J. Environ. Manag. 2024, 370, 122870. [Google Scholar] [CrossRef]
- Khan, Z.; Abourehab, M.A.; Parveen, N.; Kohli, K.; Kesharwani, P. Recent advances in microbeads-based drug delivery system for achieving controlled drug release. J. Biomater. Sci. Polym. Ed. 2022, 34, 541–564. [Google Scholar] [CrossRef]
- Nezamdoost-Sani, N.; Khaledabad, M.A.; Amiri, S.; Khaneghah, A.M. Alginate and derivatives hydrogels in encapsulation of probiotic bacteria: An updated review. Food Biosci. 2023, 52, 102433. [Google Scholar] [CrossRef]
- Cao, L.; Lu, W.; Mata, A.; Nishinari, K.; Fang, Y. Egg-box model-based gelation of alginate and pectin: A review. Carbohydr. Polym. 2020, 242, 116389. [Google Scholar] [CrossRef]
- Gajić, I.M.S.; Savić, I.M.; Svirčev, Z. Preparation and Characterization of Alginate Hydrogels with High Water-Retaining Capacity. Polymers 2023, 15, 2592. [Google Scholar] [CrossRef]
- Ramdhan, T.; Ching, S.H.; Prakash, S.; Bhandari, B. Physical and mechanical properties of alginate based composite gels. Trends Food Sci. Technol. 2020, 106, 150–159. [Google Scholar] [CrossRef]
- Aguero, L.; Alpdagtas, S.; Ilhan, E.; Zaldivar-Silva, D.; Gunduz, O. Functional role of crosslinking in alginate scaffold for drug delivery and tissue engineering: A review. Eur. Polym. J. 2021, 160, 110807. [Google Scholar] [CrossRef]
- Fuenzalida-Werner, J.P.; Mishra, K.; Stankevych, M.; Klemm, U.; Ntziachristos, V.; Stiel, A.C. Alginate beads as a highly versatile test-sample for optoacoustic imaging. Photoacoustics 2021, 25, 100301. [Google Scholar] [CrossRef]
- Liu, C.; Shi, Y.; Liu, Y.; Liu, Y.; Yang, C.; Chen, H.; Yang, C.; Liang, R. Controllable fabrication of alginate-based floating beads with core-shell architecture. Food Hydrocoll. 2024, 151, 109869. [Google Scholar] [CrossRef]
- Lozano-Vazquez, G.; Lobato-Calleros, C.; Escalona-Buendia, H.; Chavez, G.; Alvarez-Ramirez, J.; Vernon-Carter, E. Effect of the weight ratio of alginate-modified tapioca starch on the physicochemical properties and release kinetics of chlorogenic acid containing beads. Food Hydrocoll. 2015, 48, 301–311. [Google Scholar] [CrossRef]
- George, M.; Abraham, T.E. Polyionic hydrocolloids for the intestinal delivery of protein drugs: Alginate and chitosan—A review. J. Control. Release 2006, 114, 1–14. [Google Scholar] [CrossRef] [PubMed]
- Xie, F.; Gao, C.; Avérous, L. Alginate-based materials: Enhancing properties through multiphase formulation design and processing innovation. Mater. Sci. Eng. R Rep. 2024, 159, 100799. [Google Scholar] [CrossRef]
- Raus, R.A.; Nawawi, W.M.F.W.; Nasaruddin, R.R. Alginate and alginate composites for biomedical applications. Asian J. Pharm. Sci. 2021, 16, 280–306. [Google Scholar] [CrossRef]
- Bennacef, C.; Desobry-Banon, S.; Probst, L.; Desobry, S. Advances on alginate use for spherification to encapsulate biomolecules. Food Hydrocoll. 2021, 118, 106782. [Google Scholar] [CrossRef]
- Chi, M.-C.; Lyu, R.-C.; Lin, L.-L.; Huang, H.-B. Characterization of Bacillus kaustophilus leucine aminopeptidase immobilized in Ca-alginate/k-carrageenan beads. Biochem. Eng. J. 2008, 39, 376–382. [Google Scholar] [CrossRef]
- Guo, J.; Giusti, M.M.; Kaletunç, G. Encapsulation of purple corn and blueberry extracts in alginate-pectin hydrogel particles: Impact of processing and storage parameters on encapsulation efficiency. Food Res. Int. 2018, 107, 414–422. [Google Scholar] [CrossRef]
- Vaziri, A.S.; Alemzadeh, I.; Vossoughi, M.; Khorasani, A.C. Co-microencapsulation of Lactobacillus plantarum and DHA fatty acid in alginate-pectin-gelatin biocomposites. Carbohydr. Polym. 2018, 199, 266–275. [Google Scholar] [CrossRef]
- Rezvanian, M.; Ahmad, N.; Amin, M.C.I.M.; Ng, S.-F. Optimization, characterization, and in vitro assessment of alginate-pectin ionic cross-linked hydrogel film for wound dressing applications. Int. J. Biol. Macromol. 2017, 97, 131–140. [Google Scholar] [CrossRef]
- Tsai, F.-H.; Kitamura, Y.; Kokawa, M. Effect of gum arabic-modified alginate on physicochemical properties, release kinetics, and storage stability of liquid-core hydrogel beads. Carbohydr. Polym. 2017, 174, 1069–1077. [Google Scholar] [CrossRef] [PubMed]
- Sultana, M.; Chan, E.S.; Janarthanan, P.; Choo, W.S. Functional orange juice with Lactobacillus casei and tocotrienol-enriched flaxseed oil co-encapsulation: Physicochemical properties, probiotic viability, oxidative stability, and sensorial acceptability. LWT 2023, 188, 115388. [Google Scholar] [CrossRef]
- Upadhyay, M.; Adena, S.K.R.; Vardhan, H.; Yadav, S.K.; Mishra, B. Locust bean gum and sodium alginate based interpenetrating polymeric network microbeads encapsulating Capecitabine: Improved pharmacokinetics, cytotoxicity &in vivo antitumor activity. Mater. Sci. Eng. C 2019, 104, 109958. [Google Scholar] [CrossRef]
- Niu, Y.; Zhang, X.; Si, T.; Zhang, Y.; Qi, L.; Zhao, G.; Xu, R.X.; He, X.; Zhao, Y. Simultaneous Measurements of Geometric and Viscoelastic Properties of Hydrogel Microbeads Using Continuous—Flow Microfluidics with Embedded Electrodes. Small 2017, 13, 1702821. [Google Scholar] [CrossRef]
- Helgerud, T.; Gåserød, O.; Fjæreide, T.; Andersen, P.O.; Larsen, C.K. Alginates. In Food Stabilisers, Thickeners and Gelling Agents; John Wiley & Son: Hoboken, NJ, USA, 2009; pp. 50–72. [Google Scholar]
- Amirian, J.; Van, T.T.T.; Bae, S.-H.; Jung, H.-I.; Choi, H.-J.; Cho, H.-D.; Lee, B.-T. Examination of In vitro and In vivo biocompatibility of alginate-hyaluronic acid microbeads As a promising method in cell delivery for kidney regeneration. Int. J. Biol. Macromol. 2017, 105, 143–153. [Google Scholar] [CrossRef]
- Belščak-Cvitanović, A.; Bušić, A.; Barišić, L.; Vrsaljko, D.; Karlović, S.; Špoljarić, I.; Vojvodić, A.; Mršić, G.; Komes, D. Emulsion templated microencapsulation of dandelion (Taraxacum officinale L.) polyphenols and β-carotene by ionotropic gelation of alginate and pectin. Food Hydrocoll. 2016, 57, 139–152. [Google Scholar] [CrossRef]
- Mishra, R.K.; Datt, M.; Pal, K.; Banthia, A.K. Preparation and characterization of amidated pectin based hydrogels for drug delivery system. J. Mater. Sci. Mater. Med. 2007, 19, 2275–2280. [Google Scholar] [CrossRef]
- Sabet, S.; Rashidinejad, A.; Melton, L.D.; Zujovic, Z.; Akbarinejad, A.; Nieuwoudt, M.; Seal, C.K.; McGillivray, D.J. The interactions between the two negatively charged polysaccharides: Gum Arabic and alginate. Food Hydrocoll. 2020, 112, 106343. [Google Scholar] [CrossRef]
- Siqueira, E.J.; Salon, M.B.; Belgacem, M.N.; Mauret, E. Carboxymethylcellulose (CMC) as a model compound of cellulose fibers and polyamideamine epichlorohydrin (PAE)–CMC interactions as a model of PAE–fibers interactions of PAE—Based wet strength papers. J. Appl. Polym. Sci. 2015, 132. [Google Scholar] [CrossRef]
- Faried, M.; Shameli, K.; Miyake, M.; Hajalilou, A.; Kalantari, K.; Zakaria, Z.; Hara, H.; Khairudin, N.B.A. Synthesis of silver nanoparticles via green method using ultrasound irradiation in seaweed Kappaphycus alvarezii media. Res. Chem. Intermed. 2016, 42, 7991–8004. [Google Scholar] [CrossRef]
- König, J. 2—Food colour additives of synthetic origin. In Colour Additives for Foods and Beverages; Scotter, M.J., Ed.; Woodhead Publishing: Cambridge, UK, 2015; pp. 35–60. [Google Scholar]
- Flamminii, F.; Paciulli, M.; Di Michele, A.; Littardi, P.; Carini, E.; Chiavaro, E.; Pittia, P.; Di Mattia, C.D. Alginate-based microparticles structured with different biopolymers and enriched with a phenolic-rich olive leaves extract: A physico-chemical characterization. Curr. Res. Food Sci. 2021, 4, 698–706. [Google Scholar] [CrossRef] [PubMed]
- Bekhit, M.; Sánchez-González, L.; Ben Messaoud, G.; Desobry, S. Encapsulation of Lactococcus lactis subsp. lactis on alginate/pectin composite microbeads: Effect of matrix composition on bacterial survival and nisin release. J. Food Eng. 2016, 180, 1–9. [Google Scholar] [CrossRef]
- Reddy, O.S.; Subha, M.; Jithendra, T.; Madhavi, C.; Rao, K.C. Curcumin encapsulated dual cross linked sodium alginate/montmorillonite polymeric composite beads for controlled drug delivery. J. Pharm. Anal. 2021, 11, 191–199. [Google Scholar] [CrossRef]
- Elnashar, M.M.; Yassin, M.A.; Moneim, A.E.-F.A.; Bary, E.M.A. Investigating the Unexpected Behavior for the Release Kinetics of Brilliant Blue Encapsulated into Calcium Alginate Beads. Eurasian Chem. J. 2009, 12, 69–77. [Google Scholar] [CrossRef]


| Sample Name | Solution | Microbeads | ||||
|---|---|---|---|---|---|---|
| Viscosity (P) | Moisture (%) | Particle Size (mm) | Hardness (g) | Springiness (mm) | Load (g) | |
| ALG-ALG | 1.35 ± 0.1 b | 97.3 ± 0.07 b | 2.66 ± 0.64 abc | 1706 ± 71 a | 7.2 ± 0.1 c | 88.3 ± 6.1 c |
| ALG-CMC | 0.95 ± 0.1 c | 97.6 ± 0.33 ab | 3.16 ± 0.60 ab | 537 ± 6 c | 10.4 ± 0.0 b | 116.1 ± 9.4 b |
| ALG-PEC | 0.15 ± 0.1 d | 97.7 ± 0.21 ab | 2.45 ± 0.41 bc | 632 ± 22 c | 10.3 ± 0.3 b | 95.9 ± 12.3 c |
| ALG-CAR | 0.65 ± 0.1 c | 98.2 ± 0.30 a | 3.48 ± 0.44 a | 311 ± 14 d | 11.9 ± 0.3 a | 199.9 ± 9.6 a |
| ALG-ACA | 0.05 ± 0.1 d | 97.4 ± 0.06 b | 2.07 ± 0.03 c | 1492 ± 54 b | 11.0 ± 0.0 b | 64.8 ± 11.6 d |
| ALG-LBG | 9.90 ± 0.1 a | 97.3 ± 0.01 b | 2.78 ± 0.64 abc | 1754 ± 29 a | 7.1 ± 0.2 c | 90.9 ± 7.8 c |
| ALG-ALG | ALG-CMC | ALG-PEC | ALG-CAR | ALG-ACA | ALG-LBG | |
|---|---|---|---|---|---|---|
| Zero-order | 0.7145 | 0.7899 | 0.6950 | 0.7272 | 0.6673 | 0.7881 |
| First-order | 0.8782 | 0.9282 | 0.8130 | 0.8369 | 0.8750 | 0.9597 |
| Higuchi | 0.8971 | 0.9378 | 0.8816 | 0.9008 | 0.8650 | 0.9354 |
| Korsmeyer–Peppas | 0.8616 | 0.8384 | 0.9058 | 0.8163 | 0.8627 | 0.9081 |
Disclaimer/Publisher’s Note: The statements, opinions and data contained in all publications are solely those of the individual author(s) and contributor(s) and not of MDPI and/or the editor(s). MDPI and/or the editor(s) disclaim responsibility for any injury to people or property resulting from any ideas, methods, instructions or products referred to in the content. |
© 2025 by the authors. Licensee MDPI, Basel, Switzerland. This article is an open access article distributed under the terms and conditions of the Creative Commons Attribution (CC BY) license (https://creativecommons.org/licenses/by/4.0/).
Share and Cite
Sıçramaz, H.; Dönmez, A.B.; Güven, B.; Ünal, D.; Aşbay, E. Microstructure and Release Behavior of Alginate–Natural Hydrocolloid Composites: A Comparative Study. Polymers 2025, 17, 531. https://doi.org/10.3390/polym17040531
Sıçramaz H, Dönmez AB, Güven B, Ünal D, Aşbay E. Microstructure and Release Behavior of Alginate–Natural Hydrocolloid Composites: A Comparative Study. Polymers. 2025; 17(4):531. https://doi.org/10.3390/polym17040531
Chicago/Turabian StyleSıçramaz, Hatice, Ali Baran Dönmez, Buse Güven, Derya Ünal, and Elif Aşbay. 2025. "Microstructure and Release Behavior of Alginate–Natural Hydrocolloid Composites: A Comparative Study" Polymers 17, no. 4: 531. https://doi.org/10.3390/polym17040531
APA StyleSıçramaz, H., Dönmez, A. B., Güven, B., Ünal, D., & Aşbay, E. (2025). Microstructure and Release Behavior of Alginate–Natural Hydrocolloid Composites: A Comparative Study. Polymers, 17(4), 531. https://doi.org/10.3390/polym17040531