
Engineering Photoluminescence of Lanthanide Doped Yttrium-MOF-76 for Volatile Organic Compound Sensing
 , , ,
, , ,  and
and
Abstract
:1. Introduction
2. Materials and Methods
2.1. Synthesis
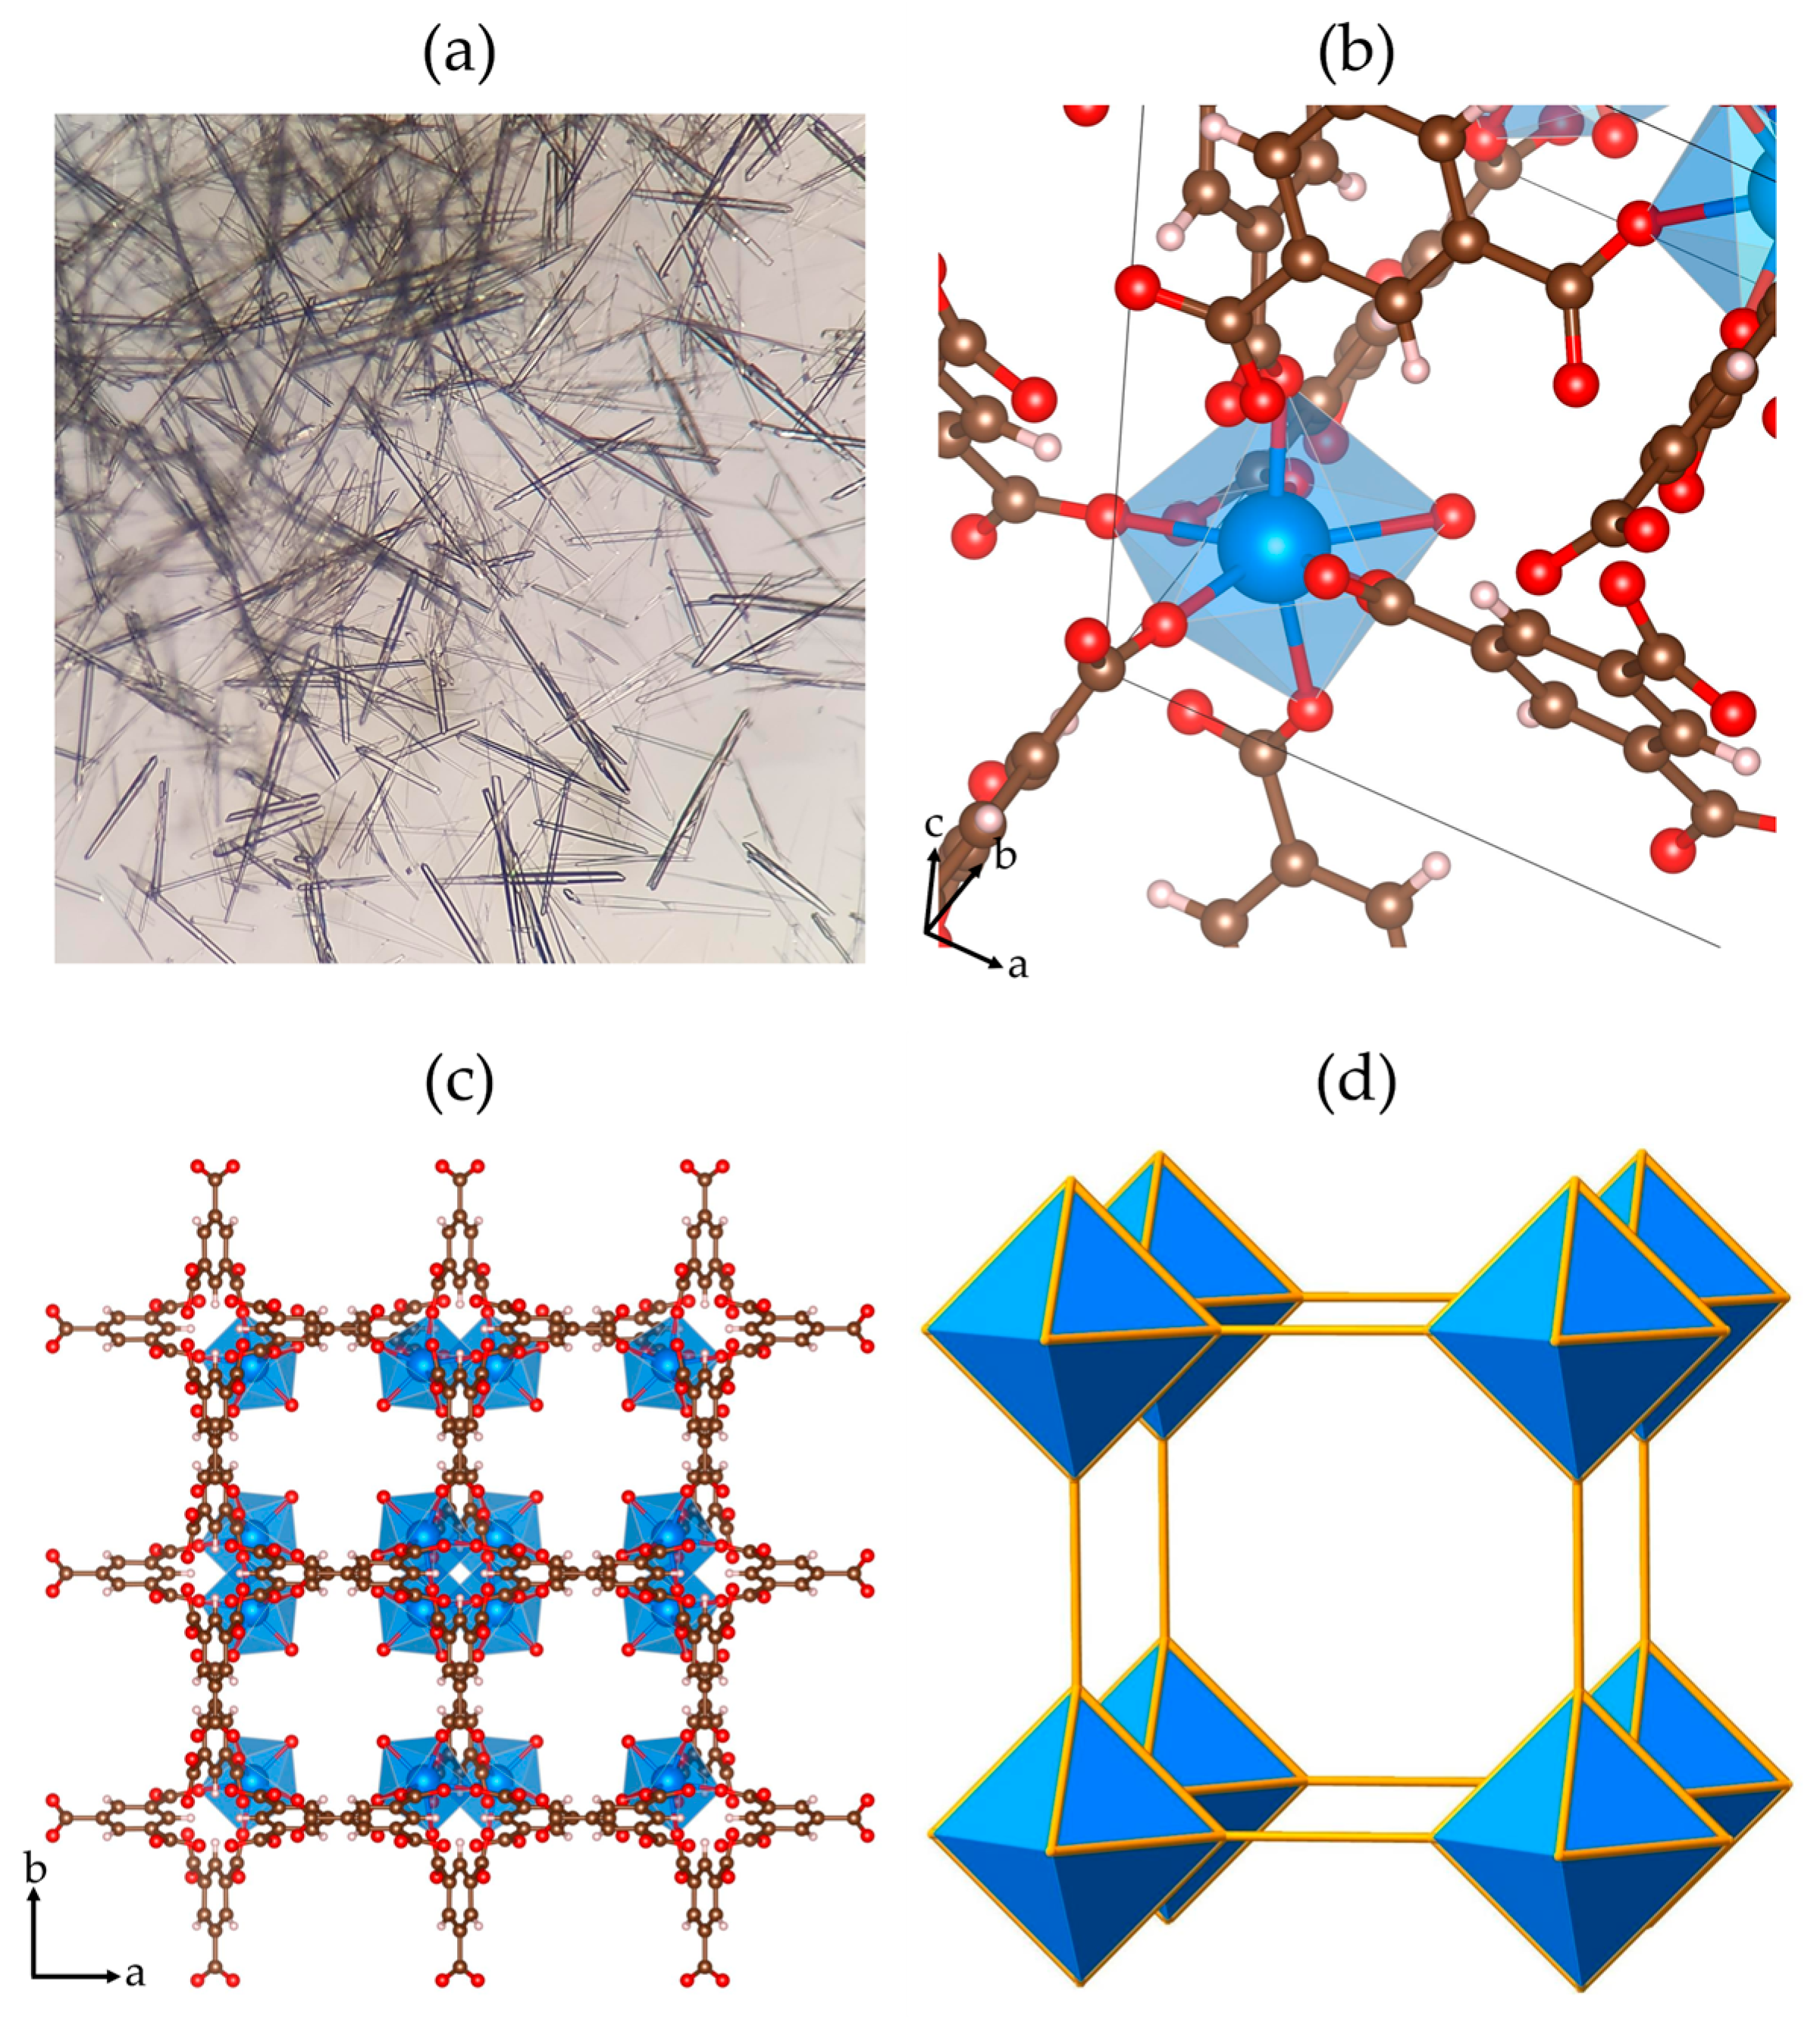
2.1.1. Y-BTC
2.1.2. Ln@Y-BTC
2.2. Characterization
2.3. Photophysical Characterization and Sensing Assays
2.3.1. Chemical Sensor Studies
2.3.2. DFT Calculations
3. Results and Discussion
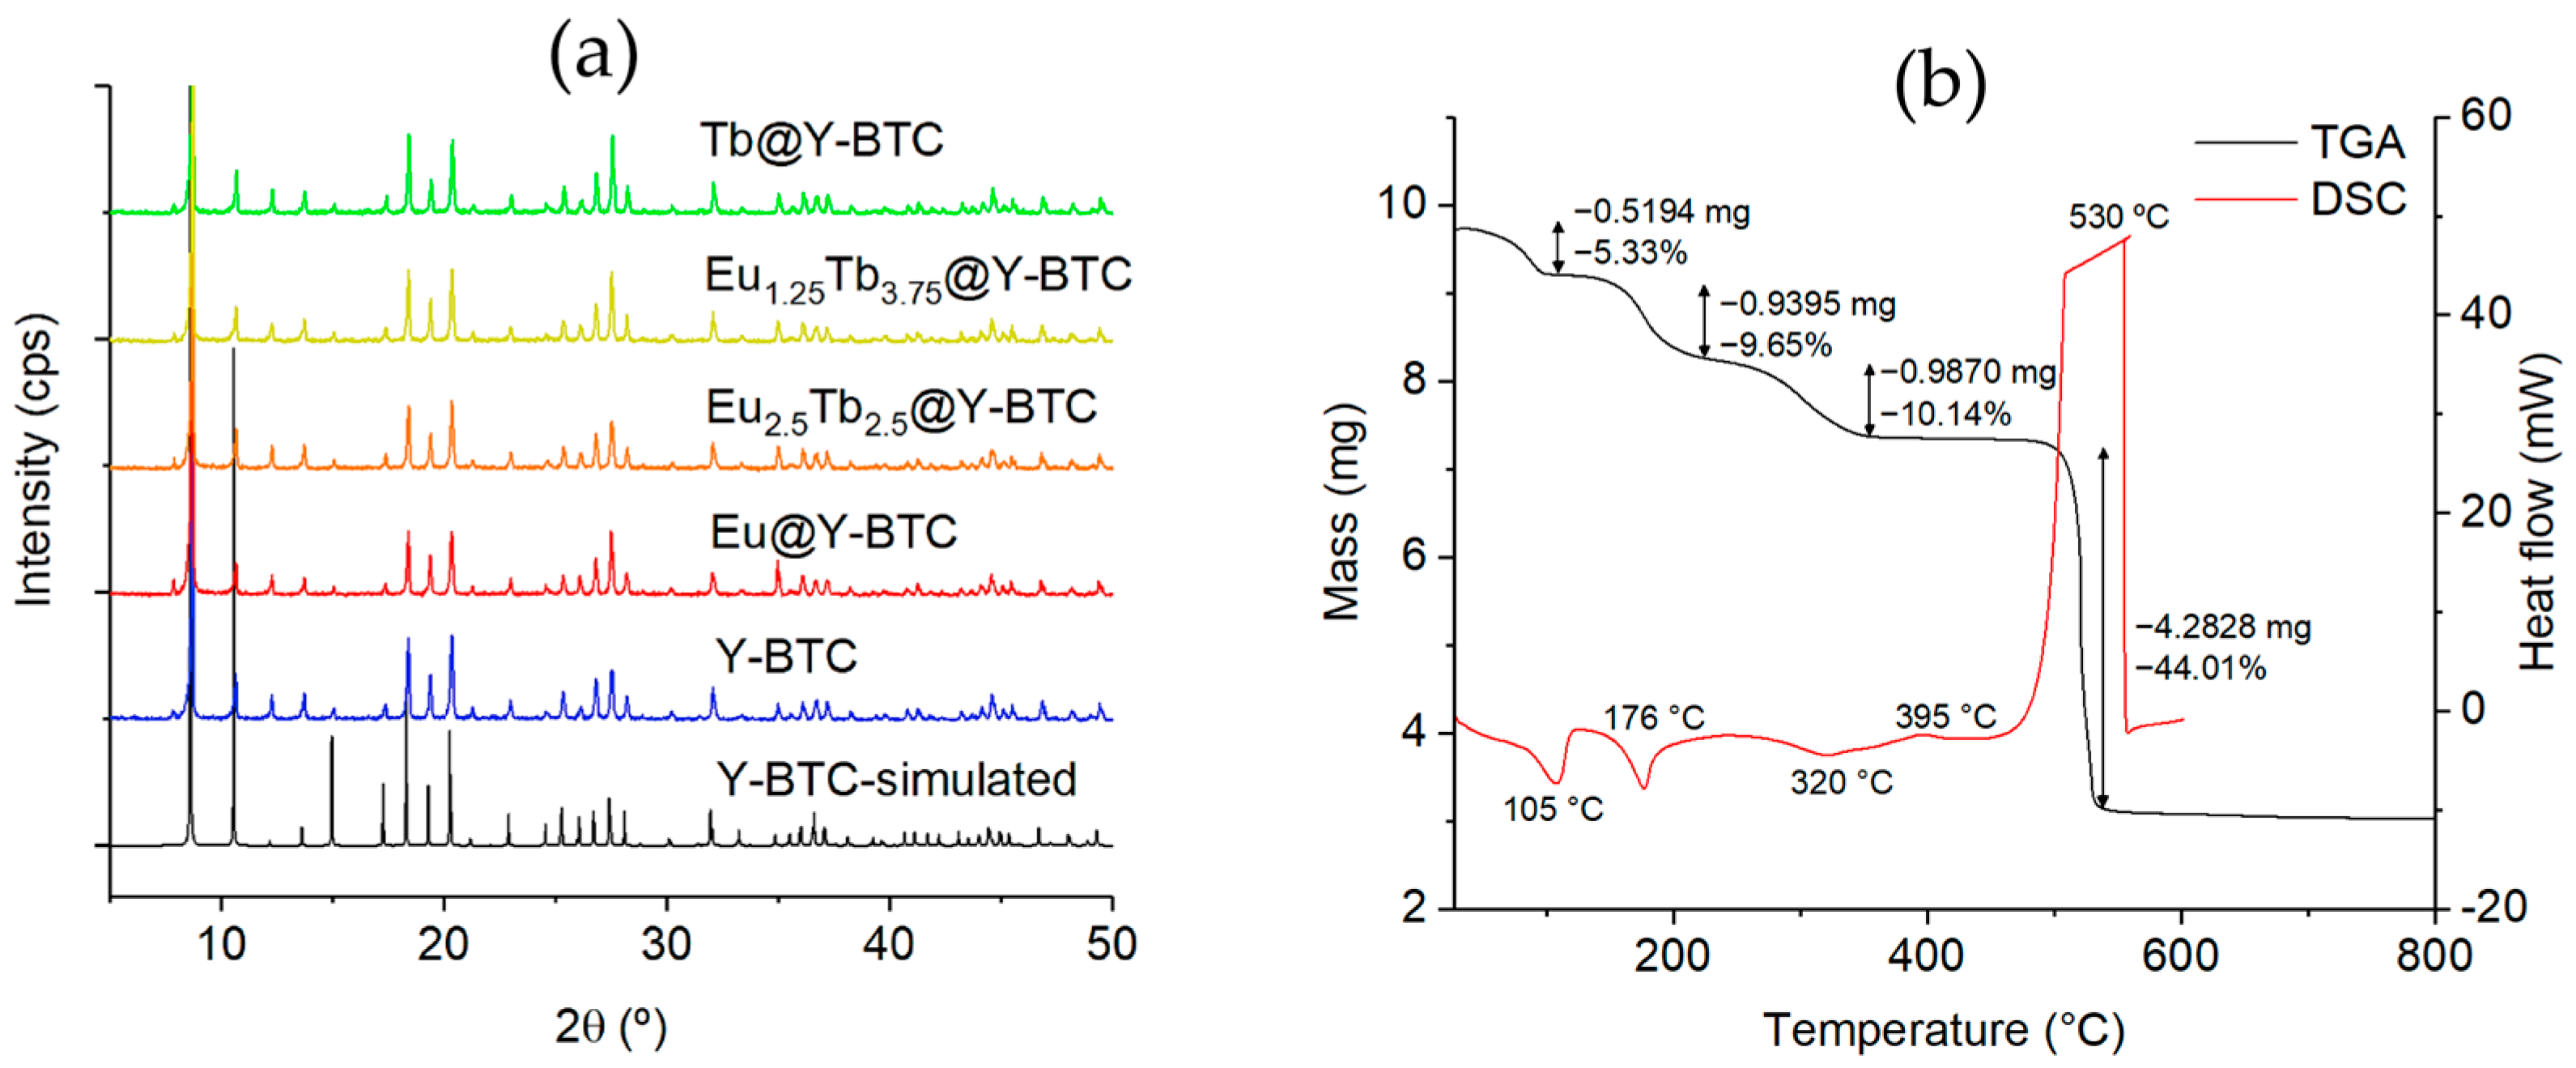
3.1. Synthesis
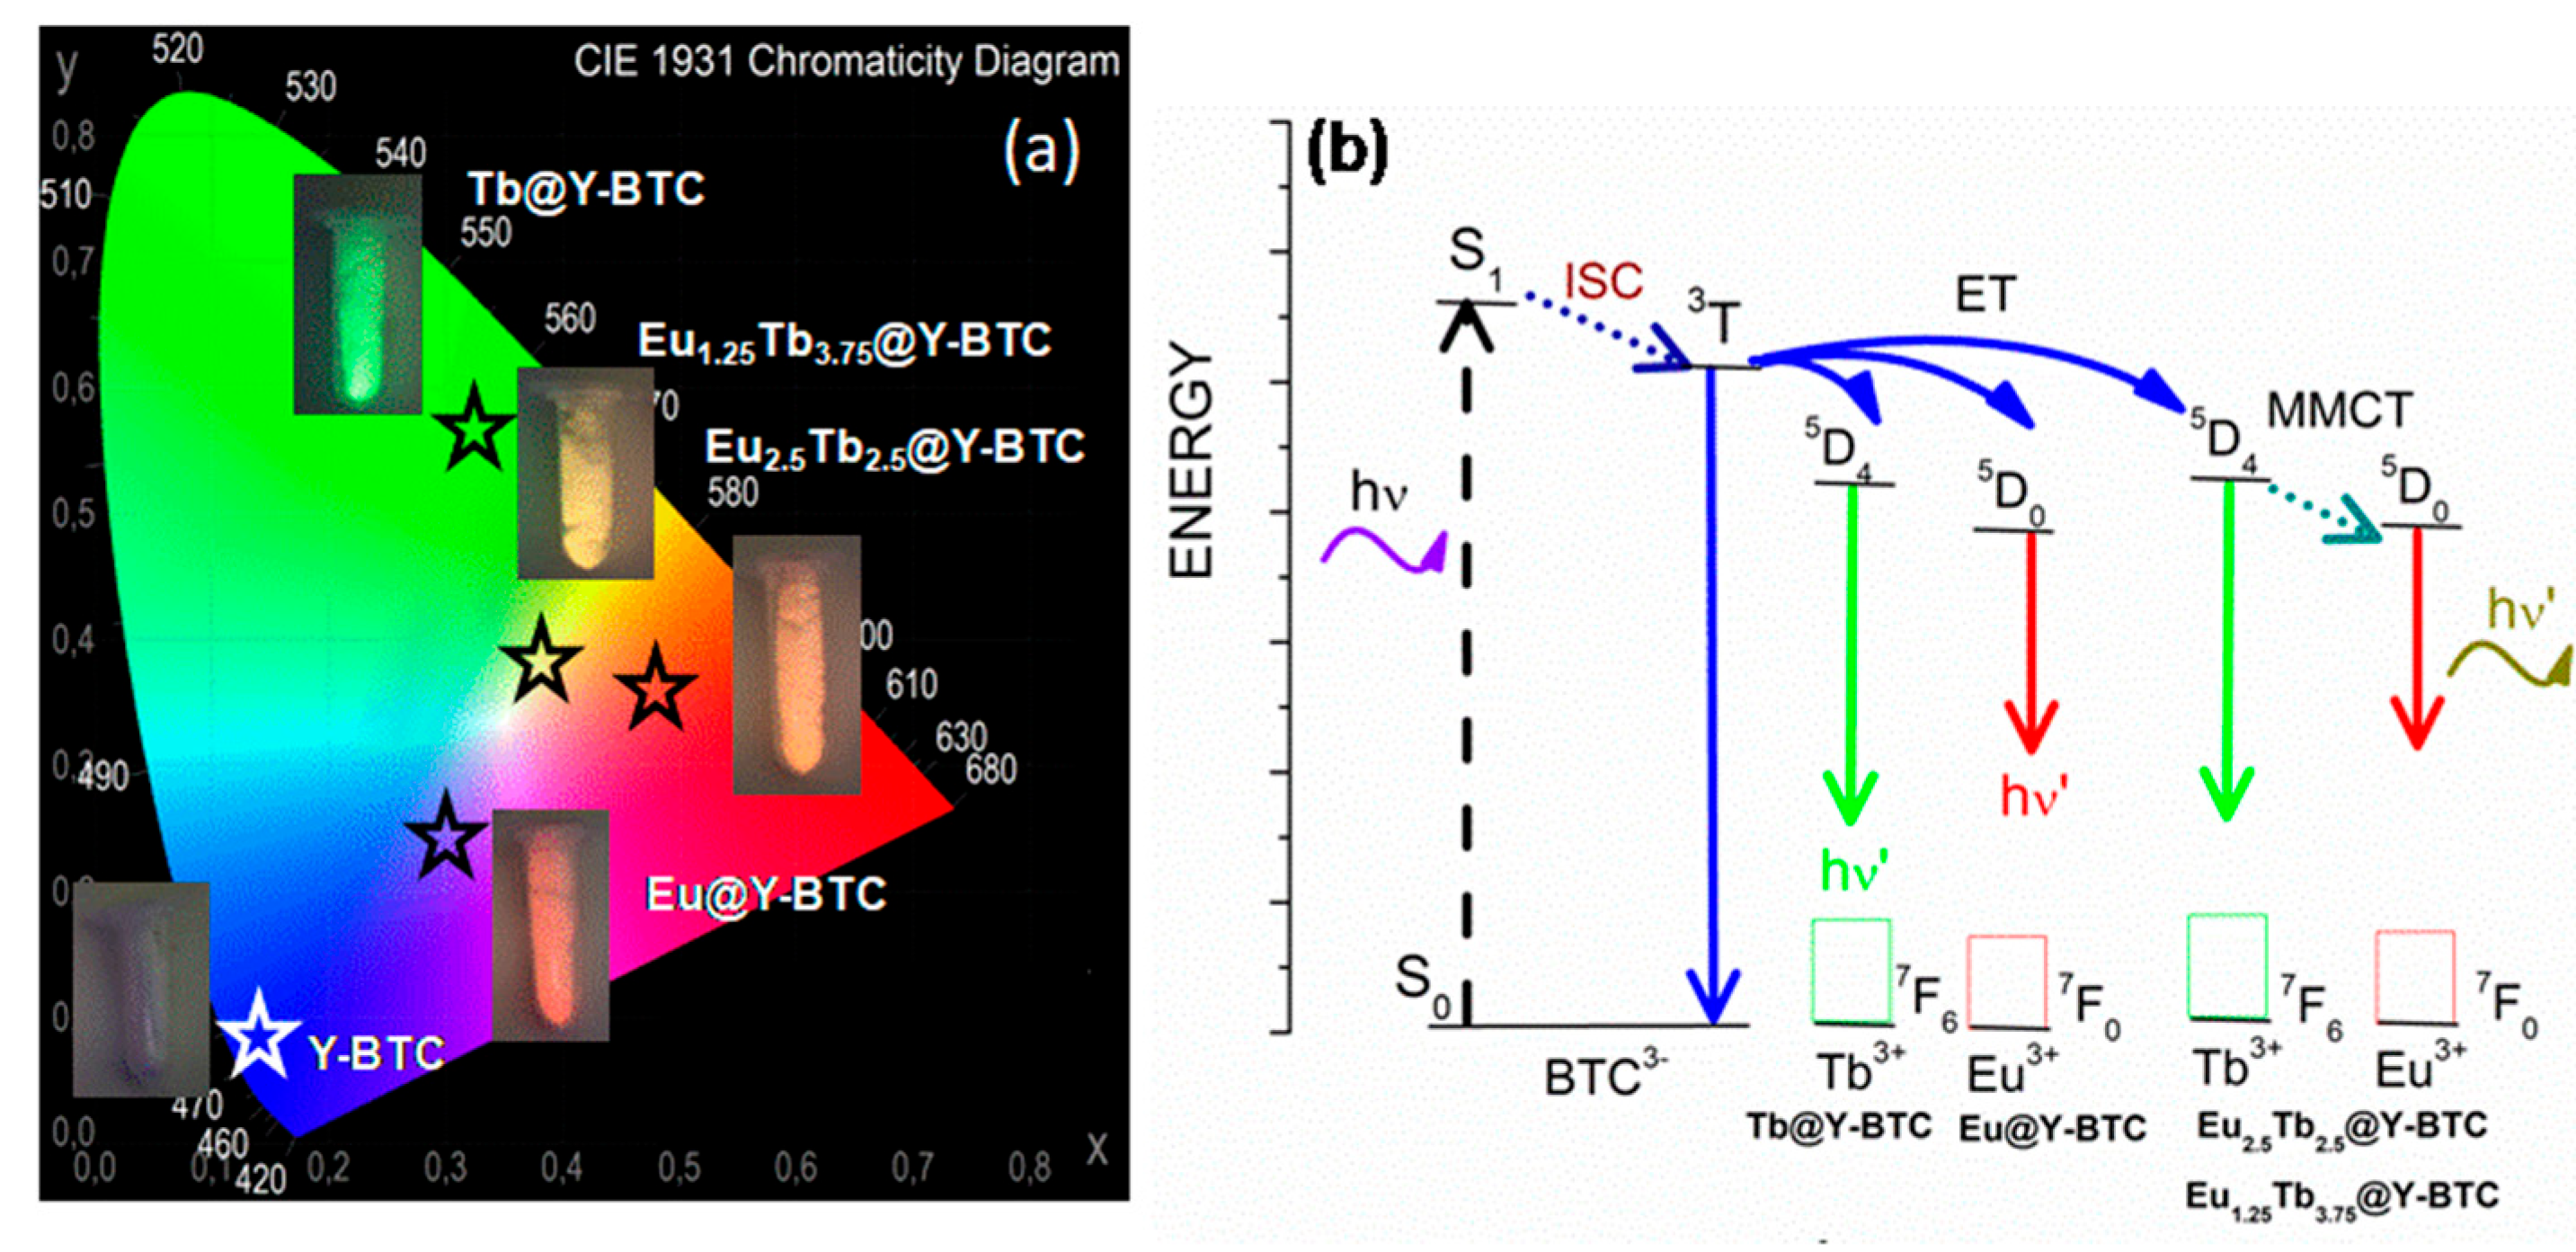
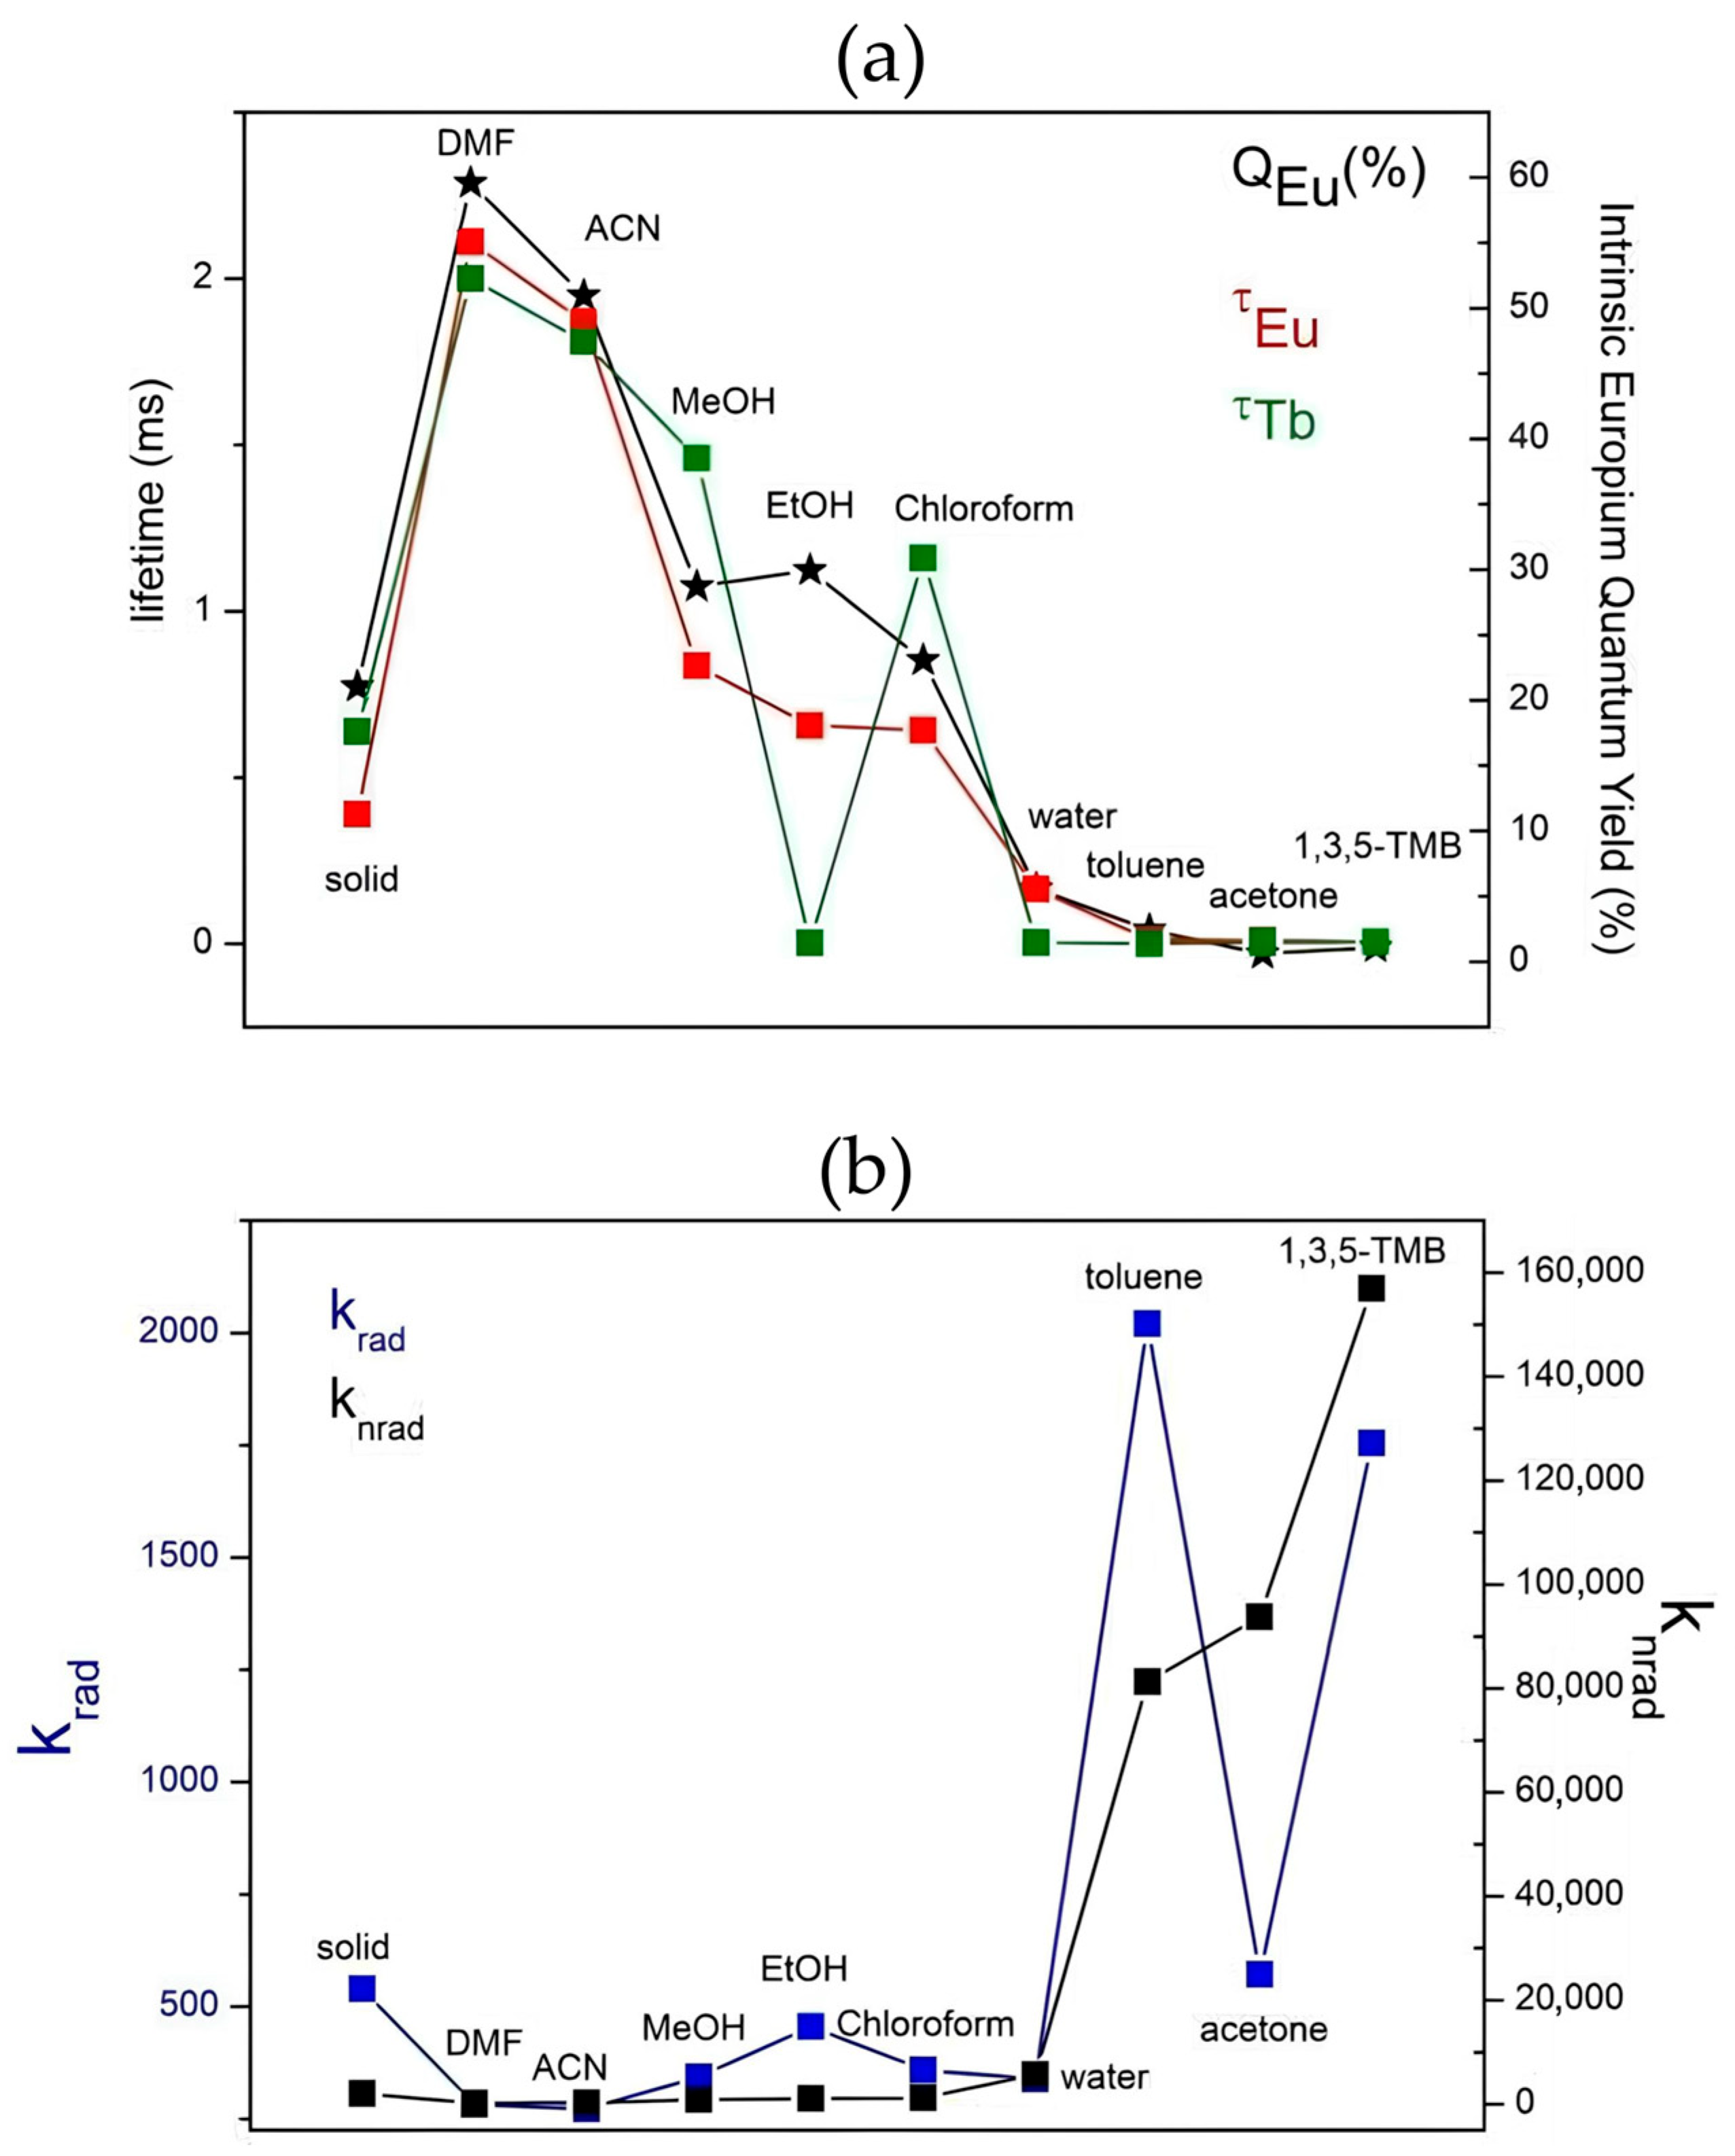
3.2. Photophysical Studies
4. Sensing Assays
5. Conclusions
Supplementary Materials
Author Contributions
Funding
Institutional Review Board Statement
Data Availability Statement
Acknowledgments
Conflicts of Interest
References
- Kumar, P.; Pournara, A.; Kim, K.-H.; Bansal, V.; Rapti, S.; Manos, M.J. Metal-Organic Frameworks: Challenges and Opportunities for Ion-Exchange/Sorption Applications. Prog. Mater. Sci. 2017, 86, 25–74. [Google Scholar] [CrossRef]
- Furukawa, H.; Cordova, K.E.; O’Keeffe, M.; Yaghi, O.M. The Chemistry and Applications of Metal-Organic Frameworks. Science 2013, 341, 1230444. [Google Scholar] [CrossRef]
- Qian, Q.; Asinger, P.A.; Lee, M.J.; Han, G.; Mizrahi Rodriguez, K.; Lin, S.; Benedetti, F.M.; Wu, A.X.; Chi, W.S.; Smith, Z.P. MOF-Based Membranes for Gas Separations. Chem. Rev. 2020, 120, 8161–8266. [Google Scholar] [CrossRef]
- Bavykina, A.; Kolobov, N.; Khan, I.S.; Bau, J.A.; Ramirez, A.; Gascon, J. Metal–Organic Frameworks in Heterogeneous Catalysis: Recent Progress, New Trends, and Future Perspectives. Chem. Rev. 2020, 120, 8468–8535. [Google Scholar] [CrossRef] [PubMed]
- Stavila, V.; Talin, A.A.; Allendorf, M.D. MOF-Based Electronic and Opto-Electronic Devices. Chem. Soc. Rev. 2014, 43, 5994–6010. [Google Scholar] [CrossRef]
- Li, H.; Jin, C.; Han, J.; Xi, L.; Song, Z. Tuning Nuclearity of Biradical-Ln Functional Compounds with Single-Molecule Magnet Behavior and Near-Infrared Luminescence. Cryst. Growth Des. 2023, 23, 612–619. [Google Scholar] [CrossRef]
- Claudio-Rizo, J.A.; Cano Salazar, L.F.; Flores-Guia, T.E.; Cabrera-Munguia, D.A. Estructuras Metal-Orgánicas (MOFs) Nanoestructuradas Para La Liberación Controlada de Fármacos. Mundo Nano. Rev. Interdiscip. Nanociencias Nanotecnología 2020, 14, 1e–29e. [Google Scholar] [CrossRef]
- Gomez, G.E.; Hamer, M.; Regiart, M.D.; Tortella, G.R.; Seabra, A.B.; Soler Illia, G.J.A.A.; Fernández-Baldo, M.A. Advances in Nanomaterials and Composites Based on Mesoporous Materials as Antimicrobial Agents: Relevant Applications in Human Health. Antibiotics 2024, 13, 173. [Google Scholar] [CrossRef]
- Zhou, H.-C.; Long, J.R.; Yaghi, O.M. Introduction to Metal–Organic Frameworks. Chem. Rev. 2012, 112, 673–674. [Google Scholar] [CrossRef]
- Shi, X.; Shan, Y.; Du, M.; Pang, H. Synthesis and Application of Metal-Organic Framework Films. Coord. Chem. Rev. 2021, 444, 214060. [Google Scholar] [CrossRef]
- Zhang, Y.; Chang, C.-H. Metal–Organic Framework Thin Films: Fabrication, Modification, and Patterning. Processes 2020, 8, 377. [Google Scholar] [CrossRef]
- Zhang, R.; Zhu, L.; Yue, B. Luminescent Properties and Recent Progress in Applications of Lanthanide Metal-Organic Frameworks. Chin. Chem. Lett. 2023, 34, 108009. [Google Scholar] [CrossRef]
- Song, X.-Z.; Song, S.-Y.; Zhang, H.-J. Luminescent Lanthanide Metal–Organic Frameworks; Springer: Berlin/Heidelberg, Germany, 2014; pp. 109–144. [Google Scholar]
- Gomez, G.E.; Roncaroli, F. Photofunctional Metal-Organic Framework Thin Films for Sensing, Catalysis and Device Fabrication. Inorganica Chim. Acta 2020, 513, 119926. [Google Scholar] [CrossRef]
- Herrera, F.C.; Caraballo, R.M.; Soler Illia, G.J.A.A.; Gomez, G.E.; Hamer, M. Sunlight-Driven Photocatalysis for a Set of 3D Metal–Porphyrin Frameworks Based on a Planar Tetracarboxylic Ligand and Lanthanide Ions. ACS Omega 2023, 8, 46777–46785. [Google Scholar] [CrossRef] [PubMed]
- SeethaLekshmi, S.; Ramya, A.R.; Reddy, M.L.P.; Varughese, S. Lanthanide Complex-Derived White-Light Emitting Solids: A Survey on Design Strategies. J. Photochem. Photobiol. C Photochem. Rev. 2017, 33, 109–131. [Google Scholar] [CrossRef]
- Rosi, N.L.; Kim, J.; Eddaoudi, M.; Chen, B.; O’Keeffe, M.; Yaghi, O.M. Rod Packings and Metal−Organic Frameworks Constructed from Rod-Shaped Secondary Building Units. J. Am. Chem. Soc. 2005, 127, 1504–1518. [Google Scholar] [CrossRef]
- Duan, T.-W.; Yan, B. Hybrids Based on Lanthanide Ions Activated Yttrium Metal–Organic Frameworks: Functional Assembly, Polymer Film Preparation and Luminescence Tuning. J. Mater. Chem. C 2014, 2, 5098–5104. [Google Scholar] [CrossRef]
- Jiang, C.; Wang, X.; Ouyang, Y.; Lu, K.; Jiang, W.; Xu, H.; Wei, X.; Wang, Z.; Dai, F.; Sun, D. Recent Advances in Metal–Organic Frameworks for Gas Adsorption/Separation. Nanoscale Adv. 2022, 4, 2077–2089. [Google Scholar] [CrossRef]
- Brunckova, H.; Mudra, E.; Shepa, I. Recent Advances in Lanthanide Metal–Organic Framework Thin Films Based on Eu, Tb, Gd: Preparation and Application as Luminescent Sensors and Light-Emitting Devices. Inorganics 2023, 11, 376. [Google Scholar] [CrossRef]
- Shen, Y.; Tissot, A.; Serre, C. Recent Progress on MOF-Based Optical Sensors for VOC Sensing. Chem. Sci. 2022, 13, 13978–14007. [Google Scholar] [CrossRef]
- Kau, N.; Jindal, G.; Kaur, R.; Rana, S. Progress in Development of Metal Organic Frameworks for Electrochemical Sensing of Volatile Organic Compounds. Results Chem. 2022, 4, 100678. [Google Scholar] [CrossRef]
- Afifa; Arshad, K.; Hussain, N.; Ashraf, M.H.; Saleem, M.Z. Air Pollution and Climate Change as Grand Challenges to Sustainability. Sci. Total Environ. 2024, 928, 172370. [Google Scholar] [CrossRef]
- Jin, X.; Wu, Y.; Santhamoorthy, M.; Nhi Le, T.T.; Le, V.T.; Yuan, Y.; Xia, C. Volatile Organic Compounds in Water Matrices: Recent Progress, Challenges, and Perspective. Chemosphere 2022, 308, 136182. [Google Scholar] [CrossRef] [PubMed]
- Paolin, E.; Strlič, M. Volatile Organic Compounds (VOCs) in Heritage Environments and Their Analysis: A Review. Appl. Sci. 2024, 14, 4620. [Google Scholar] [CrossRef]
- Epping, R.; Koch, M. On-Site Detection of Volatile Organic Compounds (VOCs). Molecules 2023, 28, 1598. [Google Scholar] [CrossRef] [PubMed]
- Han, B.; Rupam, T.H.; Chakraborty, A.; Saha, B.B. A Comprehensive Review on VOCs Sensing Using Different Functional Materials: Mechanisms, Modifications, Challenges and Opportunities. Renew. Sustain. Energy Rev. 2024, 196, 114365. [Google Scholar] [CrossRef]
- Okur, S.; Hashem, T.; Bogdanova, E.; Hodapp, P.; Heinke, L.; Bräse, S.; Wöll, C. Optimized Detection of Volatile Organic Compounds Utilizing Durable and Selective Arrays of Tailored UiO-66-X SURMOF Sensors. ACS Sens. 2024, 9, 622–630. [Google Scholar] [CrossRef]
- Cao, Y.; Fu, M.; Fan, S.; Gao, C.; Ma, Z.; Hou, D. Hydrophobic MOF/PDMS-Based QCM Sensors for VOCs Identification and Quantitative Detection in High-Humidity Environments. ACS Appl. Mater. Interfaces 2024, 16, 7721–7731. [Google Scholar] [CrossRef]
- Peng, X.; Wu, X.; Zhang, M.; Yuan, H. Metal–Organic Framework Coated Devices for Gas Sensing. ACS Sens. 2023, 8, 2471–2492. [Google Scholar] [CrossRef]
- Chen, J.; Zhang, R.; Guo, S.; Pan, Y.; Nezamzadeh-Ejhieh, A.; Lan, Q. Metal-Organic Frameworks (MOFs): A Review of Volatile Organic Compounds (VOCs) Detection. Talanta 2025, 286, 127498. [Google Scholar] [CrossRef]
- Liu, X.; Lin, K.; Chang, J. Modulation of Hydroxyapatite Crystals Formed from α-Tricalcium Phosphate by Surfactant-Free Hydrothermal Exchange. CrystEngComm 2011, 13, 1959–1965. [Google Scholar] [CrossRef]
- Jiang, H.-L.; Tsumori, N.; Xu, Q. A Series of (6,6)-Connected Porous Lanthanide−Organic Framework Enantiomers with High Thermostability and Exposed Metal Sites: Scalable Syntheses, Structures, and Sorption Properties. Inorg. Chem. 2010, 49, 10001–10006. [Google Scholar] [CrossRef]
- Frisch, M.J.; Trucks, G.W.; Schlegel, H.B.; Scuseria, G.E.; Robb, M.a.; Cheeseman, J.R.; Scalmani, G.; Barone, V.; Petersson, G.a.; Nakatsuji, H.; et al. G16_C01 2016, Gaussian 16, Revision C.01; Gaussian, Inc.: Wallingford, CT, USA, 2016. [Google Scholar]
- Chai, J.-D.; Head-Gordon, M. Long-Range Corrected Hybrid Density Functionals with Damped Atom–Atom Dispersion Corrections. Phys. Chem. Chem. Phys. 2008, 10, 6615. [Google Scholar] [CrossRef] [PubMed]
- Mardirossian, N.; Head-Gordon, M. Thirty Years of Density Functional Theory in Computational Chemistry: An Overview and Extensive Assessment of 200 Density Functionals. Mol. Phys. 2017, 115, 2315–2372. [Google Scholar] [CrossRef]
- Krishnan, R.; Binkley, J.S.; Seeger, R.; Pople, J.A. Self-Consistent Molecular Orbital Methods. XX. A Basis Set for Correlated Wave Functions. J. Chem. Phys. 1980, 72, 650–654. [Google Scholar] [CrossRef]
- Cramer, C.J. Essentials of Computational Chemistry: Theories and Models; Wiley: Hoboken, NJ, USA, 2004. [Google Scholar]
- Dreuw, A.; Head-Gordon, M. Single-Reference Ab Initio Methods for the Calculation of Excited States of Large Molecules. Chem. Rev. 2005, 105, 4009–4037. [Google Scholar] [CrossRef]
- Tomasi, J.; Mennucci, B.; Cammi, R. Quantum Mechanical Continuum Solvation Models. Chem. Rev. 2005, 105, 2999–3094. [Google Scholar] [CrossRef]
- Casida, M.E. Time-Dependent Density Functional Response Theory for Molecules. Recent Adv. Density Funct. Methods 1995, 155–192. [Google Scholar] [CrossRef]
- Cui, Y.; Yue, Y.; Qian, G.; Chen, B. Luminescent Functional Metal–Organic Frameworks. Chem. Rev. 2012, 112, 1126–1162. [Google Scholar] [CrossRef]
- Cui, Y.; Xu, H.; Yue, Y.; Guo, Z.; Yu, J.; Chen, Z.; Gao, J.; Yang, Y.; Qian, G.; Chen, B. A Luminescent Mixed-Lanthanide Metal–Organic Framework Thermometer. J. Am. Chem. Soc. 2012, 134, 3979–3982. [Google Scholar] [CrossRef]
- Li, H.; Jing, P.; Lu, J.; Xi, L.; Wang, Q.; Ding, L.; Wang, W.-M.; Song, Z. Multifunctional Properties of {CuII2LnIII2} Systems Involving Nitrogen-Rich Nitronyl Nitroxide: Single-Molecule Magnet Behavior, Luminescence, Magnetocaloric Effects and Heat Capacity. Dalt. Trans. 2021, 50, 2854–2863. [Google Scholar] [CrossRef] [PubMed]
- Chen, D.; Sedykh, A.E.; Gomez, G.E.; Neumeier, B.L.; Santos, J.C.C.; Gvilava, V.; Maile, R.; Feldmann, C.; WÖll, C.; Janiak, C.; et al. SURMOF Devices Based on Heteroepitaxial Architectures with White-Light Emission and Luminescent Thermal-Dependent Performance. Adv. Mater. Interfaces 2020, 7, 2000929. [Google Scholar] [CrossRef]
- Munirathnam, K.; Dillip, G.R.; Ramesh, B.; Joo, S.W.; Prasad Raju, B.D. Synthesis, Photoluminescence and Thermoluminescence Properties of LiNa3P2O7:Tb3+ Green Emitting Phosphor. J. Phys. Chem. Solids 2015, 86, 170–176. [Google Scholar] [CrossRef]
- Available online: https://sciapps.sci-sim.com/ (accessed on 2 December 2024).
- Gomez, G.E.; Bernini, M.C.; Brusau, E.V.; Narda, G.E.; Vega, D.; Kaczmarek, A.M.; Van Deun, R.; Nazzarro, M. Layered Exfoliable Crystalline Materials Based on Sm-, Eu- and Eu/Gd-2-Phenylsuccinate Frameworks. Crystal Structure, Topology and Luminescence Properties. Dalt. Trans. 2015, 44, 3417–3429. [Google Scholar] [CrossRef] [PubMed]
- Chauvin, A.; Gumy, F.; Imbert, D.; Bünzli, J.G. Europium and Terbium Tris (Dipicolinates) as Secondary Standards for Quantum Yield Determination. Spectrosc. Lett. 2004, 37, 517–532. [Google Scholar] [CrossRef]
- Chen, B.; Yang, Y.; Zapata, F.; Lin, G.; Qian, G.; Lobkovsky, E.B. Luminescent Open Metal Sites within a Metal–Organic Framework for Sensing Small Molecules. Adv. Mater. 2007, 19, 1693–1696. [Google Scholar] [CrossRef]
- Xu, H.; Rao, X.; Gao, J.; Yu, J.; Wang, Z.; Dou, Z.; Cui, Y.; Yang, Y.; Chen, B.; Qian, G. A Luminescent Nanoscale Metal–Organic Framework with Controllable Morphologies for Spore Detection. Chem. Commun. 2012, 48, 7377. [Google Scholar] [CrossRef]
- Chen, B.; Wang, L.; Zapata, F.; Qian, G.; Lobkovsky, E.B. A Luminescent Microporous Metal−Organic Framework for the Recognition and Sensing of Anions. J. Am. Chem. Soc. 2008, 130, 6718–6719. [Google Scholar] [CrossRef]
- Asad, M.; Anwar, M.I.; Miao, B.; Abbas, A.; Majeed, S.; Mir, I.A.; Rabbani, M.S.; Hussain, S.; Xu, S.; Al-Tahan, M.A.; et al. Recent Advances in Luminescent Metal-Organic Frameworks (L-MOFs) as Sustainable Materials for Sensing of Potentially Toxic Environmental Ubiquitous Explosive Contaminants. Sustain. Mater. Technol. 2024, 42, e01155. [Google Scholar] [CrossRef]
- Trannoy, V.; Carneiro Neto, A.N.; Brites, C.D.S.; Carlos, L.D.; Serier-Brault, H. Engineering of Mixed Eu3+ /Tb3+ Metal-Organic Frameworks Luminescent Thermometers with Tunable Sensitivity. Adv. Opt. Mater. 2021, 9, 2001938. [Google Scholar] [CrossRef]
- Wang, X.; Ma, T.; Ma, J.-G.; Cheng, P. Integration of Devices Based on Metal–Organic Frameworks: A Promising Platform for Chemical Sensing. Coord. Chem. Rev. 2024, 518, 216067. [Google Scholar] [CrossRef]
- Godoy, A.A.; Gomez, G.E.; Kaczmarek, A.M.; Van Deun, R.; Furlong, O.J.; Gándara, F.; Monge, M.A.; Bernini, M.C.; Narda, G.E. Sensing Properties, Energy Transfer Mechanism and Tuneable Particle Size Processing of Luminescent Two-Dimensional Rare Earth Coordination Networks. J. Mater. Chem. C 2017, 5, 12409–12421. [Google Scholar] [CrossRef]
- Piguet, C.; Buenzli, J.C.G.; Bernardinelli, G.; Hopfgartner, G.; Williams, A.F. Self-Assembly and Photophysical Properties of Lanthanide Dinuclear Triple-Helical Complexes. J. Am. Chem. Soc. 1993, 115, 8197–8206. [Google Scholar] [CrossRef]
- Hybrid Materials: Synthesis, Characterization, and Applications; Kickelbick, G., Ed.; Wiley-VCH Verlag GmbH & Co.: Weinheim, Germany, 2007. [Google Scholar]
- Meng, D.; Zhao, T.; Busko, D.; Cosgun Ergene, A.; Richards, B.S.; Howard, I.A. Tb and Eu in MOF-76: Elucidating the Mechanisms Responsible for the Divergent Excellent and Poor Photoluminescence Quantum Yields. Adv. Opt. Mater. 2024, 12, 2300867. [Google Scholar] [CrossRef]
- Gomez, G.E.; dos Santos Afonso, M.; Baldoni, H.A.; Roncaroli, F.; Soler-Illia, G.J.A.A. Luminescent Lanthanide Metal Organic Frameworks as Chemosensing Platforms towards Agrochemicals and Cations. Sensors 2019, 19, 1260. [Google Scholar] [CrossRef]


| Sample | CIE Chromaticity from the Entire Spectrum | CCT (K) | CIE Chromaticity from the Dominant Wavelength | Color Purity (%) | ||
|---|---|---|---|---|---|---|
| x | y | xd | yd | |||
| Y-BTC | 0.144 | 0.07 | 1937.4 | 0.17 | 0.006 | 89.97 |
| Eu@Y-BTC | 0.281 | 0.25 | 13,546.5 | 0.68 | 0.31 | 21.28 |
| Tb@Y-BTC | 0.319 | 0.545 | 5770.3 | 0.26 | 0.73 | 55.75 |
| Eu2.5Tb2.5@Y-BTC | 0.474 | 0.354 | 2028.6 | 0.68 | 0.31 | 45.11 |
| Eu1.25Tb3.75@Y-BTC | 0.384 | 0.373 | 3884.2 | 0.68 | 0.31 | 25.76 |
| Compound | Itot/IMD | τrad/ms | krad/s−1 | kexp/s−1 | knrad/s−1 | τobs/ms | QEu (%) |
|---|---|---|---|---|---|---|---|
| Eu@Y-BTC | 14.52 | 1.39 | 718.1 | 3571.42 | 2853.32 | 0.28 | 20.1 |
| Eu2.5Tb2.5@Y-BTC | 9.58 | 2.11 | 474.05 | 3508.77 | 3034.71 | 0.285 | 13.51 |
| Eu1.25Tb3.75@Y-BTC | 10.9 | 1.85 | 539.33 | 2564.1 | 2024.76 | 0.39 | 21.03 |
| Analyte | HOMOa | LUMOa | HOMOb | LUMOb | ΔHLa | ΔHLb | ΔHLtot. |
|---|---|---|---|---|---|---|---|
| ACN | −4.8533 | 1.4235 | −8.0813 | −2.0437 | 6.2771 | 6.0392 | 2.8091 |
| DMF | −4.8173 | 1.3894 | −8.1367 | −2.1077 | 6.2064 | 6.0303 | 2.7096 |
| Chloroform | −3.0479 | 2.988 | −6.3256 | −0.338 | 6.0375 | 5.988 | 2.7096 |
| Methanol | −4.7804 | 1.425 | −8.0983 | −2.0716 | 6.206 | 6.0294 | 2.7093 |
| Water | −5.0072 | 1.2801 | −8.2273 | −2.1854 | 6.2876 | 6.0433 | 2.8214 |
| Ethanol | −4.6893 | 1.515 | −8.0041 | −1.9833 | 6.2046 | 6.0227 | 2.7063 |
| Toluene | −1.0325 | 4.6158 | −4.2754 | 1.6907 | 5.648 | 5.9665 | 2.7232 |
| Acetone | −4.6073 | 1.5966 | −7.9209 | −1.9015 | 6.204 | 5.9204 | 2.706 |
| 1,3,5-TMB | −0.6353 | 4.5709 | −4.0302 | 2.2521 | 5.2067 | 6.2826 | 2.8865 |
| Analyte | HOMOα (eV) | LUMOα (eV) | T1 Energy (eV) | Relevance to Tb3+ |
|---|---|---|---|---|
| ACN | −4.85 | 1.42 | 6.27 | “T1 >> Tb3⁺ 5D4 (~2.5–2.7 eV); efficient energy transfer” |
| DMF | −4.82 | 1.39 | 6.21 | “Similar to ACN” |
| Methanol | −4.78 | 1.43 | 6.21 | “enough T1 energy for Tb3⁺ sensitization” |
| Chloroform | −3.05 | 2.99 | 6.04 | “High T1 ensures PET despite moderate HOMOα” |
| Solvent | HOMOα (eV) | LUMOα (eV) | T1 Energy (eV) | Primary Quenching Mechanism | Relevance to Tb3+ |
|---|---|---|---|---|---|
| Acetone | −4.61 | 1.6 | 6.21 | “PET (HOMOα ≈ −4.7 eV)” | “PET competes with energy transfer (T1 > 5D4)” |
| Ethanol | −4.69 | 1.52 | 6.21 | “Marginal PET competition” | “Similar to acetone” |
| Water | −5.01 | 1.28 | 6.29 | “Solvent-induced non-radiative decay” | “Polarity disrupts T1 state for both ions” |
| Toluene | −1.03 | 4.62 | 5.65 | “Strong PET (high HOMOα)” | “PET dominates despite T1 > 5D4” |
| 1,3,5-TMB | −0.64 | 4.57 | 5.21 | “Extreme PET (very high HOMOα)” | “PET overrides energy transfer” |
Disclaimer/Publisher’s Note: The statements, opinions and data contained in all publications are solely those of the individual author(s) and contributor(s) and not of MDPI and/or the editor(s). MDPI and/or the editor(s) disclaim responsibility for any injury to people or property resulting from any ideas, methods, instructions or products referred to in the content. |
© 2025 by the authors. Licensee MDPI, Basel, Switzerland. This article is an open access article distributed under the terms and conditions of the Creative Commons Attribution (CC BY) license (https://creativecommons.org/licenses/by/4.0/).
Share and Cite
Rosas Rivas, O.; Hamer, M.; Baldoni, H.A.; Boone, M.; Van Deun, R.; Gomez, G.E. Engineering Photoluminescence of Lanthanide Doped Yttrium-MOF-76 for Volatile Organic Compound Sensing. Polymers 2025, 17, 1135. https://doi.org/10.3390/polym17091135
Rosas Rivas O, Hamer M, Baldoni HA, Boone M, Van Deun R, Gomez GE. Engineering Photoluminescence of Lanthanide Doped Yttrium-MOF-76 for Volatile Organic Compound Sensing. Polymers. 2025; 17(9):1135. https://doi.org/10.3390/polym17091135
Chicago/Turabian StyleRosas Rivas, Oswaldo, Mariana Hamer, Héctor A. Baldoni, Maya Boone, Rik Van Deun, and Germán E. Gomez. 2025. "Engineering Photoluminescence of Lanthanide Doped Yttrium-MOF-76 for Volatile Organic Compound Sensing" Polymers 17, no. 9: 1135. https://doi.org/10.3390/polym17091135
APA StyleRosas Rivas, O., Hamer, M., Baldoni, H. A., Boone, M., Van Deun, R., & Gomez, G. E. (2025). Engineering Photoluminescence of Lanthanide Doped Yttrium-MOF-76 for Volatile Organic Compound Sensing. Polymers, 17(9), 1135. https://doi.org/10.3390/polym17091135