Abstract
This paper presents a study on the load carrying capacity of reinforced concrete (RC) beams strengthened with externally bonded (EB) carbon fiber reinforced polymer (CFRP) strips prestressed up to 0.6% in strain. At the strip ends, the innovative gradient anchorage is used instead of conventional mechanical fasteners. This method, based on the epoxy resin’s ability to rapidly cure under high temperatures, foresees a sector-wise heating followed by a gradual decrease of the initial prestress force towards the strip ends. The experimental investigation shows a promising structural behavior, resulting in high strip tensile strains, eventually almost reaching tensile failure of the composite strip. Additionally, ductility when considering deflection at steel yielding and at ultimate load is satisfying, too. From a practical point of view, it is demonstrated that premature strip grinding in the anchorage zone is not beneficial. In addition, a non-commercial 1D finite element code has been enlarged to an EB reinforcement with prestressed composite strips. A bilinear bond stress-slip relation obtained in earlier investigations is introduced as an additional failure criterion to the code. The numerical code is able to almost perfectly predict the Polymers 2014, 6 115 overall structural behavior. Furthermore, the calculations are used for comparison purposes between an initially unstressed and a prestressed externally bonded composite reinforcement. The increase in cracking and yielding load, as well as differences in structural stiffness are apparent.
1. Introduction
Nowadays, structural strengthening with externally bonded (EB) carbon fiber reinforced polymer (CFRP) strips has been considered as the state-of-the-art for more than three decades of application in the field [1,2]. Prestressing the externally bonded reinforcements represents a newer way of using the same material(s), however, with the difference of exploiting its excellent mechanical properties, such as high tensile strength, in a more efficient way [3].
An overlaying question is the anchorage issue. Similar to conventional external prestressing with steel cables, prestressed CFRP also needs end-anchorage in order to guarantee an adequate force transfer to the structure. At the moment, most available solutions on the market are partially mechanical anchorages based on anchor bolts and plates (see Figure 1a). In terms of structural behavior in flexion, prestressed strips usually have a direct influence on the cracking, yielding and ultimate load carrying capacity. Experimental investigations on reinforced and prestressed reinforced concrete members with mechanical anchorages are amongst other things presented by Pellegrino and Modena [4], El-Hacha et al. [5,6], França and Costa [7] and Fernandes et al. [8].
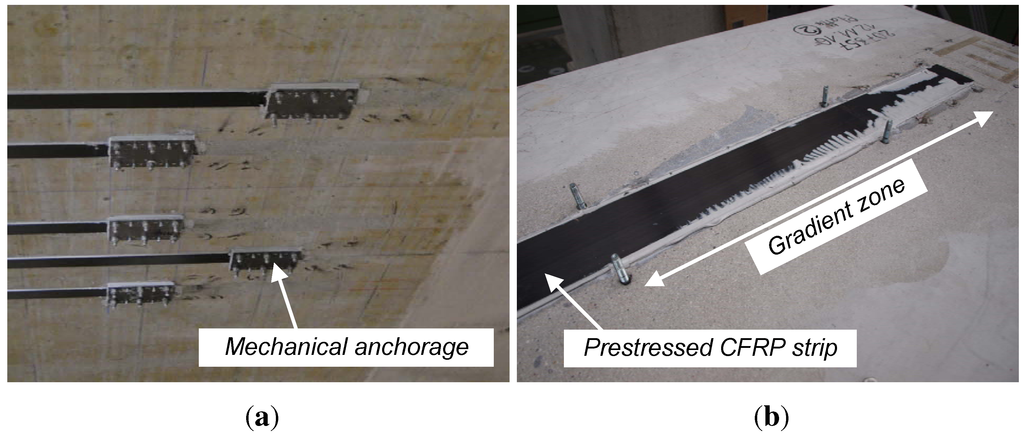
Figure 1.
(a) Mechanical anchorage and (b) gradient anchorage for prestressed carbon fiber reinforced polymer (CFRP) strips.
Figure 1.
(a) Mechanical anchorage and (b) gradient anchorage for prestressed carbon fiber reinforced polymer (CFRP) strips.
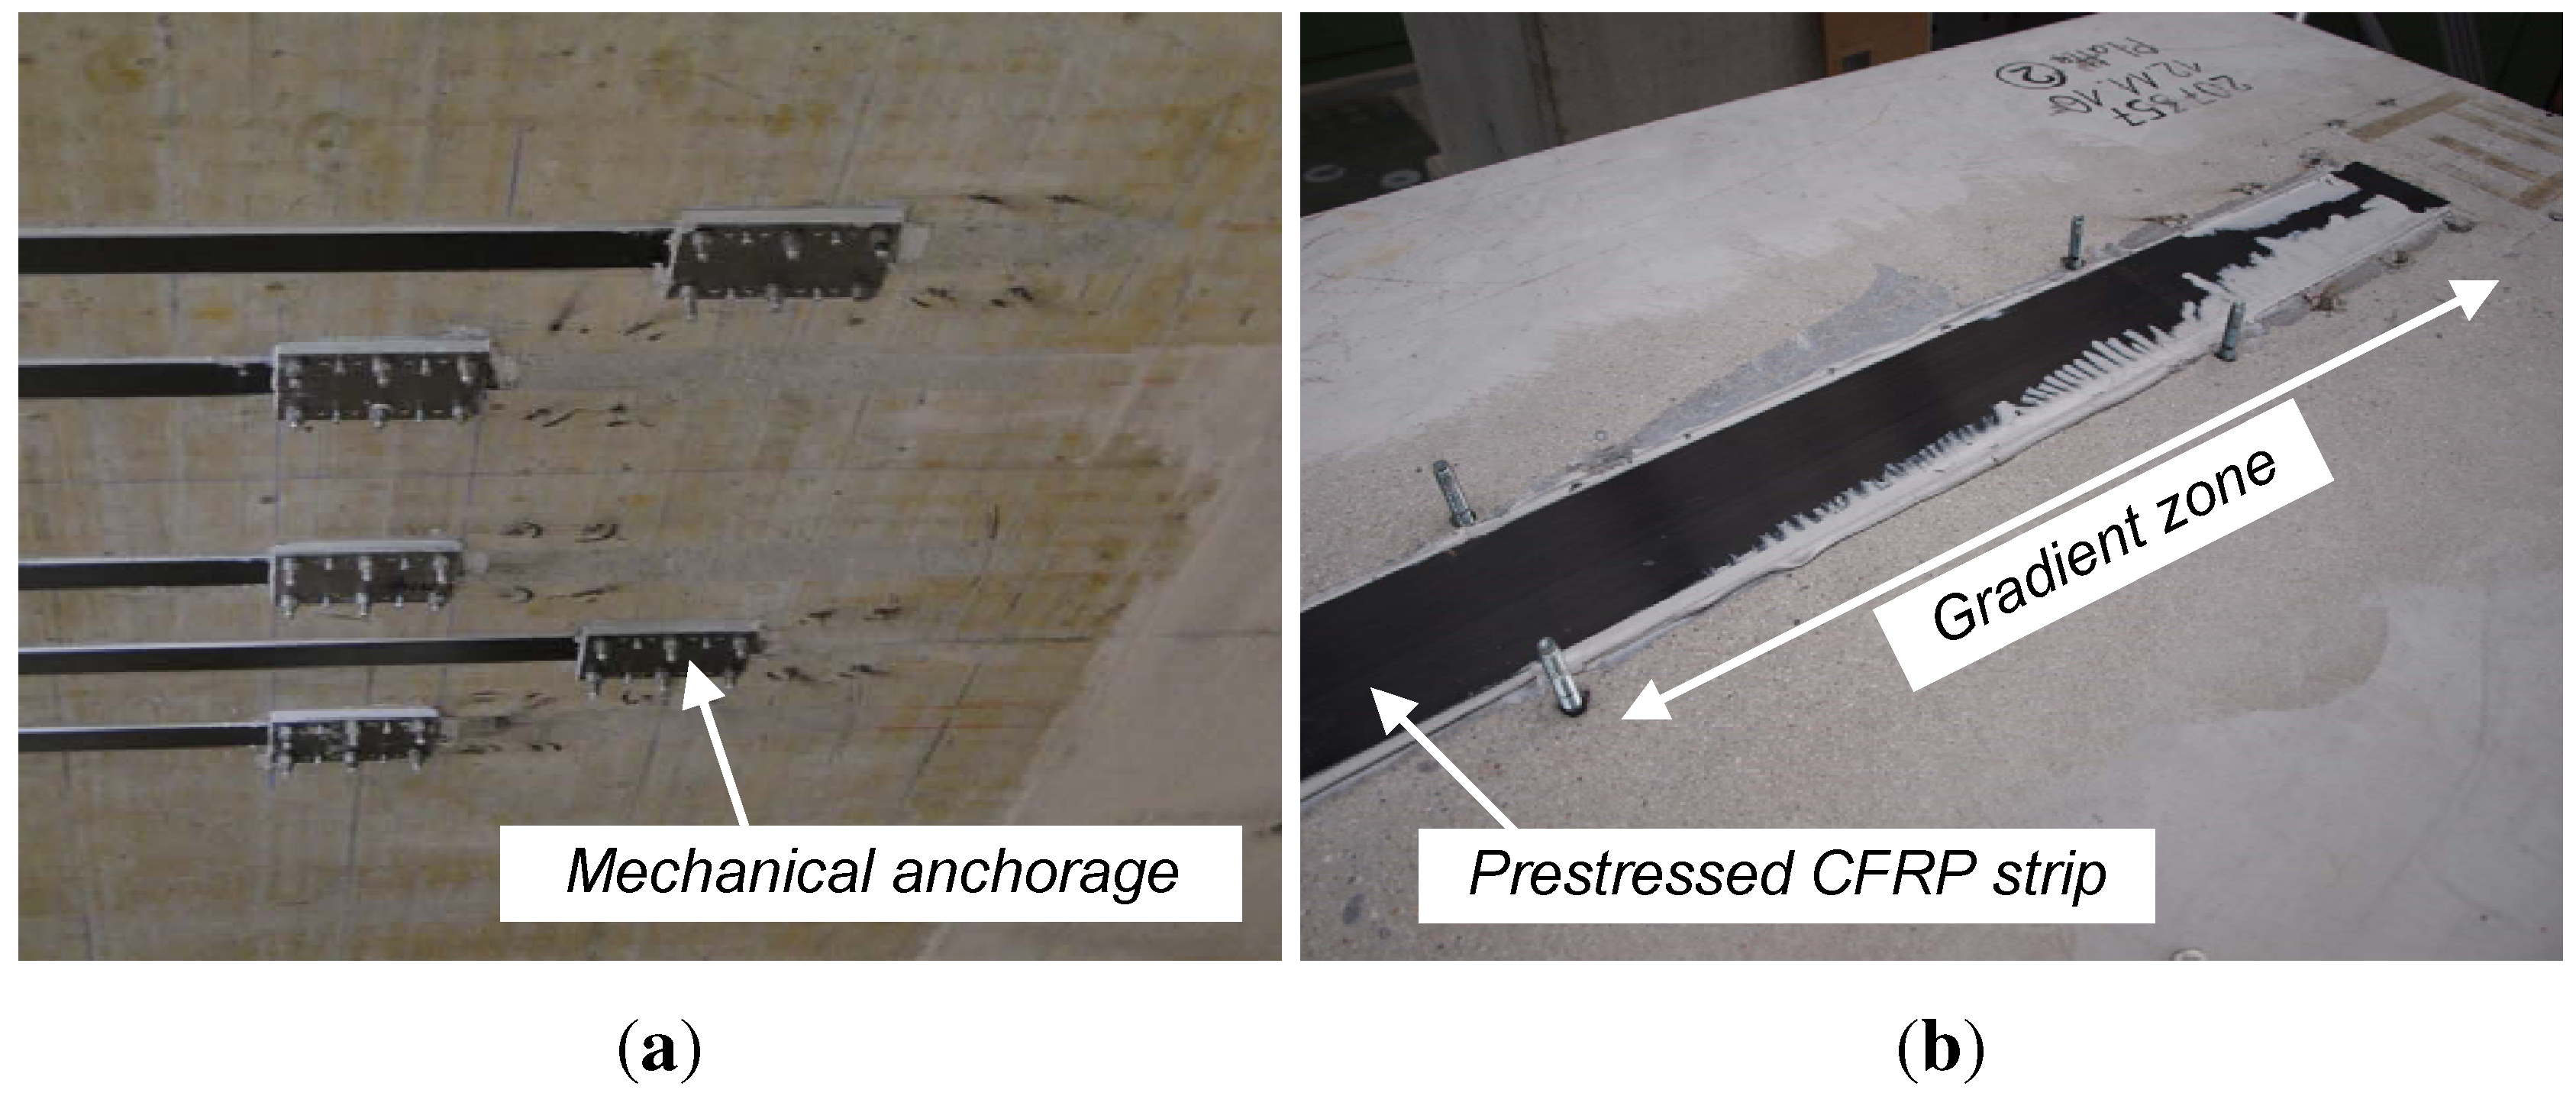
An alternative anchorage technique is the “gradient anchorage” (Figure 1b) developed at Empa [3,9]. This method is based on the possibility for the accelerated curing of the epoxy resin [10,11,12,13]. Each curing sequence is followed by a partial prestress force release until no pressure in the hydraulic jack remains at both strip ends. At the end, the temporary anchor bolts for the installation of the different components are cut. A pure strip-epoxy-concrete anchorage is the result. With this technique, the application time compared to conventional systems is reduced. Additionally, the end appearance is more appealing and corrosion is avoided, due to the absence of remaining metallic devices.
An early prototype of the heating device necessary for creating high temperatures in the resin has been successfully applied at the laboratory level. The system is presented in Meier et al. [3], Stöcklin and Meier [9], Czaderski and Motavalli [14], Kotynia et al. [15] and Motavalli et al. [16]. In a recently completed research project with strong industry collaboration of S&P Clever Reinforcement (Seewen, Switzerland), a newer and more suitable system for practical application on-site has been developed and extensively presented in Michels et al. [17,18].
The present manuscript describes, in the first step, a short amount of information about the prestressing procedure together with the subsequent results from the static loading tests. Whereas, in an earlier publication [18], force-deflection curves already have been presented, this paper delivers more extensive information about the failure mode, as well as the strain levels of both the CFRP strip and the concrete in compression. Furthermore, the image correlation measurement in the anchorage zone delivers information about the epoxy layer thickness in this region. In the second step, a non-commercial 1D finite element code is used for modeling the experiments, as well as for performing a parametric study. This manuscript is an extended version of a conference paper presented at the 2nd conference on Smart Monitoring, Assessment and Retrofitting of Civil Structures (SMAR) in Istanbul, 2013 [19].
2. Experimental Investigations
2.1. Beam Geometry and Materials
All four beams have a total length of 6.5 m and a rectangular cross-section of 1000 ⋅ 220 mm2. Both upper and lower longitudinal inner reinforcement are 7Ø8-mm steel bars. Stirrups with a diameter of Ø8 are installed every 150 mm, except in the central part of a 1200 mm length free of shear load (see Figure 2). A summary of the yielding, Rp,0.2, and ultimate strength, Rm, of the longitudinal reinforcement steel is given in Table 1.
Compressive strength on a cube of concrete after 28 days, as well as on the testing day (fcm,cube,28 and fcm,cube,test, respectively) is shown in Table 2. Since no concrete cubes were available for Beam 4 on the testing day, strength was estimated according to fib-bulletin 1 [20]. According to the distributor’s technical data sheet [21], the ultimate tensile strength, ff,u, of the CFRP is 2544 MPa with an elastic modulus, Ef, of 157.8 GPa. Commercial adhesive S&P 220 [22] is used for bonding the strips to the concrete substrate.
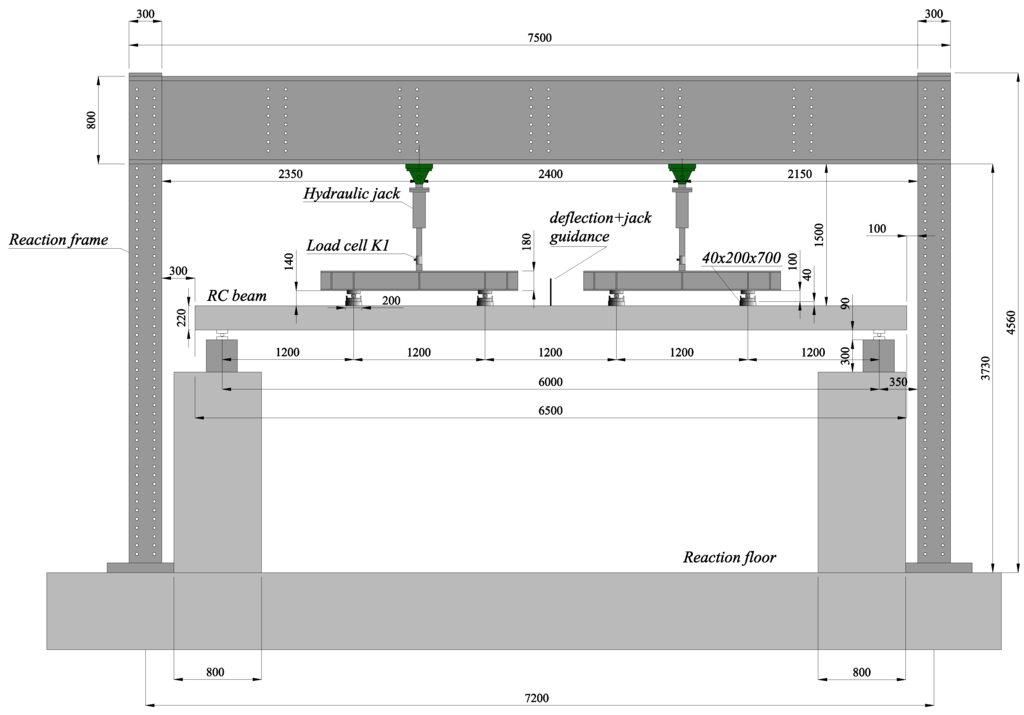
Figure 2.
The test setup for the six-point bending beam tests (dimensions in (mm)).
Figure 2.
The test setup for the six-point bending beam tests (dimensions in (mm)).
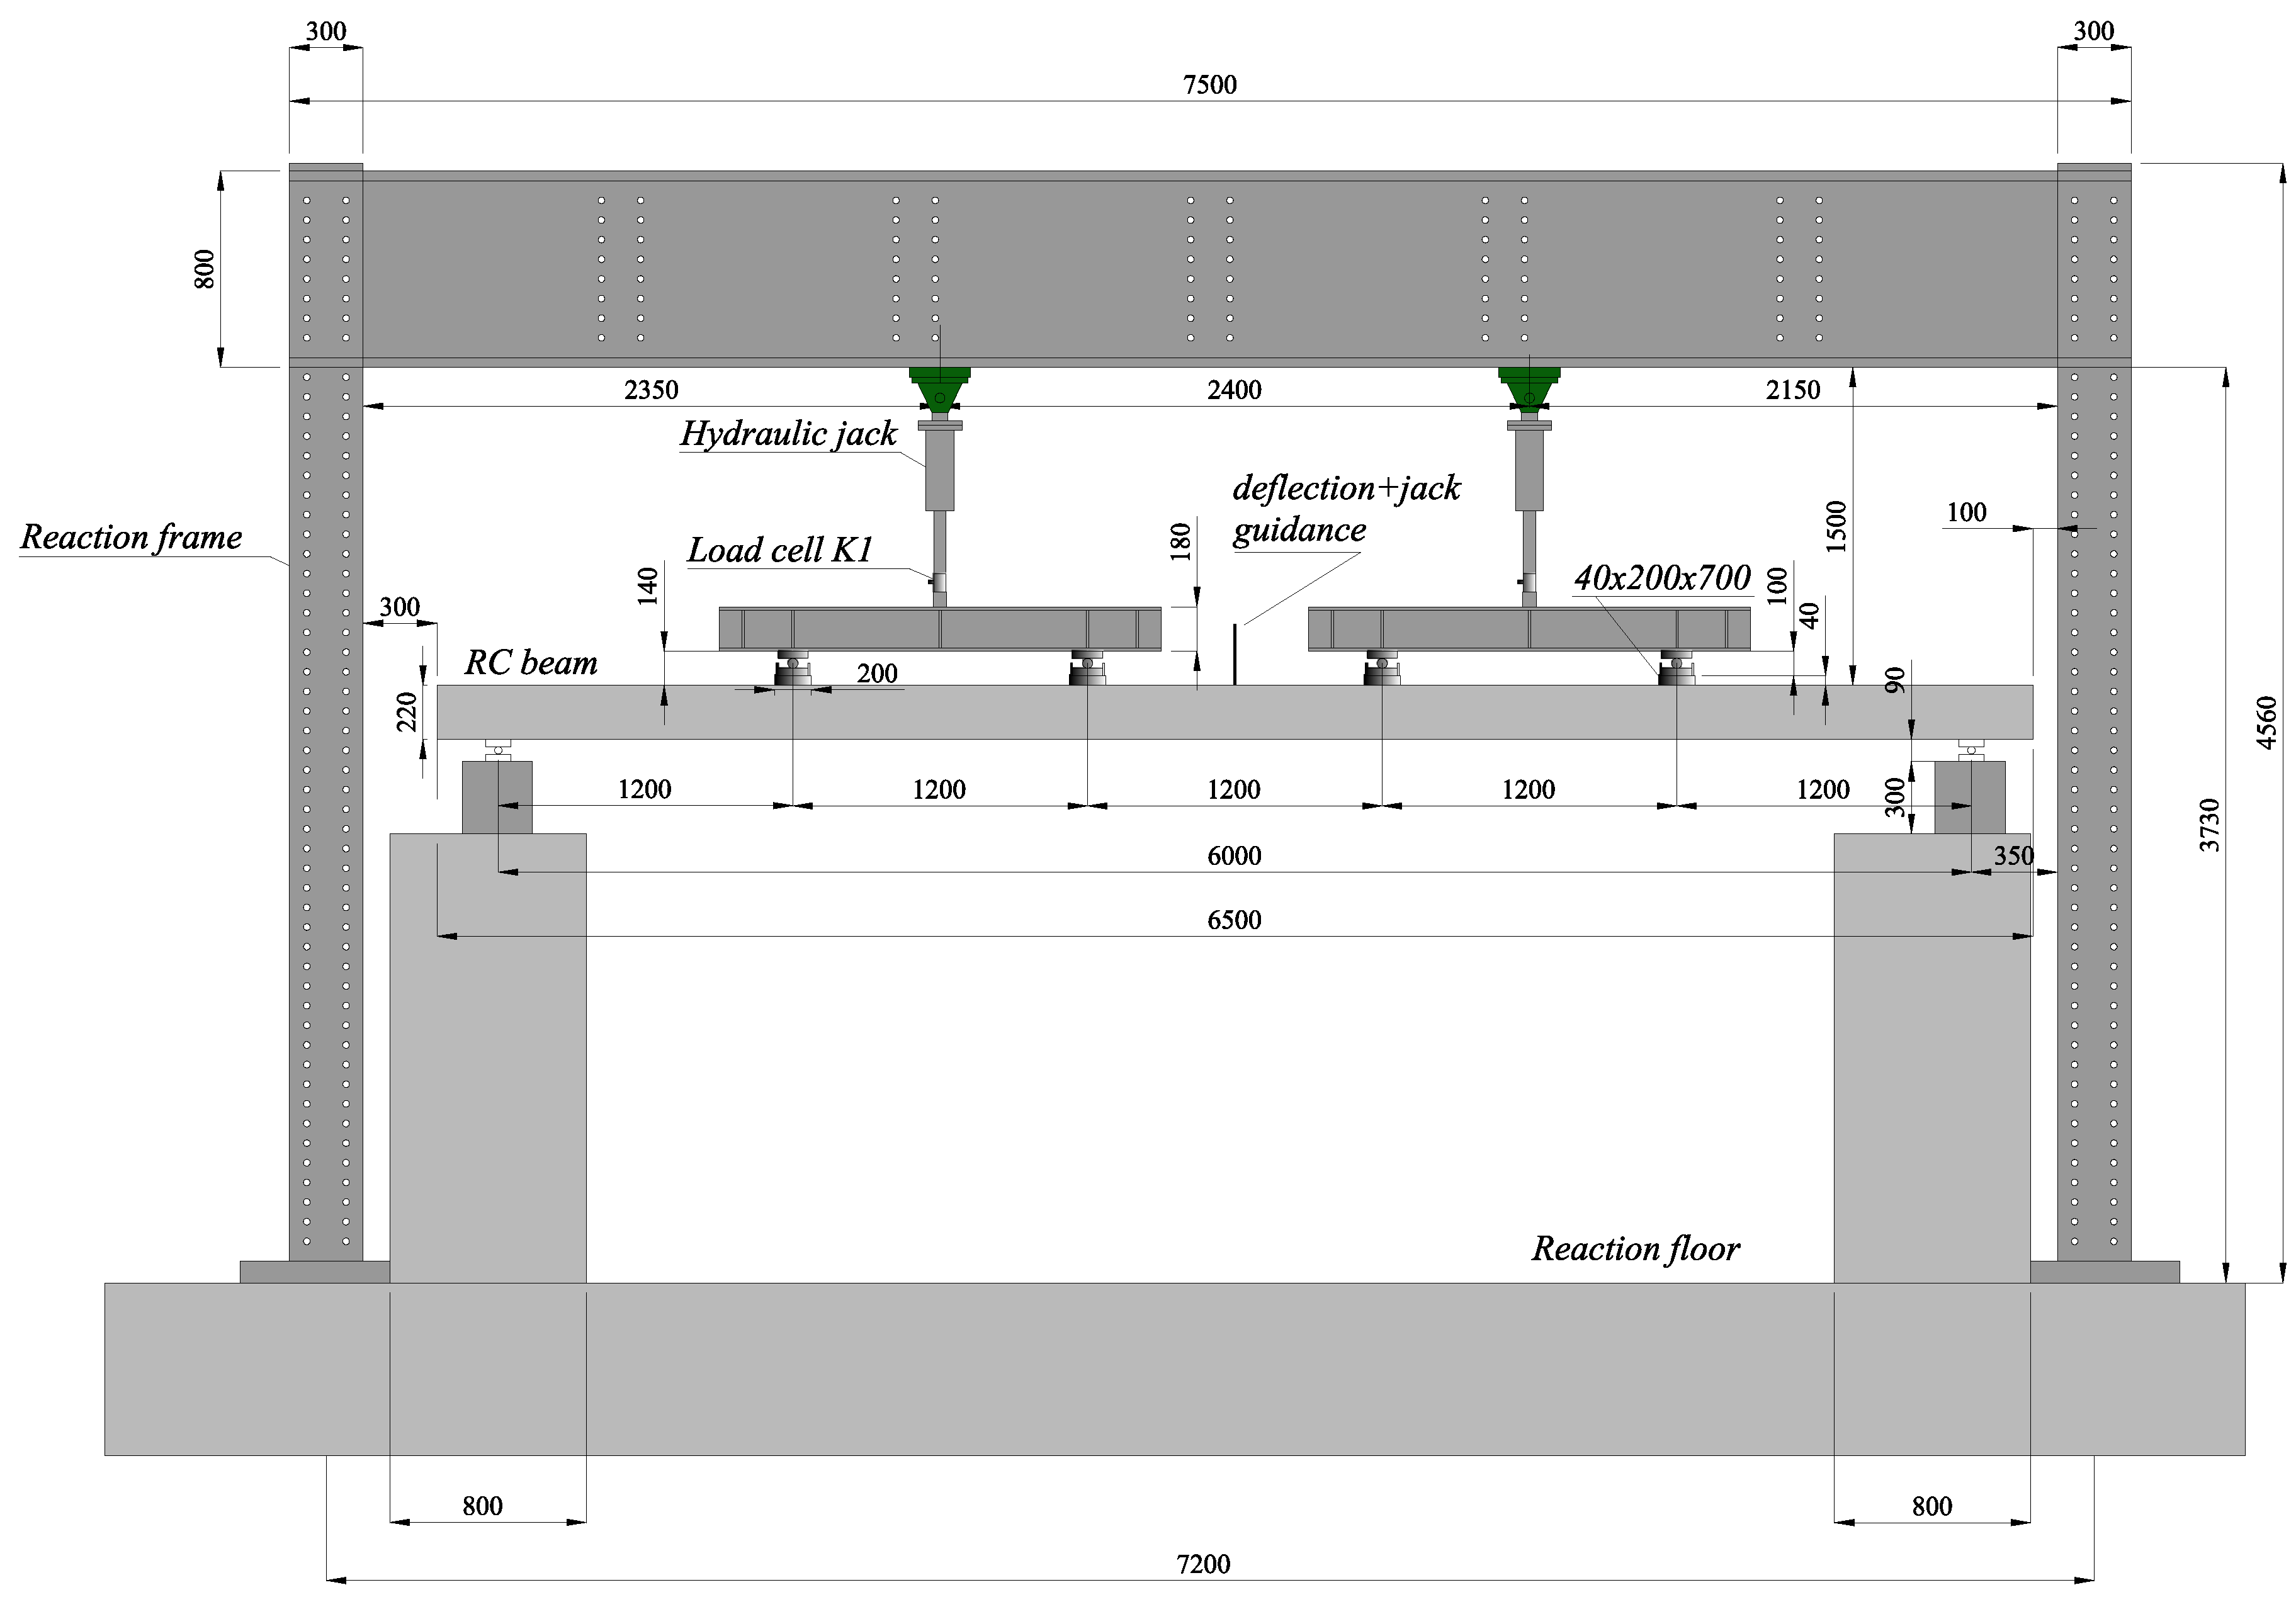

Table 1.
The yield, Rp,0.2, and ultimate, Rm, tensile strength of the inner longitudinal steel reinforcement Ø8.
| Steel bar | Rp,0.2 (MPa) | Rm (MPa) |
|---|---|---|
| 1 | 524 | 601 |
| 2 | 551 | 631 |
| 3 | 532 | 609 |
| 4 | 553 | 637 |
| Average | 540 | 619 |
| Standard deviation | 14.6 | 17.2 |
Table 2.
Average concrete compressive strength after 28 days, fcm,cube,28, and on the testing day, fcm,cube,test (* estimated according to fib-bulletin 1 [20]).
| Beam | fcm,cube,28 (MPa) | fcm,cube,test (MPa) |
|---|---|---|
| 1 | 56.8 | 63.2 |
| 2 | 54.3 | 57.7 |
| 3 | 52.2 | 54.0 |
| 4 | 54.1 | 69.4 * |
2.2. Retrofitting Characteristics and Procedure
Detailed aspects of the retrofitting procedure of the presented reinforced concrete (RC) beams have also been presented in Michels et al. [18]. The same CFRP strip type distributed by S&P Clever Reinforcement Company (CH), with a thickness, tf, of 1.2 mm and a width of 100 mm, has been used to retrofit all beam elements. The carbon fiber type is Tenax/Toho, and the matrix is vinylester-based and produced by Huntsman (www.huntsman.com). The initial prestrain, εf,p, is 6 ‰, resulting in a total prestress force, Fp, of around 114 kN. The CFRP strips were regularly applied for Beams 1, 3 and 4. For Beam 4, however, the bottom surface for strengthening corresponds to the upper casting surface. The beam was turned by 180° along its central axis. In the case of Beam 3, both strip ends were ground with sand paper prior to the strengthening application with the aim of roughening the surface for a better bond with the epoxy layer. Table 3 summarizes the retrofitting characteristics.
Table 3.
Retrofitting characteristics.
| εf,p (-) | tf (mm) | bf (mm) | Comment | |
|---|---|---|---|---|
| Beam 1 | 0.59 | 1.2 | 100 | Strip applied regularly |
| Beam 2 | 0.59 | 1.2 | 100 | Strip end ground with sand paper |
| Beam 3 | 0.60 | 1.2 | 100 | Strip applied regularly |
| Beam 4 | 0.61 | 1.2 | 100 | Bottom surface for strengthening corresponds to the upper casting surface |
The releasing procedure is performed in three steps: the first force release, ΔF1, of 50 kN over a total bond length, Δl1, of 300 mm, followed by two subsequent steps of ΔF2 and of ΔF3 mmatic, so it has been modified to mirror the previous statement. 32 kN over bond lengths Δl2 and Δl3 of 200 mm each. In the end, the last sector with a length of 100 mm is stress-free. Each gradient sector is heated for 25 min, followed by a 10 min cooling period prior to force releasing. An overlapping time of 5 min between a cooling period of one sector and the heating start of the subsequent one is defined in order to shorten the overall process time.
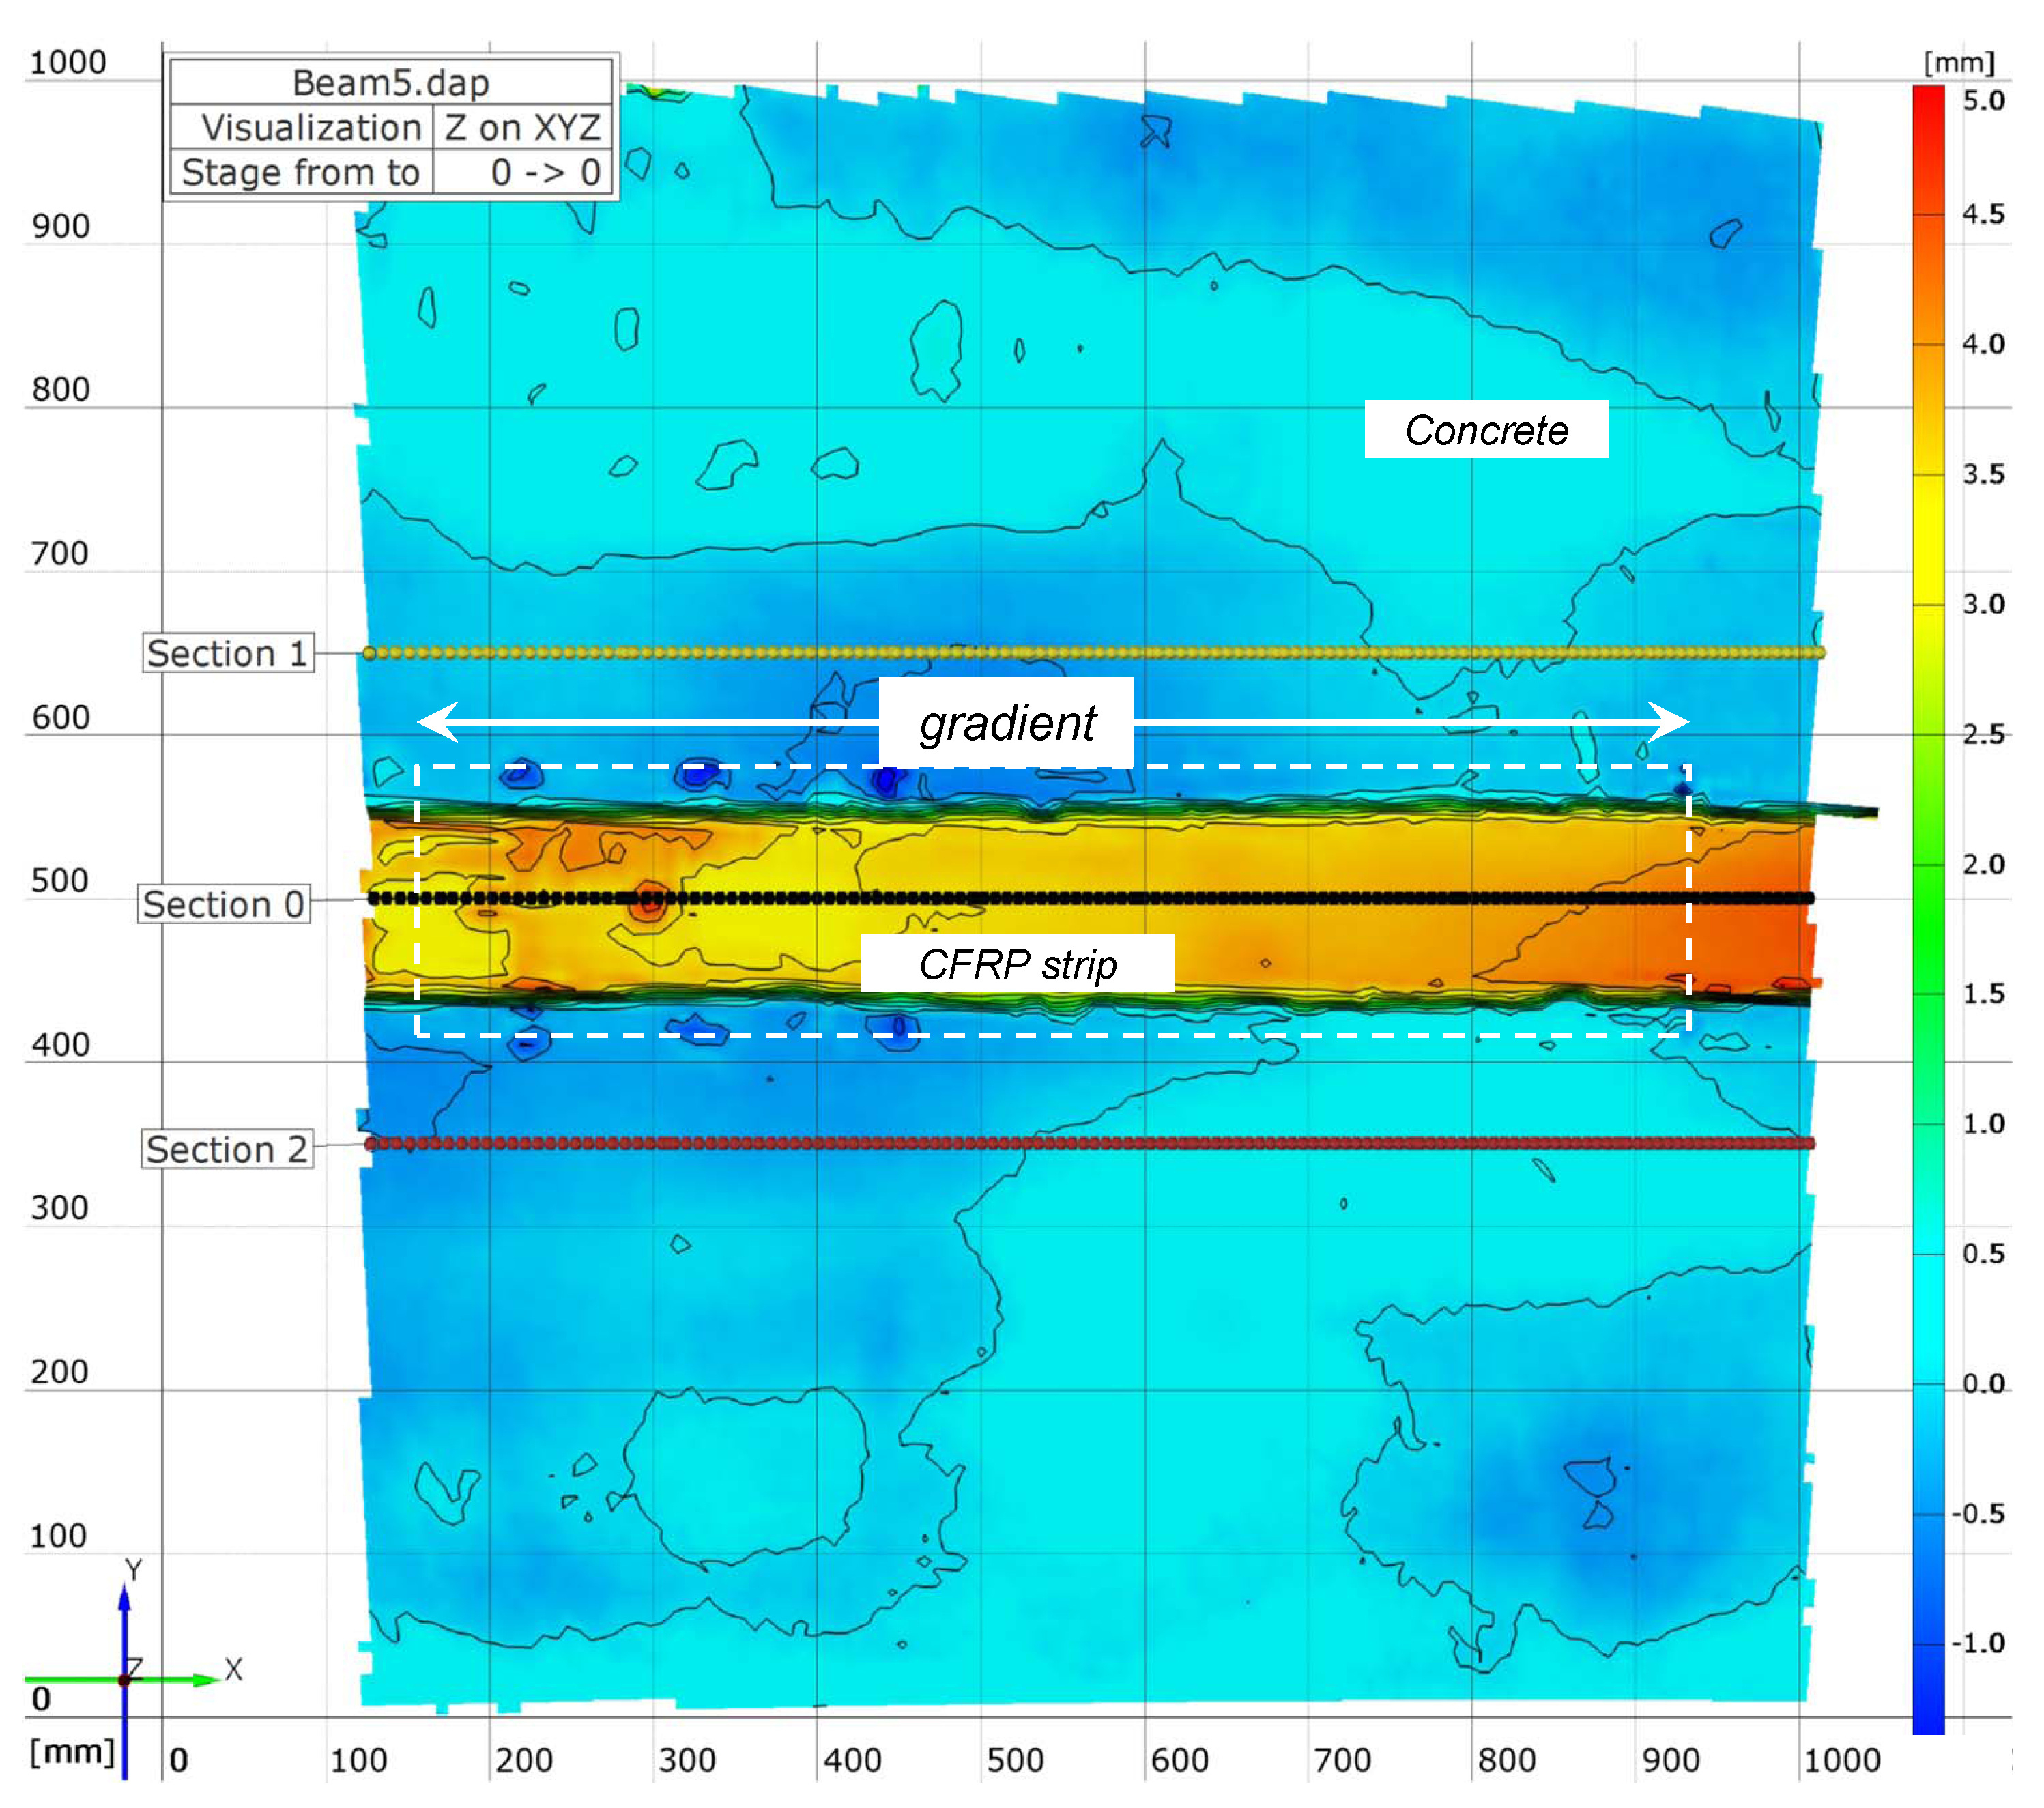
The following two figures (Figure 3 and Figure 4) give information about the total overall thickness of the CFRP strip and the underlying epoxy layer for Beam 4 in the anchorage zone. Since the geometric characteristics for all the tested elements are identical, the authors consider the following comments as representative for all four beams. Figure 4 shows the isolines of the out-of-plane positions (z) taken prior to the loading process by means of digital image correlation [10,12,23]. The total z-values for the three indicated sections, Sections 1 (strip center) and 0 and 2 (concrete), in the gradient area are subsequently shown in Figure 3a. Transformed values with reference to the concrete surface are given in Figure 3b. In this case, a mean value of 3.83 mm for the total thickness composed of the adhesive (ta) and the strip (tf) is obtained. Therefore, the mean thickness value of the adhesive, ta, is 2.63 mm.
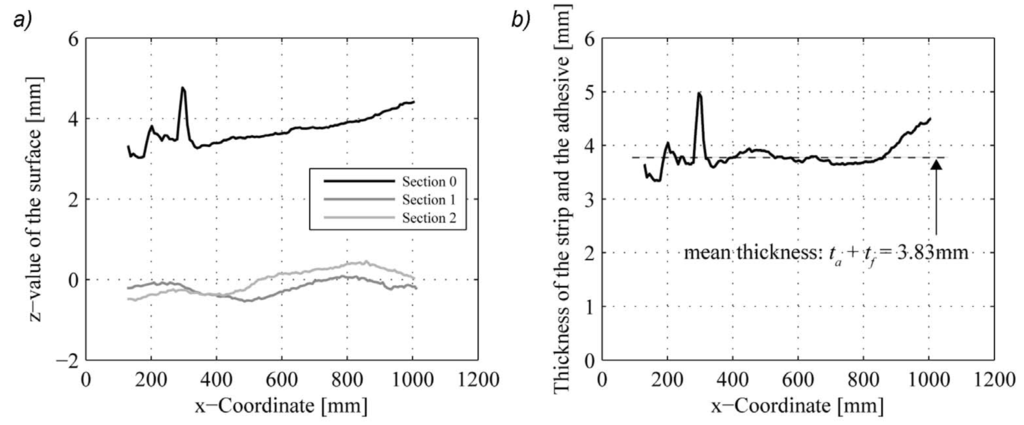
Figure 3.
(a) The z-value of the surfaces and (b) the transformed thickness of the adhesive and CFRP strip.
Figure 3.
(a) The z-value of the surfaces and (b) the transformed thickness of the adhesive and CFRP strip.


Figure 4.
Image correlation measurements before the loading-out-of-plane isolines (Beam 4).
Figure 4.
Image correlation measurements before the loading-out-of-plane isolines (Beam 4).
2.3. Test Setup and Program
The test setup is shown in Figure 2. At both ends, the beams are simply supported with a total span, L, of 6 m. Static loading under six-point bending under displacement control (loading speed, 3 mm/min) is applied. Vertical deflection at the midspan is recorded with two LVDTs. Concrete compression strain, as well as CFRP tensile strain were registered with several strain gauges, as presented in Figure 5. Two strain gauges (namely, SG1 and SG4) are applied prior to strengthening in order to follow the prestrain in the laminate. Four beams in total are tested; all are strengthened with prestressed and gradually anchored CFRP strips. An additional beam with a conventional mechanical anchorage is omitted in this paper, as the structural behavior exhibited some unexpected early bond loss between the concrete and epoxy, probably due to a poor application.
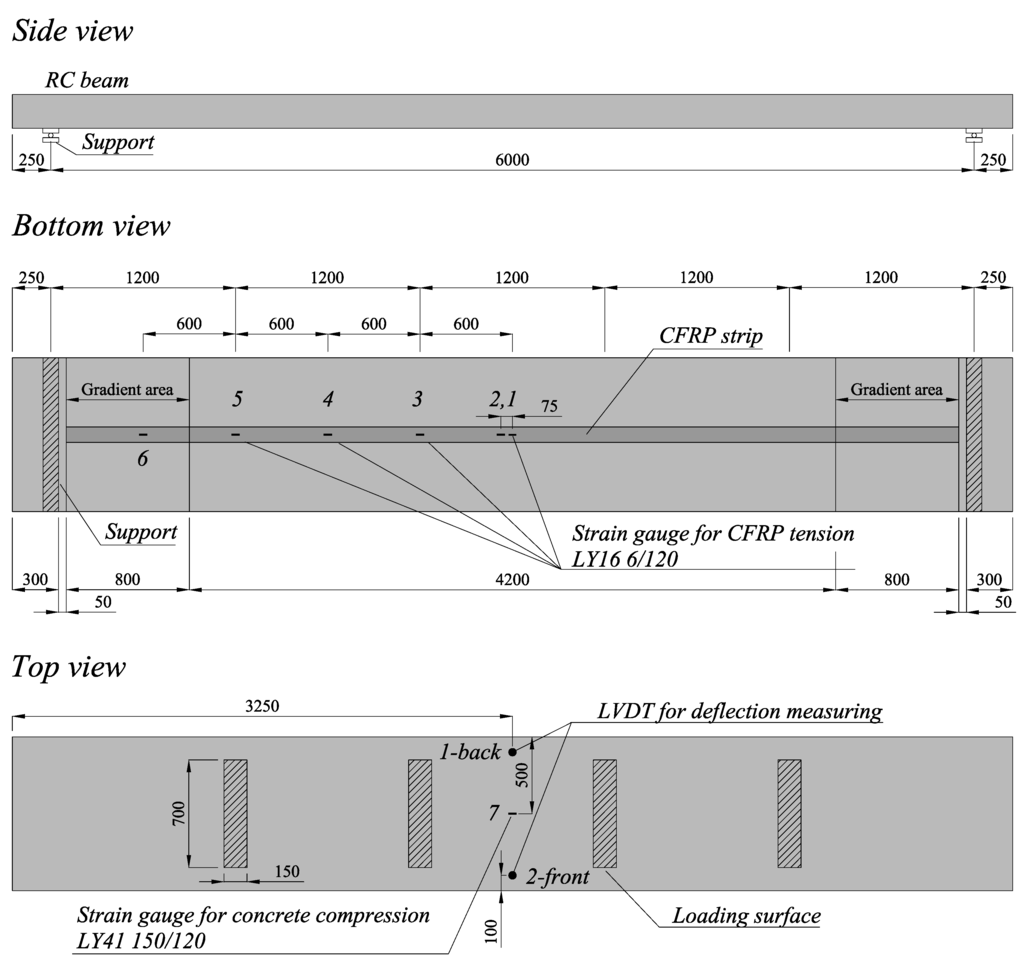
Figure 5.
Measurement plan (dimensions in (mm)).
Figure 5.
Measurement plan (dimensions in (mm)).

3. Results and Discussion
The force-deflection curve, as well as force-strain measurements are presented in Figure 6 and Figure 7, respectively. It is précised that the deflection value is taken into account as an average deflection of both LVDT measurements. Table 4 summarizes the most important values in terms of ultimate load Fu, midspan deflection at failure δu, CFRP tensile strain at debonding εf,u and localization of the last crack lcr (distance from the last crack to the support). The indicated value, Δεf, is the tensile strain in addition to the prestrain introduced in the strip due to static loading. Note that the force level, Ftot, is the sum of the four acting forces according to the presented test setup. It is mentioned that for Beam 1, force values were measured, but could not be registered, due to technical problems with the data acquisition system. Polymers 2014, 6 121 Nevertheless, it is presented that the ultimate load carrying capacity, Fu, was around an 80 kN reading on screen during the test at a midspan deflection, δu, of 127 mm. In terms of force-deflection behavior, some of the following results have been presented earlier in Michels et al. [18].
For all the tested beams, failure occurred by the debonding of the prestressed strips from the concrete surface. Due to the very fast debonding process, the location of the initiation is rather difficult to determine. For Beams 1–3, though, as presented in Figure 8, the picture of the gradient after debonding indicates a separation from the strip from the epoxy layer. For Beam 4, failure seemed to have been initiated in the free length. The highest bearing loads with approximately 80 kN could be noticed for Beams 1 and 3. This is in direct correlation to the registered maximum strip strain, εf,u, of 1.42% and 1.38%, respectively (Figure 7a). With an earlier presented ultimate strain of 1.6%, tensile failure is almost reached. After having tested Beam 1 and having noticed a failure by delamination at the front part of the anchorage zone (first 300 mm) between the CFRP strip and the underlying epoxy layer (see Figure 8), the idea was to roughen the strip end with sandpaper in order to increase the bond between the two components (see Section 2.2). However, the results from Beam 2 show that this measure was counterproductive, resulting in an even lower ultimate failure load (69.9 kN) and strip tensile strain (1.16%, Figure 7a). It is hypothesized that the grinding procedure provoked the creation of very thin carbon dust, which subsequently could not be removed with the conventional cleaning procedure. The resulting failure mechanism is the same, but at a clearly lower load level. For Beam 3, the exact same procedure as for Beam 1 was followed; the results are almost identical. Lastly, Beam 4 was strengthened “top-down”, i.e., the concrete substrate surface on which the CFRP strip has been applied was initially the upper surface while casting. This most likely results in lower concrete quality of the strengthened surface. For this last element, failure by debonding at midspan in the concrete substrate could be noticed at a lower force, deflection and CFRP tensile strain value than for Beams 1 and 3. Inclination changes in the force-deflection (Figure 6), as well as in the force-strain curves (Figure 7) indicate a cracking load, Fcr, of about 30 kN and a start of steel yielding, Fy, at about 50–60 kN for all beams. All four tests have in common that the compressive strain of the concrete was clearly below the failure level, as presented in Figure 7 and Table 4.
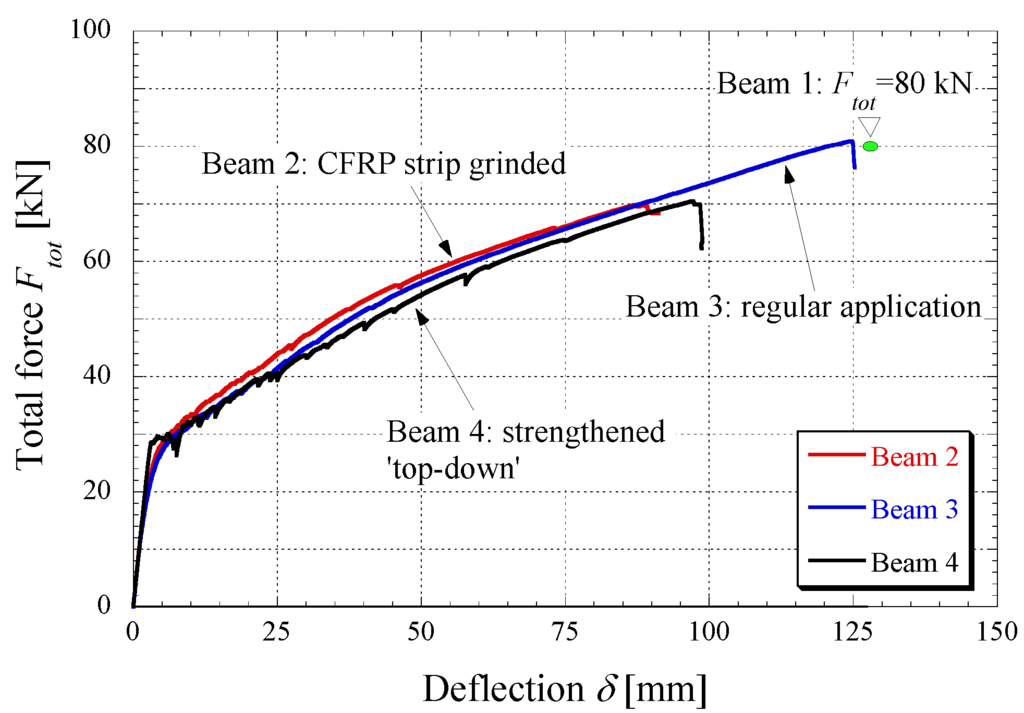
Figure 6.
Total force-midspan deflection curve of all the performed static tests.
Figure 6.
Total force-midspan deflection curve of all the performed static tests.
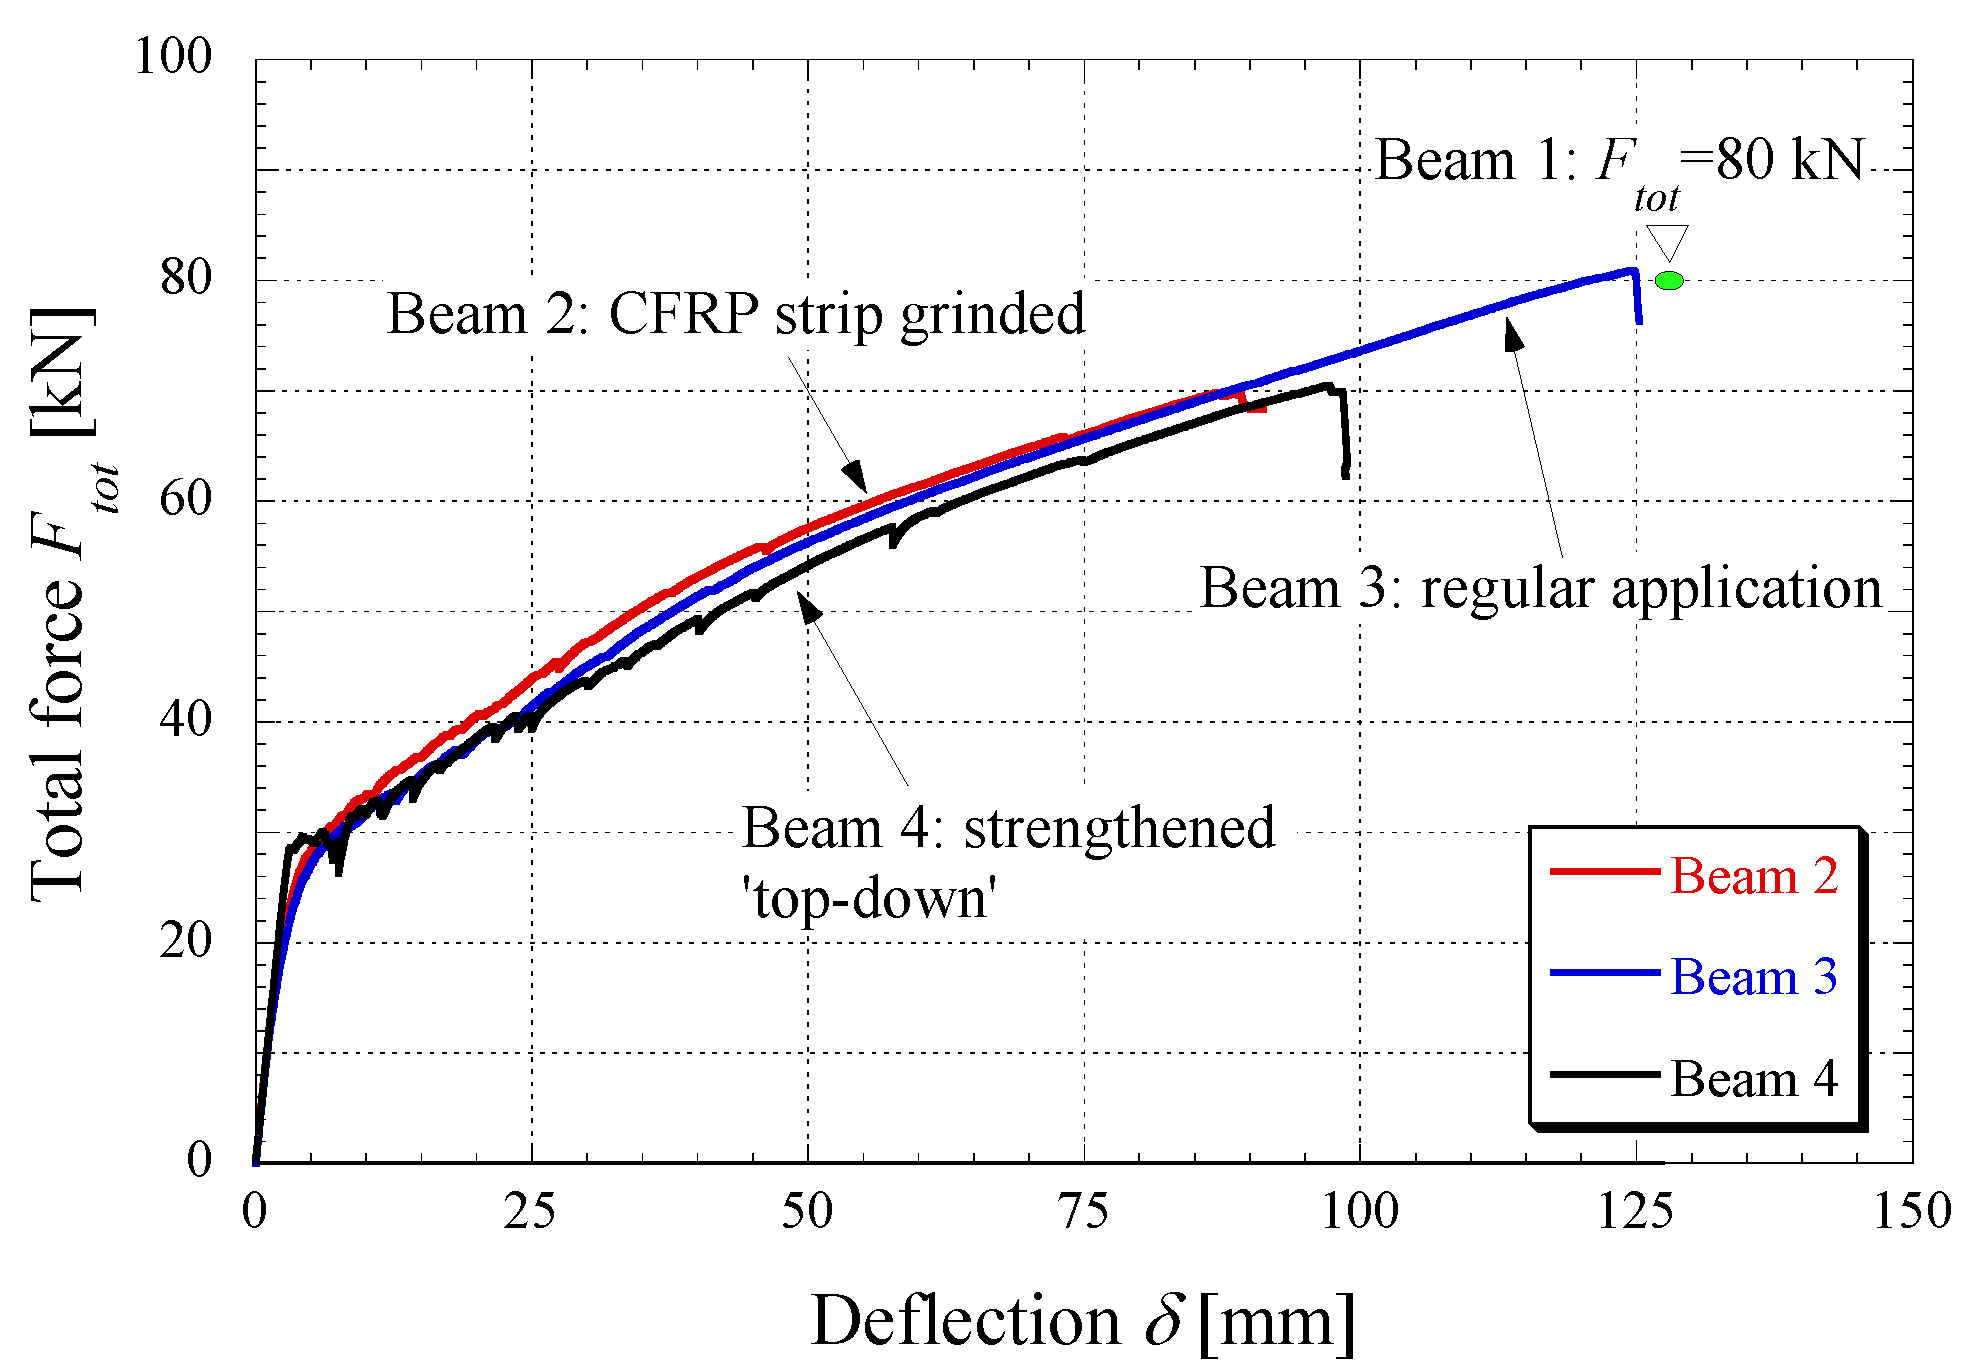
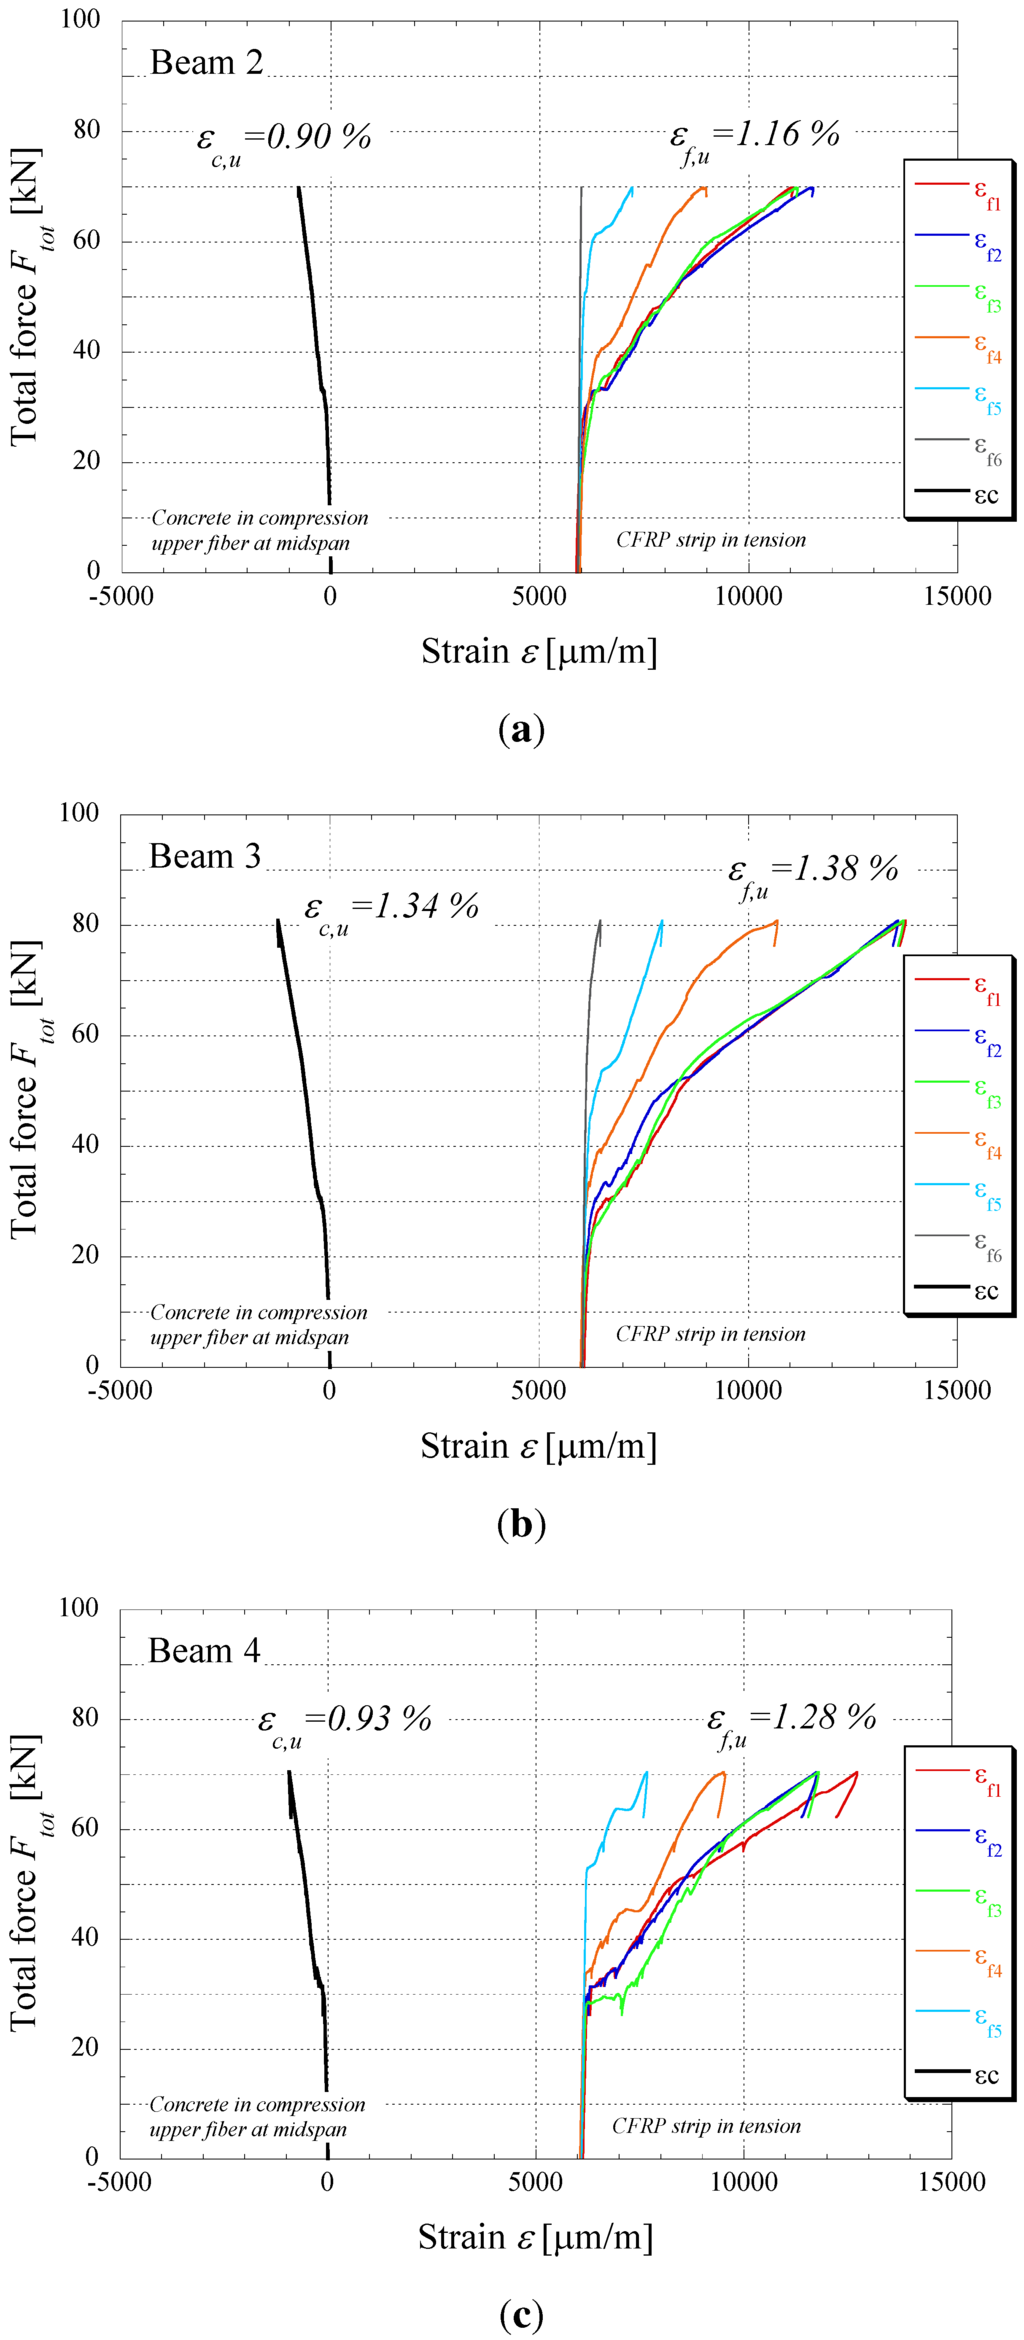
Figure 7.
Force-strain curves for the tested beam elements, 2–4. (a) Beam 2 force-strain; (b) Beam 3 force-strain; and (c) Beam 4 force-strain.
Figure 7.
Force-strain curves for the tested beam elements, 2–4. (a) Beam 2 force-strain; (b) Beam 3 force-strain; and (c) Beam 4 force-strain.
Table 4.
Summary of the key results after static loading (* not registered).
| Beam | Fcr | δcr | Fy | δy | Fu | δu | εf,u | Εc,u | Δεf [%] | lcr (m) |
|---|---|---|---|---|---|---|---|---|---|---|
| No. | (mm) | (mm) | (kN) | (mm) | (kN) | (mm) | (%) | (%) | (%) | (m) |
| 1 | * | * | * | * | ≈80 | 127.4 | 1.42 | 1.27 | 0.83 | 1.10 |
| 2 | 20 | 2.4 | 54 | 41 | 69.9 | 91.2 | 1.16 | 0.90 | 0.57 | 1.15 |
| 3 | 18 | 2.2 | 55 | 46 | 80.9 | 125.3 | 1.38 | 1.34 | 0.78 | 1.11 |
| 4 | 28 | 2.9 | 57 | 57 | 70.5 | 98.8 | 1.28 | 0.93 | 0.67 | 1.27 |
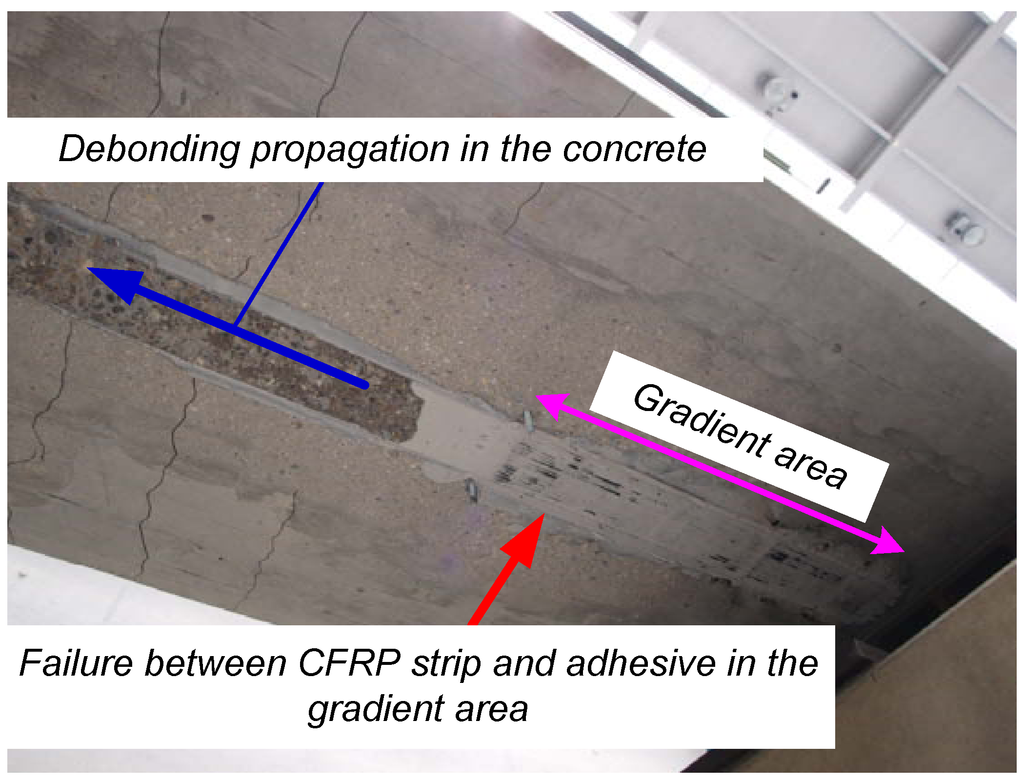
Figure 8.
Debonding failure between the CFRP strip and the epoxy adhesive in the gradient anchorage zone.
Figure 8.
Debonding failure between the CFRP strip and the epoxy adhesive in the gradient anchorage zone.

Since no reference beam is tested, cracking and ultimate moment Mcr and Mu, as well as the corresponding loads, Fcr and Fu, are estimated as follows:
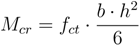 where fct = the unidirectional tensile strength of the concrete (≈4 MPa), b,h = the width and height of the concrete cross-section, Fs = the maximum force in the steel reinforcement in tension, z = the lever arm, Rm = the ultimatestrength of the steel reinforcement (≈ 620 MPa) and d = the static height (=190 mm). With the indicated values, Mcr ≈ 32 and Mu ≈ 37 kNm. By subtracting the dead load, the cracking and ultimate load (the total of the four applied forces) are 9.5 and 15 kN. In Figure 6 and Table 4, cracking loads are in the region of 30 kN, whilst ultimate loads are between 69.9 and 80.9 kN. Compared to the estimated reference values, the advantages for both serviceability and the ultimate state are clearly visible.
Mu = Fs · z ≈ As · Rm · 0.9 · d
An interesting aspect of the strengthened beams is the overall structural behavior as a comparison between the deformation (deflection) at which the inner steel reinforcement starts yielding and the deflection at the ultimate load. For all the beams, yielding occurs more or less at a deflection, δy, of about 50 mm (the second stiffness drop after cracking). When referring to Beams 1 and 3 with the higher observed deformation of about 125 mm, a ductility index for deflection μδ = δu / δy = 125/50 = 2.5 is obtained. This value can be regarded as being very satisfying. In terms of forces, the ductility index μF = Fu / Fy = 80/55 = 1.45 is less high. For advanced considerations on ductility issues for concrete members with an externally bonded FRP reinforcement, the reader is invited to consult the research by Oudah and El-Hacha [24].
Crack patterns of all the tested beams are shown in Figure 9, and the location of the last crack, lcr (measured from the support), is also given in Table 4. It can be seen that for all elements, the last crack, lcr, is located outside of the gradient anchorage zone. This observation is confirmed by the strain evolution presented in Figure 7. For Beams 2 and 3, the increase of the strip strain, εf,6, located in the gradient region, isalmost none (for Beam 4, no measurement in the anchorage zone has been recorded).
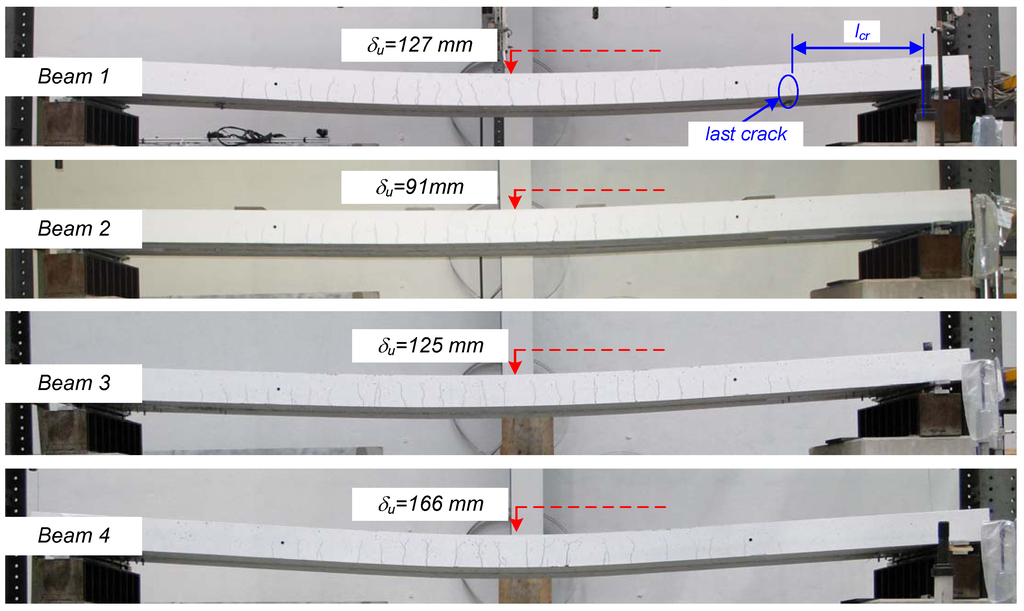
Figure 9.
Crack patterns after the test ended of all four beams tested.
Figure 9.
Crack patterns after the test ended of all four beams tested.

4. Numerical Code
Numerical simulations of the experimental results outlined in the previous section are performed by means of a 1D finite element (FE) model based on an extension of the one formulated by Faella et al. [25] for non-prestressed externally bonded FRP-strengthened RC beams. Figure 10 shows the kinematics of the aforementioned finite element, whose displacement and force vectors collect the six components described in the following equations, (3) and (4):
s = [vi ϕi si vj ϕj sj]
Q = [Vi Mi Fi Vj Mj Fj]
It is worth highlighting that the interface slips considered by the model are those measured after the possible release process, which is carried out as part of the aforementioned gradient method.
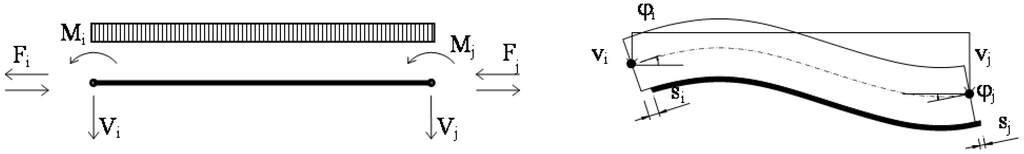
Figure 10.
Kinematics and the degrees of freedom of the proposed finite element.
Figure 10.
Kinematics and the degrees of freedom of the proposed finite element.

The force and displacement vectors are related by means of the following usual matrix expression:
where K is the so-called stiffness matrix and Q0 is the vector of equivalent nodal forces. Since the model under consideration derives from the well-known Newmarks theory for two-layer beams in partial interaction, an “exact” expression is available for both K and Q0 [26], which takes into account both the shear-flexibility of the connected layers and the partial interaction resulting from their flexible interface. As a matter of principle, such a solution completely defines the matrix, K, and the contribution, Q0,q, of transverse distributed loads to the vector, Q0. Then, the complete expression of the vector Q0 for the problem under consideration should also cover the effect of the initial strain,  , which represents the axial strain imposed on the FRP strip for applying the prestressing action to the RC beam. Although mathematical details about the whole derivation of the contribution, Q0,p, corresponding to the pre-stressing action cannot be reported herein due to space constraints, it is easy to recognize that the final analytical expression of Q0 can be written as follows:
 where E · Af is the axial stiffness of the FRP strip and d the distance between the transverse section centroid of the RC beam and FRP strip. As a matter of fact, the prestressing action, as well as the applied distributed loads, is represented by a vector of equivalent nodal forces: the contribution of the former tends to compensate for the latter, as also expected from the conceptual design of the prestressing action.
Q = K · s + Q0
, which represents the axial strain imposed on the FRP strip for applying the prestressing action to the RC beam. Although mathematical details about the whole derivation of the contribution, Q0,p, corresponding to the pre-stressing action cannot be reported herein due to space constraints, it is easy to recognize that the final analytical expression of Q0 can be written as follows:
The 1D FE formulated through Equations (4) and (6) can be conveniently utilized to perform linear analyses of beams strengthened in bending by externally-bonded prestressed FRP strips. However, due to the nonlinear behavior that characterizesthe experimentally observed response, the following (generalized) stress-strain relationships are considered in the present simulations:
- The well-established rational law by Sargin is adopted for concrete in compression. All its relevant properties can be defined in terms of the compressive strength, fc, and an ultimate axial strain εcu = 0.0035 is assumed as a conventional value for the concrete crushing condition ([20]);
- An elastic response of concrete in tension is assumed, up to the unidirectional tensile strength, fct, which can be determined as a function of fc ([20]). Then, a power law is assumed for simulating a softening branch, which corresponds to the well-known tension-stiffening effect ([27]);
- A trilinear elastic-hardening-plastic law is adopted for reinforcing steel bars. It allows the simulation of the linear behavior up to yielding stress fy, a hardening branch up to the ultimate tensile strength, fs,u, which is kept constant up to a conventional value of the ultimate strain of εs,u = 0.06;
- A linear elastic behavior is assumed for the FRP strip in tension, depending on the elastic modulus, Ef, and the ultimate stress, ff,u.
- A bilinear elastic-softening bond-slip law is finally employed for describing the interaction between the FRP laminate and the concrete substrate ([10],
 = 8 MPa, sf,el = 0.02 mm, sf,u = 0.2 mm). The key parameters are mainly related to the fracture energy in mode II, Gf,II, and can be identified via pull-out tests on FRP strips glued onto concrete blocks.
The values of the relevant parameters that define the above stress-strain laws are taken from the experiments reported in Section 2.1.
A secant updating procedure is, then, implemented to handle the mechanical nonlinear behavior introduced by the aforementioned stress-strain relationships (as a matter of fact, this procedure works in Faella et al. [25]). Besides the usual failure modes of RC members, generally related to the compression failure of concrete and the tensile failure of the steel reinforcement, both the tensile failure of the CFRP strip and debonding failure at the FRP-to-concrete interface are considered in the analyses through the limit values of strains and slips that identify the adopted generalized stress-strain law. Particularly, the calibration of the bond stress-slip relationship in the gradient zone was based upon the results reported in Czaderski et al. [10]. The behavior observed on the RC beams reported in Section 2 was simulated by means of the aforementioned model. Particularly, the numerical analyses focused on the beam referred to as Beam 3, which represents the regular application of the gradient method for prestressed FRP plates. To this end, the beam is discretized in a mesh of 25 finite elements: moving from the theoretical support, the first FE is a 200 mm-long regular RC beam element; the second is a non-prestressed on a 100-mm element, like the one formulated by Faella et al. [25]; then, three elements correspond to the three steps of the gradient method. These first five elements cover the first meter of the beam (from the theoretical support); then, another 20 (100 mm each) FE, like the ones described above, cover the distance up to the midspan; only one-half of the beam is actually schematized, as a result of the geometrical and loading system under investigation.
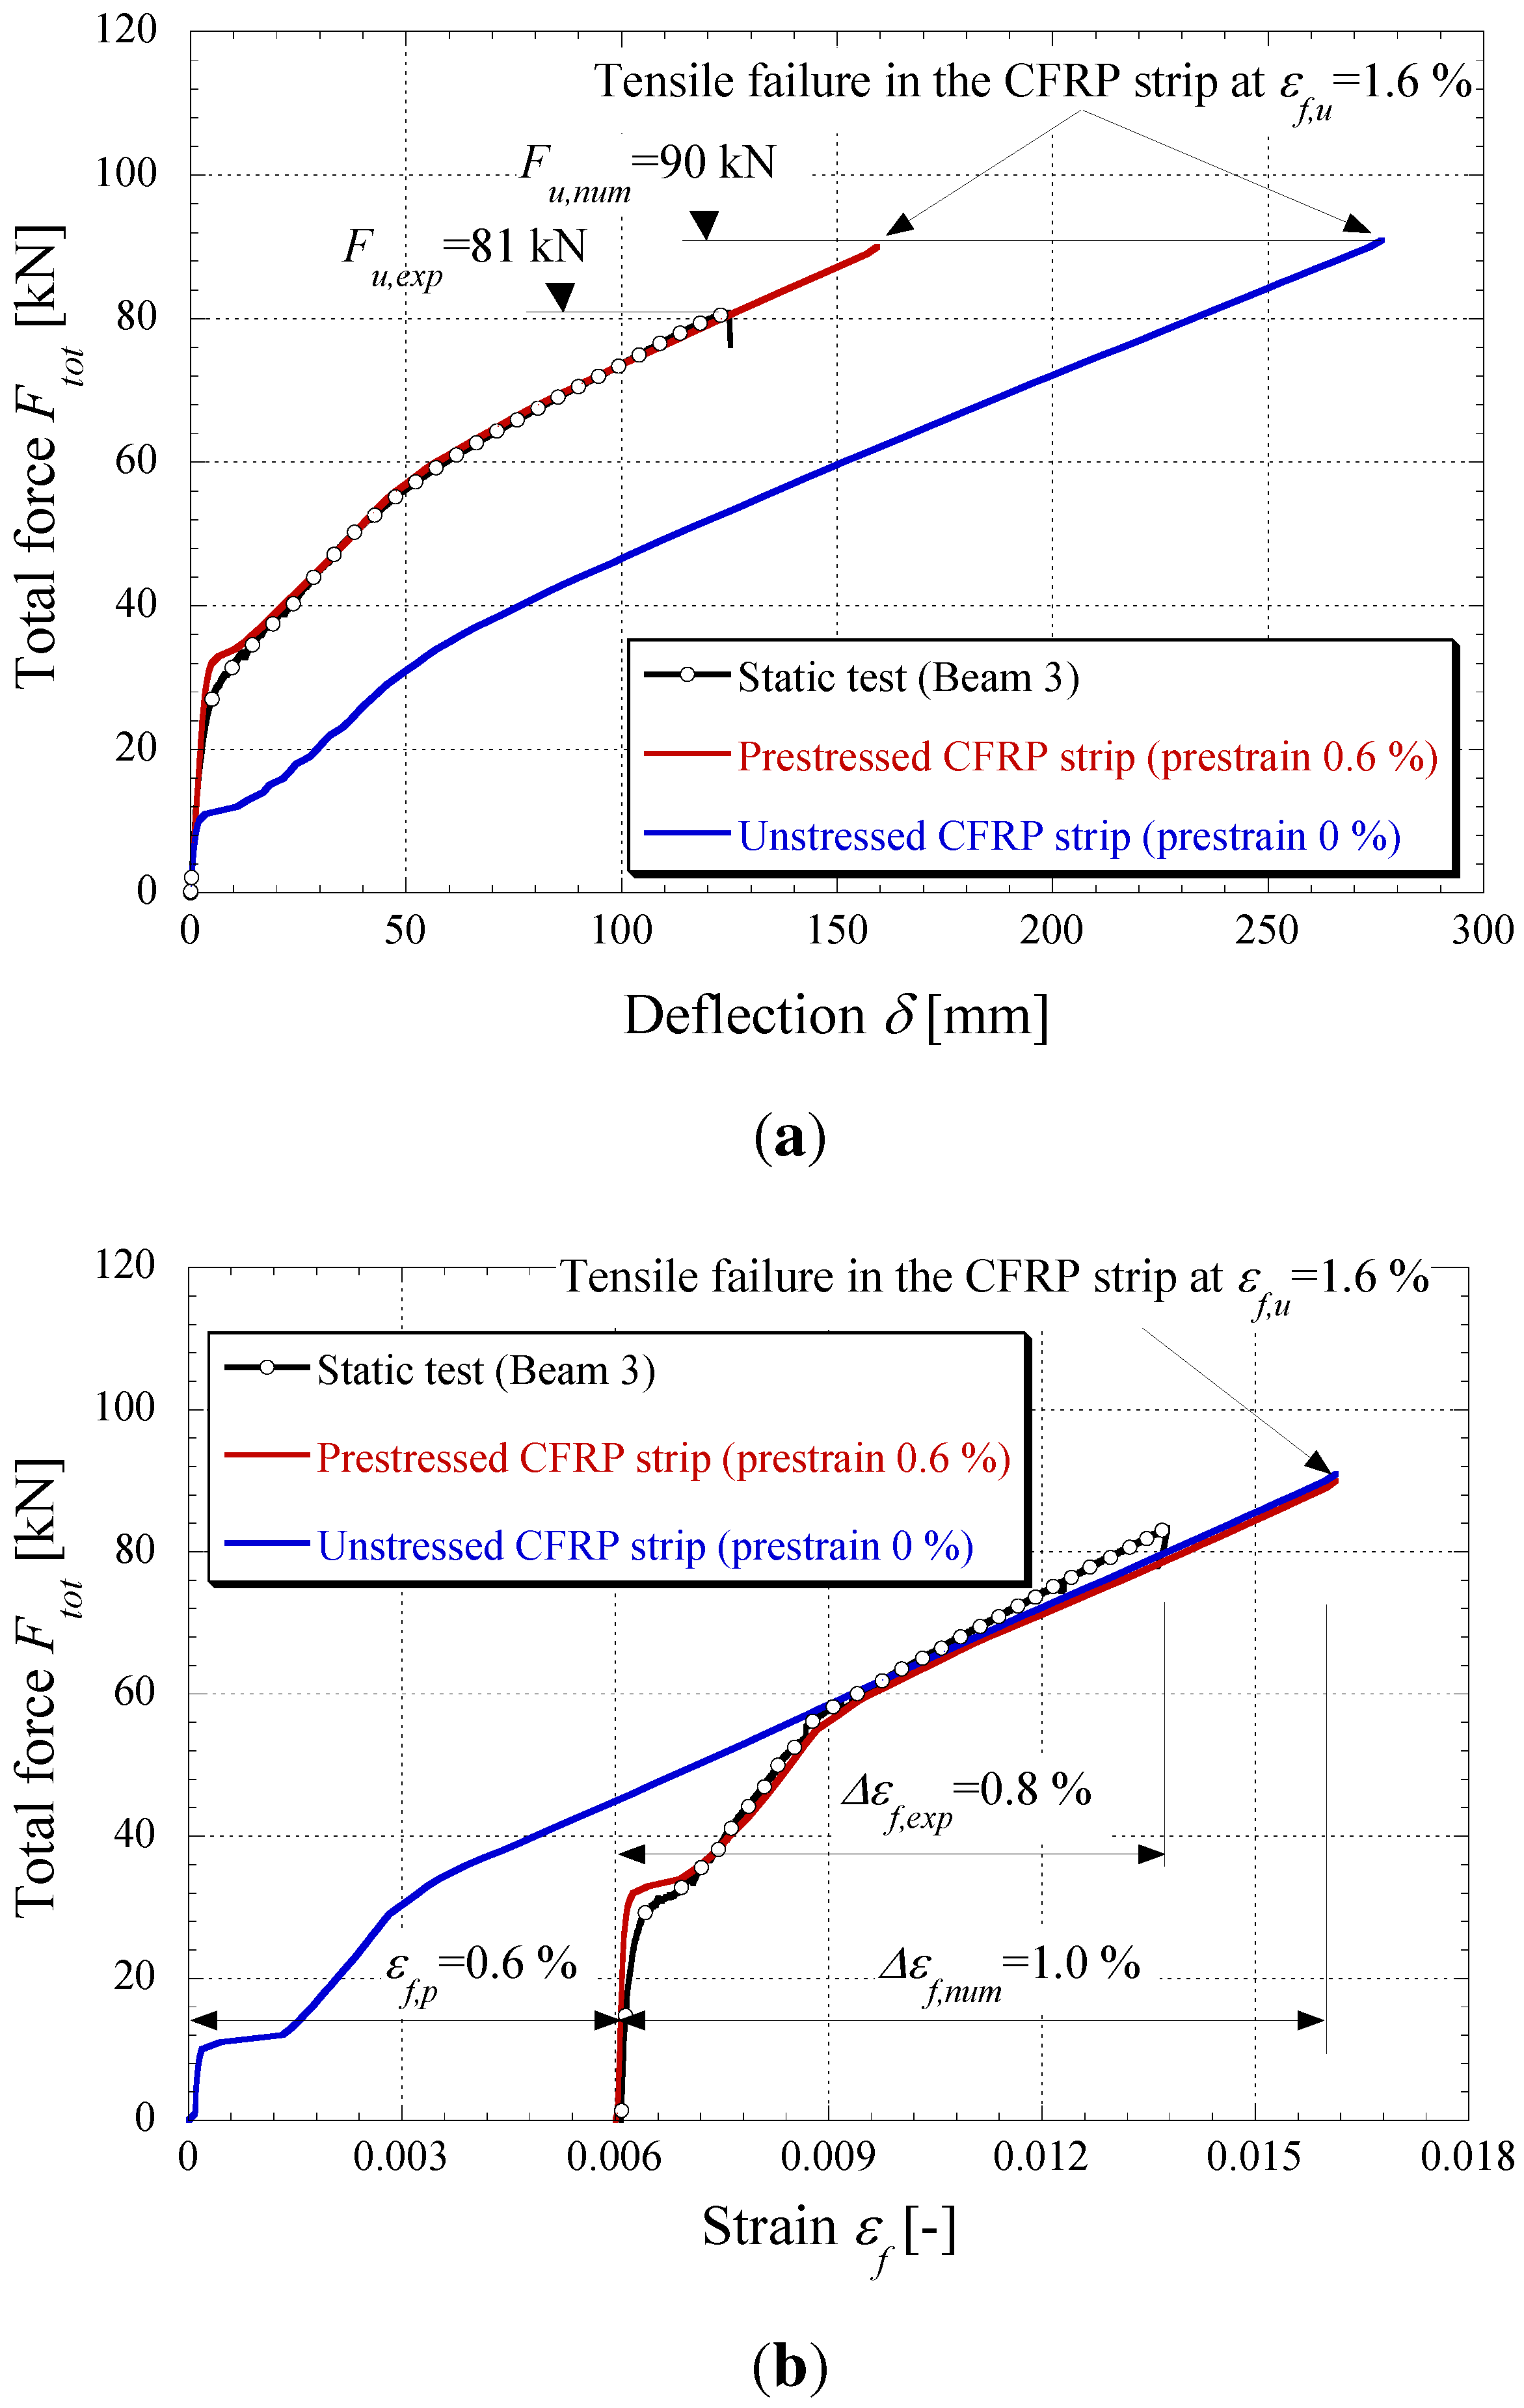
Figure 11a presents the comparison between the experimental results in terms of applied force Ftot and midspan displacement δ measured after having applied the prestressed CFRP strip. A very good agreement can be observed between the results and the numerical simulation, which stops when the maximum axial strain εf,u = εf,p + Δεf,calc = 0.006 + 0.010 = 0.016 is reached in the CFRP strip. This indicates that a tensile failure of the CFRP strip was found to be the dominant failure mode. Compared to the experimental results, the numerical model slightly overestimates the final bearing capacity of the beam. This is probably due to the fact that the model cannot simulate local effects, such as discrete crack formation and local irregularities of the concrete surface and epoxy layer, which are often responsible for the debonding phenomenon. Moreover, the same figure depicts the simulation of a similar beam, possibly tested without prestressing action (not tested); the significant difference in terms of cracking and yielding load (with respect to the prestressed beam) points out the importance of prestressing in recovering a significant part of the stresses induced by the dead loads (just the self-weights in this experimental case). For the initially unstressed strip configuration, the cracking load is more or less identical to the unstrengthened configuration (see Section 3). This represents an additional argument towards prestressing; as for serviceability purposes, unstressed externally bonded strips do not induce a significant improvement of the structural behavior. In the end, tensile failure in the composite reinforcement is, as for the prestressed case, found to be the dominant case from a numerical point of view. Eventually, the differences in structural stiffness between a loaded element with a prestressed or an initially unstressed strip are evident.
Figure 11b shows the same comparison between the prestressed and unstressed case compared to the experimental results in terms of the CFRP tensile strain at the midspan. Again, a good concordance between the measured and calculated values can be observed. The same comment as stated earlier, i.e., an overestimation of the total load carrying capacity is visible with higher strip strains.
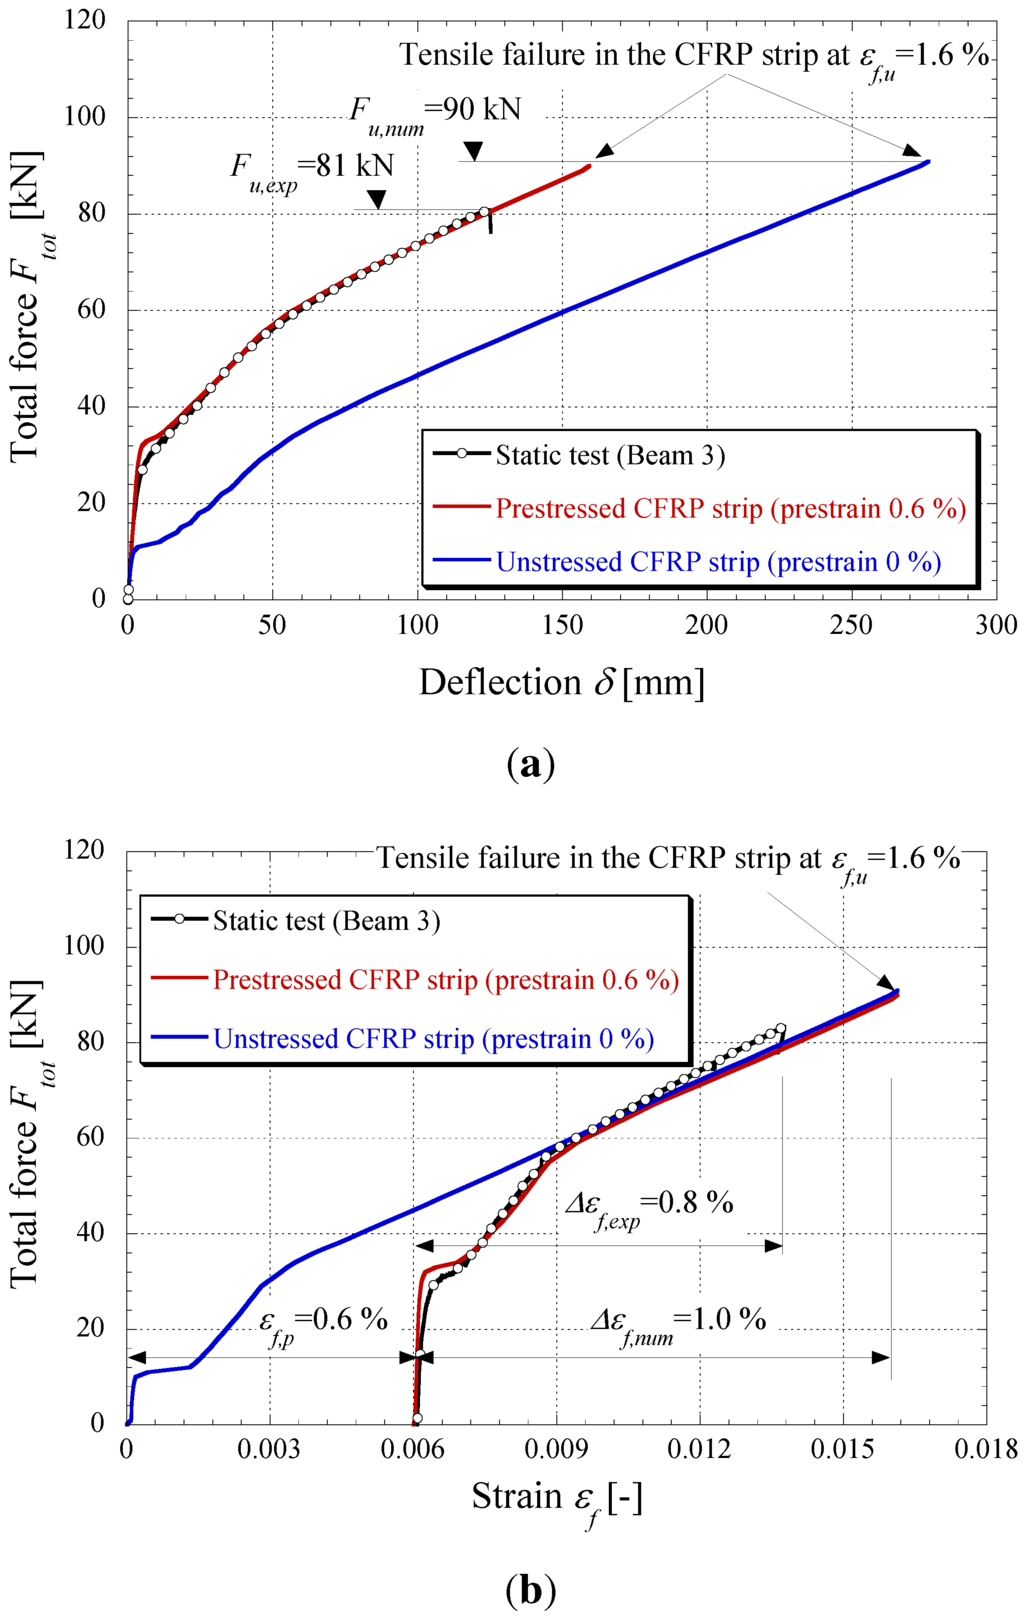
Figure 11.
Experimental and numerical (a) force-deflection, total force Ftot-midspan deflection δ and (b) force-strain at the midspan curves, total force Ftot-CFRP strip strain εf at the midspan.
Figure 11.
Experimental and numerical (a) force-deflection, total force Ftot-midspan deflection δ and (b) force-strain at the midspan curves, total force Ftot-CFRP strip strain εf at the midspan.
The numerical values of the increasing axial strain, εf, along the strip axis with a growing load are shown in Figure 12. It can be seen that no cracks and, therefore, no significant strain increase can be noticed in the gradient anchorage area. This was confirmed by the location of the last cracks shown in Table 4 by visual inspection after the test ended and the strain measurement as discussed above.
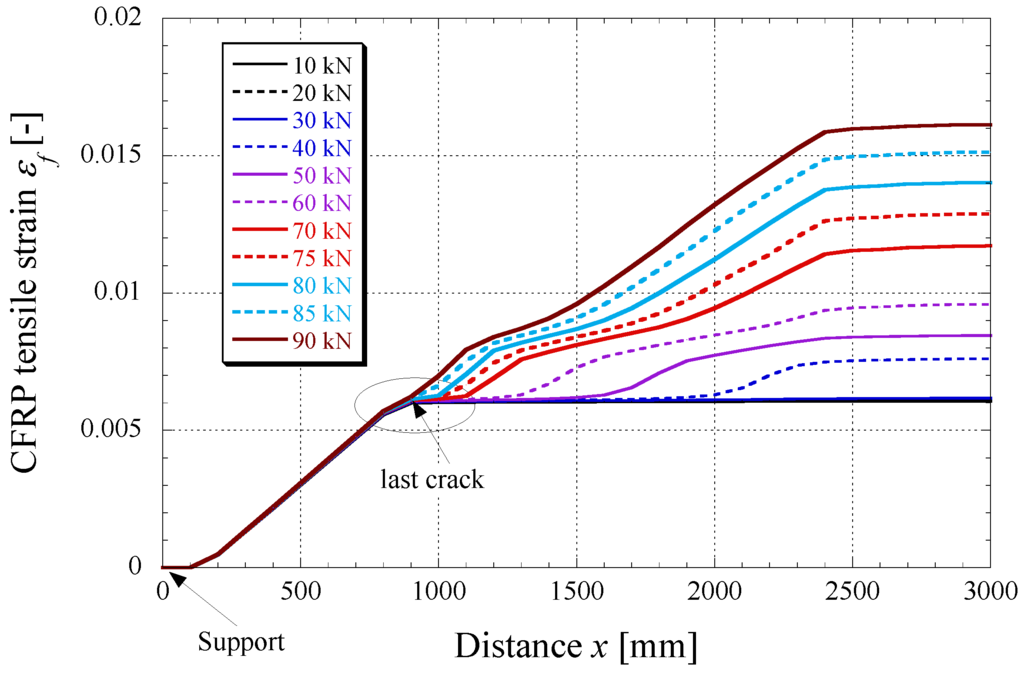
Figure 12.
CFRP strain εf-distribution over the beam length as a function of the applied force, Ftot.
Figure 12.
CFRP strain εf-distribution over the beam length as a function of the applied force, Ftot.

Finally, the model outlined in this section can be regarded as a design-oriented tool for quantifying the effect of external prestressing and the effectiveness of the gradient anchorage in preventing debonding right after the application of the prestressed FRP plate. Conversely, determining the actual failure load and, particularly, detecting the occurrence of debonding possibly induced by the applied loads should be considered as open issues: their complete understanding deserves further studies under both the experimental and theoretical standpoints. As presented in the previous section about the experimental results, failure occurred due to a strip debonding between the CFRP strip and the adhesive layer in the gradient anchorage zone. Additionally, experimental and theoretical works in the field of gradient anchorage design presented in Czaderski [11] have to be pointed out. The first implementations in a cross-section analysis tool in the framework of a master thesis at ETHZürich (Harmanci [28]) were considered very successful and deserve further attention with more sophisticated calculation tools.
5. Conclusions and Outlook
Out of the presented results, several conclusions can be drawn:
- Short-term static loading tests demonstrate the efficiency of the gradient anchorage. In the present case, the overall structural behavior is very satisfying, exhibiting a ductile deformation up to failure (ductility index μδ of 2.5).
- Flexural cracks do not develop in the present case in the gradient anchorage zone, thus not creating any premature debonding in this region.
- The observed ultimate tensile strains at failure in the CFRP strips (1.4%) is very close to the ultimate strain of the material itself (1.6%). This clearly demonstrates the benefit of prestressing, allowing one to profit from the material’s excellent mechanical performances in tension in a much better way. An even higher degree of prestrain might eventually lead to the tensile failure of the strip. Initially unstressed strips bonded to concrete cannot develop such high strains under flexural loading; failure in this case always occurs due to debonding.
- The numerical code is able to reproduce the experiments with a very high degree of accuracy, despite a slight overestimation of the cracking load.
- For future numerical applications, more advanced failure criteria in terms of debonding design will be included in the finite element code.
The present investigation has demonstrated that the gradient anchorage is a suitable technique for prestressed CFRP strips. Compared to conventional mechanical solutions, its application can be considered as faster and its final appearance as more appealing (no remaining metallic pieces). The experiments have demonstrated its structural performance for short-term tests: currently ongoing research at Empa in the field of durability aims at proving long-term suitability for structural retrofitting applications.
Acknowledgements
The authors want to acknowledge the financial support of the Swiss innovation promotion agency, as well as S&P Clever Reinforcement Company AG (Seewen, Switzerland) for their financial support in the framework of the CTIproject No. 10493.2 PFIW-IW. Additionally, the help of the testing hall staff at Empa was highly appreciated.
Conflicts of Interest
The authors declare no conflict of interest.
References
- Meier, U. Strengthening of structures using carbon fibre/epoxy composites. Constr. Build. Mater. 1995, 9, 341–351. [Google Scholar] [CrossRef]
- Bakis, C.; Bank, L.; Brown, V.; Cosenza, E.; Davalos, J.; Lesko, J.; Machida, A.; Rizkalla, S.; Triantafillou, T. Fiber-reinforced polymer composites for construction—State-of-the-art review. J. Compos. Constr. 2002, 6, 73–87. [Google Scholar] [CrossRef]
- Meier, U.; Stöcklin, I.; Terrasi, G. Civil Engineers can Make Better Use of the Strength of Fibrous Materials. In Proceedings of the International Conference on Composites in Construction (CCC), Porto, Portugal, 10–12 October 2001.
- Pellegrino, C.; Modena, C. Flexural Strengthening of real-scale RC and PRC beams with end-anchored Pretensioned FRP laminates. ACI Struct. J. 2009, 106, 319–328. [Google Scholar]
- El-Hacha, R.; Wight, R.; Green, M. Innovative System for prestressing fiber-reinforced polymer Sheets. ACI Struct. J. 2003, 100, 305–313. [Google Scholar]
- El-Hacha, R.; Green, M.; Wight, R. Strengthening Concrete Structures with Prestressed FRP Systems. In Proceedings of the 4th International Conference on Construction Materials (CONMAT), Nagoya, Japan, 24–26 August 2009.
- França, P.; Costa, A. Behavior of Flexural Strengthened Beams with Prestressed CFRP Laminates. In Proceedings of the FRPRCS-8, Patras, Greece, 18 July 2007.
- Fernandes, P.; Sena-Cruz, J. Flexural Response of HSC Girders Strengthened with 2 Non- and Prestressed CFRP Laminates. In Proceedings of the FRPRCS-11, Guimaraes, Portugal, 26–28 June 2013.
- Stöcklin, I.; Meier, U. Strengthening of Concrete Structures with Prestressed and Gradually Anchored CFRP Strips. In Proceedings of the FRPRCS-5, Cambridge, UK, 6–18 July 2001.
- Czaderski, C.; Martinelli, E.; Michels, J.; Motavalli, M. Effect of curing conditions on strength development in an epoxy resin for structural strengthening. Compos. B Eng. 2012, 43, 398–410. [Google Scholar] [CrossRef]
- Czaderski, C. Strengthening of Reinforced Concrete Members by Prestressed Externally Bonded Reinforcement with Gradient Method. Ph.D. Thesis; ETH Zürich: Zürich, Switzerland, April 2012. Available online: http://www.dx.doi.org/10.3929/ethz-a-007569614.
- Michels, J.; Czaderski, C.; El-Hacha, R.; Brönnimann, R.; Motavalli, M. Temporary bond strength of partly cured epoxy adhesive for anchoring prestressed CFRP strips on concrete. Compos. Struct. 2012, 94, 2667–2676. [Google Scholar] [CrossRef]
- Michels, J.; Czaderski, C.; El-Hacha, R.; Brönnimann, R.; Motavalli, M. Partly Cured Epoxy Adhesive for Anchoring Prestressed CFRP Strips on Concrete. In Proceedings of the 3rd Asia-Pacific Conference on FRP in Structures (APFIS), Sapporo, Japan, 2–4 February 2012.
- Czaderski, C.; Motavalli, M. 40-Year-old full-scale concrete bridge girder strengthened with prestressed CFRP plates anchored using gradient method. Compos. B Eng. 2007, 38, 878–886. [Google Scholar] [CrossRef]
- Kotynia, R.; Walendziak, R.; Stöcklin, I.; Meier, U. RC slabs strengthened with prestressed and gradually anchored CFRP strips under monotonic and cyclic loading. J. Compos. Constr. (ASCE) 2011, 15, 168–180. [Google Scholar] [CrossRef]
- Motavalli, M.; Czaderski, C.; Pfyl-Lang, K. Prestressed CFRP for strengthening of reinforced concrete structures: Recent developments at Empa, Switzerland. J. Compos. Construct. (ASCE) 2011, 15, 194–205. [Google Scholar] [CrossRef]
- Michels, J.; Czaderski, C.; Brönnimann, R.; Motavalli, M. Gradient Anchorage Method for Prestressed CFRP Strips-Principle and Application. In Proceedings of the Bridge Maintenance, Safety, Management, Resilience and Sustainability-Proceedings of the Sixth International Conference on Bridge Maintenance, Safety and Management, Safety, Management, 8–12 July 2012; pp. 1981–1986.
- Michels, J.; Cruz, J.S.; Czaderski, C.; Motavalli, M. Structural strengthening with prestressed CFRP strips anchored with the gradient method. J. Compos. Construc. (ASCE) 2013, 17, 651–661. [Google Scholar] [CrossRef]
- Michels, J.; Czaderski, C.; Martinelli, E.; Motavalli, M. RC Beams Strengthened with Prestressed and Gradually Anchored CFRP Strips. In Proceedings of the Second Middle East Conference on Smart Monitoring, Assessment and Retrofitting of Structures (SMAR), Istanbul, Turkey, 9–11 September 2013.
- Fédéation internationale du béton. Structural Concrete—Textbook on Behaviour, Design and Performance: Updated Knowledge of the CEB/FIP Model Code (1990); FIB - Féd. Int. du Bton: Lausanne, Switzerland, 1999. [Google Scholar]
- S&P-Clever-Reinforcement-Company-AG. Qualitätsprüfzeugnis 052641 IG CFK 150/2000 S100/1.2 / Charge:706032; S&P Clever Reinforcement Company AG: Seewen, Switzerland, 2011. [Google Scholar]
- S&P-Clever-Reinforcement-Company-AG. S&P Resin 220 Epoxy Adhesive - Technical Data Sheet; S&P Clever Reinforcement Company AG: Seewen, Switzerland, 2012. [Google Scholar]
- Subramaniam, K.; Carloni, C.; Nobile, L. Width effect in the interface fracture during shear debonding of FRP sheets from concrete. Eng. Fract. Mech. 2007, 74, 1241–1249. [Google Scholar]
- Oudah, F.; El-Hacha, R. A new ductility model of reinforced concrete beams strengthened using fiber reinforced polymer reinforcement. Compos. B Eng. 2012, 43, 3338–3347. [Google Scholar] [CrossRef]
- Faella, C.; Martinelli, E.; Nigro, E. Formulation and validation of a theoretical model for intermediate debonding in FRP strengthened RC beams. Compos. B Eng. 2008, 39, 645–655. [Google Scholar] [CrossRef]
- Martinelli, E.; Faella, C.; di Palma, G. Shear-flexible steel-concrete composite beams in partial interaction: Closed form “exact” expression of the stiffness matrix. J. Eng. Mech. (ASCE) 2012, 138, 151–163. [Google Scholar] [CrossRef]
- Martinelli, E.; Napoli, A.; Nunziata, B.; Realfonzo, R. A 1D finite element model for the flexural behaviour of RC beams strengthened with MF-FRP strips. Compos. Struct. 2014, 107, 190–204. [Google Scholar] [CrossRef]
- Harmanci, Y. Prestressed CFRP for Structural Retrofitting-Experimental and Analytical Investigation. Master’s Thesis, ETH Zurich, Zürich, Switzerland, 2013. [Google Scholar]
© 2014 by the authors; licensee MDPI, Basel, Switzerland. This article is an open access article distributed under the terms and conditions of the Creative Commons Attribution license (http://creativecommons.org/licenses/by/3.0/).