Article

Broadening the Variability for Peanut Breeding with a Wild Species-Derived Induced Allotetraploid

1
Embrapa Algodão, Campina Grande, PB 58428-095, Brazil
2
Departamento de Biologia, Universidade Estadual Paulista, Jaboticabal, SP 74690-900, Brazil
3
Department of Crop and Soil Science, University of Georgia, Athens, GA 30602, USA
4
Department of Plant Pathology, University of Georgia, Athens, GA 30602, USA
5
Embrapa Recursos Genéticos e Biotecnologia, Brasília, DF 70770-917, Brazil
*
Authors to whom correspondence should be addressed.
Agronomy 2020, 10(12), 1917; https://doi.org/10.3390/agronomy10121917
Submission received: 6 November 2020 / Revised: 30 November 2020 / Accepted: 4 December 2020 / Published: 6 December 2020

Abstract

:
The use of wild species in peanut breeding provides remarkable opportunities for introducing new traits to the peanut crop and it has increased in recent years. Here, we report the morphological and agronomic, including disease resistance, variation observed in 87 Recombinant Inbred Lines (RILs) that were derived from the wild ancestors of peanut and the cultivar Runner IAC-886. These lines exhibited a wide range of variation for these traits, with transgressive segregation and novel phenotypes being observed in many lines. Quantitative Trait Loci (QTLs) for agronomic and resistance traits were detected. Six RILs with contrasting phenotypes for agronomic traits and moderate resistance to leaf spots were genotyped. All of the lines had, on average, 50% wild alleles, with at least one large wild segment and multiple interspersed alleles in all of the chromosomes. Genetic exchange between subgenomes was observed. On four lines, the top of Chr 05/15, which is tetrasomic AAAA in A. hypogaea, has been restored to its AABB state by the introgression of A. ipaënsis alleles. We identified lines with good agronomic traits while harboring genome composition and structure completely different from each other and from the cultivated peanut. The variation that is observed for the fruit type is also important for a better comprehension of the domestication process in peanut. This increase in genetic diversity has great potential benefits for the peanut breeding programs.

1. Introduction

Peanut (Arachis hypogaea L.) world production reached 47.1 million tons in 2018–2019 [1]. Peanut chain supply has experienced much progress in the last decades in US and, more recently, in Brazil, where runner-types are the main cultivars. Runner-type peanuts are small seeded types of var. hypogaea, with two seeds per pod and tan seed coat color; they have been improved for high yield and kernel quality. However, cultivars with improved resistance to foliar diseases, mainly leaf spots, are still a major demand for the peanut breeding programs [2,3].
Leaf spots occur in peanut growing areas worldwide, which cause defoliation and yield reduction in more than 50% of the crop without chemical management. Early leaf spot (ELS), caused by Passalora arachidicola (Hori) U. Braun (syn. Cercospora arachidicola, teleomorph: Mycosphaerella arachidis Deighton), and late leaf spot (LLS), caused by Northopassalora personata (Berk. & M.A. Curtis) S.A. Khan & M. Kamal (syn. Cercosporidium personatum, teleomorph: Mycosphaerella berkeleyi W.A. Jenkins), can occur simultaneously in the field, with varying predominance of early or late leaf spot. The inheritance of resistance to both leaf spots is quantitative [4]. Despite the identification of resistance sources in cultivated and wild species, there is no commercial runner-market high-yielding cultivar with strong resistance, and disease management is highly dependent on chemical control.
The use of Arachis wild species in breeding programs started in the 1970s. The earliest reports of the introgression of leaf spots resistance included the diploids A. cardenasii Krapov. & W.C.Greg., A. batizocoi Krapov. & W.C.Greg., and A. diogoi Hoehne, via the hexaploid or tetraploid routes [5]. However, the highly resistant plants exhibited undesirable traits, like late maturity, prostrate growth habit, and small seeds with elongated area between the pods, while the susceptible lines exhibited extra-large kernels with high yields [6]. These initial steps resulted in the selection of breeding lines with good resistance to foliar diseases (leaf spots and rust) and nematodes, mainly having A. cardenasii as a source of resistance genes [5].
Peanut and its wild counterpart A. monticola Krapov. & Rigoni are allotetraploid species (2n = 4x = 40) with AB genomes. The putative ancestors of both allotetraploid species are A. duranensis Krapov. & W.C.Greg. and A. ipaënsis Krapov. & W.C.Greg., the A and B genome donors, respectively [7,8]. Despite the bottleneck that is associated with the peanut origin, the cultivated species is morphologically diverse and it has evolved through genetic mechanisms, like mobile-element activity, deletions, and homeologous recombination [7]. A change in ploidy level and reproductive isolation from its wild relatives are associated with the speciation of both allotetraploid species. Allotetraploidization results in some immediate physiological changes, in plant size, transpiration characteristics. and photosynthetic capacity, but only small or insignificant changes in agronomic traits, like seed size [9]. Notably, it is exactly these agronomic traits, especially fruit type, which mostly differentiate the cultivated peanut A. hypogaea (not articulate fruit) from the wild species (biarticulate fruit) in the genus Arachis; even A. monticola has biarticulate fruit [10]. Fruit type is also an important trait in the pre-breeding program, because interspecific genotypes with higher levels of resistance often exhibit biarticulated fruits [6].
Here, we report the characterization of interspecific peanut lines with variability for morphological, agronomic, and resistance traits, in a RIL population that is derived from ‘Runner IAC 886′ (an important Runner market-type cultivar in Brazil) and the diploid wild species A. ipaënsis and A. duranensis. We detected Quantitative Trait Loci (QTLs) that were associated with agronomic and resistance traits, aiming at the use of marker-assisted selection on peanut breeding programs. The analysis of the introgressed regions in selected lines showed the introduction of new alleles and genome structure variations, with varying degrees of tetrasomic recombination. In addition, we discuss the importance of the shift of fruit type (from biarticulated to not articulated) in the domestication process of this underground crop. These findings exemplify the breath of genetic variation that can be obtained with the use of this induced allopolyploid.

2. Materials and Methods

2.1. Population Development

Eighty-seven recombinant inbred lines (RILs) in the F8 and F9 generations were derived from the cross between A. hypogaea ‘Runner IAC 886′and the induced allotetraploid (A. ipaënsis K 30076 x A. duranensis V 14167)4x [11,12]. Hereafter, we shall refer to the induced allotetraploid as IpaDur1. Lines were produced from a single F1 plant, which was cloned by cuttings to produce enough seeds to the development of a mapping population and single-seed descent to the F8 and F9 generations.

2.2. Morphological, Agronomic and Leaf Spots Resistance Evaluations

The evaluations were performed at Embrapa Rice and Beans Experimental Station in Santo Antônio de Goiás, Goiás State, Brazil (Lat. 16°28′00″ S; Long. 49°17′00″ W; Alt. 823 m). During the 2013/2014 season, the 87 F8 RILs, and their parents (‘Runner IAC 886′ and IpaDur1) and the wild diploid accessions A. ipaënsis K 30076 and A. duranensis V 14167 were planted in individual pots at the greenhouse, and evaluated at 100 days after planting for stem pigmentation, peg pigmentation, and standard petal color, as described in [13]. Stem surface and leaflet surface were recorded as the absence or presence of hairs. Segregation data for standard petal color were analyzed by chi-square analysis for goodness-of-fit (p < 0.05) to the expected genetic ratios.
The evaluation of fruit type was designed in order to assess the wide variation that was observed in the RILs and their parents. Based on observations of this variation, we created a new scale that describes the wild, cultivated, and intermediate stages. This new grade scale was initially based on descriptions of the fruits for the wild species (biarticulated fruits with a long isthmus) and the cultivated species (not articulated fruit) in [10], and on the descriptors for pod constriction (none, slight, moderate, deep, and very deep) in [13]. It allowed for us to classify the fruit type within nine categories, comprising all of the variation that was observed in the RIL population, from wild (biarticulated) to cultivated (not articulated) fruit type (Figure 1, Table 1).
During the 2014/15 season, the 87 F9 RILs and the parents (‘Runner IAC 886′, IpaDur1, and the wild diploids) were evaluated in field conditions. The experimental design was augmented block, with four replications. Each genotype was planted in plots (one row, 1 m long, with five plants) (0.20 m between plants and 0.91 m between rows). ‘Runner IAC 886′ and ‘IAC 505′ were used as checks. The management of the experiment included the use of fertilizers and gypsum, but no chemical control of foliar diseases, in order to favor leaf spots epidemics.
Three agronomic traits were evaluated. The height of main stem (HMS) was measured from cotyledonary axil up to terminal bud, at 101 days after planting, the mean of five plants. Growth habit (GH) followed the 1–6 scale (1. Procumbent-1, 2. Procumbent-2, 3. Decumbent-1, 4. Decumbent-2, 5. Decumbent-3 and 6. Erect), as described in [13]. Canopy was evaluated according to the grade scale 1–10 described by [14], where rate 1 indicates a plant with one or two lateral branches without secondary ramifications (wild-type phenotype), and 10 corresponds to a closed, exceptionally regular runner peanut-type canopy. The growth habit and canopy were recorded at 138 days after planting.
Resistance to leaf spots was evaluated for both early and late leaf spots, based on foliar lesion area and the defoliation grade scale varying from 1 (no symptoms) to 9 (complete defoliation), as described by [15]. Evaluations were performed at 104, 118, 138, and 146 days after planting. Five plants were evaluated in each plot. Severity grades were used in order to calculate the severity means (MSEV) and the severity index (ISEV) for each plot [16]. MSEV and ISEV data were used in order to calculate the area under disease progress curve for severity means (AUDPC-MSEV) and severity index (AUDPC-ISEV).
The REML/BLUP (Restricted Maximum Likelihood/Best Linear Unbiased Prediction) method, or mixed model methodology, was used for the statistical analysis of leaf spots resistance data. This methodology is an optimal procedure of genotyping evaluation with imbalanced data, like augmented block design [17]. In this analysis, the rank order of the genotypic values (GV) is used in order to select the most resistant lines [18,19]. The software Selegen-REML/BLUP was used for the estimation of variance components and the prediction of genetic values [17], while using the model 76. In this case, the statistical model is described by:
y = Xf + Zg + Wb + e
Where y is the vector of phenotypic data, f is the vector of the fixed effects (check means and treatments means), g is the vector of genotypic effects (assumed to be random), b is the vector of block effects (assumed to be random), and e is the error or residual vector (random). The capital letters refer to the incidence matrices for these purposes. The likelihood ratio test (LRT) and analysis of deviance (ANADEV) assessed the significance of the genotypic effects of the model, as described by [17].

2.3. Linkage Map Construction

Linkage maps for the same population used in this study have been constructed [12,20,21]. We used the 1469 microsatellite or MITE (miniature inverted-repeat transposable element) markers and the 366 SNPs that were mapped in these three studies to construct a saturated linkage map, while using JoinMap 4.0 [22]. Based on this map, genomic regions with no recombination were identified (pairs or groups of loci with 0 cM distance) and only one locus per redundant group was maintained for further analyses. The remaining loci plus seven microsatellite loci associated to QTLs for LLS and rust resistance in peanut [23,24] that had not been previously genotyped in this population were used for the construction of a framework map while using Mapmaker Macintosh 2.0 and Mapmaker/EXP 3.0 [25,26]. These seven microsatellite loci were genotyped while using fluorescent-labeled primers according to [27], but using an ABI 3730 automated DNA sequencer and GeneMapper v.4.1 (Applied Biosystems, Foster City, CA, USA) for allele sizing. A chi-squared test was performed in order to test for 1:1 segregation on all scored markers. Only marker loci that did not show segregation distortion (p < 0.05) were used for the initial map construction, in order to eliminate spurious linkages. A minimum LOD score of 5.5 and maximum recombination fraction of 0.35 were set as the thresholds for linkage group (LG) determination with the ‘‘group’’ command. The most likely marker order within each LG was estimated by the matrix correlation method while using the ‘‘first order’’ command. The marker orders were confirmed by permuting all adjacent triple orders (‘‘ripple’’ command). After the establishment of the group orders, the LOD score was set to 3.0 in order to include additional and distorted markers in the groups. The exact position of the new markers within each group was determined using the “try” command, which compares the maximum-likelihood of each marker order after placing the markers, one-by-one, into every interval of the established order. The new marker orders were again confirmed with the ‘‘ripple’’ command. The recombination fractions were converted into map distances in centimorgans (cM) while using the Kosambi mapping function and the “error detection” command that is available in Mapmaker/EXP 3.0 [25,26].

2.4. QTL Analysis

The newly developed map was used for QTL analysis. Phenotyping data included four traits that were related to leaf spots resistance: the severity means (MSEV) and severity index (ISEV) evaluated at 138 days after planting, and the area under disease progress curve for severity means and severity index (AUDPC-MSEV and AUDPC-ISEV). The height of main stem (HMS), growth habit (GH), canopy, and fruit type (FT) were also included in the QTL analysis. The normality of data distribution was evaluated by skewness and kurtosis values while using WinQTL Cartographer, version 2.5 [28]. QTLs were mapped using the composite interval mapping (CIM) method and WinQTL Cartographer, version 2.5 [28]. For a not normally distributed trait, QTL mapping was performed by the nonparametric Kruskal–Wallis (K-W) test while using the R/QTL software [29]. CIM analysis was performed using the Standard Model (Model 6), scanning the genetic map and estimating the likelihood of a QTL and its corresponding effects at every 1 cM, while using eight significant marker cofactors to adjust the phenotypic effects that are associated with other positions in the genetic map. A window size of 10 cM was used and, therefore, cofactors within 10 cM on either side of the QTL test site were not included in the QTL model. The thresholds were determined for each trait by permutation tests [30,31], while using 1000 permutations and the significance levels of 0.05 for CIM analysis, and 0.01 for the K-W test. The graphic presentation of the linkage groups and the significant QTLs was drawn with MapChart, version 2.1 [32].

2.5. SNP Genotyping and Genetic Analysis of Selected Lines

Genomic DNA was extracted from young leaves while using Qiagen Plant DNeasy kit (Qiagen, Germantown, MD) and quantified by Qubit 4 fluorometer (Thermofisher Scientific, Waltham, MA, USA). Genotyping was performed with the Axiom Arachis SNP array v2 [33,34] and then analyzed with the Axiom Analysis Suit v.1.1.0.616 (Thermofisher Scientific, Waltham, MA, USA). Data were filtered by quality using the QC call rate > 90%. The genotyping information was filtered, allowing for a minor allele frequency (MAF) > 0.05 and 20% missing calls. The SNP assays were done on six F2:6 RILs (T107, T108, T126, T132, T142, and T187), their parents, A. hypogaea ‘Runner IAC 886′ and IpaDur1, and the wild diploid species A. duranensis V 14167 (A genome) and A. ipaënsis K 30076 (B genome).
The identification of introgressions—the general strategy for detecting wild introgressions in the A. hypogaea genome was to identify SNPs that were characteristic to each A. duranensis and A. ipaënsis in the pedigree of the selected lines, as described in [14]. Firstly, characteristic markers for each species were identified in the SNP calling, which used a panel of diploid genotypes plus a single tetraploid genotype (A. hypogaea ‘Runner IAC 886′), as follows:
A. duranensis characteristic markers: A. duranensis ≠ (A. hypogaea = A. ipaënsis)
A. ipaënsis characteristic markers: A. ipaënsis ≠ (A. hypogaea = A. duranensis)
These markers detect wild contributions from each wild parent.
Tetrasomic characteristic markers—(homozygous and polymorphic markers for A. duranensis and A. ipaënsis) ≠ heterozygous markers for A. hypogaea. These markers detected regions with tetrasomic composition (AAAA or BBBB) that was derived from recombination between A and B subgenomes.

3. Results

3.1. Morphological Traits

A wide range of variation was observed in the RILs for the evaluated morphological and agronomic traits (Figure 2 and Additional File S1). All of the parents of this population (‘Runner IAC 886′, A. ipaënsis K 30076, A. duranensis V 14167, and IpaDur1) exhibited three or four rows of hairs along the main stem and the leaflet surface, but nine RILs were glabrous for stem surface and two RILs were glabrous for leaflet surface. Both wild species and IpaDur1 exhibited peg and stem pigmentation, while ‘Runner IAC 886′ did not. Pigmentation in the peg was observed in 34 RILs (39.1%), absent in 43 RILs (49.4%), and 10 RILs (11.5%) were evaluated as mixed, meaning that pegs with or without pigmentation were observed in the same plant. Stem pigmentation was observed in 68 RILs (78.2%) and the absence was observed in 19 (21.8%).
Standard petal color is distinct for the wild diploid parents, with orange for the B genome A. ipaënsis and yellow for the A genome A. duranensis. The allotetraploid AABB IpaDur1 has yellow petals, while the cultivated parent ‘Runner IAC 886’ has orange petals. The F1 resulting from the cross between ‘Runner IAC 886’ and IpaDur1 also has yellow standard. Considering these observations, we tested the hypothesis for a single-gene inheritance of standard petal color in peanut, with yellow being dominant over orange, and using this population as a test cross. The segregation observed in the 87 F9 RILs was 39 yellow and 48 orange, fitting the 1:1 standard ratio according to the chi-square test (p = 0.335).

3.2. Fruit Types in an Interspecific Population

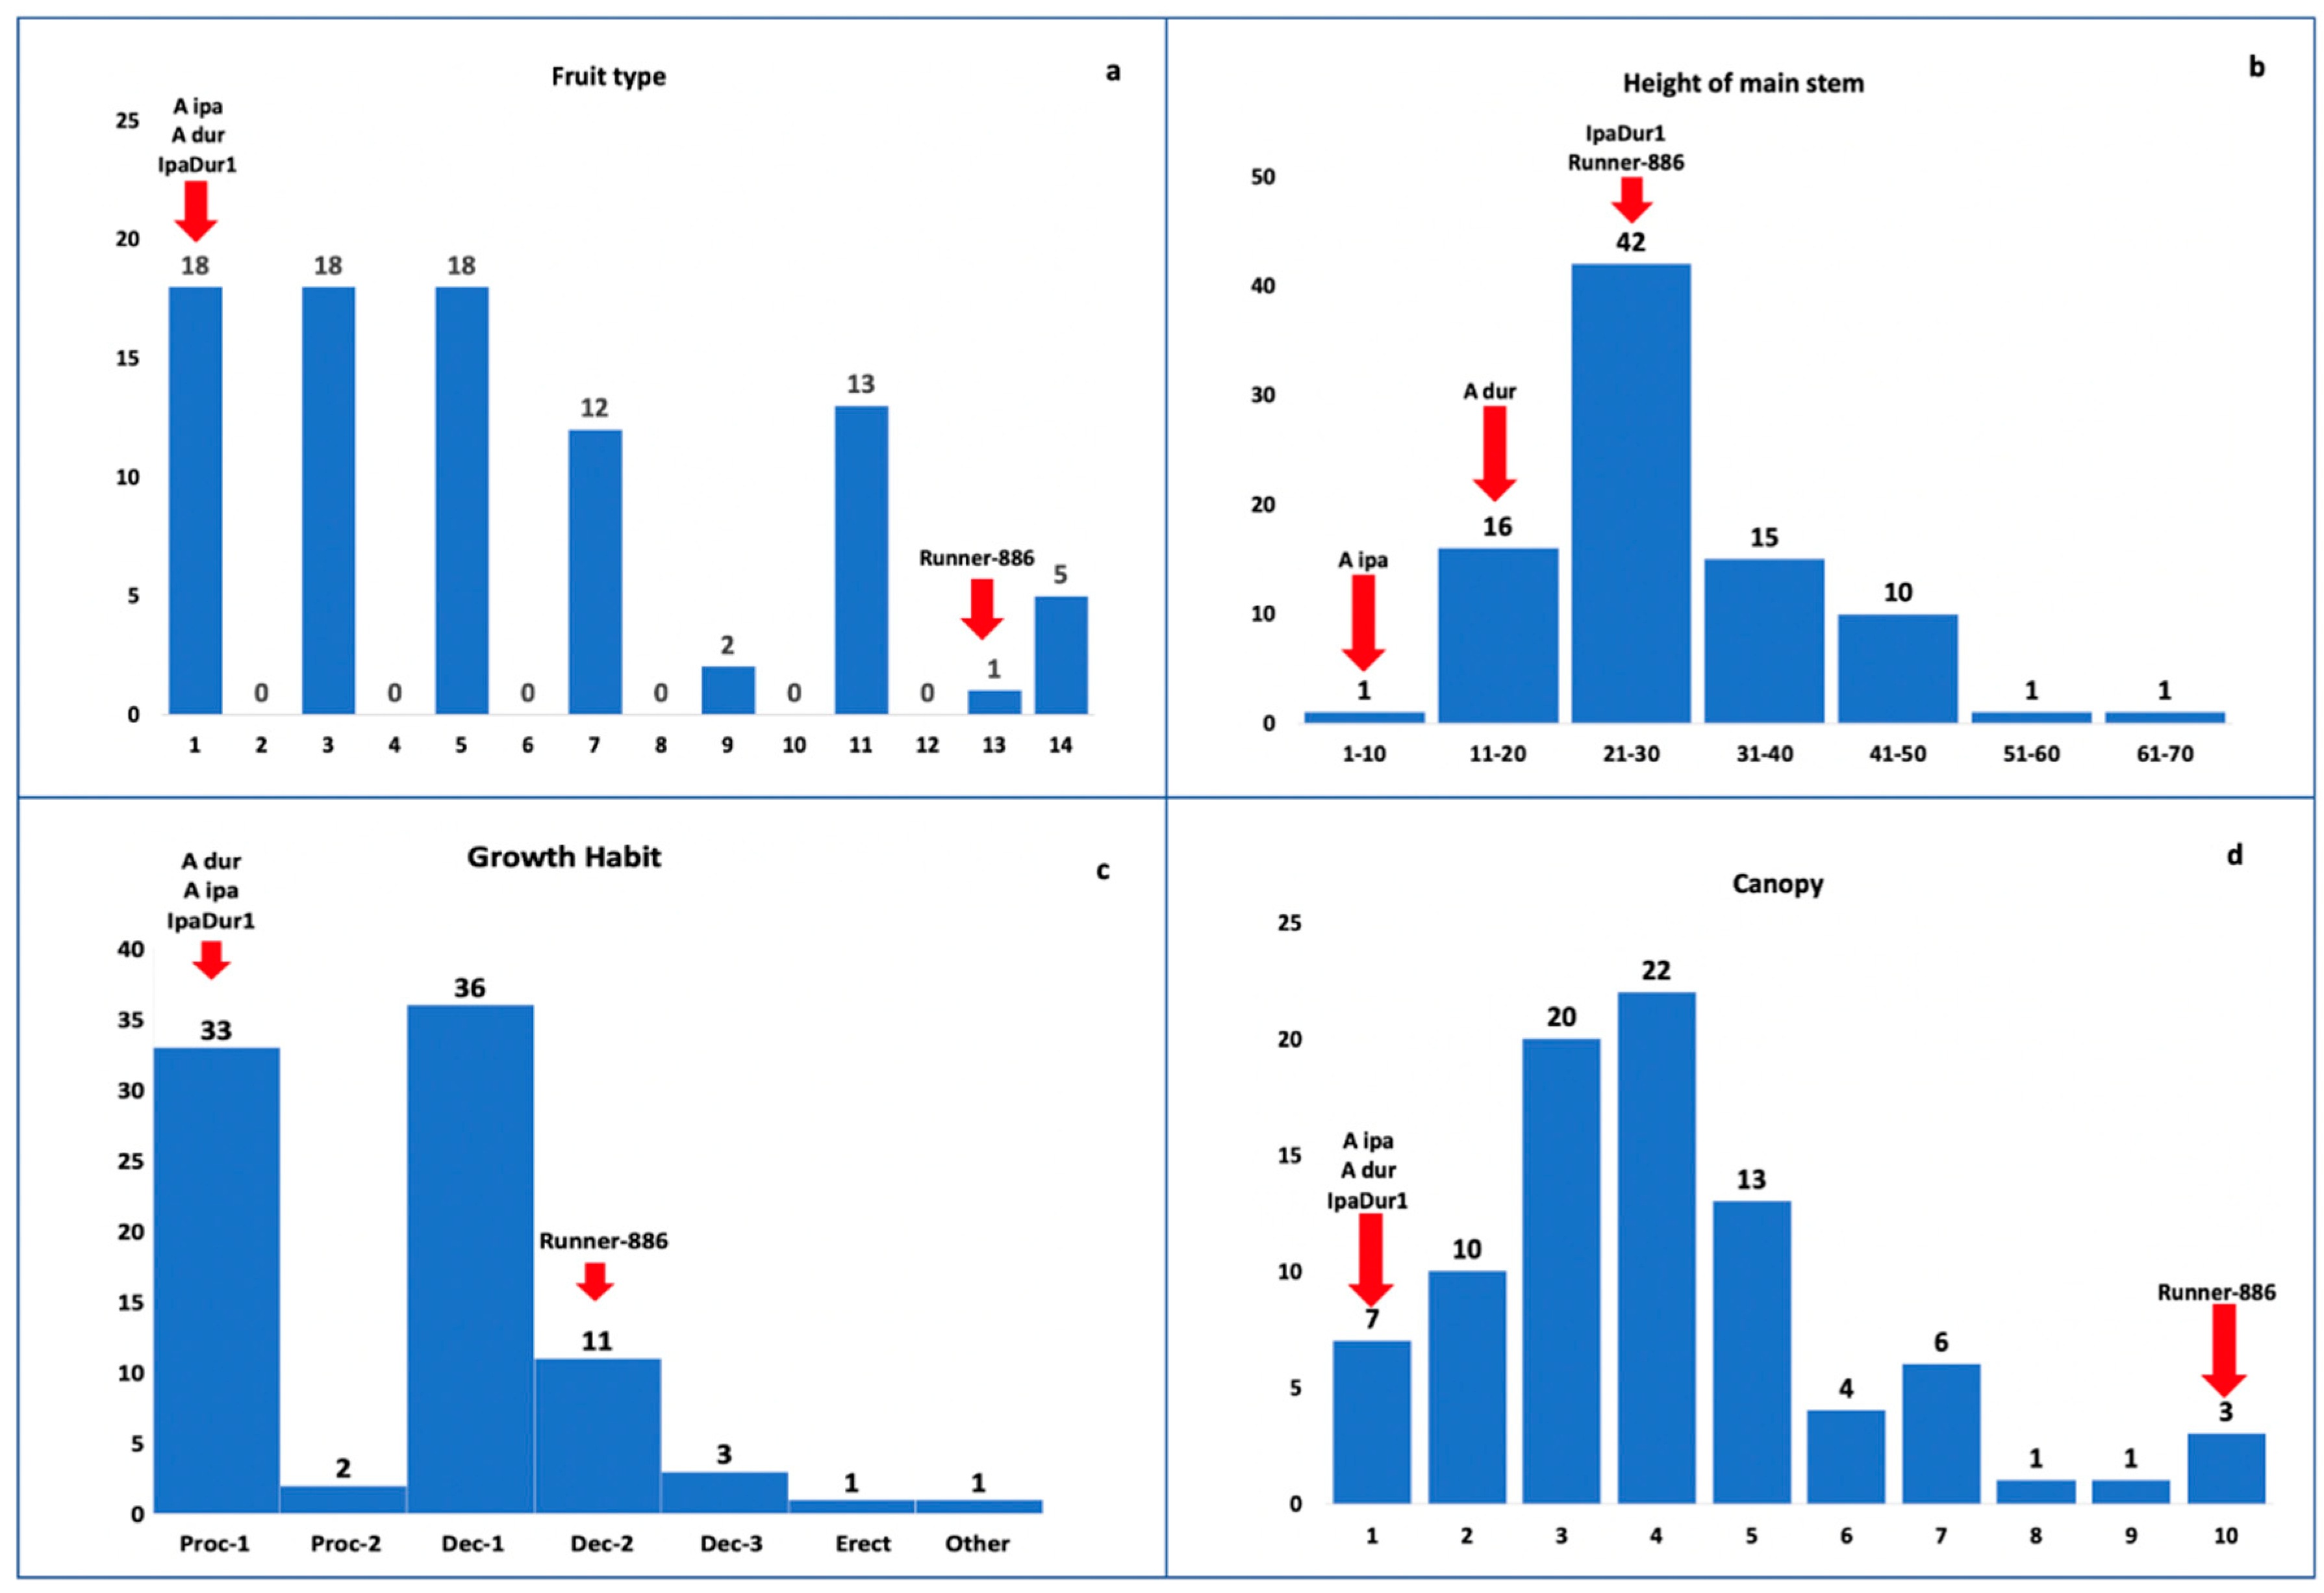
The typical wild type biarticulated fruit was observed in the wild species and IpaDur1, while ‘Runner IAC 886′ exhibited non-articulated fruits with moderate constriction (Figure 3a). Most of the RILs (54) exhibited the wild type biarticulated fruit, with articles being separated by an isthmus with long (rate 1), mixed (rate 3), or intermediate (rate 5) length. The cultivated fruit type, non-articulated with varying degrees of pod constriction, was observed in 21 RILs, being two with very deep constriction (rate 9), 13 with deep constriction (rate 11), one with moderate constriction (rate 13), while mixed rates for moderate constriction and no constriction were observed in five RILs (rate 14). Mixed rates for genotypes with wild and cultivated fruit type were observed in 12 RILs (rate 7).

3.3. Agronomic Traits

The height of main stem was distinct among the wild ancestors of peanut, with an average of 7.5 cm for A. ipaënsis and 14.8 cm for A. duranensis. IpaDur1 had a higher main stem (27.8 cm), close to ‘Runner IAC 886′ (27.3 cm). The height main stem in the RILs varied from 10 cm (T041) to 63 cm (T061) (Figure 3b).
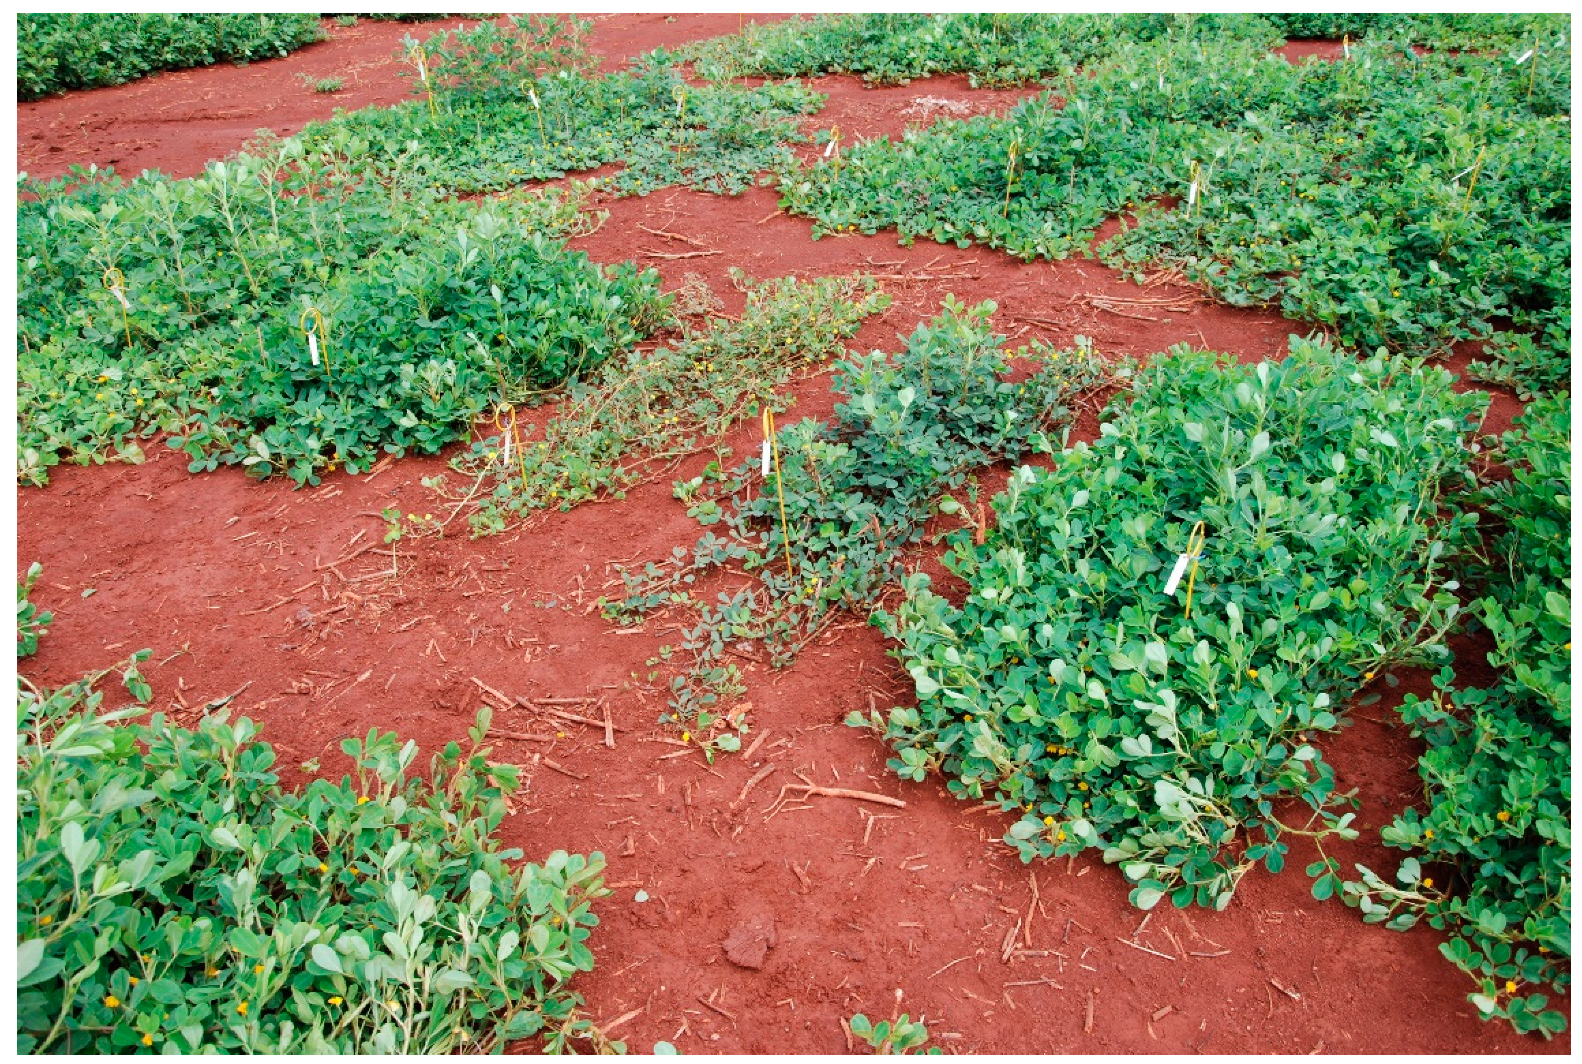
The wilds and IpaDur1 exhibited the same growth habit (procumbent 1) and canopy (one or two lateral branches with no ramifications), while ‘Runner IAC 886′ exhibited decumbent-2 growth habit and a dense canopy (Figure 2). The variation that was observed in the RILs for both traits was larger than that observed for the wild ancestors, IpaDur1, or the cultivar, used as parents (Figure 3c). The RILs exhibited all six classes of growth habit, as described in [13], with 33 RILs being classified as procumbent-1, two as procumbent-2, 36 as decumbent-1, 11 as decumbent-2, three as decumbent-3, and one as erect. One RIL was classified as intermediate procumbent-2 and decumbent-1. Transgressive segregation was also observed for canopy, with seven RILs exhibiting the same canopy as the wild parents (rate 1), ten rated 2, 20 rated 3, 22 rated 4, 13 rated 5, four rated 6, six rated 7, one rated 8, one rated 9, and three rated 10 (Figure 3d).

3.4. Leaf Spot Resistance

The evaluation of leaf spots resistance considered the severity means (MSEV) and disease index (ISEV), recorded at 138 days after planting, as well as the area under disease progress curve for severity means (AUDPC-MSEV) and severity index (AUDPC-ISEV), when considering the evaluations that were recorded at four dates (104, 118, 138, and 146 days). All of the variables were significant, according to the analysis of deviance (Table 2).
The four parental genotypes exhibited variation for leaf spots resistance (Supplementary File S1). ‘Runner IAC 886′ ranked among the 25 most susceptible genotypes, with severe lesions on lower and middle leaves, less severe lesions on top leaves, extensive defoliation of lower leaves, and the defoliation of some leaflets evident on middle leaves (not shown). Arachis ipaënsis was ranked among the more resistant genotypes when considering MSEV and ISEV, and as the most resistant genotype for AUDPC-MSEV and AUDPC-ISEV. The severity that was observed in A. ipaënsis corresponded to lesions on all lower and middle leaves and only the defoliation of lower leaves. Arachis duranensis was ranked at an intermediate position for MSEV and ISEV, and among the 10 most resistant genotypes for AUDPC-MSEV and AUDPC-ISEV—the observed severity corresponded to lesions that were severe on lower and middle leaves; lesions on top leaves, but less severe, with extensive defoliation of lower leaves and the defoliation of some leaflets evident on middle leaves. IpaDur1 was ranked among the more resistant genotypes when considering MSEV and ISEV, and in an intermediate position for AUDPC-MSEV or AUDPC-ISEV.
Among the RILs, a moderate range of variation for leafspots resistance was observed, and many were grouped among the more resistant genotypes, when considering all of the variables (Supplementary File S1). The RIL T047 ranked second for MSEV and third for ISEV, but for AUDPC-MSEV and AUDPC-ISEV, it was the most resistant RIL, with lesions on the lower and middle leaves, but some defoliation only of lower leaves. The RILs T040, T041, and T169 also ranked among the most resistant genotypes when considering the four variables, despite changes in the ranking observed. Some RILs ranked among the more susceptible genotypes, with higher severity than ‘Runner IAC 886′. The RIL T149 consistently ranked among the more susceptible genotypes when considering all of the variables, with lesions on all leaves, complete defoliation of lower leaves, and some defoliation of middle leaves.

3.5. Linkage Map

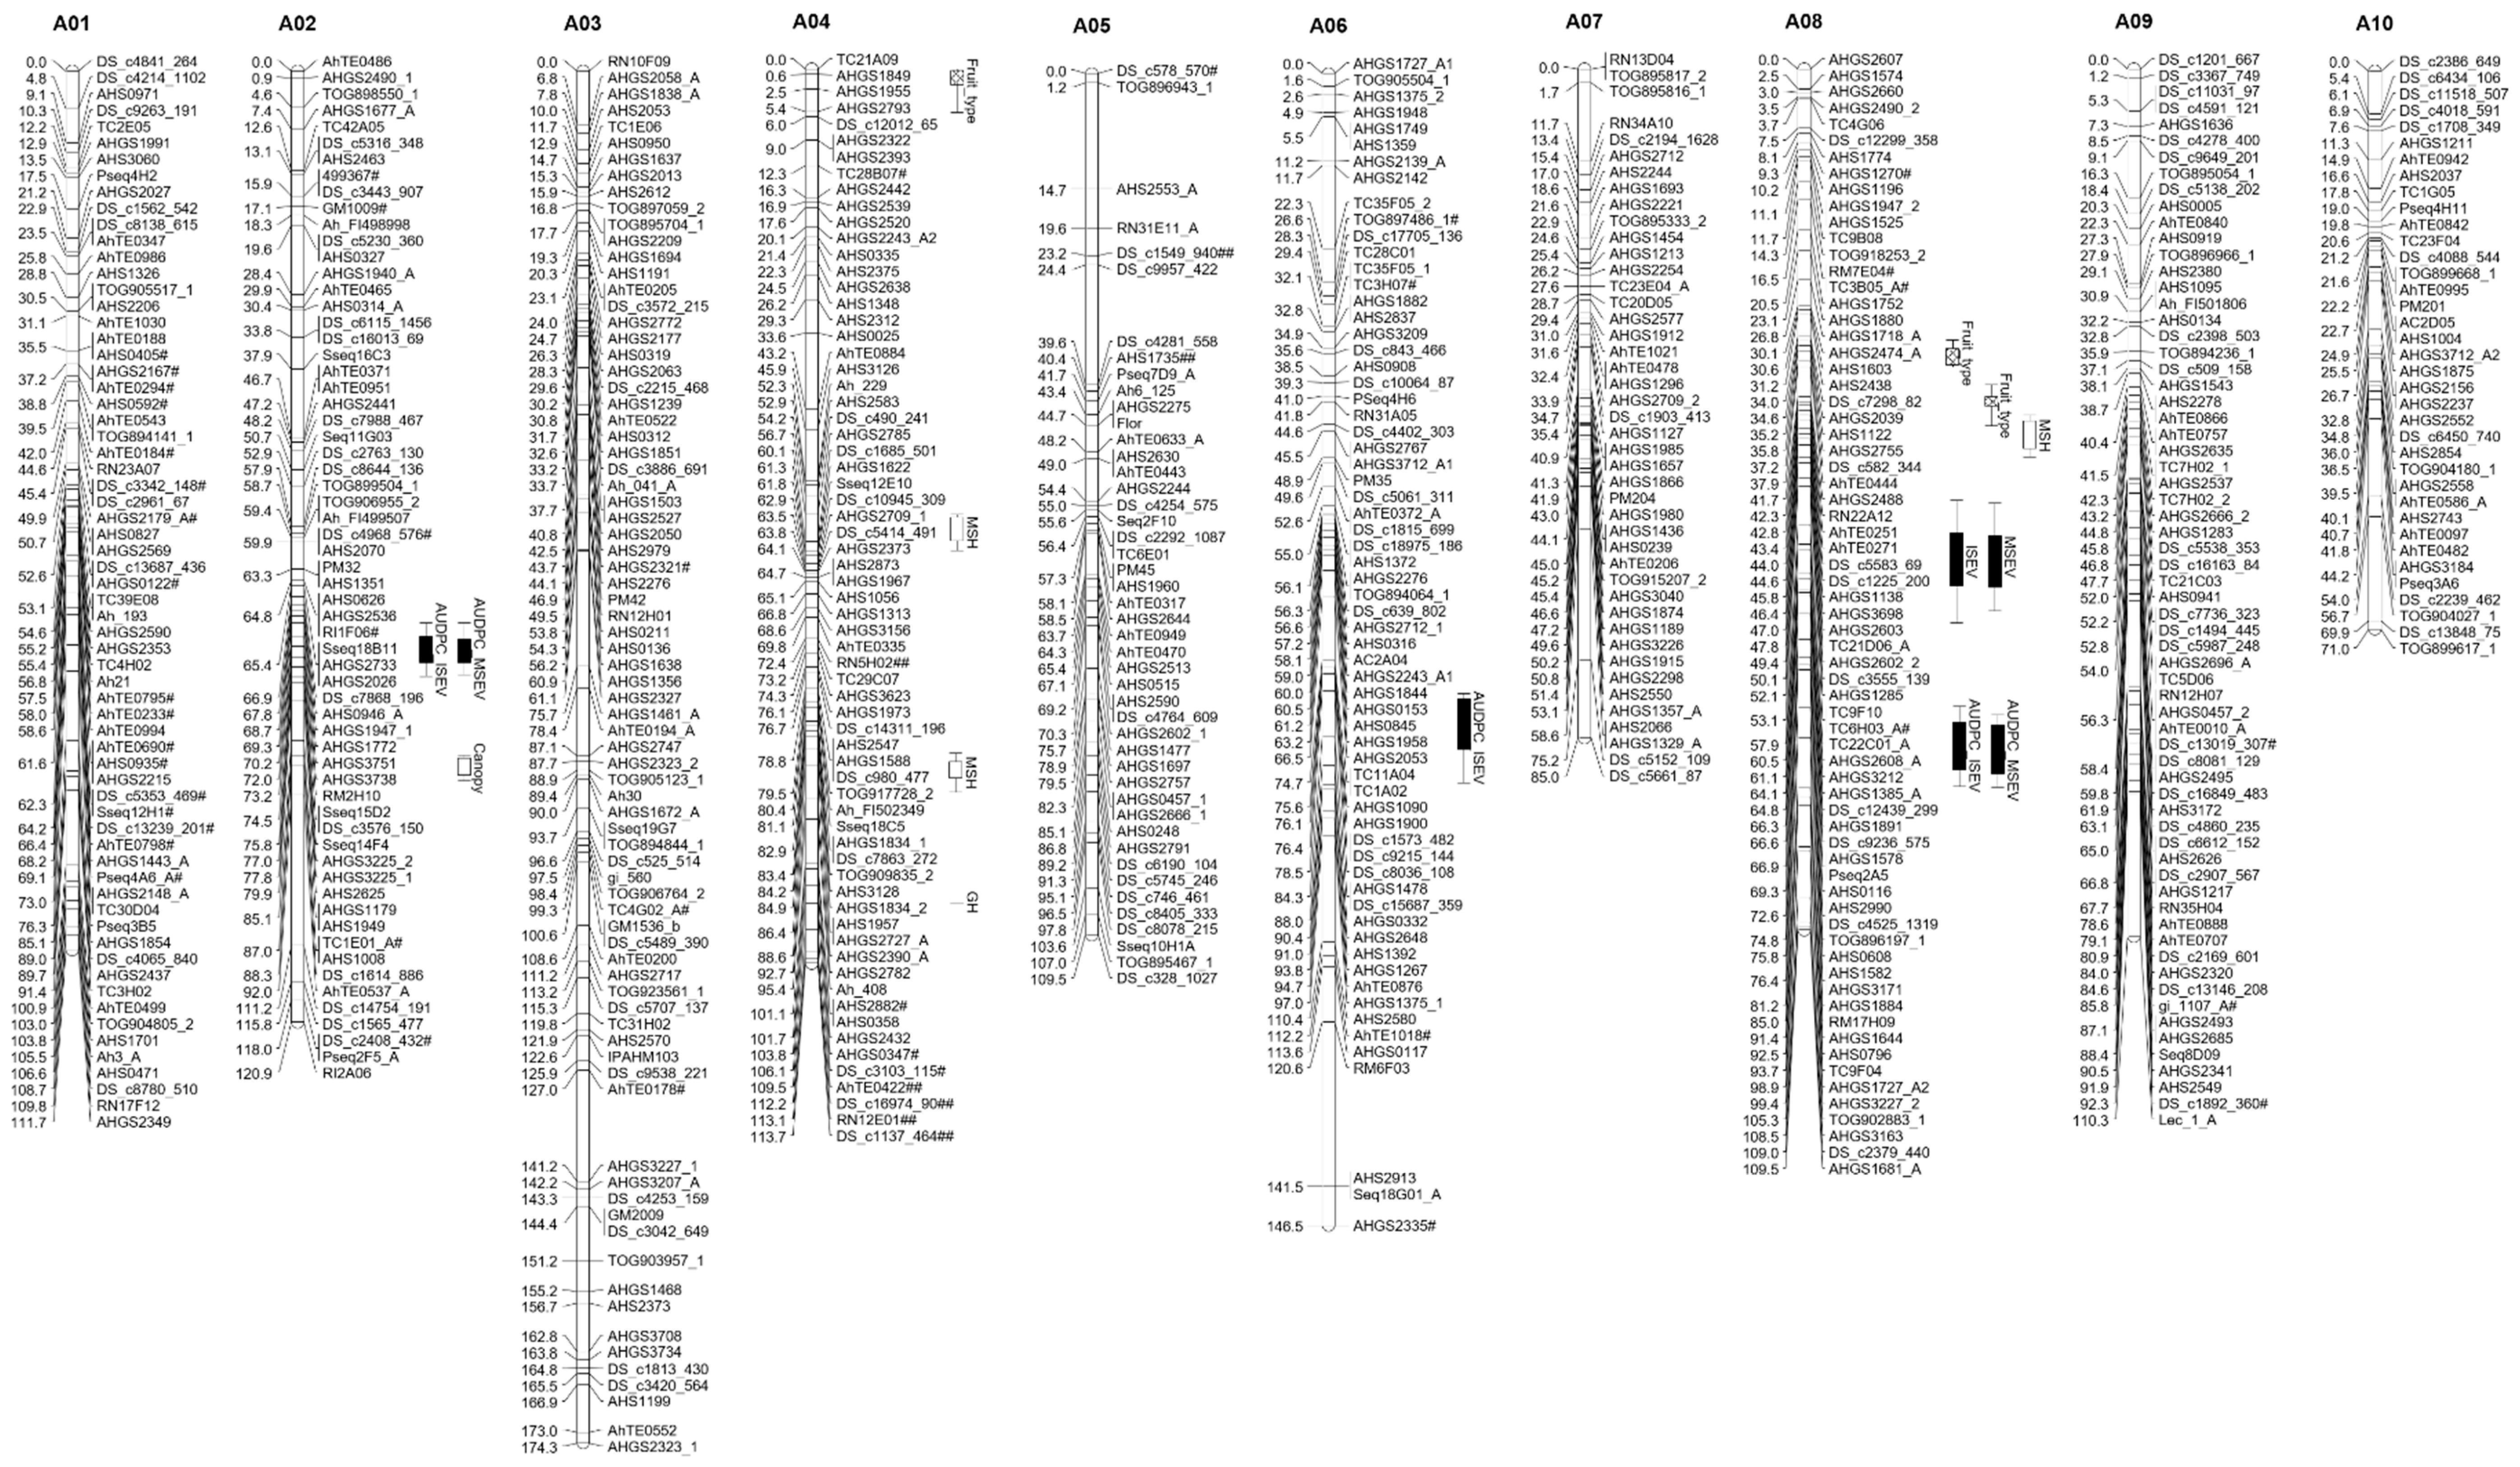
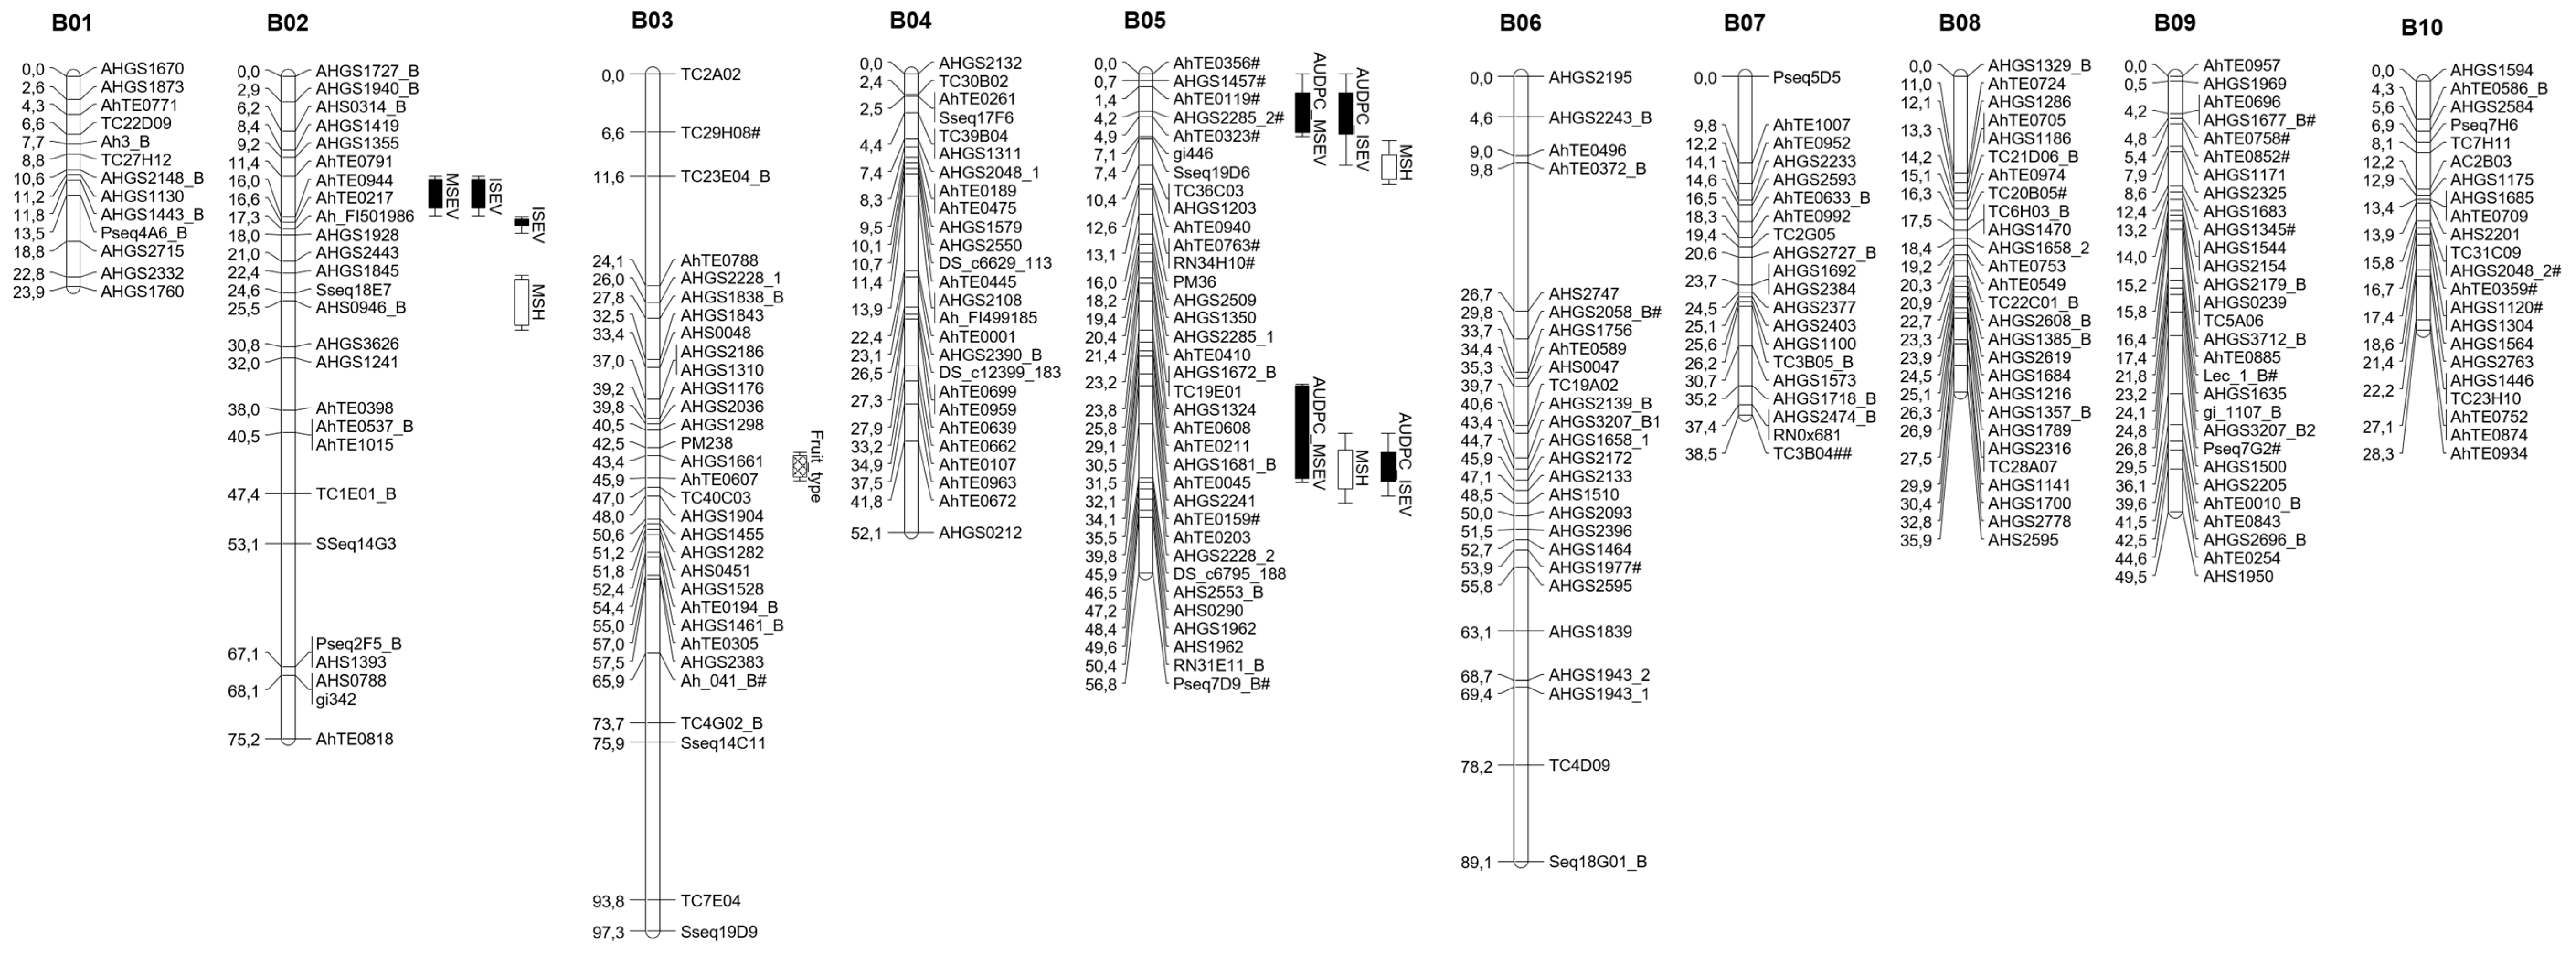
Data from 1842 markers genotyped in a F6 population that were obtained from a cross between ‘Runner IAC 886′ and IpaDur1 were used for map construction. Using a minimum LOD score of 3.0 and a maximum recombination fraction of 0.35, 1756 markers (1207 microsatellite, 352 SNPs, and 197 MITE markers) mapped into 20 linkage groups, covering a total distance of 1196.2 cM while using JoinMap (Supplementary File S2). This map had a great number of co-segregating markers (markers with distance equals to 0 cM). These blocks of co-segregating markers contained a different number of markers and they were scattered throughout the 20 LGs. Only one locus per map block was maintained and a framework map was constructed while using Mapmaker (Figure 4). The resulting linkage framework map contained 857 loci (586 microsatellite, 157 SNP, and 114 MITE markers) and 20 linkage groups, with a total distance of 1699.0 cM. The groups ranged from 23.9 cM (with 13 markers) to 174.3 cM (79 markers), with an average distance of 1.9 cM between adjacent markers. The linkage groups were numbered by mapping the marker sequences to the combined chromosomal pseudomolecule sequences of A. duranensis V 14167 and A. ipaënsis K 30076 [20]. SNP marker names start with DS_ or TOG_, and MITE markers, with AhTE. All of the other marker names correspond to microsatellites that developed from different authors. Some microsatellite primer pairs amplified two loci, and these were identified by the numbers _1 and _2 after the locus name (Figure 4). Markers that mapped on both genomes have _A or _B after their names if they mapped on linkage groups of the A or the B genome, respectively. All of the other marker names correspond to microsatellites developed by different authors.
One-hundred forty-five markers (7.9%) out of the 1842 markers showed deviation from the expected 1:1 ratio, at p < 0.05. Of these, 82 markers were skewed towards A. hypogaea and 63 markers towards the amphidiploid. Most of the linkage groups have few distorted markers. The exceptions were A1, A4, A5, A9, and B5 with a high number of distorted markers, towards A. hypogaea alleles, and B9 and B10 with and excess of the amphidiploid alleles. The distorted markers at p < 0.05 were identified by # and some very few highly distorted markers were identified by ## (Figure 4).

3.6. QTL Identification

The skewness and kurtosis values showed that the evaluated traits were nearly normally distributed, except fruit type and growth habit (data not shown). More than three phenotypic classes were observed for growth habit, canopy, and fruit type, suggesting more than one gene controlling these traits; therefore, they were considered to be quantitative traits. The fruit type distribution reached the normality by log-transformation and these values were used for QTL analysis. However, for growth habit, no transformation approximated the distribution to normality, and a non-parametric analysis (K-W test) was performed for QTL detection. At least one QTL was detected for each of the eight traits analyzed (Table 3). The LOD significance threshold estimated for each trait ranged from 2.4 to 3.1, and only QTLs with LOD values exceeding these thresholds were included.
Two common QTLs were detected for MSEV and ISEV, located in chromosomes A8 (64.1 cM) and B02 (13.5 cM). An additional QTL was found for ISEV, which was also located in chromosome B02, position 17.3 cM. For the area under disease progress curve, four QTLs were detected for both traits (AUDPC-MSEV and AUDPC-ISEV), which were located in chromosomes A02 (73.2–74.5 cM), A08 (85.0 cM), and B05 (4.2 cM and 45.9 cM). An additional QTL was detected for AUDPC-ISEV, which was located on chromosome A06 (84.3 cM). The total variance explained by each QTL ranged from 6.4% to 20.1% (Table 3).
For the agronomic traits, six QTLs were detected for the height of main stem (HMS), one for growth habit (GH), one for canopy, and four QTLs for fruit type. The total variance that was explained by each of these QTLs ranged from 11.0% to 21.6% (Table 3).

3.7. Genotyping and Genetic Analysis of Selected RILs with Contrasting Traits

Six RILs with contrasting phenotypes for agronomic and resistance traits were chosen for close inspection in the Axiom Arachis2 SNP array (Table 4).
The cultivated fruit type (11), intermediate canopy (5), and high main stem (38.5 cm) were the main traits for the selection of T132. The RIL T187 is the only genotype with erect growth habit (6) and it also has a low height of main stem. The combination of these characteristics with a dense canopy (10) and moderate leaf spots resistance are also unique among these pre-breeding plant selections.
The RIL T126 exhibited canopy (rate 2) very close to the wild species (rate 1), with a high main stem (41 cm) and mixed wild-cultivated fruit type (rate 7). With similar height of main stem, growth habit, and intermediate canopy, the RILs T107 and T141 were selected for the regular cultivated fruit type, with varying degrees of constriction (rates 11 and 9, respectively). T108 and T142 exhibited moderate resistance to leaf spots, decumbent-1 growth habit, and canopy closer to the cultivated parent, but T108 had a higher main stem and mixed cultivated fruit type (rate 14).
DNAs of A. duranensis (AA), A. ipaënsis (BB), the induced allotetraploid IpaDur1 (AABB), A. hypogaea ‘IAC-Runner 886′ (AABB), and the six RILs with contrasting phenotypes (AABB genome) were genotyped with the 48 K Affymetrix chip [33,34]. After filtering, 445 A. duranensis characteristic markers, 463 A. ipaënsis characteristic markers, and 3930 tetrasomic characteristic markers were used for the analysis of genome composition and homeologous recombination.
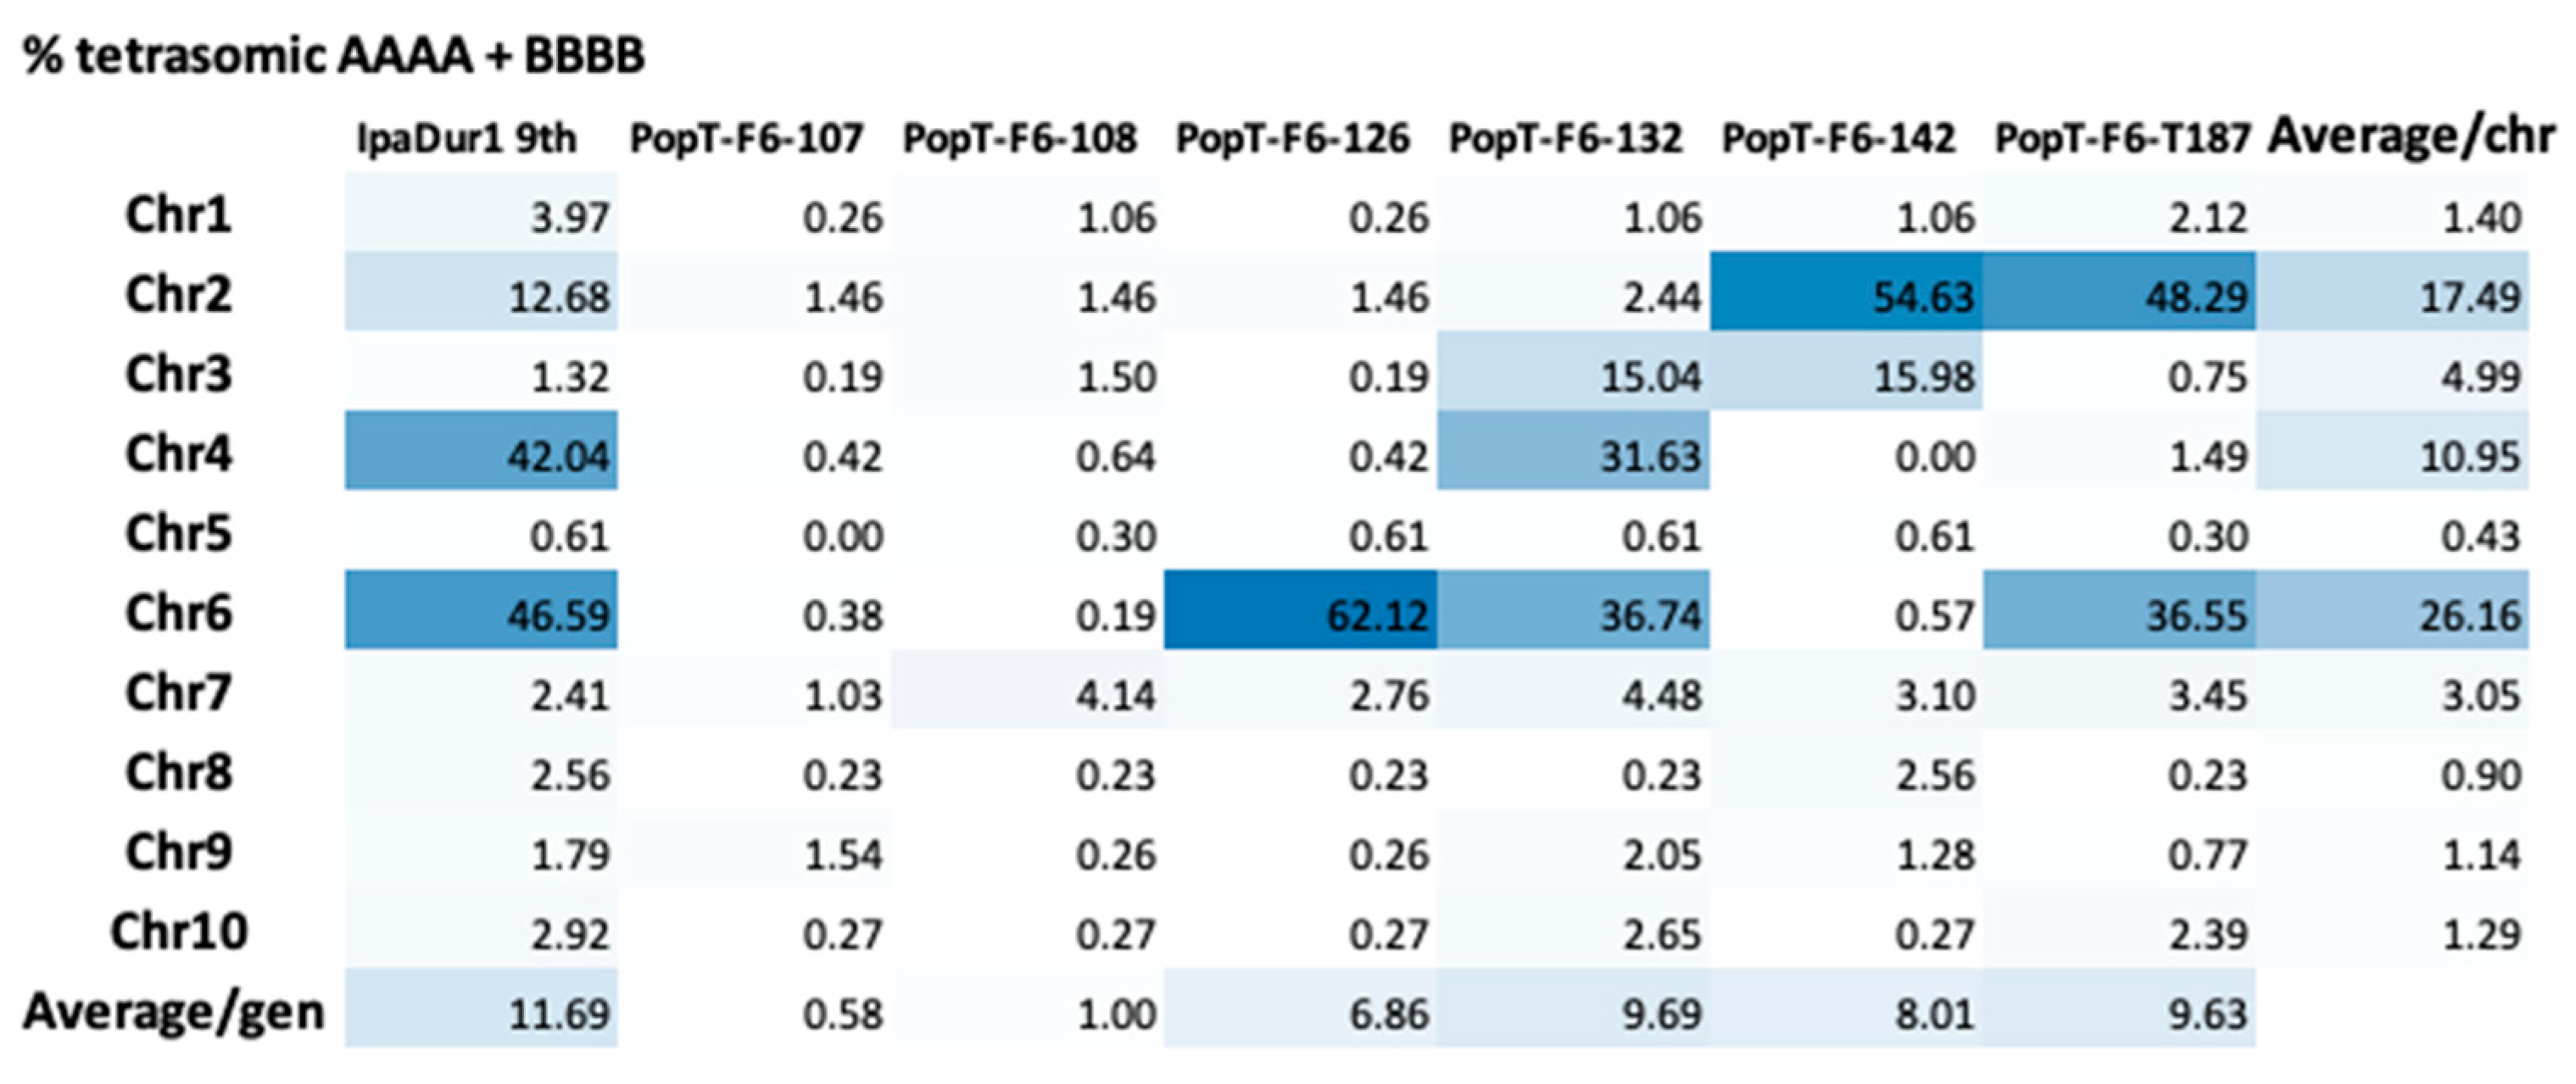
Wild derived alleles were found on all chromosomes in all lines. The ratio of wild/cultivated alleles ranged between 0.86 and 1.15, as expected for F2:6 individuals, which is around 1. There was significant variation between wild genome composition and percentage of homeologous recombination between all lines (Table 5 and Figure 5). In most of the regions, the lines had the expected genomic configuration of AABB (likely to be AcAwBcBw, with c meaning of cultivated origin and w of wild origin), but all of the genotypes had tetrasomic regions (either AAAA or BBBB) (Figure 6).
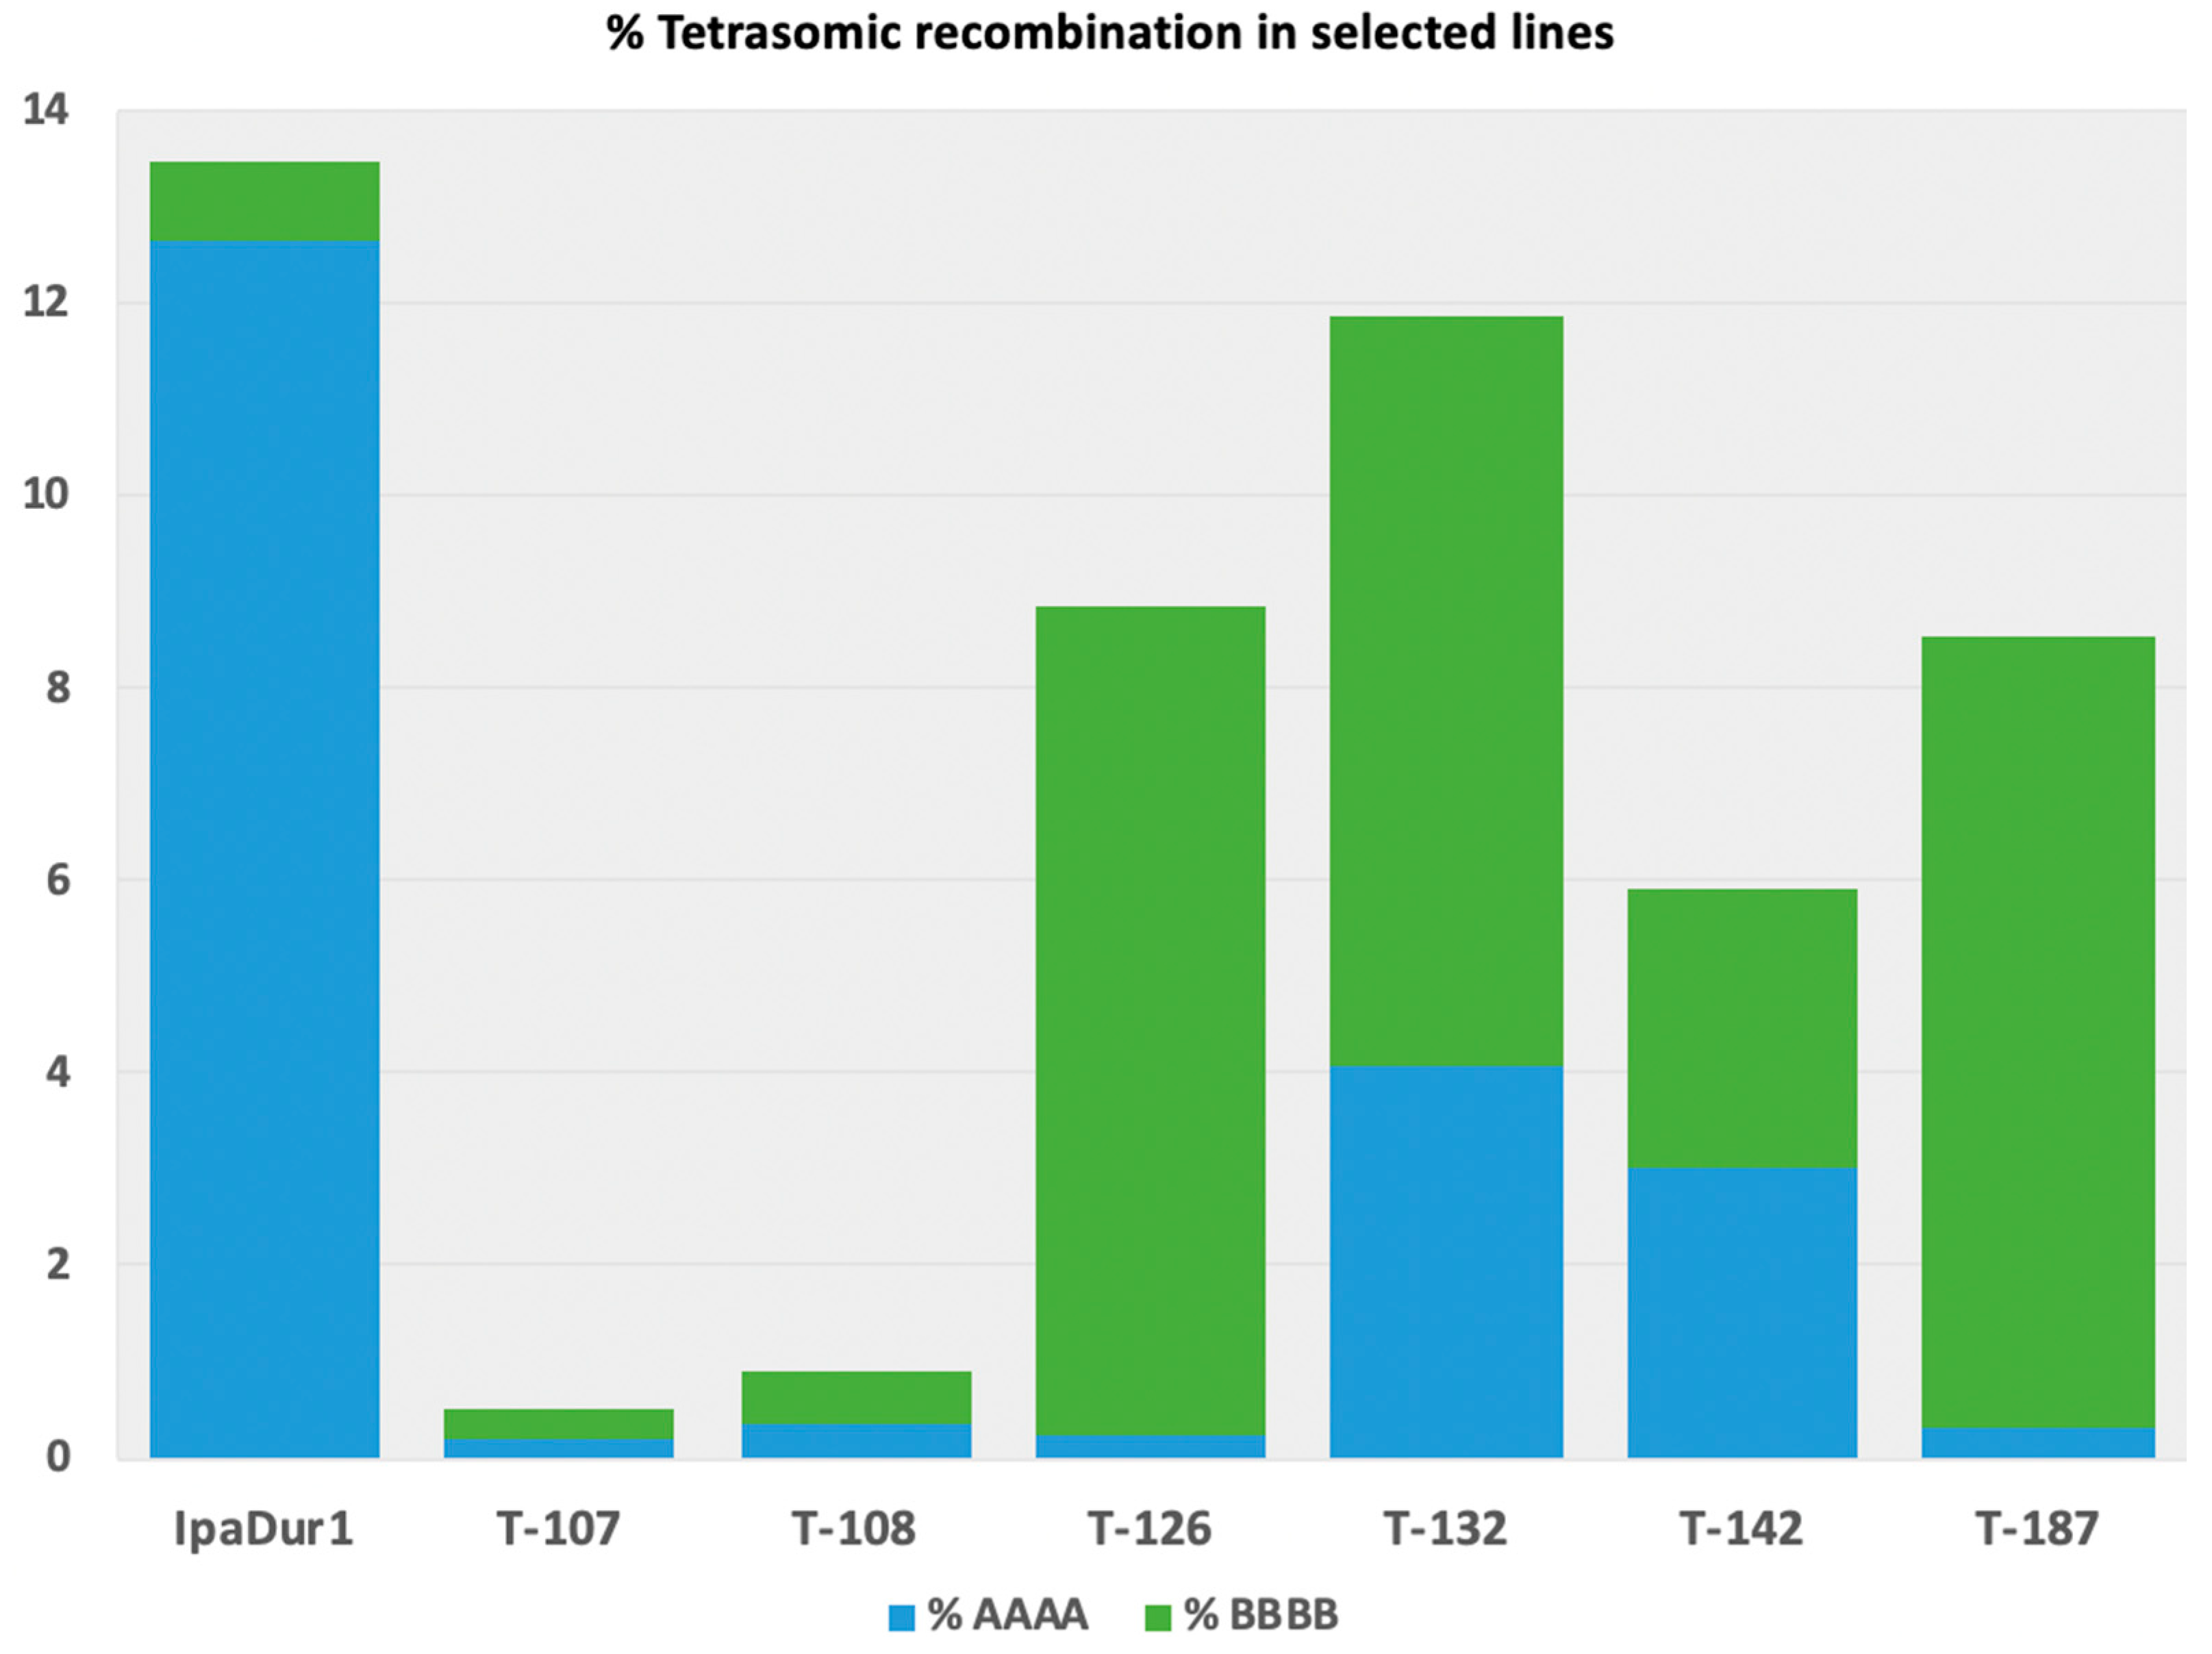
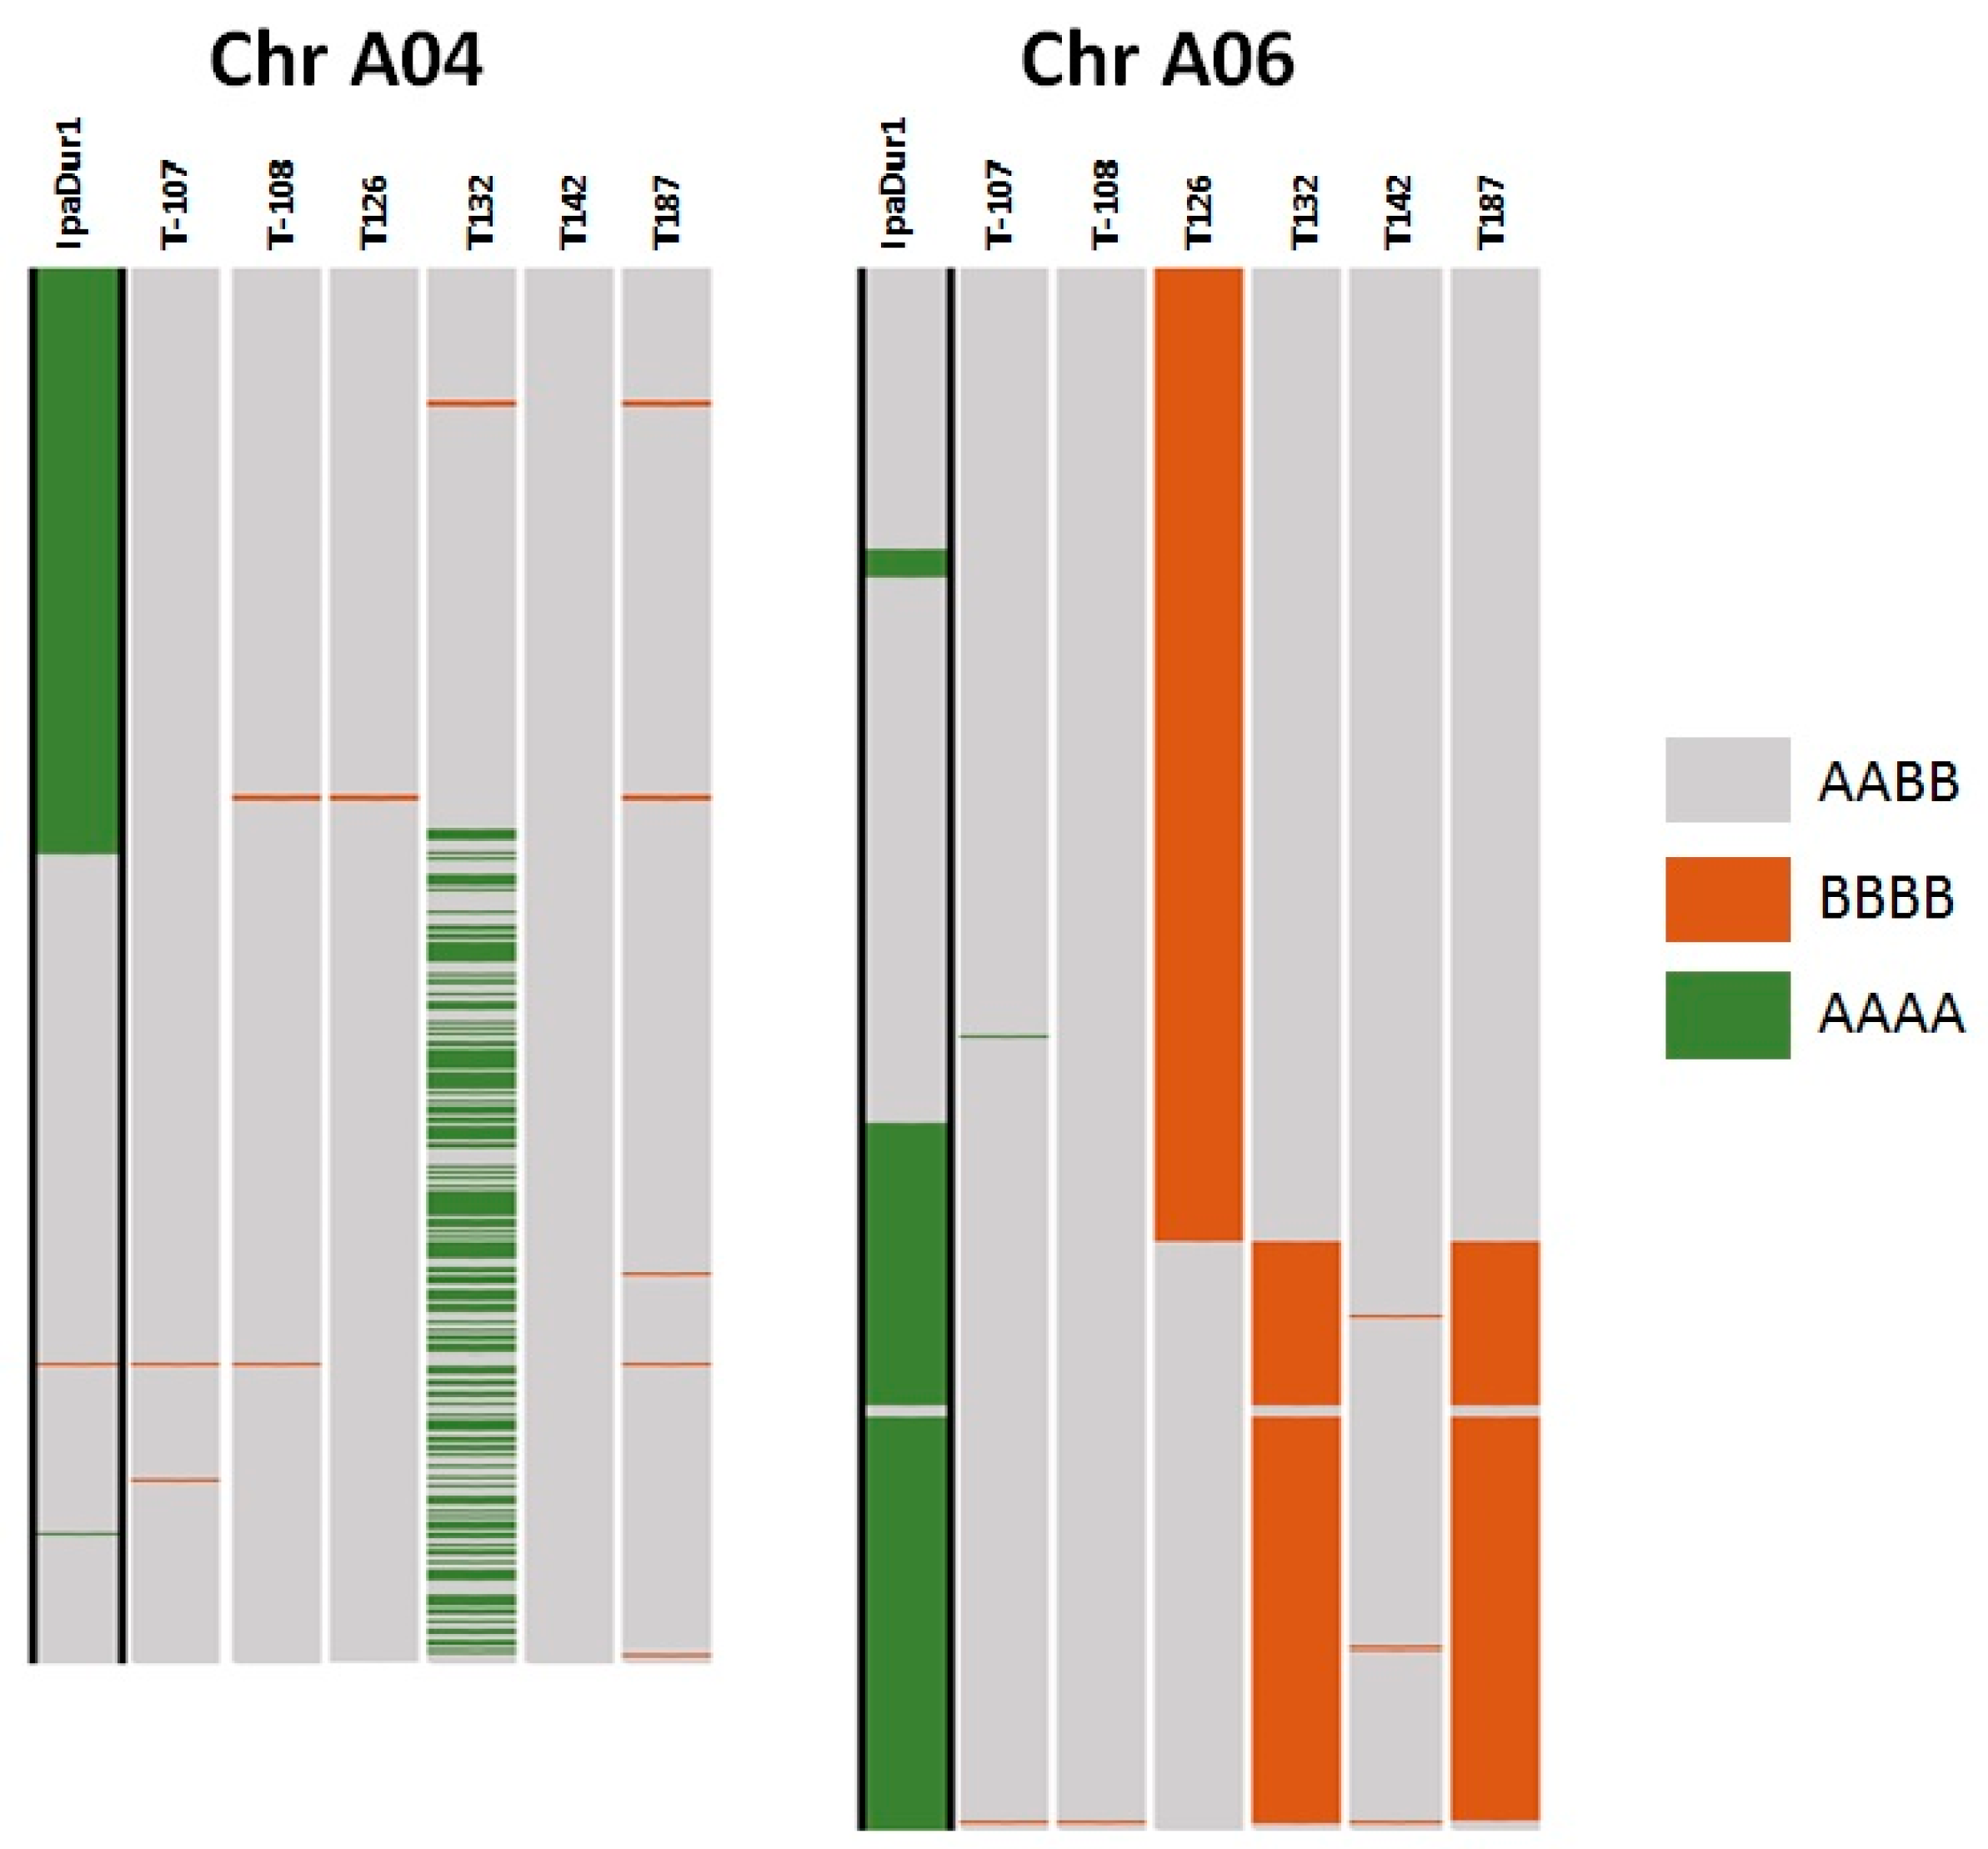
The chromosomes A02/B02, A03/B03, A04/B04, and A06/B06 had the highest frequency of homeologous recombination (Figure 6). Two patterns of homeologous recombinations were observed; the most prevalent, the loci that occur in continuous segments (examples in Figure 7, lines T126, T132, and T187—Chr A06) and loci that were interspersed in the chromosomes (Figure 7, line T132—Chr A04). The interspersed homeologous loci can be plausibly explained by gene conversion and blocks can be plausibly explained by tetrasomic meiotic recombination. Homeologous exchange in blocks was mostly detected at the distal parts, whereas interspersed loci were detectable throughout the body of chromosomes (Figure 7). Whereas, IpaDur1 has a higher tendency for conversion to AAAA, the chosen lines had a higher tendency for conversion to BBBB (Figure 5). We previously found that A. hypogaea has overall bias towards BBBB, and that this tendency was reversed to AAAA towards the chromosome ends [7]. On five lines, the top of Chr A05, which is tetrasomic AAAA in A. hypogaea, has had introgression from A. duranensis. Whereas genome composition remains the same, the allele for yellow flower color has been introduced into four lines. Line T142 that has no wild introgression in this region has orange flowers (Supplementary File S3 Tab “A. duranensis”, and Table 4).

4. Discussion

The development of new peanut cultivars requires the selection of high yielding genotypes, with resistance and/or tolerance to the main crop diseases and kernel quality. However, the process of disease resistance introgression from resistant genotypes results in the selection of genotypes with a longer cycle, lower yield, and, especially when using wild species, wild fruit type with low quality/small kernels [6]. The laborious and time-consuming process of successive backcrossings to achieve the standards of quality and yield for the peanut market is negatively associated with resistance to leafspots [6,35].
In this study, we evaluated RILs that were derived from ‘Runner IAC 886′ and (A. ipaënsis x A. duranensis)4x in an early stage of the pre-breeding program, before the backcrossings with the recurrent parent. We observed variation in the RILs for stem and leaflet surface, traits that did not distinguish the parents, as both diploid wild species, IpaDur1 and the cultivated peanut, had hairs on the stem and on the leaflets. Stem and peg pigmentation were observed on the wild species, IpaDur1, and in most of the RILs (78.2%), but not in ‘Runner IAC 886′ and 19 RILs (21.8%).
Transgressive segregation was observed for fruit type, growth habit, canopy, and height of main stem. These traits are very interesting, because of their impact on distinguishing a wild or cultivated phenotype. The RILs exhibited a lot of variation with regard to fruit type, with a predominance of wild (54 RILs) to cultivated (21 RILs) type, with twelve being RILs with mixed grades for wild and cultivated fruit types. Only one RIL (T047) exhibited the same fruit type of the cultivated parent, with smaller seeds (data not shown). Fruit type is the main trait that differentiates the cultivated species A. hypogaea (not articulate fruit) from all of the wild species (biarticulate fruit) in the genus Arachis [10], and this new scale can also be useful for evaluations of interspecific genotypes that are derived from other combinations of wild species in induced allotetraploids. Modifications in the fruit morphology during the domestication process were also reported for other oilseed crops, like soybean and pennycress [36,37]. For these species, changes in the pod morphology leading to reduced pod shattering are considered to be essential in minimizing the loss of seed during harvest. When considering the uncommon underground production of peanut, it is reasonable to assume that the loss of this long isthmus by human selection (allowing for the harvest of two seeds instead of one) was very important for a more efficient cultivation during the domestication process of the crop.
The variation for leaf spots resistance was moderate, but expected, since both wild species have moderate resistance [38]. Previous studies with BC1 progenies that are derived from ‘Runner IAC 886′ and IpaDur1 allowed for the selection of genotypes with higher resistance than the recurrent parent [39] used as parent of the ‘BRS 425′ [3]. In this study, we were able to identify RILs with resistance that is close to the most resistant wild species of IpaDur1 (A. ipaënsis) and with good agronomic traits, like cultivated fruit type, decumbent growth habit, and denser canopy. The best of these RILs will be included in a backcrossing program using elite Brazilian peanut cultivars as recurrent parents to enhance the RIL agronomic traits, while keeping their acquired moderate resistance to leaf spots. In order to make this process faster and efficient, we constructed a consensus linkage map based on previous versions that were generated for this same population [12,20,21] and identified QTLs to some important traits. With these tools we will be able to monitor the genomic segments being introgressed in the progenies, by selecting plants with the wild segments containing resistance genes, while efficiently eliminating undesirable genome regions of the donor parent.
For this, we evaluated a RIL population from ‘Runner IAC 886′ x (A. ipaënsis x A. duranensis)4x. We generated a framework map consisting of markers that were positioned with high confidence. This map was composed of 857 loci into 20 linkage groups, covering 1699.0 cM with an average distance of 1.9 cM between markers. The differences in size of this map to the previous versions generated from the same parents can be explained by the different software and parameters that treat genotyping errors in different ways. This high confidence map, with no co-segregating markers, is well suited and it was used for QTL detection.
Leaf spot resistance was evaluated by the severity means and disease index, which was recorded at 138 days after planting, as well as the area under disease progress curve for both traits, considering the evaluations recorded at four dates (104, 118, 138, and 146 days). In total, 14 QTLs were identified for the four traits. These QTLs were located in five chromosomes, but the results showed that three genomic regions might have the main wild QTLs for leaf spots resistance. These regions were in the chromosome A08 (from 64.1 to 85.0 cM), in the middle of A02 (around 74.0 cM), and the top of B05 (4.2 cM). For fruit type, four QTLs were identified, but, for one of them, located in chromosome B03, the allele improving the trait came from IpaDur (additive effect with a negative sign, in Table 3). The other three QTLs were in two genomic regions, in the very top of chromosome A04 (0.0 cM) and the upper middle of A08 (around 40 cM). The three wild genomic segments with leaf spots resistance loci and the two segments that were related to fruit type will be monitored and introgressed into peanut cultivars while using the associated markers.
The six types of growth habit and 10 types of canopy described for Arachis were detected among the 87 RILs that were evaluated here. This suggests a high number of genes involved in the genetic control of both traits. However, only one QTL was identified for each one. The plant architecture is an important trait in peanut, for both domestication studies and agronomic purposes, as the runner type (decumbent) is more suitable for mechanized harvesting. The few studies in legumes have also suggested a major gene controlling growth habit, although only two or three phenotypes were considered in most of these studies [40,41,42,43]. Our results corroborate this assumption, as a major gene was detected conferring a procumbent or decumbent habit. The subtypes of them should be controlled by undetected QTLs in our analysis, which was due to the low number of individuals evaluated. While using IpaDur1 and a peanut Spanish cultivar as parents of a mapping population, six QTLs were identified for the same six phenotypic classes in a previous study [35].
Six RILs with contrasting phenotypes for agronomic and resistance traits were selected for closer inspection while using SNP genotyping. All of the lines had wild derived alleles in all chromosomes. Significant homeologous recombination was found in four lines (T126, T132, T142, and T187). Lines T107 and T108 did not present significant tetrasomic regions. This largely corroborates our previous findings [44]. All of these lines can be used for lineage recombination in order to restore ancestral alleles that were lost through evolution in all known peanut lineages [7,14]. One clear example of the restoration of AABB is the top of Chr A05, which is AAAA in peanut, by the introgression of A. ipaënsis BB alleles. Additionally, the introgression of wild A. duranensis AA alleles in this region introduces yellow flowers. These segregating lines may also harbor rare and unexpected combination of alleles, in a diverse genome structure and composition from the cultivated species, as suggested by [45].
The adoption of wild Arachis species in peanut breeding programs has had significant progress in the last two decades [3,5,35,46,47,48]. The same allotetraploid used here (IpaDur1) has been used as source of variability in breeding programs in Africa [35] and South America [3,14,39]. Our results also evidenced the feasibility and utility on the use of induced polyploids for broadening the diversity that is available on peanut breeding programs, with further benefits for traits, like yield and adaptation to diverse environments.

5. Conclusions

Here we report the evaluation of a synthesized interspecific RIL population of peanut, which exhibited a wide range of variation for morphological and agronomic traits; moderate variation for resistance to leaf spots was also observed in some lines. Several QTLs for agronomic and resistance traits were detected and they will be useful for using marker-assisted selection on the peanut breeding program. The genome structure and composition of the RILs were completely different from the cultivated species A. hypogaea, with a variable degree of introgressions from the wild parents (A. ipaënsis and A. duranensis) and a highly variable degree of tetrasomic recombination. Lines with traits that were similar to Runner market-type cultivars and moderate resistance to leaf spots were observed, despite the diverse genome structure and variation as compared to cultivated species, which suggests a beneficial increase in genetic diversity for the peanut breeding programs.

Supplementary Materials

The following are available online at https://www.mdpi.com/2073-4395/10/12/1917/s1, Additional File S1, https://www.mdpi.com/2073-4395/10/12/1917/s2, Additional File S2, https://www.mdpi.com/2073-4395/10/12/1917/s3, Additional File S3.

Author Contributions

Conceptualization, T.S., M.M., D.B., S.L.-B.; methodology, T.S., M.M., D.B., S.L.-B. and N.S.; field phenotyping, T.S., N.S., K.M., R.M., J.H.; genotyping, D.B., S.L.-B; mapping and QTL analysis, M.M.; writing—original draft preparation, T.S., M.M., S.L.-B, D.B., N.S. All authors have read and agreed to the published version of the manuscript.

Funding

This research was funded by EMBRAPA, grants number 02.11.08.006.00.00 and 13.17.00.102.00.00; Mars Wriggley Inc.; Peanut Research Foundation; NIFA/National Peanut Board; CNPq (Research Productivity Fellowship to M.M.)

Conflicts of Interest

The authors declare no conflict of interest.

References

  1. USDA-FAS. World agricultural production. In Circular Series WAP 9-20; Services, F.A., Ed.; USDA: Washington, DC, USA, 2020; p. 42. [Google Scholar]
  2. Holbrook, C.C.; Brenneman, T.B.; Stalker, H.T.; Johnson, W.C., III; Ozias-Akins, P.; Chu, Y.; Vellidis, G.; Mccluski, D. Peanut. In Yield Gains in Major US Field Crops; Smith, S., Diers, S.B., Eds.; CSSA: Madison, WI, USA, 2014; pp. 173–194. [Google Scholar] [CrossRef]
  3. Suassuna, T.M.F.; Suassuna, N.D.; Bogiani, J.C.; Perina, F.; Fragoso, D.B.; Sofiatti, V.; Medeiros, E.P.; Moretzsohn, M.C.; Leal-Bertioli, S.C.M.; Bertioli, D.J.; et al. BRS 425: The first runner peanut cultivar related to wild ancestral species. Crop Breed. Appl. Biotechnol. 2019, 19, 373–377. [Google Scholar] [CrossRef]
  4. Holbrook, C.C.; Stalker, H.T. Peanut Breeding and Genetic Resources. In Plant Breeding Reviews; Janick, J., Ed.; John Wiley & Sons, Inc.: Hoboken NJ, USA, 2002; pp. 297–356. [Google Scholar] [CrossRef]
  5. Stalker, H.T. Utilizing Wild Species for Peanut Improvement. Crop Sci. 2017, 57, 1102–1120. [Google Scholar] [CrossRef]
  6. Stalker, H.T.; Wynne, J.C.; Company, M. Variation in progenies of an Arachis hypogaea x diploid wild species hybrid. Euphytica 1979, 28, 675–684. [Google Scholar] [CrossRef]
  7. Bertioli, D.J.; Jenkins, J.; Clevenger, J.; Dudchenko, O.; Gao, D.; Seijo, G.; Leal-Bertioli, S.C.M.; Ren, L.; Farmer, A.D.; Pandey, M.K.; et al. The genome sequence of segmental allotetraploid peanut Arachis hypogaea. Nat. Genet. 2019, 51, 877–884. [Google Scholar] [CrossRef] [Green Version]
  8. Seijo, G.; Lavia, G.I.; Fernández, A.; Krapovickas, A.; Ducasse, D.A.; Bertioli, D.J.; Moscone, E.A. Genomic relationships between the cultivated peanut (Arachis hypogaea, Leguminosae) and its close relatives revealed by double GISH. Am. J. Bot. 2007, 94, 1963–1971. [Google Scholar] [CrossRef]
  9. Leal-Bertioli, S.C.M.; Moretzsohn, M.C.; Santos, S.P.; Brasileiro, A.C.M.; Guimarães, P.M.; Bertioli, D.J.; Araujo, A.C.G. Phenotypic effects of allotetraploidization of wild Arachis and their implications for peanut domestication. Am. J. Bot. 2017, 104, 379–388. [Google Scholar] [CrossRef] [Green Version]
  10. Krapovickas, A.; Gregory, W.C. Taxonomia del genero Arachis (Leguminosae). Bonplandia 2007, 8, 1–186. [Google Scholar] [CrossRef] [Green Version]
  11. Fávero, A.P.; Simpson, C.E.; Valls, J.F.M.; Vello, N.A. Study of the evolution of cultivated peanut through crossability studies among Arachis ipaënsis, A. duranensis, and A. hypogaea. Crop Sci. 2006, 46, 1546–1552. [Google Scholar] [CrossRef]
  12. Shirasawa, K.; Bertioli, D.J.; Varshney, R.K.; Moretzsohn, M.C.; Leal-Bertioli, S.C.M.; Thudi, M.; Pandey, M.K.; Rami, J.-F.; Foncéka, D.; Gowda, M.V.C.; et al. Integrated consensus map of cultivated peanut and wild relatives reveals structures of the A and B genomes of Arachis and divergence of the legume genomes. DNA Res. 2013, 20, 173–184. [Google Scholar] [CrossRef] [Green Version]
  13. IBPGR; ICRISAT. Descriptors for Groundnut; Resources, I.B.F.P.G., Ed.; IBPGR/ICRISAT: Rome, Italy, 1992; p. 23. [Google Scholar]
  14. Leal-Bertioli, S.C.M.; Godoy, I.J.; Santos, J.F.; Doyle, J.J.; Guimarães, P.M.; Abernathy, B.L.; Jackson, S.A.; Moretzsohn, M.C.; Bertioli, D.J. Segmental allopolyploidy in action: Increasing diversity through polyploid hybridization and homoeologous recombination. Am. J. Bot. 2018, 105, 1053–1066. [Google Scholar] [CrossRef] [Green Version]
  15. Subrahmanyam, P.; Mcdonald, D.; Waliyar, F.; Reddy, L.J.; Nigam, S.N.; Gibbons, R.W.; Ramanatha, V.R.; Singh, A.K.; Pande, S.; Reddy, P.M.; et al. Screening Methods and Sources of Resistance to Rust and Late Leaf Spot of Groundnut; ICRISAT: Patancheru, India, 1992; p. 20. [Google Scholar]
  16. Czermainski, A.B.C. Generalização de um índice de intensidade de infecção em experimentos de doenças em plantas. Pesqui. Agropecuária Bras. 1999, 34, 1545–1555. [Google Scholar] [CrossRef] [Green Version]
  17. Resende, M.D.V. Software Selegen-REML/BLUP: A useful tool for plant breeding. Crop Breed. Appl. Biotechnol. 2016, 16, 330–339. [Google Scholar] [CrossRef]
  18. Duarte, J.B.; Vencovsky, R. Estimação e predição por modelo linear misto com ênfase na ordenação de médias de tratamentos genéticos. Sci. Agric. 2001, 58, 109–117. [Google Scholar] [CrossRef] [Green Version]
  19. Resende, M.D.V.; Duarte, J.B. Precisão e controle de qualidade em experimentos de avaliação de cultivares. Pesqui. Agropecuária Trop. 2007, 37, 182–194. [Google Scholar]
  20. Bertioli, D.J.; Cannon, S.B.; Froenicke, L.; Huang, G.; Farmer, A.D.; Cannon, E.K.S.; Liu, X.; Gao, D.; Clevenger, J.; Dash, S.; et al. The genome sequences of Arachis duranensis and Arachis ipaensis, the diploid ancestors of cultivated peanut. Nat. Genet. 2016, 48, 438–446. [Google Scholar] [CrossRef]
  21. Bertioli, D.J.; Ozias-Akins, P.; Chu, Y.; Dantas, K.M.; Santos, S.P.; Gouvea, E.; Guimarães, P.M.; Leal-Bertioli, S.C.M.; Knapp, S.J.; Moretzsohn, M.C. The Use of SNP Markers for Linkage Mapping in Diploid and Tetraploid Peanuts. G3 Genes Genomes Genet. 2014, 4, 89–96. [Google Scholar] [CrossRef] [Green Version]
  22. Van Ooijen, J.W. JoinMap 4. Software for the Calculation of Genetic Linkage Maps in Experimental Populations; Kyazma B.V.: Wageningen, The Netherlands, 2006. [Google Scholar]
  23. Sujay, V.; Gowda, M.V.C.; Pandey, M.K.; Bhat, R.S.; Khedikar, Y.P.; Nadaf, H.L.; Gautami, B.; Sarvamangala, C.; Lingaraju, S.; Radhakrishan, T.; et al. Quantitative trait locus analysis and construction of consensus genetic map for foliar disease resistance based on two recombinant inbred line populations in cultivated groundnut (Arachis hypogaea L.). Mol. Breed. 2012, 30, 773–788. [Google Scholar] [CrossRef] [Green Version]
  24. Varshney, R.K.; Pandey, M.K.; Janila, P.; Nigam, S.N.; Sudini, H.; Gowda, M.V.C.; Sriswathi, M.; Radhakrishnan, T.; Manohar, S.S.; Nagesh, P. Marker-assisted introgression of a QTL region to improve rust resistance in three elite and popular varieties of peanut (Arachis hypogaea L.). Theor. Appl. Genet. 2014, 127, 1771–1781. [Google Scholar] [CrossRef] [Green Version]
  25. Lander, E.S.; Green, P.; Abrahamson, J.; Barlow, A.; Daly, M.J.; Lincoln, S.E.; Newburg, L. MAPMAKER: An interactive computer package for constructing primary genetic linkage maps of experimental and natural populations. Genomics 1987, 1, 174–181. [Google Scholar] [CrossRef]
  26. Lincoln, S.E.; Daly, M.; Lander, E.S. Constructiong Genetic Maps with MAPMAKER/EXP3.0; Whitehead Institute Technical Report: Cambridge, MA, USA, 1992. [Google Scholar]
  27. Moretzsohn, M.C.; Gouvea, E.G.; Inglis, P.W.; Leal-Bertioli, S.C.M.; Valls, J.F.M.; Bertioli, D.J. A study of the relationships of cultivated peanut (Arachis hypogaea) and its most closely related wild species using intron sequences and microsatellite markers. Ann. Bot. 2013, 111, 113–126. [Google Scholar] [CrossRef] [Green Version]
  28. Wang, S.; Basten, C.J.; Zeng, Z.-B. Windows QTL Cartographer 2.5; Department of Statistics, North Carolina State University: Raleigh, NC, USA, 2012. [Google Scholar]
  29. Broman, K.W.; Wu, H.; Sen, S.; Churchill, G.A. R/qtl: QTL mapping in experimental crosses. Bioinformatics 2003, 19, 889–890. [Google Scholar] [CrossRef] [PubMed] [Green Version]
  30. Churchill, G.A.; Doerge, R.W. Empirical threshold values for quantitative trait mapping. Genetics 1994, 138, 963–971. [Google Scholar] [PubMed]
  31. Doerge, R.W.; Churchill, G.A. Permutation Tests for Multiple Loci Affecting a Quantitative Character. Genetics 1996, 142, 285–294. [Google Scholar] [PubMed]
  32. Voorrips, R.E. MapChart: Software for the Graphical Presentation of Linkage Maps and QTLs. J. Hered. 2002, 93, 77–78. [Google Scholar] [CrossRef] [PubMed] [Green Version]
  33. Clevenger, J.; Chu, Y.; Chavarro, C.; Agarwal, G.; Bertioli, D.J.; Leal-Bertioli, S.C.M.; Pandey, M.K.; Vaughn, J.; Abernathy, B.; Barkley, N.A.; et al. Genome-wide SNP Genotyping Resolves Signatures of Selection and Tetrasomic Recombination in Peanut. Mol. Plant 2017, 10, 309–322. [Google Scholar] [CrossRef] [PubMed] [Green Version]
  34. Korani, W.; Clevenger, J.P.; Chu, Y.; Ozias-Akins, P. Machine Learning as an Effective Method for Identifying True Single Nucleotide Polymorphisms in Polyploid Plants. Plant Genome 2019, 12, 180023. [Google Scholar] [CrossRef] [PubMed] [Green Version]
  35. Fonceka, D.; Tossim, H.-A.; Rivallan, R.; Vignes, H.; Faye, I.; Ndoye, O.; Moretzsohn, M.C.; Bertioli, D.J.; Glaszmann, J.-C.; Courtois, B.; et al. Fostered and left behind alleles in peanut: Interspecific QTL mapping reveals footprints of domestication and useful natural variation for breeding. BMC Plant Biol. 2012, 12, 26. [Google Scholar] [CrossRef] [Green Version]
  36. Chopra, R.; Johnson, E.B.; Emenecker, R.; Cahoon, E.B.; Lyons, J.; Kliebenstein, D.J.; Daniels, E.; Dorn, K.M.; Esfahanian, M.; Folstad, N.; et al. Identification and stacking of crucial traits required for the domestication of pennycress. Nat. Food 2020, 1, 84–91. [Google Scholar] [CrossRef] [Green Version]
  37. Dong, Y.; Yang, X.; Liu, J.; Wang, B.-H.; Liu, B.-L.; Wang, Y.-Z. Pod shattering resistance associated with domestication is mediated by a NAC gene in soybean. Nat. Commun. 2014, 5, 3352. [Google Scholar] [CrossRef] [Green Version]
  38. Michelotto, M.D.; Barioni, W.J.; Resende, M.D.V.; Godoy, I.J.; Leonardecz, E.; Fávero, A.P. Identification of Fungus Resistant Wild Accessions and Interspecific Hybrids of the Genus Arachis. PLoS ONE 2015, 10, e0128811. [Google Scholar] [CrossRef] [Green Version]
  39. Suassuna, T.M.F.; Suassuna, N.D.; Moretzsohn, M.C.; Bertioli, S.C.M.L.; Bertioli, D.J.; Medeiros, E.P. Yield, market quality, and leaf spots partial resistance of interspecific peanut progenies. Crop Breed. Appl. Biotechnol. 2015, 15, 175–180. [Google Scholar] [CrossRef] [Green Version]
  40. Ali, L.; Azam, S.; Rubio, J.; Kudapa, H.; Madrid, E.; Varshney, R.K.; Castro, P.; Chen, W.; Gil, J.; Millan, T. Detection of a new QTL/gene for growth habit in chickpea CaLG1 using wide and narrow crosses. Euphytica 2015, 204, 473–485. [Google Scholar] [CrossRef] [Green Version]
  41. Aryamanesh, N.; Nelson, M.N.; Yan, G.; Clarke, H.J.; Siddique, K.H.M. Mapping a major gene for growth habit and QTLs for ascochyta blight resistance and flowering time in a population between chickpea and Cicer reticulatum. Euphytica 2010, 173, 307–319. [Google Scholar] [CrossRef]
  42. Huyghe, C. Genetics and genetic modifications of plant architetcture in grain legumes: A review. Agronomie 1998, 18, 383–411. [Google Scholar] [CrossRef]
  43. Saha, G.C.; Sarker, A.; Chen, W.; Vandemark, G.J.; Muehlbauer, F.J. Inheritance and Linkage Map Positions of Genes Conferring Agromorphological Traits in Lens culinaris Medik. Int. J. Agron. 2013, 2013, 618926. [Google Scholar] [CrossRef] [Green Version]
  44. Leal-Bertioli, S.C.M.; Shirasawa, K.; Abernathy, B.; Moretzsohn, M.C.; Chavarro, C.; Clevenger, J.; Ozias-Akins, P.; Jackson, S.A.; Bertioli, D.J. Tetrasomic Recombination Is Surprisingly Frequent in Allotetraploid. Arachis. Genetics 2015, 199, 1093–1105. [Google Scholar] [CrossRef] [Green Version]
  45. Nguepjop, J.R.; Tossim, H.-A.; Bell, J.M.; Rami, J.-F.; Sharma, S.; Courtois, B.; Mallikarjuna, N.; Sane, D.; Fonceka, D. Evidence of Genomic Exchanges between Homeologous Chromosomes in a Cross of Peanut with Newly Synthetized Allotetraploid Hybrids. Front. Plant Sci. 2016, 7. [Google Scholar] [CrossRef] [Green Version]
  46. Gowda, M.V.C.; Motagi, B.N.; Naidu, G.K.; Diddimani, S.N.; Sheshagiri, R. GPBD-4: A Spanish bunch groundnut genotype resistant to rust and late leaf spot. Int. Arachis Newsl. 2002, 22, 29–32. [Google Scholar]
  47. Lamon, S.; Chu, Y.; Guimaraes, L.A.; Bertioli, D.J.; Leal-Bertioli, S.C.M.; Santos, J.F.; Godoy, I.J.; Culbreath, A.K.; Holbrook, C.C.; Ozias-Akins, P. Characterization of peanut lines with interspecific introgressions conferring Late Leaf Spot resistance. Crop Sci. 2020, in press. [Google Scholar] [CrossRef]
  48. Simpson, C.E.; Starr, J.L.; Baring, M.R.; Burow, M.D.; Cason, J.M.; Wilson, J.N. Registration of ‘Webb’ Peanut. J. Plant Regist. 2013, 7, 265–268. [Google Scholar] [CrossRef]
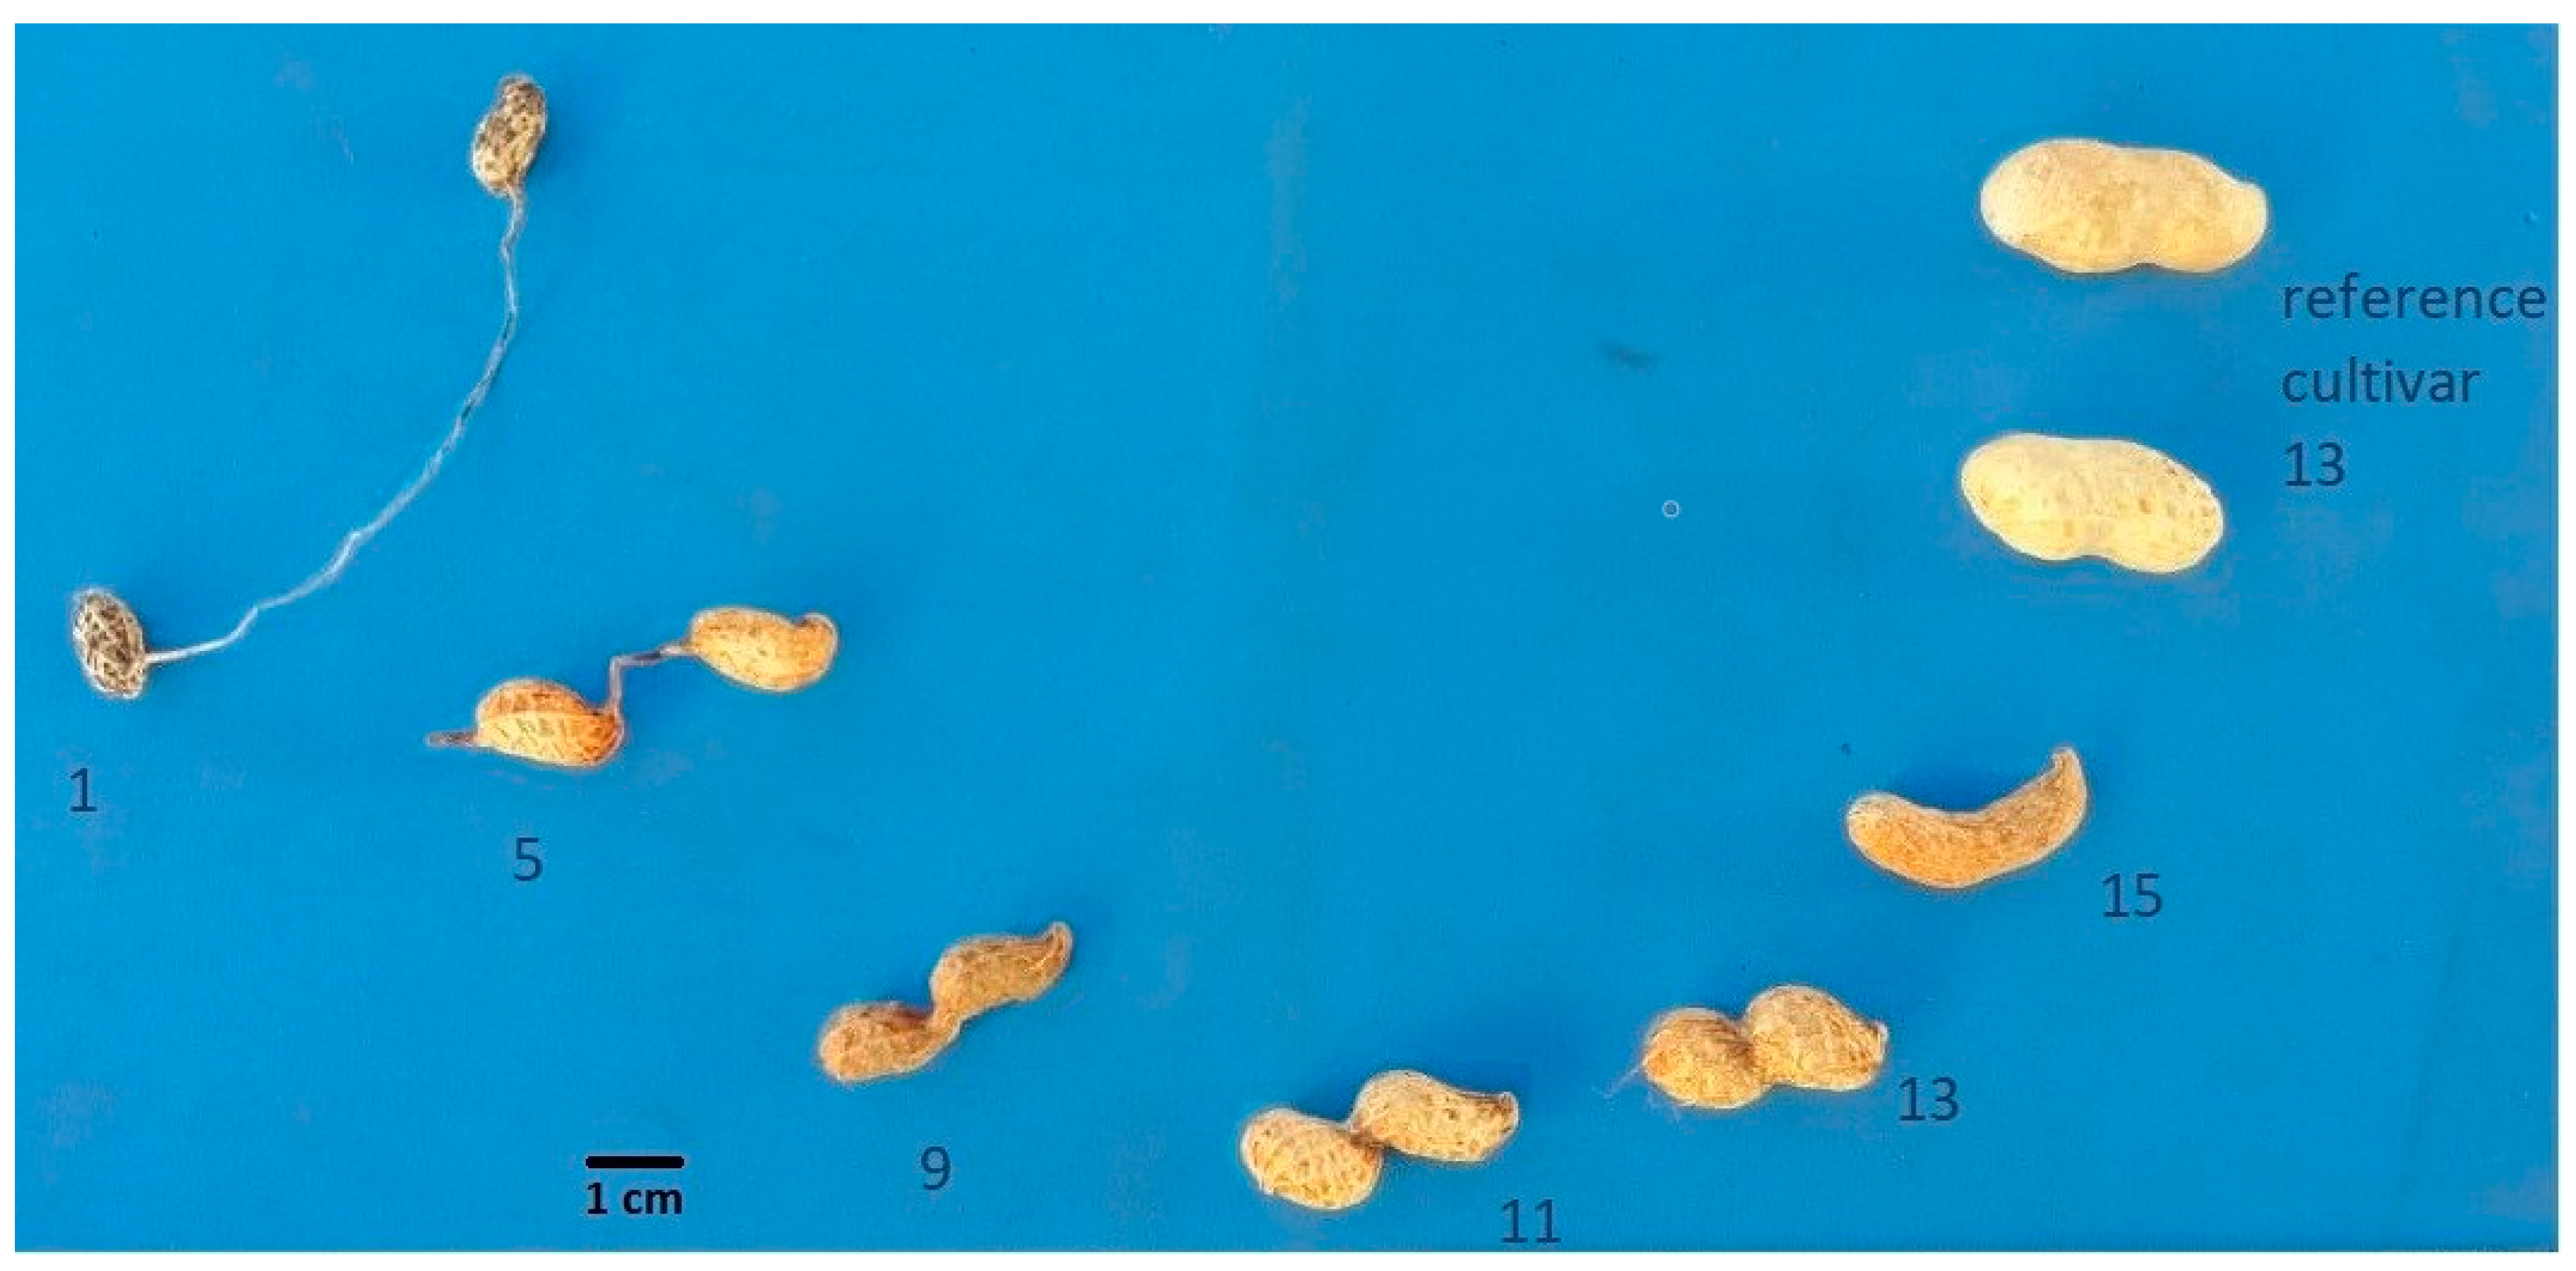
Figure 1. Variation for fruit type in an interspecific peanut population.
Agronomy 10 01917 g001
Figure 2. Plots with the interspecific RIL population ‘Runner IAC 886’ x IpaDur1; note the variation for growth habit and canopy among the plots.
Agronomy 10 01917 g002
Figure 3. Distribution frequency for agronomic traits observed in the interspecific RIL population ‘Runner IAC 886′ x IpaDur1. (a) fruit type; (b) height of main stem; (c) growth habit; and, (d) canopy.
Agronomy 10 01917 g003
Figure 4. A genetic linkage map obtained through the analysis of 87 F6 plants, generated from a cross between A. hypogaea ‘Runner IAC 886′ and the induced allotetraploid (A. ipaënsis K 30076 x A. duranensis V 14167)4x. Numbers on the left of each group are Kosambi map distances (cM). Markers that amplified more than one locus have numbers _1 and _2 after the marker name. Quantitative Trait Loci are indicated as bars running alongside linkage groups. Color/textures are according to categories: black, LLS resistance; white, plant architecture; textured, fruit type. Distorted alleles (p < 0.05) are indicated by ‘#’.
Agronomy 10 01917 g004aAgronomy 10 01917 g004b
Figure 5. Histograms showing the total percentage of homeologous recombinations in IpaDur1 and six F2:6 lines. In blue are the conversions from AABB to AAAA, and green, conversions from AABB to BBBB. Note that conversion to AAAA is prevalent in IpaDur1 and conversion to BBBB is prevalent in the segregating lines.
Agronomy 10 01917 g005
Figure 6. Heatmap showing the percentage of homeologous recombination on all chromosomes of all individuals. Note that the chromosomes with highest recombination rates are Chr6 (average 26.16%), Chr2 (17.49%), and Chr4 (10.95%).
Agronomy 10 01917 g006
Figure 7. Representation of the tetrasomic/nullisomic allele sites on “Hot spots” for homeologous recombination: chromosomes A04 and A06, on IpaDur1, and recombinant lines T107, T108, T126, T132, T142, and T187. Gray areas are loci with expected configuration AABB, green with tetrasomic AAAA, and red, tetrasomic BBBB. Note that homeologous recombination can appear in blocks and interspersed loci. Homeologous exchange in blocks were mostly detected at the distal parts, whereas interspersed loci were detectable throughout the body of chromosomes.
Agronomy 10 01917 g007
Table 1. Grade scale for fruit type for peanut interspecific populations.
Fruit TypeDescriptionRate
WildBiarticulate fruit, articles separated by a long isthmus1
Mixed wildBiarticulate fruit, articles separated by isthmus with long and intermediate length.3
Wild intermediateBiarticulate fruit, articles separated by isthmus of intermediate length5
Mixed wild and cultivatedBiarticulated and not articulated fruits; varying isthmus lengths or pod constriction7
Cultivated 1Fruit not articulated; very deep constriction9
Cultivated 2Fruit not articulated; deep constriction11
Cultivated 3Fruit not articulated; moderate constriction13
Mixed cultivatedFruit not articulated; different degrees of constriction14
Cultivated 4No isthmus or constriction15
Table 2. Summary of analysis of deviance (ANADEV) for leaf spots resistance evaluation as severity means (MSEV) and severity index at 138 days (ISEV); area under disease progress curve for the means (AUDPC-MSEV) and severity index (AUDPC-ISEV).
EffectsMSEVISEVAUDPC-MSEVAUDPC-ISEV
Treatment−29.46449.82665.141148.65
Complete−38.67440.64653.881137.90
LRT (chi-square 1)9.21 **9.18 **11.26 **10.75 **
1 Chi-square of 3.84 and 6.63 for 5% and 1%, respectively. ** Significant at 1%.
Table 3. QTLs identified for leaf spots resistance (MSEV, ISEV, AUDPC-MSEV, AUDPC-ISEV)1, height of the main stem (HMS), growth habit (GH), canopy, and fruit type.
TraitChrom.Position (cM) 2Nearest MarkerLODAdditive Effect 3R2 (%) 4
MSEV 1A0864.1AHGS1385_A4.00.352311.0
B0213.5AhTE07916.3−0.630920.1
ISEV 1A0864.1AHGS1385_A3.62.820110.0
B0213.5AhTE07915.9−5.301119.7
B0217.3Ah_FI5019862.7−2.55018.4
AUDPC-MSEVA0273.2RM2H105.216.579712.8
A0885.0RM17H095.914.717514.9
B054.2AHGS2285_23.811.52239.0
B0545.9DS_c6795_1883.7−11.37798.7
AUDPC-ISEVA0274.5Seq15D24.6127.308712.6
A0684.3AHGS14782.5−84.22526.4
A0885.0RM17H094.7123.298213.1
B054.2AHGS2285_23.399.86308.6
B0545.9DS_c6795_1886.7−147.530419.2
HMSA0458.5AHGS27857.4−5.761821.6
A0488.6AHGS2390_A7.95.794320.0
A0846.4AHGS36985.43.691212.3
B0224.9Seq18E76.24.187415.6
B0510.4AHGS12035.03.883911.0
B0545.9DS_c6795_1885.3−3.770811.9
GHA04106.0DS_c3103_115 #4.2n.d 5n.d 5
CanopyA0287.4AHS10087.3−1.645921.3
Fruit typeA040.0TC21A096.90.170616.7
A0837.2DS_c582_3447.10.164917.3
A0842.3RN22A128.50.182319.8
B0343.4AHGS16615.1−0.167612.9
1 Leaf spots severity means (MSEV), severity index (ISEV), and area under disease progress curve for MSEV (AUDPC_MSEV) and ISEV (AUDPC_ISEV). 2 Position in Kosambi centimorgan (cM). 3 Positive values indicate that higher-value alleles come from A. hypogaea ‘Runner IAC 886′, and negative values indicate that higher-value alleles come from IpaDur1. 4 Proportion of the total phenotypic variance explained by the QTL. 5 Growth habit QTL detected by the K-W test, which does not estimate the additive effects and R2 (n.d.—not determined).
Table 4. Summary of agronomic traits and leaf spots resistance evaluation of selected RILs.
RIL/AccessionStandard Petal ColorHeight of Main Stem (cm) Growth Habit CanopyFruit TypeGV MSEV *
T107Yellow25.315115.9
T108Yellow38.537145.6
T126Yellow41.03275.4
T132Yellow38.515115.8
T142Orange23.83755.5
T187Yellow17.0610115.6
‘Runner IAC 886′Orange27.3410136.1
K 30076Orange7.51115.3
V 14167Yellow14.81115.8
IpaDur1Yellow27.81115.3
* Genotypic value of severity means.
Table 5. Summary of genotyping of six selected lines on the Axiom Arachis SNP array. Number of total A. duranensis or A. ipaënsis characteristic loci surveyed, number of double doses A. duranensis loci, number of double doses A. ipaënsis loci, ratio of wild to cultivated alleles and ratio of A. duranensis to A. ipaënsis alleles. 904 polymorphic loci were surveyed.
IpaDur1T107T108T126T132T142T187
2x A. duranensis loci23614516286168130100
2x A. ipaënsis loci20810712714879114156
Ratio wild/cultivated*1.011.160.861.031.120.92
A. duranensis/A. ipaënsis1.501.091.100.591.430.820.60
(*) all alleles in IpaDur1 are of wild origin.
Publisher’s Note: MDPI stays neutral with regard to jurisdictional claims in published maps and institutional affiliations.