Extraction of Anthocyanins and Total Phenolic Compounds from Açai (Euterpe oleracea Mart.) Using an Experimental Design Methodology. Part 2: Ultrasound-Assisted Extraction

 ,
,  , ,
, ,  , ,
, , 
Abstract
:1. Introduction
2. Materials and Methods
2.1. Solvents and Reagents
2.2. Biological Material and Commercial Foods
2.3. Extraction Procedure
2.4. Optimization Study
β15X1X5 + β16X1X6 + β23X2X3 + β24X2X4 + β25X2X5 + β26X2X6 + β34X3X4 + β35X3X5 + β36X3X6 +
β45X4X5 + β46X4X6 + β56X5X6 + β11X12 + β22X22 + β33X32 + β44X42 + β55X52 + β66X62.
2.5. UHPLC-QToF-MS
2.6. UHPLC-UV-vis Analysis
2.7. Total Phenolic Content
3. Results
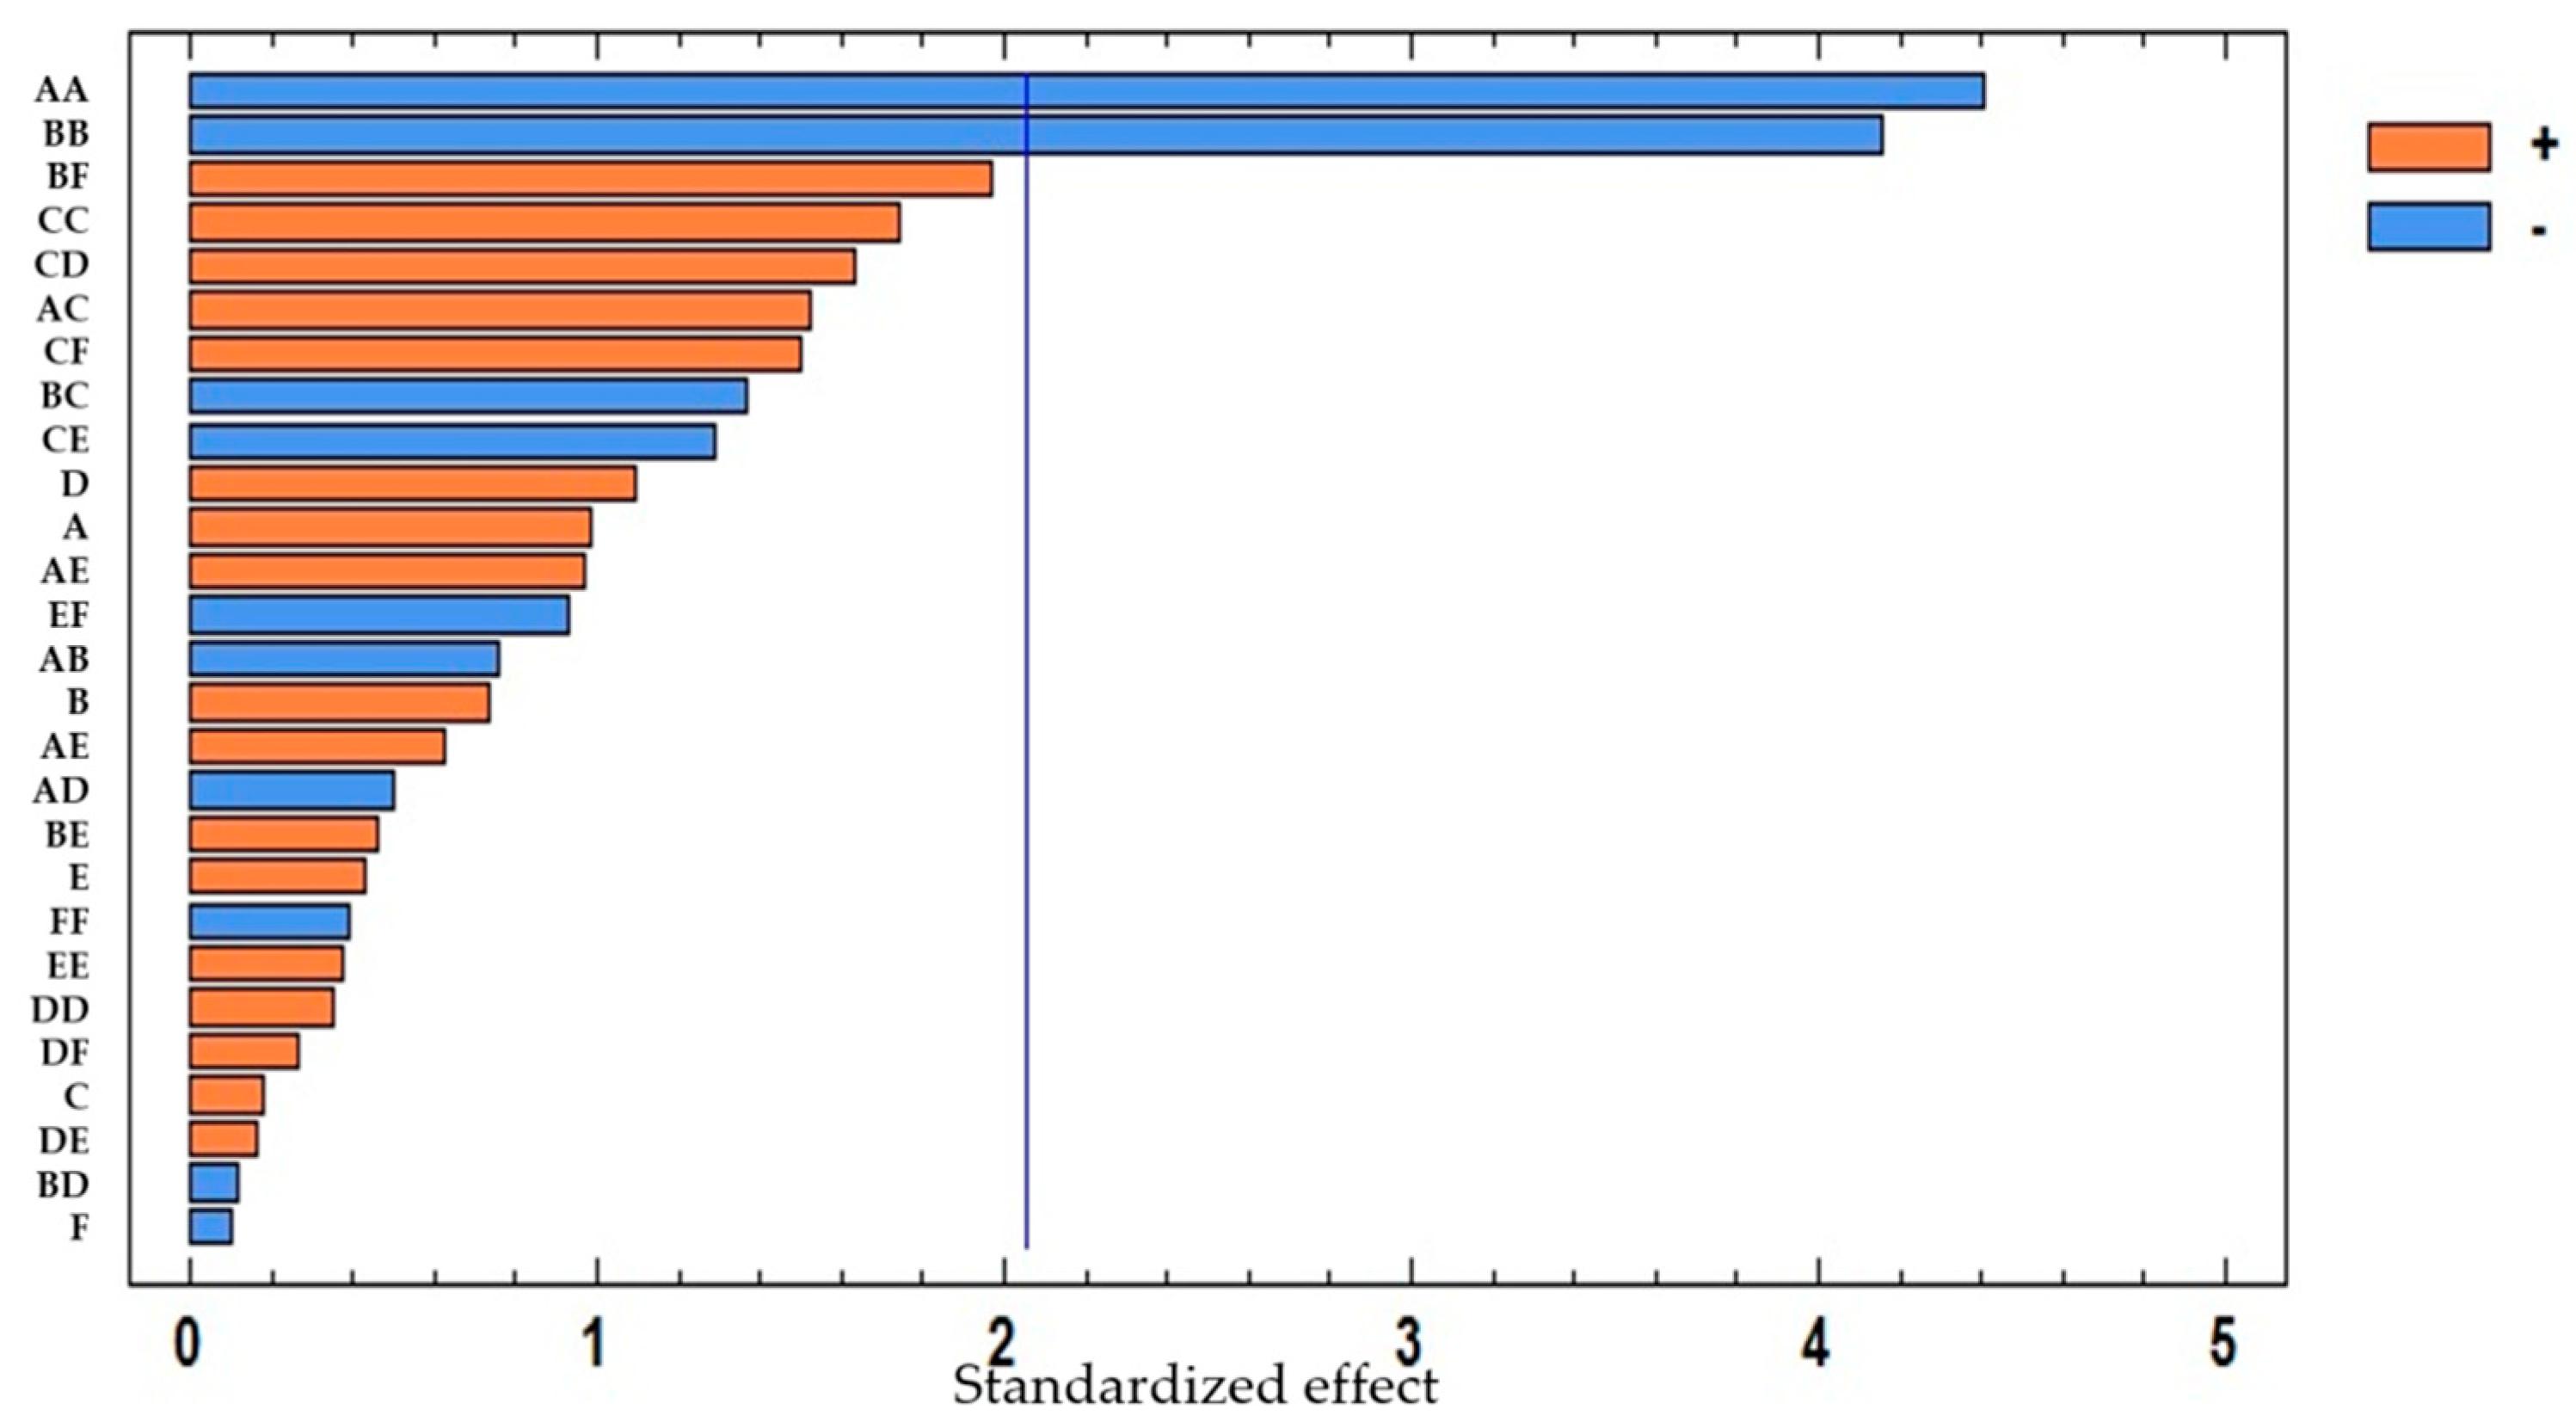
3.1. Optimization of the Extraction Method
3.2. TA Optimization
3.2.1. Extraction Method
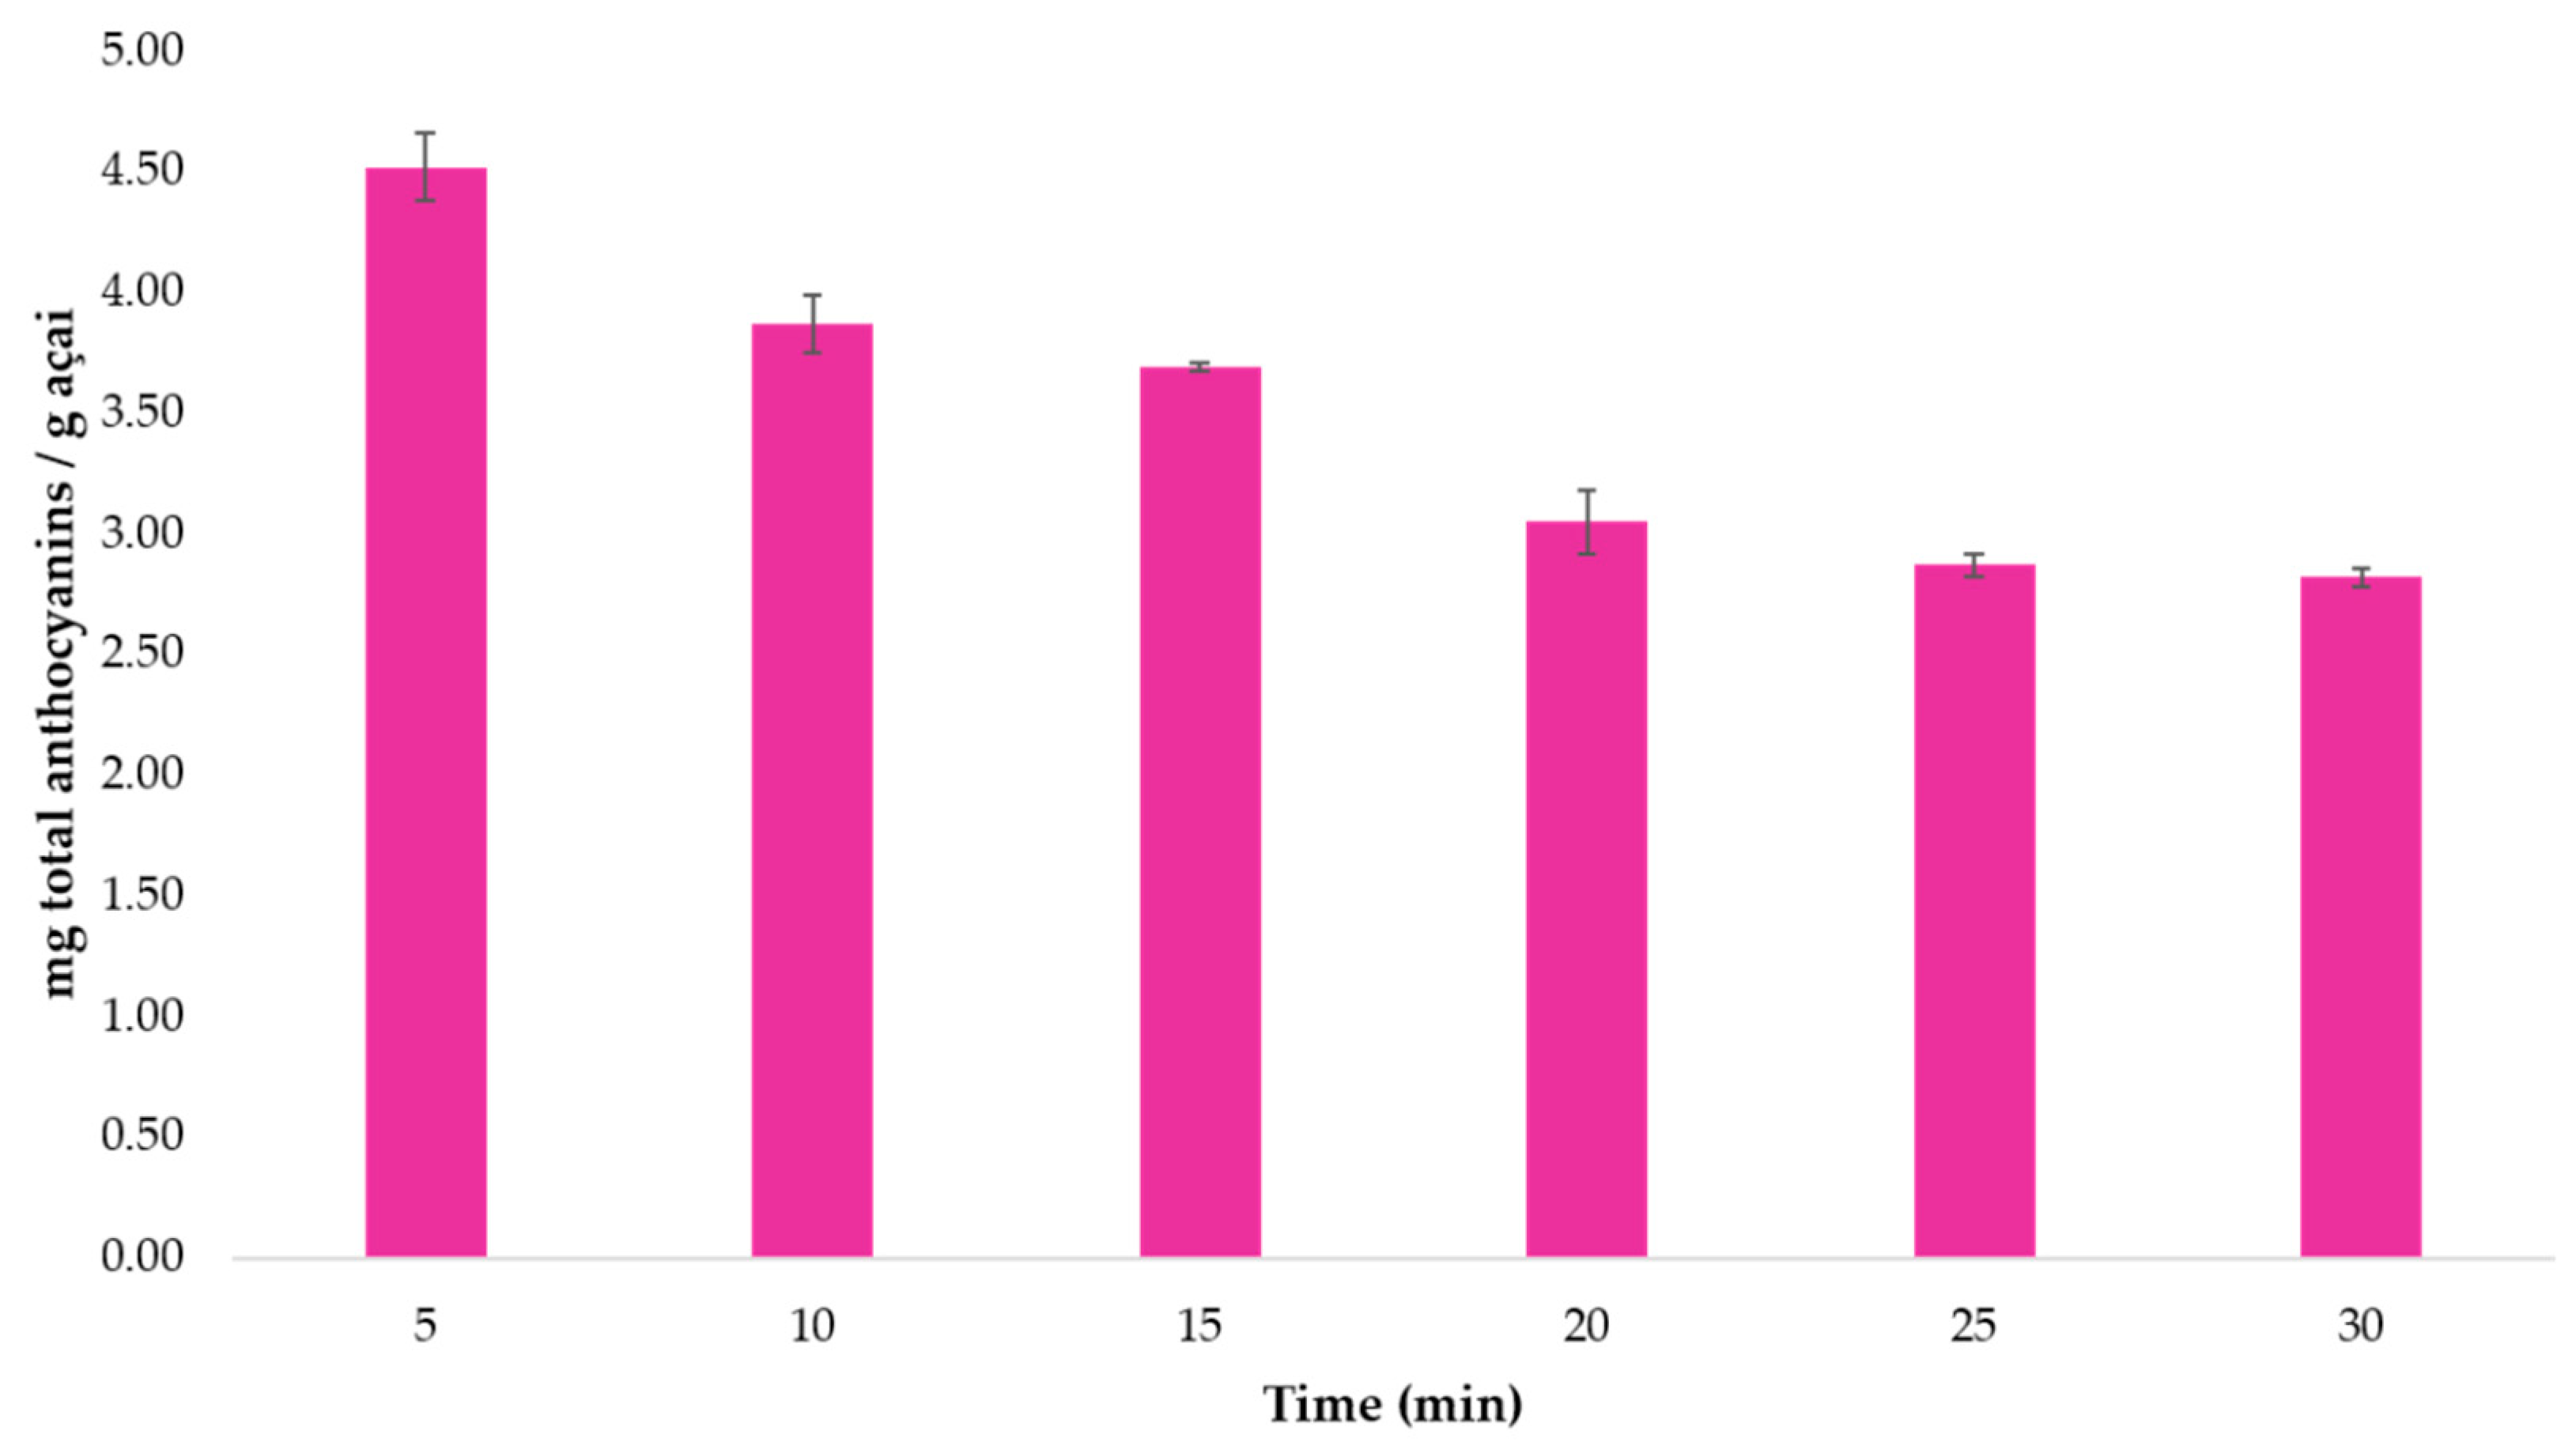
3.2.2. Optimum Extraction Time
3.2.3. Precision Study
3.3. TPC Optimization
3.3.1. Optimization of the Extraction Method
3.3.2. Optimum Extraction Time
3.3.3. Precision Study
3.4. Re-Extraction Experiments
3.5. Application to Foods Made with Açai
4. Conclusions
Supplementary Materials
Author Contributions
Funding
Acknowledgments
Conflicts of Interest
References
- Bichara, C.M.G.; Rogez, H. Açai (Euterpe oleracea Martius). In Postharvest Biology and Technology of Tropical and Subtropical Fruits; Woodhead Publishing Limited - Elsevier: Sawston, Cambridge, UK, 2011; pp. 1–27e. [Google Scholar]
- Barbosa, P.O.; Pala, D.; Silva, C.T.; de Souza, M.O.; do Amaral, J.F.; Vieira, R.A.L.; de Folly, G.A.F.; Volp, A.C.P.; de Freitas, R.N. Açai (Euterpe oleracea Mart.) pulp dietary intake improves cellular antioxidant enzymes and biomarkers of serum in healthy women. Nutrition 2016, 32, 674–680. [Google Scholar] [CrossRef]
- De Yamaguchi, K.K.; Pereira, L.F.R.; Lamarão, C.V.; Lima, E.S.; da Veiga-Junior, V.F. Amazon acai: Chemistry and biological activities: A review. Food Chem. 2015, 179, 137–151. [Google Scholar] [CrossRef]
- Kang, J.; Li, Z.; Wu, T.; Jensen, G.S.; Schauss, A.G.; Wu, X. Anti-oxidant capacities of flavonoid compounds isolated from acai pulp (Euterpe oleracea Mart.). Food Chem. 2010, 122, 610–617. [Google Scholar] [CrossRef]
- Lucas, B.F.; Zambiazi, R.C.; Costa, J.A.V. Biocompounds and physical properties of açaí pulp dried by different methods. LWT Food Sci. Technol. 2018, 98, 335–340. [Google Scholar] [CrossRef]
- Poulose, S.M.; Fisher, D.R.; Larson, J.; Bielinski, D.F.; Rimando, A.M.; Carey, A.N.; Schauss, A.G.; Shukitt-Hale, B. Anthocyanin-rich Açai (Euterpe oleracea Mart.) Fruit Pulp Fractions Attenuate Inflammatory Stress Signaling in Mouse Brain BV-2 Microglial Cells. J. Agric. Food Chem. 2012, 60, 1084–1093. [Google Scholar] [CrossRef]
- Martinez, R.; Guimarães, D.; Berniz, C.; Abreu, J.; Rocha, A.; Moura, R.; Resende, A.; Teodoro, A. Açai (Euterpe oleracea Mart.) Seed Extract Induces Cell Cycle Arrest and Apoptosis in Human Lung Carcinoma Cells. Foods 2018, 7, 178. [Google Scholar] [CrossRef] [Green Version]
- De Moura, R.S.; Ferreira, T.S.; Lopes, A.A.; Pires, K.M.P.; Nesi, R.T.; Resende, A.C.; Souza, P.J.C.; da Silva, A.J.R.; Borges, R.M.; Porto, L.C.; et al. Effects of Euterpe oleracea Mart. (AÇAÍ) extract in acute lung inflammation induced by cigarette smoke in the mouse. Phytomedicine 2012, 19, 262–269. [Google Scholar] [CrossRef] [Green Version]
- Coelho da Mota, D.S.; Sicuro, F.L.; Resende, A.C.; De Moura, R.S.; Bottino, D.A.; Bouskela, E. Effects of açaí and cilostazol on skin microcirculation and viability of TRAM flaps in hamsters. J. Surg. Res. 2018, 228, 253–262. [Google Scholar] [CrossRef]
- Hogan, S.; Chung, H.; Zhang, L.; Li, J.; Lee, Y.; Dai, Y.; Zhou, K. Antiproliferative and antioxidant properties of anthocyanin-rich extract from açai. Food Chem. 2010, 118, 208–214. [Google Scholar] [CrossRef]
- Da Silva, R.C.; Batista, A.; Costa, D.C.F.; da Moura-Nunes, N.; Koury, J.C.; da Costa, C.A.; Resende, Â.C.; Daleprane, J.B. Açai (Euterpe oleracea Mart.) seed flour prevents obesity-induced hepatic steatosis regulating lipid metabolism by increasing cholesterol excretion in high-fat diet-fed mice. Food Res. Int. 2018, 111, 408–415. [Google Scholar] [CrossRef]
- Devalaraja, S.; Jain, S.; Yadav, H. Exotic fruits as therapeutic complements for diabetes, obesity and metabolic syndrome. Food Res. Int. 2011, 44, 1856–1865. [Google Scholar] [CrossRef] [PubMed] [Green Version]
- Poulose, S.M.; Fisher, D.R.; Bielinski, D.F.; Gomes, S.M.; Rimando, A.M.; Schauss, A.G.; Shukitt-Hale, B. Restoration of stressor-induced calcium dysregulation and autophagy inhibition by polyphenol-rich açaí (Euterpe spp.) fruit pulp extracts in rodent brain cells in vitro. Nutrition 2014, 30, 853–862. [Google Scholar] [CrossRef]
- Wang, H.; Cao, G.; Prior, R.L. Oxygen Radical Absorbing Capacity of Anthocyanins. J. Agric. Food Chem. 1997, 45, 304–309. [Google Scholar] [CrossRef]
- Kang, J.; Thakali, K.M.; Xie, C.; Kondo, M.; Tong, Y.; Ou, B.; Jensen, G.; Medina, M.B.; Schauss, A.G.; Wu, X. Bioactivities of açaí (Euterpe precatoria Mart.) fruit pulp, superior antioxidant and anti-inflammatory properties to Euterpe oleracea Mart. Food Chem. 2012, 133, 671–677. [Google Scholar] [CrossRef]
- Kang, J.; Xie, C.; Li, Z.; Nagarajan, S.; Schauss, A.G.; Wu, T.; Wu, X. Flavonoids from acai (Euterpe oleracea Mart.) pulp and their antioxidant and anti-inflammatory activities. Food Chem. 2011, 128, 152–157. [Google Scholar] [CrossRef] [PubMed]
- Garzón, G.A.; Narváez-Cuenca, C.-E.; Vincken, J.-P.; Gruppen, H. Polyphenolic composition and antioxidant activity of açai (Euterpe oleracea Mart.) from Colombia. Food Chem. 2017, 217, 364–372. [Google Scholar] [CrossRef] [PubMed]
- Da Silveira, T.F.F.; de Souza, T.C.L.; Carvalho, A.V.; Ribeiro, A.B.; Kuhnle, G.G.C.; Godoy, H.T. White açaí juice (Euterpe oleracea): Phenolic composition by LC-ESI-MS/MS, antioxidant capacity and inhibition effect on the formation of colorectal cancer related compounds. J. Funct. Foods 2017, 36, 215–223. [Google Scholar] [CrossRef]
- González de Peredo, A.V.; Vázquez-Espinosa, M.; Espada-Bellido, E.; Jiménez-Cantizano, A.; Ferreiro-González, M.; Amores-Arrocha, A.; Palma, M.; Barroso, C.G.; Barbero, G.F. Development of New Analytical Microwave-Assisted Extraction Methods for Bioactive Compounds from Myrtle (Myrtus communis L.). Molecules 2018, 23, 2992. [Google Scholar] [CrossRef] [Green Version]
- Vázquez-Espinosa, M.; González de Peredo, A.Z.; Ferreiro-González, M.; Carrera, C.; Palma, M.; Barbero, G.F.; Espada-Bellido, E. Assessment of Ultrasound Assisted Extraction as an Alternative Method for the Extraction of Anthocyanins and Total Phenolic Compounds from Maqui Berries (Aristotelia chilensis (Mol.) Stuntz). Agronomy 2019, 9, 148. [Google Scholar] [CrossRef] [Green Version]
- Duangpapeng, P.; Lertrat, K.; Lomthaisong, K.; Paul Scott, M.; Suriharn, B. Variability in Anthocyanins, Phenolic Compounds and Antioxidant Capacity in the Tassels of Collected Waxy Corn Germplasm. Agronomy 2019, 9, 158. [Google Scholar] [CrossRef] [Green Version]
- Pacheco-Palencia, L.A.; Duncan, C.E.; Talcott, S.T. Phytochemical composition and thermal stability of two commercial açai species, Euterpe oleracea and Euterpe precatoria. Food Chem. 2009, 115, 1199–1205. [Google Scholar] [CrossRef]
- Gallori, S.; Bilia, A.R.; Bergonzi, M.C.; Barbosa, W.L.R.; Vincieri, F.F. Polyphenolic Constituents of Fruit Pulp of Euterpe oleracea Mart. (Açai palm). Chromatographia 2004, 59. [Google Scholar] [CrossRef]
- Pereira, D.T.V.; Tarone, A.G.; Cazarin, C.B.B.; Barbero, G.F.; Martínez, J. Pressurized liquid extraction of bioactive compounds from grape marc. J. Food Eng. 2019, 240, 105–113. [Google Scholar] [CrossRef]
- Pacheco-Palencia, L.A.; Talcott, S.T. Chemical stability of açai fruit (Euterpe oleracea Mart.) anthocyanins as influenced by naturally occurring and externally added polyphenolic cofactors in model systems. Food Chem. 2010, 118, 17–25. [Google Scholar] [CrossRef]
- Censi, R.; Vargas Peregrina, D.; Lacava, G.; Agas, D.; Lupidi, G.; Sabbieti, M.; Di Martino, P. Cosmetic Formulation Based on an Açai Extract. Cosmetics 2018, 5, 48. [Google Scholar] [CrossRef] [Green Version]
- Celli, G.B.; Tan, C.; Selig, M.J. Anthocyanidins and Anthocyanins. In Encyclopedia of Food Chemistry; Elsevier: Amsterdam, The Netherlands, 2019; pp. 218–223. [Google Scholar] [CrossRef]
- Ferreiro-González, M.; Carrera, C.; Ruiz-Rodríguez, A.; Barbero, G.; Ayuso, J.; Palma, M.; Barroso, C. A New Solid Phase Extraction for the Determination of Anthocyanins in Grapes. Molecules 2014, 19, 21398–21410. [Google Scholar] [CrossRef] [Green Version]
- Crespo-López, M.E.; Soares, E.S.; de Macchi, B.M.; Santos-Sacramento, L.; Takeda, P.Y.; Lopes-Araújo, A.; Paraense, R.S.O.; Souza-Monteiro, J.R.; Augusto-Oliveira, M.; Luz, D.A.; et al. Towards Therapeutic Alternatives for Mercury Neurotoxicity in the Amazon: Unraveling the Pre-Clinical Effects of the Superfruit Açaí (Euterpe oleracea, Mart.) as Juice for Human Consumption. Nutrients 2019, 11, 2585. [Google Scholar] [CrossRef] [Green Version]
- Brunschwig, C.; Leba, L.-J.; Saout, M.; Martial, K.; Bereau, D.; Robinson, J.-C. Chemical Composition and Antioxidant Activity of Euterpe oleracea Roots and Leaflets. Int. J. Mol. Sci. 2016, 18, 61. [Google Scholar] [CrossRef] [Green Version]
- Pérez, M.; Gonçalves, E.; Salgado, J.; Rocha, M.; Almeida, P.; Vici, A.; Infante, J.; Guisán, J.; Rocha-Martin, J.; Pessela, B.; et al. Production of Omegas-6 and 9 from the Hydrolysis of Açaí and Buriti Oils by Lipase Immobilized on a Hydrophobic Support. Molecules 2018, 23, 3015. [Google Scholar] [CrossRef] [Green Version]
- Čižauskaitė, U.; Jakubaitytė, G.; Žitkevičius, V.; Kasparavičienė, G. Natural Ingredients-Based Gummy Bear Composition Designed According to Texture Analysis and Sensory Evaluation In Vivo. Molecules 2019, 24, 1442. [Google Scholar] [CrossRef] [Green Version]
- Oliveira, A.F.A.; Mar, J.M.; Santos, S.F.; da Silva Júnior, J.L.; Kluczkovski, A.M.; Bakry, A.M.; Bezerra, J.A.; de Nunomura, R.C.S.; Sanches, E.A.; Campelo, P.H. Non-thermal combined treatments in the processing of açai (Euterpe oleracea) juice. Food Chem. 2018, 265, 57–63. [Google Scholar] [CrossRef] [PubMed]
- Buratto, R.T.; Hoyos, E.G.; Cocero, M.J.; Martín, Á. Impregnation of açaí residue extracts in silica-aerogel. J. Supercrit. Fluids 2019, 146, 120–127. [Google Scholar] [CrossRef]
- Del Garcia-Mendoza, M.P.; Espinosa-Pardo, F.A.; Baseggio, A.M.; Barbero, G.F.; Maróstica Junior, M.R.; Rostagno, M.A.; Martínez, J. Extraction of phenolic compounds and anthocyanins from juçara (Euterpe edulis Mart.) residues using pressurized liquids and supercritical fluids. J. Supercrit. Fluids 2017, 119, 9–16. [Google Scholar] [CrossRef]
- Da Silveira, T.F.F.; Cristianini, M.; Kuhnle, G.G.; Ribeiro, A.B.; Filho, J.T.; Godoy, H.T. Anthocyanins, non-anthocyanin phenolics, tocopherols and antioxidant capacity of açaí juice (Euterpe oleracea) as affected by high pressure processing and thermal pasteurization. Innov. Food Sci. Emerg. Technol. 2019, 55, 88–96. [Google Scholar] [CrossRef]
- Medina-Torres, N.; Ayora-Talavera, T.; Espinosa-Andrews, H.; Sánchez-Contreras, A.; Pacheco, N. Ultrasound Assisted Extraction for the Recovery of Phenolic Compounds from Vegetable Sources. Agronomy 2017, 7, 47. [Google Scholar] [CrossRef]
- Espada-Bellido, E.; Ferreiro-González, M.; Carrera, C.; Palma, M.; Álvarez, J.A.; Barbero, G.F.; Ayuso, J. Extraction of Antioxidants from Blackberry (Rubus ulmifolius L.): Comparison between Ultrasound- and Microwave-Assisted Extraction Techniques. Agronomy 2019, 9, 745. [Google Scholar] [CrossRef] [Green Version]
- Baiano, A. Recovery of Biomolecules from Food Wastes—A Review. Molecules 2014, 19, 14821–14842. [Google Scholar] [CrossRef] [Green Version]
- Ciulu, M.; Cádiz-Gurrea, M.; Segura-Carretero, A. Extraction and Analysis of Phenolic Compounds in Rice: A Review. Molecules 2018, 23, 2890. [Google Scholar] [CrossRef] [Green Version]
- González de Peredo, A.V.; Vázquez-Espinosa, M.; Espada-Bellido, E.; Ferreiro-González, M.; Amores-Arrocha, A.; Palma, M.; Barbero, G.F.; Jiménez-Cantizano, A. Alternative Ultrasound-Assisted Method for the Extraction of the Bioactive Compounds Present in Myrtle (Myrtus communis L.). Molecules 2019, 24, 882. [Google Scholar] [CrossRef] [Green Version]
- Vázquez-Espinosa, M.; González-de-Peredo, A.V.; Espada-Bellido, E.; Ferreiro-González, M.; Toledo-Domínguez, J.J.; Carrera, C.; Palma, M.; Barbero, G.F. Ultrasound-Assisted Extraction of Two Types of Antioxidant Compounds (TPC and TA) from Black Chokeberry (Aronia melanocarpa L.): Optimization of the Individual and Simultaneous Extraction Methods. Agronomy 2019, 9, 456. [Google Scholar] [CrossRef] [Green Version]
- Kaleem, M.; Ahmad, A.; Amir, R.M.; Kaukab Raja, G. Ultrasound-Assisted Phytochemical Extraction Condition Optimization Using Response Surface Methodology from Perlette Grapes (Vitis vinifera). Processes 2019, 7, 749. [Google Scholar] [CrossRef] [Green Version]
- Wang, D.; Zhang, L.; Xu, Y.; Qi, X.; Wang, X.; Wang, X.; Zhang, Q.; Li, P. Optimization of an Ultrasound-Assisted Extraction for Simultaneous Determination of Antioxidants in Sesame with Response Surface Methodology. Antioxidants 2019, 8, 321. [Google Scholar] [CrossRef] [PubMed] [Green Version]
- Alvarez-Jubete, L.; Valverde, J.; Patras, A.; Mullen, A.M.; Marcos, B. Assessing the Impact of High-Pressure Processing on Selected Physical and Biochemical Attributes of White Cabbage (Brassica oleracea L. var. capitata alba). Food Bioprocess Technol. 2014, 7, 682–692. [Google Scholar] [CrossRef]
- Park, C.H.; Yeo, H.J.; Park, S.-Y.; Kim, J.K.; Park, S.U. Comparative Phytochemical Analyses and Metabolic Profiling of Different Phenotypes of Chinese Cabbage (Brassica Rapa ssp. Pekinensis). Foods 2019, 8, 587. [Google Scholar] [CrossRef] [PubMed] [Green Version]
- Wang, Y.; Liang, J.; Luan, G.; Zhang, S.; Zhuoma, Y.; Xie, J.; Zhou, W. Quantitative Analyses of Nine Phenolic Compounds and Their Antioxidant Activities from Thirty-Seven Varieties of Raspberry Grown in the Qinghai-Tibetan Plateau Region. Molecules 2019, 24, 3932. [Google Scholar] [CrossRef] [PubMed] [Green Version]
- Peng, D.; Zahid, H.F.; Ajlouni, S.; Dunshea, F.R.; Suleria, H.A.R. LC-ESI-QTOF/MS Profiling of Australian Mango Peel By-Product Polyphenols and Their Potential Antioxidant Activities. Processes 2019, 7, 764. [Google Scholar] [CrossRef] [Green Version]
- Błaszak, M.; Nowak, A.; Lachowicz, S.; Migdał, W.; Ochmian, I. E-Beam Irradiation and Ozonation as an Alternative to the Sulphuric Method of Wine Preservation. Molecules 2019, 24, 3406. [Google Scholar] [CrossRef] [Green Version]
- Chamorro, M.F.; Reiner, G.; Theoduloz, C.; Ladio, A.; Schmeda-Hirschmann, G.; Gómez-Alonso, S.; Jiménez-Aspee, F. Polyphenol Composition and (Bio)Activity of Berberis Species and Wild Strawberry from the Argentinean Patagonia. Molecules 2019, 24, 3331. [Google Scholar] [CrossRef] [Green Version]
- Duan, W.; Xia, T.; Zhang, B.; Li, S.; Zhang, C.; Zhao, C.; Song, J.; Wang, M. Changes of Physicochemical, Bioactive Compounds and Antioxidant Capacity during the Brewing Process of Zhenjiang Aromatic Vinegar. Molecules 2019, 24, 3935. [Google Scholar] [CrossRef] [Green Version]
- Tornero-Martínez, A.; Cruz-Ortiz, R.; Jaramillo-Flores, M.E.; Osorio-Díaz, P.; Ávila-Reyes, S.V.; Alvarado-Jasso, G.M.; Mora-Escobedo, R. In vitro Fermentation of Polysaccharides from Aloe vera and the Evaluation of Antioxidant Activity and Production of Short Chain Fatty Acids. Molecules 2019, 24, 3605. [Google Scholar] [CrossRef] [Green Version]
- Ti, H.; Li, Q.; Zhang, R.; Zhang, M.; Deng, Y.; Wei, Z.; Chi, J.; Zhang, Y. Free and bound phenolic profiles and antioxidant activity of milled fractions of different indica rice varieties cultivated in southern China. Food Chem. 2014, 159, 166–174. [Google Scholar] [CrossRef] [PubMed]
- Aliaño-González, M.J.; Ferreiro-González, M.; Espada-Bellido, E.; Carrera, C.; Palma, M.; Álvarez, J.A.; Ayuso, J.; Barbero, G.F. Extraction of anthocyanins and total phenolic compounds from açai (Euterpe oleracea Mart.) using an experimental design methodology. Part 1: Pressurized liquid extraction. Agronomy 2020, 10, 183. [Google Scholar] [CrossRef] [Green Version]
- Kumar, M.; Dahuja, A.; Sachdev, A.; Kaur, C.; Varghese, E.; Saha, S.; Sairam, K.V.S.S. Valorisation of black carrot pomace: Microwave assisted extraction of bioactive phytoceuticals and antioxidant activity using Box–Behnken design. J. Food Sci. Technol. 2019, 56, 995–1007. [Google Scholar] [CrossRef] [PubMed]
- Verbeyst, L.; Oey, I.; Van der Plancken, I.; Hendrickx, M.; Van Loey, A. Kinetic study on the thermal and pressure degradation of anthocyanins in strawberries. Food Chem. 2010, 123, 269–274. [Google Scholar] [CrossRef]
- Gardana, C.; Ciappellano, S.; Marinoni, L.; Fachechi, C.; Simonetti, P. Bilberry Adulteration: Identification and Chemical Profiling of Anthocyanins by Different Analytical Methods. J. Agric. Food Chem. 2014, 62, 10998–11004. [Google Scholar] [CrossRef]


| Total Anthocyanins Coefficient | Total Anthocyanins p-Value | Total Phenolic Compounds Coefficient | Total Phenolic Compounds p-Value | |
|---|---|---|---|---|
| β0 | 4.4667 | 9.4717 | ||
| Solvent (β1) | −0.2233 | 0.0011 | 0.1871 | 0.33 |
| Temperature (β2) | 0.0521 | 0.39 | 0.1400 | 0.47 |
| Amplitude (β3) | 0.0154 | 0.80 | 0.0346 | 0.86 |
| Cycle (β4) | 0.0638 | 0.30 | 0.2075 | 0.28 |
| pH (β5) | −0.0150 | 0.81 | 0.0821 | 0.67 |
| “Ratio” (β6) | −0.0154 | 0.80 | −0.0200 | 0.92 |
| Solvent:Solvent (β11) | −1.7110 | 0.00 | −1.2765 | 0.0002 |
| Solvent:Temperature (β12) | −0.0175 | 0.87 | −0.2500 | 0.45 |
| Solvent:Amplitude (β13) | 0.1775 | 0.10 | 0.5000 | 0.14 |
| Solvent:Cycle (β14) | 0.0575 | 0.45 | −0.1156 | 0.62 |
| Solvent:pH (β15) | 0.0025 | 0.98 | 0.3175 | 0.34 |
| Solvent:“Ratio” (β16) | −0.1425 | 0.19 | 0.2062 | 0.54 |
| Temperature:Temperature (β22) | −0.1672 | 0.083 | −1.2040 | 0.0003 |
| Temperature:Amplitude (β23) | −0.0550 | 0.61 | −0.4488 | 0.18 |
| Temperature:Cycle (β24) | 0.0762 | 0.48 | −0.0388 | 0.91 |
| Temperature:pH (β25) | 0.0369 | 0.62 | 0.1069 | 0.65 |
| Temperature:“Ratio” (β26) | 0.2100 | 0.057 | 0.6463 | 0.060 |
| Amplitude:Amplitude (β33) | −0.1085 | 0.25 | 0.5051 | 0.093 |
| Amplitude:Cycle (β34) | 0.1125 | 0.30 | 0.5375 | 0.11 |
| Amplitude:pH (β38) | 0.0638 | 0.55 | −0.4225 | 0.21 |
| Amplitude:“Ratio” (β36) | 0.0394 | 0.60 | 0.3494 | 0.14 |
| Cycle:Cycle (β44) | 0.0103 | 0.91 | 0.1022 | 0.73 |
| Cycle:pH (β45) | 0.0888 | 0.41 | 0.0538 | 0.87 |
| Cycle:“Ratio” (β46) | −0.1425 | 0.19 | 0.0863 | 0.80 |
| pH:pH (β55) | −0.1185 | 0.21 | 0.1093 | 0.71 |
| pH:“Ratio” (β56) | −0.0512 | 0.63 | −0.3050 | 0.36 |
| “Ratio”:“Ratio” (β66) | −0.0085 | 0.93 | −0.1136 | 0.70 |
| Variable | Optimum Values for TA | Optimum Values for TPC |
|---|---|---|
| Solvent (% MeOH) | 51 | 49 |
| Temperature (°C) | 31 | 41 |
| pH | 6.38 | 6.98 |
| Cycle (s) | 0.7 | 0.2 |
| Amplitude (%) | 65 | 30 |
| “Ratio” (mL) | 10 | 10 |
| Repeatability 1 | Intermediate Precision 2 | |
|---|---|---|
| Average (mg TA/g açai) | 4.517 | 4.492 |
| SD * | 0.122 | 0.054 |
| RSD ** (%) | 2.7 | 1.2 |
| Average (mg TPC/g açai) | 10.374 | 10.465 |
| SD * | 0.440 | 0.180 |
| RSD ** (%) | 4.2 | 1.7 |
| Samples | mg TA/g Sample | mg TPC/g Sample |
|---|---|---|
| Freeze-dried açai (1) | 5.42 ± 0.06 | 12.04 ± 0.34 |
| Freeze-dried açai (2) | 4.55 ± 0.22 | 10.22 ± 0.41 |
| Freeze-dried açai (3) | 3.99 ± 0.15 | 9.17 ± 0.21 |
| Açai juice | 0.03 ± 0.00 | 2.09 ± 0.05 |
| Açai juice food supplement | 0.04 ± 0.00 | 2.05 ± 0.10 |
| Concentrated juice açai-banana | 0.01 ± 0.00 | 4.66 ± 0.19 |
| Açai tablet | 0.04 ± 0.00 | 1.91 ± 0.37 |
| Açai jam | 0.14 ± 0.00 | 1.16 ± 0.17 |
© 2020 by the authors. Licensee MDPI, Basel, Switzerland. This article is an open access article distributed under the terms and conditions of the Creative Commons Attribution (CC BY) license (http://creativecommons.org/licenses/by/4.0/).
Share and Cite
Aliaño-González, M.J.; Espada-Bellido, E.; Ferreiro-González, M.; Carrera, C.; Palma, M.; Ayuso, J.; Álvarez, J.Á.; F. Barbero, G. Extraction of Anthocyanins and Total Phenolic Compounds from Açai (Euterpe oleracea Mart.) Using an Experimental Design Methodology. Part 2: Ultrasound-Assisted Extraction. Agronomy 2020, 10, 326. https://doi.org/10.3390/agronomy10030326
Aliaño-González MJ, Espada-Bellido E, Ferreiro-González M, Carrera C, Palma M, Ayuso J, Álvarez JÁ, F. Barbero G. Extraction of Anthocyanins and Total Phenolic Compounds from Açai (Euterpe oleracea Mart.) Using an Experimental Design Methodology. Part 2: Ultrasound-Assisted Extraction. Agronomy. 2020; 10(3):326. https://doi.org/10.3390/agronomy10030326
Chicago/Turabian StyleAliaño-González, María José, Estrella Espada-Bellido, Marta Ferreiro-González, Ceferino Carrera, Miguel Palma, Jesús Ayuso, José Ángel Álvarez, and Gerardo F. Barbero. 2020. "Extraction of Anthocyanins and Total Phenolic Compounds from Açai (Euterpe oleracea Mart.) Using an Experimental Design Methodology. Part 2: Ultrasound-Assisted Extraction" Agronomy 10, no. 3: 326. https://doi.org/10.3390/agronomy10030326