Communication

Temporal Patterns of Flowering and Pod Set of Determinate Soybean in Response to High Temperature

1
Center for Plant Science and Biotechnology, Research Institute of Agriculture and Life Sciences, Seoul National University, 1 Gwanak-ro, Gwanak-gu, Seoul 08826, Korea
2
Department of Plant Science, College of Agriculture and Life Sciences, Seoul National University, 1 Gwanak-ro, Gwanak-gu, Seoul 08826, Korea
3
Crop physiology and production, National Institute of Crop Science, Rural Development Administration, 181, Hyeoksin-ro, Iseo-myeon, Wanju-Gun, Jeollabuk-do 55365, Korea
*
Author to whom correspondence should be addressed.
Agronomy 2020, 10(3), 414; https://doi.org/10.3390/agronomy10030414
Submission received: 22 January 2020 / Revised: 18 February 2020 / Accepted: 17 March 2020 / Published: 19 March 2020

Abstract

:
Global warming is expected to affect yield-determining factors of soybean (Glycine max (L.) Merr.), including the number of flowers and pods. However, little is known about the effects of high temperature on the temporal patterns of flowering and pod set. Experiments in the temperature-controlled greenhouses were conducted to examine the temporal pattern of flowering in determinate soybean cultivar “Sinpaldalkong” and to assess the effects of high temperature on the flower number, pod-set ratio, and pod number of the early- and late-opened-flowers and their contributions to overall pod number. The experiment comprised five sowing dates in 2013–2015 and four temperature treatments, namely ambient temperature (AT), AT + 1.5 °C, AT + 3.0 °C, and AT + 5.0 °C. Flowering duration (i.e., days between the first flowering and the last flowering) was extended by higher temperature and earlier sowing. The temporal distribution of flowering showed a bimodal distribution except for the experiment with the shortest flowering duration, i.e., second sowing in 2014. More flowers were produced in the late flowering period at high temperatures; however, most of these late-opened-flowers failed to reproduce, regardless of temperature conditions, resulting in a negligible contribution to the overall pod number. For the early-opened-flowers, the number of flowers was not significantly affected by temperature, while the pod-set ratio and pod number decreased with high temperatures resulting in a decrease in the overall pod number at temperatures above 29.4 °C.

1. Introduction

Among the two main yield components (i.e., the number of seeds and seed size) of soybean (Glycine max (L.) Merr.), the number of seeds, which primarily depends on the number of pods, accounts for most of the variation in yield [1]. The number of pods is determined by the number of flowers and pod-set ratio; therefore, environmental conditions during the flowering and pod set period—from the beginning of flowering (R1) to the beginning of seed filling (R5)—are closely associated with the numbers of pods and seeds [2,3].
The temporal pattern of soybean flowering follows a bimodal distribution in a node-level [4]. The early group of flowers is on a primary raceme, while the later flowers are mostly on sub-racemes. In a plant-level, peak blooming period for a primary raceme was 4–13th day after first flowering, while that for sub-racemes (including sub-branches) was 11–21st day after first flowering in 12 cultivars [5]. Late developing flowers have higher levels of abortion compared to the early developing flowers [6,7,8]. This may result because most of the available assimilate may be used by rapidly growing pods from the early-opened flowers [4]. Meanwhile, synchronous flowering is reported to increase the pod set [9], indicating that the temporal pattern of flowering may play an important role in determining the pod number of soybean [6,9].
In Northeast Asia, including Korea and Japan, soybeans generally experience relatively high temperatures during the flowering and pod set periods, 1–2 months after the summer solstice [10]. The anticipated global warming (+1.0–3.7 °C by the end of the 21st century [11]) may alter the temporal dynamics of flowering and pod set, thereby altering the number of pods. However, the effects of high temperature on the temporal patterns of flowering and pod set were examined only with a high night temperature experiment [12]. Increased night temperature from 20 °C to 25 °C or 30 °C with a constant day temperature of 30 °C induced the second peak of flowering by increasing the number of flowers on sub-racemes. Meanwhile, high night temperature did not reduce the pod-set ratio and thereby increased the overall pod number.
The global warming involves not only high night temperature but also high day temperature, which was not considered in the abovementioned experiment [12]. In addition, its result could be perturbed by the reduced diurnal temperature range, which varied from 0 to 10 °C. Moreover, the experiment was conducted with unnatural temperature conditions, i.e., constant temperatures throughout the flowering period. Therefore, this study aimed to assess the effects of high temperature on the temporal pattern of flowering, the reproductive success of early- and late-opened-flowers, and their contributions to overall pod number in a determinate soybean grown under near-natural temperature conditions, i.e., natural variations in diurnal and seasonal temperatures.

2. Materials and Methods

2.1. Crop Management

A series of experiments were conducted from 2013 to 2015 with a determinate soybean cultivar, Sinpaldalkong (maturity group IV), in four sunlit temperature-controlled greenhouses (W × D × H; 5.0 m × 14.0 m × 3.5 m) at the Experimental Farm of Seoul National University, Suwon, South Korea (37°16´ N, 126°59´ E). Five seeds were sown at 3 cm depth in 7L PVC pots (15 cm in diameter, 40 cm in height) containing loam soil with a pH of 6.6 and cation exchange capacity (CEC) of 15.4 cmol(+) kg−1 in 2013 and 2014 and with loamy sand soil with a pH of 4.9 and CEC of 6.6 cmol(+) kg−1 in 2015. The soybean was sown on 15 June 2013 (2013s1); 30 June 2013 (2013s2); 30 May 2014 (2014s1); 20 June 2014 (2014s2); and 15 June 2015 (2015). Chemical fertilizers were applied to each pot before sowing, which contained 0.08, 0.08, and 0.09 g of N, P2O5, and K2O, respectively. The pots were arranged in four rows, where plants were spaced 15 cm apart in rows, 45 cm apart. After emergence from the soil, the plants were thinned to one plant per pot and then exposed to “no water-stress conditions” by sub-irrigation. Weeding was carried out manually per week. Pesticides (cyenopyrafen (HanKook SamGong Co., Ltd., Seoul, Republic of Korea), clothianidin (HanKook SamGong Co., Ltd., Seoul, Republic of Korea), flonicamid (FarmHannong Co., Ltd., Seoul, Republic of Korea), and fenitrothion (Dongbang Agro Corp., Seoul, Republic of Korea)) were applied when necessary.

2.2. Temperature Treatments

For each growing season, soybeans were subjected to four different temperature conditions using the temperature-controlled greenhouses: ambient temperature (AT), AT + 1.5 °C, AT + 3.0 °C, and AT + 5.0 °C. Sidewalls of the AT were removed to maintain outdoor ambient temperature. The temperatures in AT + 1.5 °C, AT + 3.0 °C, and AT + 5.0 °C were held at the target temperatures by automatic controls of electric hot-air blowers, roof-mounted ventilation fans, and sidewalls using a data logger (CR1000, Campbell Scientific Inc., Logan, UT, USA) equipped with relative humidity and temperature probes (Model 41382, RM Young Company, Traverse City, MI, USA) mounted in the center of each greenhouse. The temperature readings were taken on a one-minute interval. For every minute, the temperatures in AT + 1.5 °C, AT + 3.0 °C, and AT + 5.0 °C were adjusted. For each day, the daily mean temperature was calculated as the average of the temperature readings throughout the day (Figure 1).

2.3. Measurements

Newly opened flowers were counted every day during the flowering period on four to five plants in 2013s1, five plants in 2013s2, four plants in 2014s1, three plants (single plant for the AT + 1.5 °C) in 2014s2, and three to four plants in 2015 from each temperature treatment. Fertile pods were counted at maturity, and pod-set ratio was determined as the number of fertile pods divided by the total number of flowers. In 2015, each flower was tagged with a flowering date every day and was tracked until maturity to examine the relationship between the flowering time (early or late in the flowering period) and reproductive success.

2.4. Bimodal Model for Flowering Pattern

Flower number was averaged for each days-after-the-first-flowering (DAF) for each temperature treatment and growing season. Since high (night) temperature is reported to induce the second peak of flowering by increasing the number of late-opened-flowers [12], the time-series flowering data were fitted to the following bimodal distribution function (a combination of two normal distributions) using PROC NLIN procedure in SAS software version 9.4 (SAS Institute Inc., Cary, NC, US).
f ( t ) = f 1 1 2 π σ 1 e x p [ ( t t 1 ) 2 2 σ 1 2 ] + f 2 1 2 π σ 2 e x p [ ( t t 2 ) 2 2 σ 2 2 ]
where f(t) is the number of opened flowers at t (DAF); f1 and f2 are the amplitude parameters of the early and late distribution, respectively; t1 and t2 are the t’s when the flowering reaches early and late peaks, respectively; and σ1 and σ2 are the standard deviations of the early and late distribution, respectively.
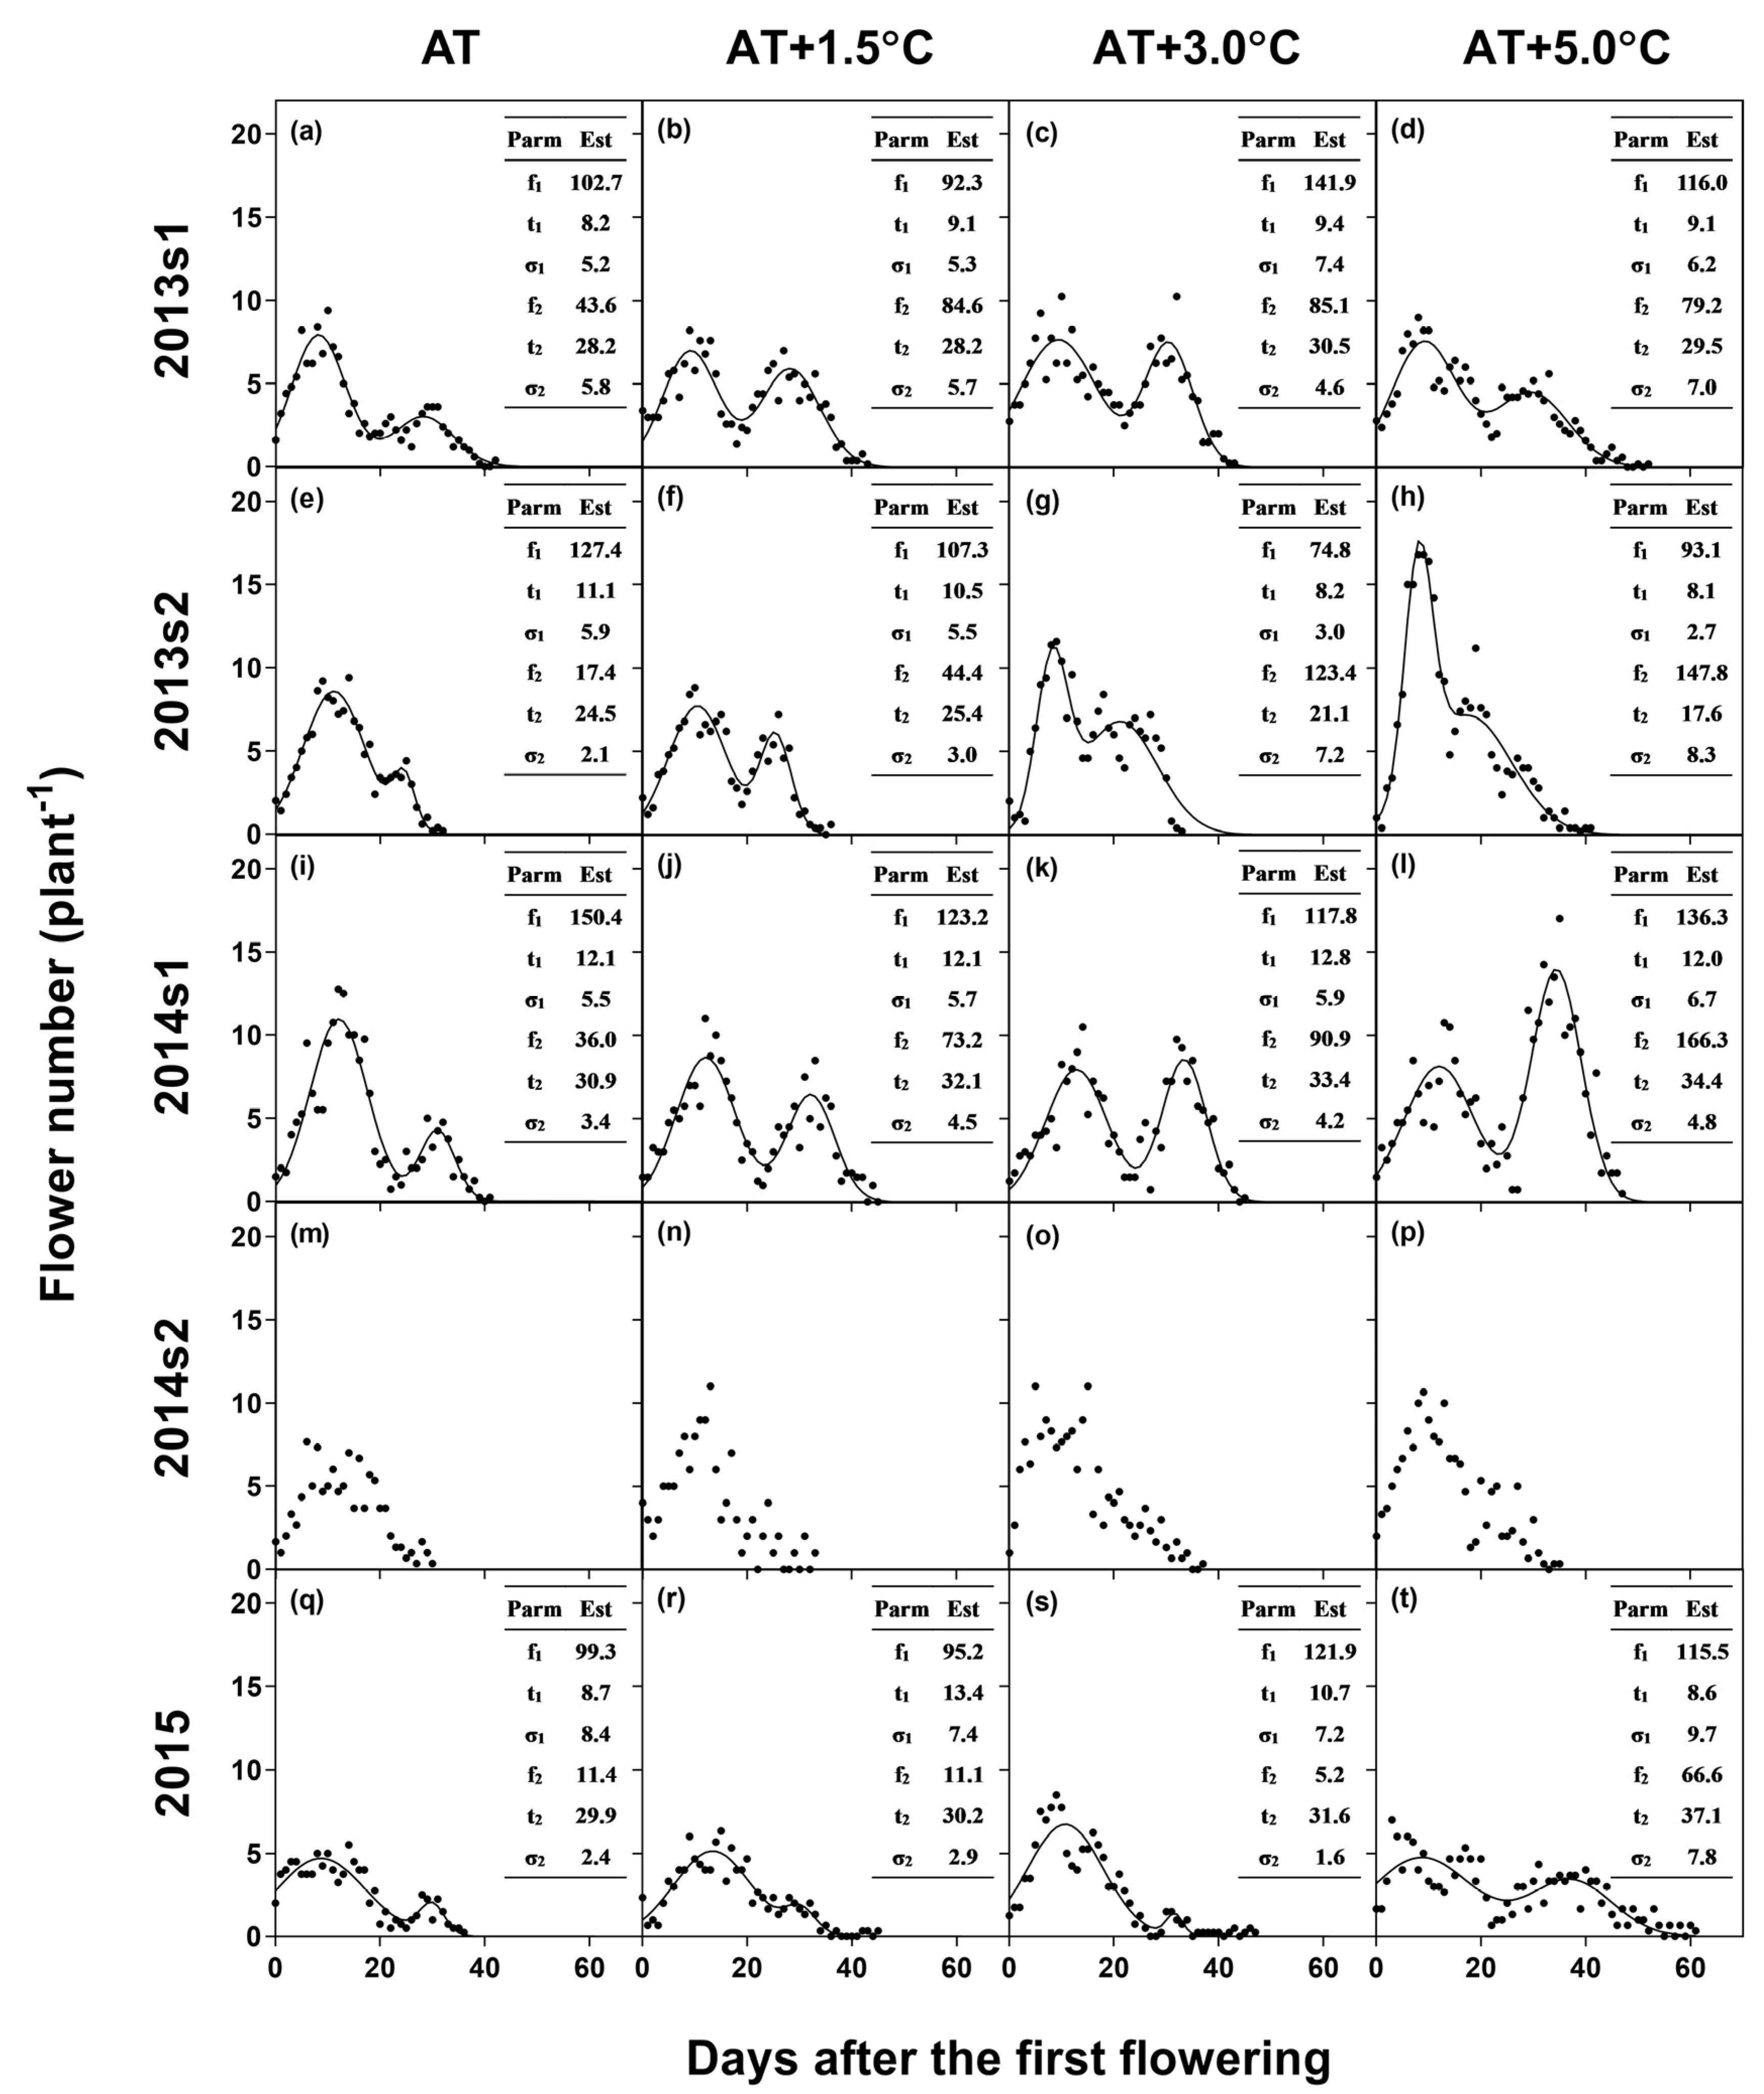
The flowering period was divided into the early and late periods based on the intersecting point of the two normal distributions in Equation (1) to assess the effect of temperature on the reproductive success of flowers that opened at different times. However, the second peak was not observed in 2014s2 (Figure 2), which had the coolest temperature during R1–R5 (Figure 1). Thus, the data of 2014s2 were not fitted to the bimodal model equation and were excluded from the analyses of the early- and late-opened flowers.

2.5. Regression Models to Estimate Temperature Effects

The flowering duration was determined as the number of the days between the first flowering and the last flowering and was averaged between pots to give a single response for each temperature treatment and growing season. Next, regression analysis was carried out to determine the response of flowering duration to the sowing date (day-of-year) and temperature during a flowering and pod set period (TR1–R5) using PROC GLM procedure in SAS software version 9.4 (SAS Institute Inc., Cary, NC, US).
The pod number, pod-set ratio, and flower number of the overall, early-opened, and late-opened flowers were averaged for each temperature treatment and growing season. Subsequently, the effects of TR1–R5 on the abovementioned characteristics were analyzed with regression analyses using the PROC GLM procedure. A quadratic term of TR1–R5 was included in the models when necessary. A fixed effect of the experiments (e.g., 2013s1, 2013s2, 2014s1, 2014s2, and 2015) was included in the models to consider the different soil characteristics in 2015 and the different environmental conditions among the experiments, i.e., solar radiation.

3. Results

3.1. Meteorological Conditions

The daily mean temperature averaged over R1–R5 (TR1–R5) in the AT was 27.3 °C in 2013s1, 28.3 °C in 2013s2, 26.0 °C in 2014s1, 25.3 °C in 2014s2, and 28.1 °C in 2015 (Figure 1). When averaged across the growing seasons, TR1–R5 was increased by 1.5 °C in the AT + 1.5 °C, 2.7 °C in the AT + 3.0 °C, and 4.1 °C in the AT + 5.0 °C. TR1–R5 range of the full data-set was 25.3–32.4 °C. For every treatment, R1 occurred after the summer solstice (22 June, daylength of 14.5 h); and thus, the daylength during R1–R5 decreased as the sowing date was postponed. When averaged across the years, the radiation inside the greenhouses approximated 10.0 MJ m−2 day−1 from June to September, which covers most of the growing seasons.

3.2. Flowering Pattern

According to the regression analysis (Table 1), the flowering duration was extended by 2.12 days per 1 °C increase in TR1-R5 and was shortened by 0.47 days per delayed sowing of a day (i.e., shorter daylength). Accordingly, the flowering duration averaged across the temperature treatments was shortest in the coolest (25.3 °C for AT) and late planting, 2014s2. In this experiment, the late-peak of flowering was not observed (Figure 2). Meanwhile, for the other experiments, the bimodal model equation was converged with the time-series flowering data. When averaged across the experiments, the intersecting point of the two distribution was 21.4 DAF, and the early and late peaks occurred at 10.3 and 29.0 DAF, respectively.

3.3. Pod Number, Pod-Set Ratio, and Flower Number

Pod number, pod-set ratio, and flower number were significantly affected by TR1–R5 within the range of 25.3–32.4 °C (Table 2). Pod number varied from 15 to 120 per plant, with an optimum temperature of 29.4 °C. Pod-set ratio varied from 9.4 to 60.9%, with an optimum temperature of 26.9 °C. Flower number was increased by 18.8 plant−1 per 1 °C increase in TR1–R5, with a minimum flower number of 96.8 plant−1 and a maximum of 300.3 plant−1.
Responses of pod number, pod-set ratio, and flower number to TR1–R5 differed between the flowers that opened at the early- and late-flowering period (Table 3). Within the TR1–R5 range of 28.1–32.4 °C, the pod number of the early-opened-flowers were significantly decreased by 6.7 plant−1 per 1 °C increase in TR1–R5 (varying from 9.3 to 38.0 plant−1), whereas the TR1–R5 effect on the pod number of the late-opened-flowers was negligible, and only a few pods were formed from the late-opened-flowers (varying from 0.3 to 5.7 plant−1). The pod-set ratio of the early-opened-flowers decreased by 8.8% per 1 °C increase in TR1–R5 (varying from 9.7 to 47.0%), whereas the pod-set ratio of the late-opened-flowers was not significantly affected by TR1–R5 and was always below 10% (varying from 1.8 to 8.5%). Within the TR1–R5 range of 26.0–32.4 °C, the number of the early-opened-flowers was not significantly affected by TR1–R5 (varying from 84.0 to 147.5 plant−1), whereas the number of the late-opened-flowers was significantly increased by 18.0 plant−1 per 1 °C increase in TR1–R5 (varying from 9.0 to 166.5 plant−1).

4. Discussion

High temperature, i.e., above 29.4 °C reduced the overall pod number (Table 2), which agrees with a previous study suggesting an optimum day/night temperature of 34/26 °C (i.e., daily mean temperature of 30 °C) [13]. This reduction in the pod number was mainly associated with a decrease in the pod-set ratio and pod number of the early-opened-flowers (Table 3). High temperature modified the flowering pattern of soybean; more flowers were observed in the late flowering period (Figure 2). However, most of these late-opened-flowers failed to reproduce, resulting in a negligible contribution to the overall pod number (Table 3).

4.1. Early Opened Flowers

During the flowering period of soybeans, the flowers on primary racemes open first followed by the flowers on sub-racemes (or sub-branches) [4,5,6]. The number of the flowers on a primary raceme at a node is relatively consistent compared to that on a sub-raceme [9]. Therefore, in determinate soybean, which has a limited number of nodes with low variations (12–15 nodes in the present study), the number of the early-opened-flowers may not have been sensitive to the high temperature (Table 3). However, the high temperature, i.e., above 26.9 °C, decreased the overall pod-set ratio (Table 2) by reducing the pod-set ratio of the early-opened flowers (Table 3). In agreement with our results, the pod-set ratio of soybean decreased by increasing the day/night temperature from 30/20 °C to 30/26 °C, 30/29 °C, and 39/20 °C for ten days at the flowering stage [14]. The authors suggested that this pod-set failure caused by high temperature was attributed to decreases in photosynthesis rate and pollen germination. However, in the climate change conditions, the reduced photosynthesis caused by high temperature might be compensated by the elevated CO2 concentration [15], which suppresses the photorespiration and increases photoassimilation [16]. Meanwhile, the compensatory effect of CO2 may not occur for the poor pollen germination [17].

4.2. Late Opened Flowers

High temperatures extend flowering duration [18], the extension of which may arise due to the formation of flowers on sub-racemes in the late flowering period [6], which agrees with the present study (Table 1 and Table 3). The high number of late-opened-flowers coupled with the low pod-set ratio of the early-opened-flowers caused by high temperature (Table 3) implies that the relieved source-competition between early- and late-opened-flowers may have enhanced the late flowering. Moreover, high temperature is reported to delay the onset of seed growth and reduce seed growth rate [19], which may also alleviate the competition. Similarly, it has been reported that the effective seed fillings on primary racemes were delayed by long days, resulting in the prolonged flowering duration and increased number of flowers on lateral racemes [20].
In contrast, the pod-set ratio and pod number of the late-opened-flowers were not significantly increased by high temperatures and were consistently low regardless of the temperature (Table 3). These may have arisen by the nutrient deficiency during late growth. The top-dressing of nitrogen around flowering is reported to improve the pod-set ratio of soybean [21,22]. Thus, the temperature response may differ under the growing conditions free of nutrient deficiency. However, in South Korea, top-dressing is often not applied in soybean fields due to the economic (e.g., additional fertilizers and labors) and environmental issues even though it is recommended for high yield. Thus, the response from the current study may better represent the reality of the soybean farm in South Korea. Nonetheless, further high-temperature studies with top-dressing might help in developing adaptation strategies for global warming.

4.3. Implication and Limitations

Recently, soybean models are frequently used in climate change studies to capture the combined effects of the changes in temperature, CO2 concentration, and water [23,24]. Unfortunately, most of these models do not address the temporal dynamics of the flowering and pod set process of soybean, and consequently, the environmental effects on those dynamics. Egli [25] built a pod-set model (SOYPODP) which utilizes a measured profile of flowers per node as an input; however, the effect of temperature is not included in the model due to limited information. Our data might help to improve this model in terms of temperature response, but there are some experimental limitations to be overcome before the data can be utilized. First of all, the patterns of flowering and pod set differ among cultivars, but only one determinate cultivar, Sinpaldalkong (maturity group IV), was used in this study. Second, late sowing (or short daylength) shortens the flowering duration [26,27], thereby probably modifies the pod set. However, by using the present data with the small variation in sowing dates, it was not possible to draw any solid conclusion on the effect of sowing date and its interaction with temperature on the pod set. Third, the current study was performed under a controlled environment, i.e., pot-grown soybean in temperature-controlled greenhouses. Fourth, the analyses for the pod number and pod-set ratio of the early- and late-opened flowers were carried out with one-year data. Consequently, the results from this study should be confirmed by further field experiments with various cultivars, growing seasons, and temperature regimes in order to elucidate the physiological mechanisms of the changes in the temporal dynamics of flower- and pod-production caused by high temperatures and to add these mechanisms into the model mentioned above.

Author Contributions

Conceptualization and designing the experiments, D.-H.C. and B.-W.L.; performing experiments, D.-H.C., H.-Y.B., and B.-S.S.; data analysis, visualization and writing—original draft preparation, Y.-U.K.; writing—review and editing, Y.-U.K., J.K., and B.-W.L. All authors have read and agreed to the published version of the manuscript.

Funding

This study was conducted with the support of the Cooperative Research Program for Agriculture Science& Technology Development (Project No. PJ0101072016), Rural Development Administration, Republic of Korea.

Acknowledgments

The authors would like to thank every staff in the University Farm of the College of Agriculture and Life Sciences at Seoul National University for technical assistance.

Conflicts of Interest

The authors declare no conflict of interest.

References

  1. Calviño, P.A.; Sadras, V.O.; Andrade, F.H. Development, growth and yield of late-sown soybean in the southern Pampas. Eur. J. Agron. 2003, 19, 265–275. [Google Scholar] [CrossRef]
  2. Jiang, H.; Egli, D.B. Shade Induced Changes in Flower and Pod Number and Flower and Fruit Abscission in Soybean. Agron. J. 1993, 85, 221–225. [Google Scholar] [CrossRef]
  3. Puteh, A.B.; Thuzar, M.; Mondal, M.M.A.; Abdullah, N.A.P.B.; Halim, M.R.A. Soybean [Glycine max (L.) Merrill] seed yield response to high temperature stress during reproductive growth stages. Aust. J. Crop. Sci. 2013, 7, 1472–1479. [Google Scholar]
  4. Egli, D.B.; Bruening, W.P. Flowering and fruit set dynamics at phloem-isolated nodes in soybean. Field Crop. Res. 2002, 79, 9–19. [Google Scholar] [CrossRef]
  5. Gai, J.; Palmer, R.G.; Fehr, W.R. Bloom and Pod Set in Determinate and Indeterminate Soybeans Grown in China. Agron. J. 1984, 76, 979–984. [Google Scholar] [CrossRef]
  6. Egli, D.B. Flowering, pod set and reproductive success in soya bean. J. Agron. Crop. Sci. 2005, 191, 283–291. [Google Scholar] [CrossRef]
  7. Heitholt, J.J.; Egli, D.B.; Leggett, J.E. Characteristics of reproductive abortion in soybean. Crop. Sci. 1986, 26, 589–595. [Google Scholar] [CrossRef]
  8. Huff, A.; Dybing, C.D. Factors affecting shedding of flowers in soybean (Glycine max (L.) Merrill). J. Exp. Bot. 1980, 31, 751–762. [Google Scholar] [CrossRef]
  9. Egli, D.B.; Bruening, W.P. Synchronous Flowering and Fruit Set at Phloem-Isolated Nodes in Soybean. Crop. Sci. 2002, 42, 1535–1540. [Google Scholar] [CrossRef]
  10. Tacarindua, C.R.P.; Shiraiwa, T.; Homma, K.; Kumagai, E.; Sameshima, R. The effects of increased temperature on crop growth and yield of soybean grown in a temperature gradient chamber. Field Crop. Res. 2013, 154, 74–81. [Google Scholar] [CrossRef]
  11. IPCC. Climate change 2013: The physical science basis. In Contribution of Working Group I to the Fifth Assessment Report of the Intergovernmental Panel on Climate Change; Cambridge University Press: Cambridge, UK; New York, NY, USA, 2013. [Google Scholar]
  12. Zheng, S.-H.; Nakamoto, H.; Yoshikawa, K.; Furuya, T.; Fukuyama, M. Influences of High Night Temperature on Flowering and Pod Setting in Soybean. Plant. Prod. Sci. 2002, 5, 215–218. [Google Scholar] [CrossRef]
  13. Allen, L.H.; Zhang, L.; Boote, K.J.; Hauser, B.A. Elevated temperature intensity, timing, and duration of exposure affect soybean internode elongation, mainstem node number, and pod number per plant. Crop. J. 2018, 6, 148–161. [Google Scholar] [CrossRef]
  14. Djanaguiraman, M.; Prasad, P.V.V.; Schapaugh, W.T. High day- or nighttime temperature alters leaf assimilation, reproductive success, and phosphatidic acid of pollen grain in soybean [Glycine max (L.) Merr.]. Crop. Sci. 2013, 53, 1594–1604. [Google Scholar] [CrossRef]
  15. Ruiz-Vera, U.M.; Siebers, M.; Gray, S.B.; Drag, D.W.; Rosenthal, D.M.; Kimball, B.A.; Ort, D.R.; Bernacchi, C.J. Global warming can negate the expected CO2 stimulation in photosynthesis and productivity for soybean grown in the Midwestern United States. Plant. Physiol. 2013, 162, 410–423. [Google Scholar] [CrossRef] [PubMed] [Green Version]
  16. Booker, F.L.; Reid, C.D.; Brunschön-Harti, S.; Fiscus, E.L.; Miller, J.E. Photosynthesis and photorespiration in soybean [Glycine max (L.) Merr.] chronically exposed to elevated carbon dioxide and ozone. J. Exp. Bot. 1997, 48, 1843–1852. [Google Scholar] [CrossRef] [Green Version]
  17. Koti, S.; Reddy, K.R.; Reddy, V.R.; Kakani, V.G.; Zhao, D. Interactive effects of carbon dioxide, temperature, and ultraviolet-B radiation on soybean (Glycine max L.) flower and pollen morphology, pollen production, germination, and tube lengths. J. Exp. Bot. 2005, 56, 725–736. [Google Scholar] [CrossRef] [Green Version]
  18. Kumagai, E.; Sameshima, R. Genotypic differences in soybean yield responses to increasing temperature in a cool climate are related to maturity group. Agric. For. Meteorol. 2014, 198, 265–272. [Google Scholar] [CrossRef]
  19. Thomas, J.M.G.; Boote, K.J.; Pan, D.; Allen, L.H. Elevated temperature delays onset of reproductive growth and reduces seed growth rate of soybean. J. Agro Crop Sci. 2010, 1, 19–32. [Google Scholar]
  20. Nico, M.; Mantese, A.I.; Miralles, D.J.; Kantolic, A.G. Soybean fruit development and set at the node level under combined photoperiod and radiation conditions. J. Exp. Bot. 2016, 67, 365–377. [Google Scholar] [CrossRef] [Green Version]
  21. Brevedan, R.E.; Egli, D.B.; Leggett, J.E. Influence of N nutrition on flower and pod abortion and yield of soybeans. Agron. J. 1978, 70, 81–84. [Google Scholar] [CrossRef]
  22. Oko, B.F.D.; Eneji, A.E.; Binang, W.; Irshad, M.; Yamamoto, S.; Honna, T.; Endo, T. Effect of foliar application of urea on reproductive abscission and grain yield of soybean. J. Plant. Nutr. 2003, 26, 1223–1234. [Google Scholar] [CrossRef]
  23. Bao, Y.; Hoogenboom, G.; McClendon, R.W.; Paz, J.O. Potential adaptation strategies for rainfed soybean production in the south-eastern USA under climate change based on the CSM-CROPGRO-Soybean model. J. Agric. Sci. 2015, 153, 798–824. [Google Scholar] [CrossRef]
  24. Battisti, R.; Sentelhas, P.C.; Boote, K.J.; Gil, G.M.; Farias, J.R.B.; Basso, C.J. Assessment of soybean yield with altered water-related genetic improvement traits under climate change in Southern Brazil. Eur. J. Agron. 2017, 83, 1–14. [Google Scholar] [CrossRef]
  25. Egli, D.B. Pod set in soybean: Investigations with SOYPODP, a whole plant model. Agron. J. 2015, 107, 349–360. [Google Scholar] [CrossRef]
  26. Chen, G.; Wiatrak, P. Soybean development and yield are influenced by planting date and environmental conditions in the southeastern coastal plain, United States. Agron. J. 2010, 102, 1731–1737. [Google Scholar] [CrossRef]
  27. Summerfield, R.J.; Asumadu, H.; Ellis, R.H.; Qi, A. Characterization of the photoperiodic response of post-flowering development in maturity isolines of soyabean [Glycine max (L.) Merrill] ‘Clark’. Ann. Bot. 1998, 82, 765–771. [Google Scholar] [CrossRef] [Green Version]
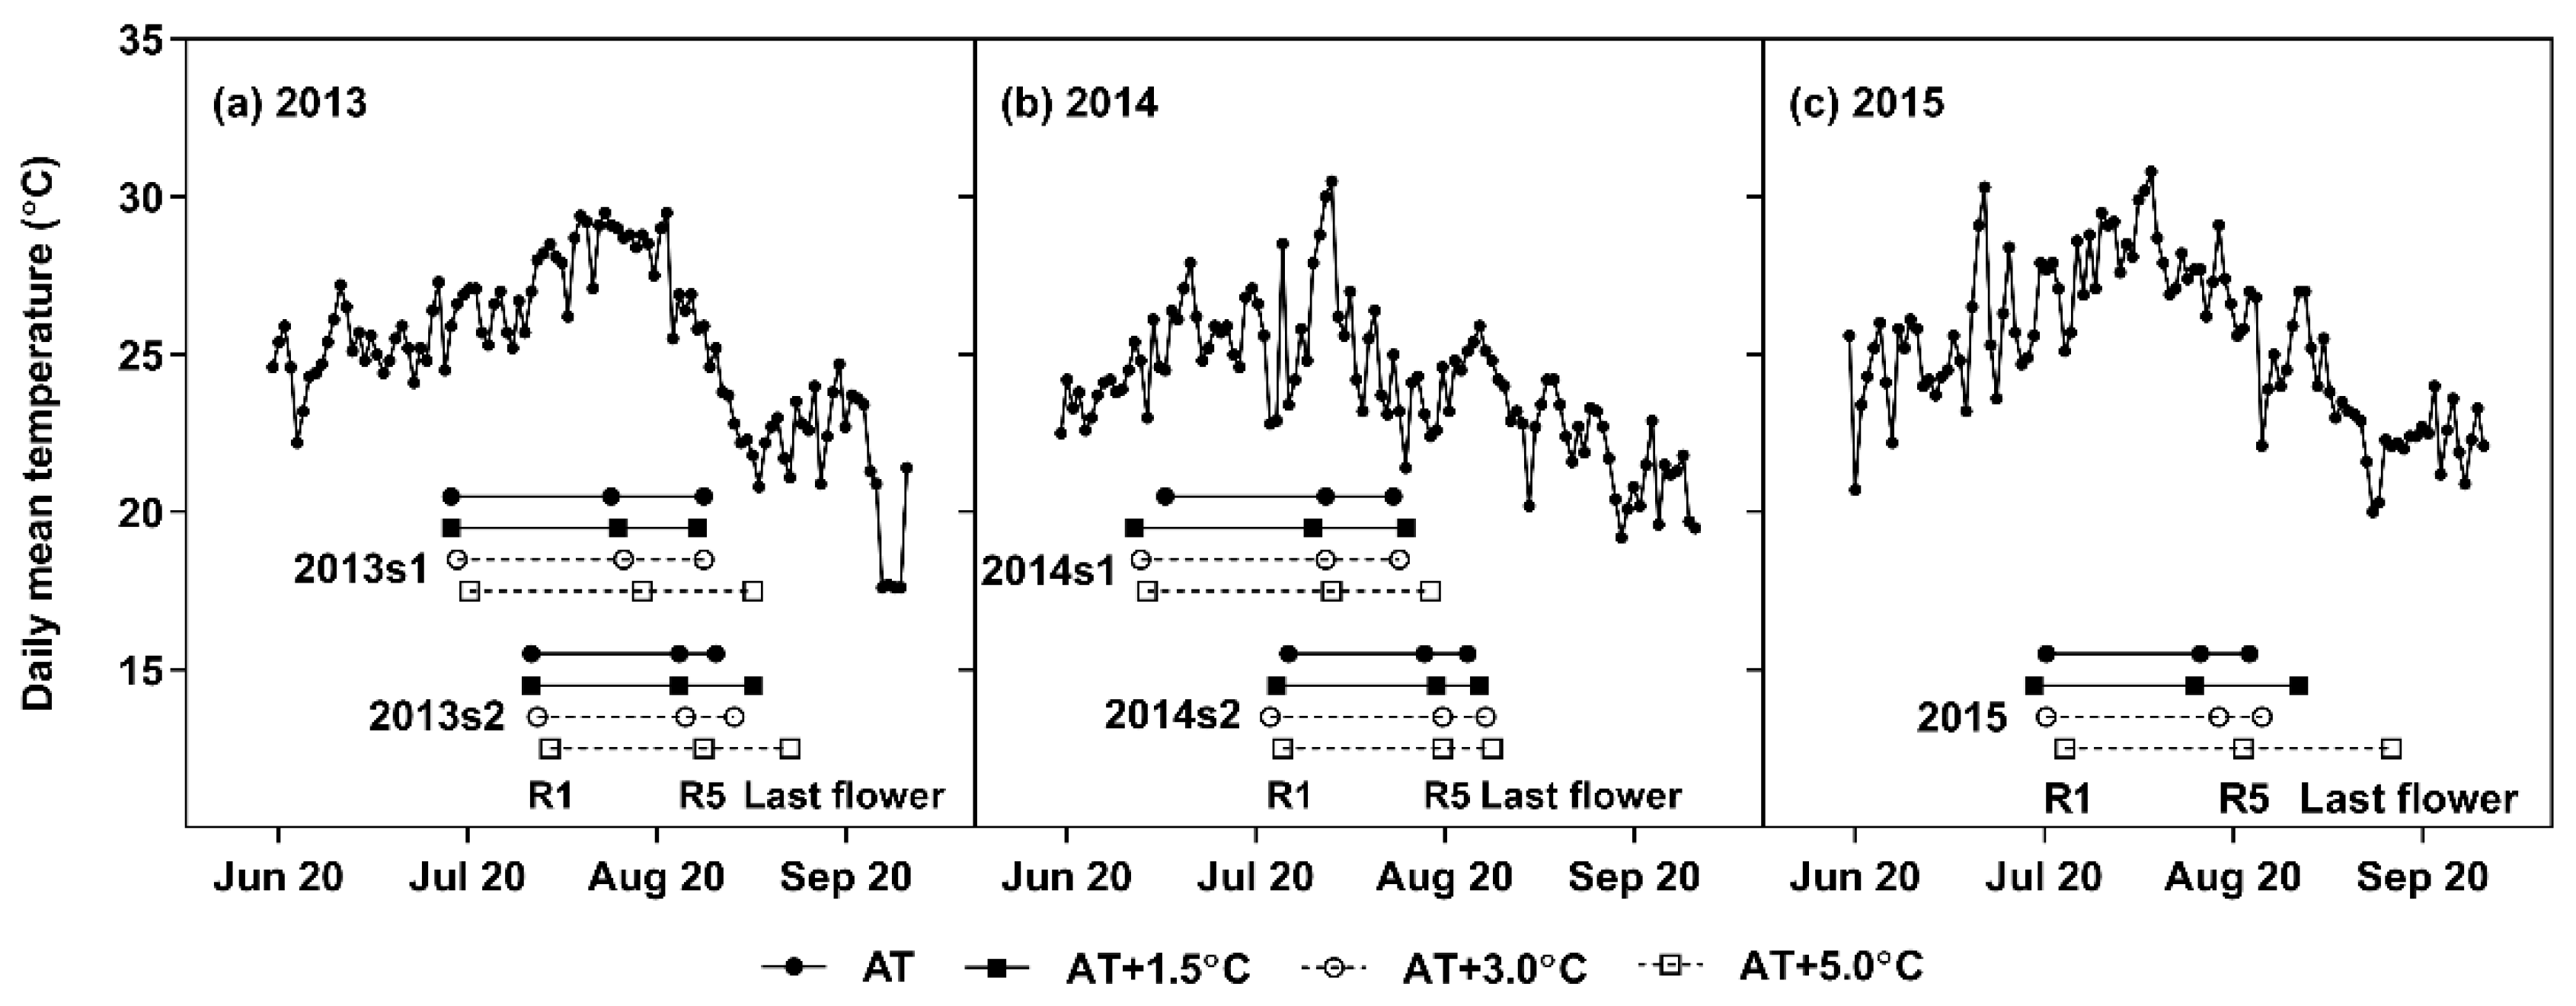
Figure 1. Daily mean temperatures under ambient temperature (AT) treatment in 2013 (a), 2014 (b), and 2015 (c). Horizontal bars represent the reproductive stages for each temperature treatment and growing season: R1 (first symbol), R5 (second symbol), and last flowering (third symbol).
Agronomy 10 00414 g001
Figure 2. Temporal patterns of flowering for ambient temperature (AT) (a, e, i, m, q), AT + 1.5 °C (b, f, j, n, r), AT + 3.0 °C (c, g, k, o, s), and AT + 5.0 °C (d, h, l, p, t) in 2013s1 (ad), 2013s2 (eh), 2014s1 (il), 2014s2 (mp), and 2015 (qt) along with the bimodal model equations. The table in each graph represents the estimates (Est) of parameters (Parm).
Agronomy 10 00414 g002
Table 1. Regression model for the flowering duration in response to temperature and sowing date.
ParameterEstimateS.E.
Intercept55.9 ***12.4
T R1–R52.12 ***0.33
DOYsowing−0.47 ***0.07
R20.81 ***
Trange25.3–32.4
TR1–R5: average daily mean temperature (°C) during R1–R5, DOYsowing: sowing date (day-of-year), Trange: TR1–R5 range of data-set used to fit the model, S.E.: the standard error of parameter estimate. *** represents significance at p < 0.001.
Table 2. Regression models for pod number, pod-set ratio, and flower number in response to temperature.
ParameterPod Number (Plant−1)Pod-Set Ratio (%)Flower Number (Plant−1)
EstimateS.E.EstimateS.E.EstimateS.E.
Intercept−1507.9 **379.8−618.7 **148.4−380.5 ***88.9
TR1–R5108.45 **26.0150.32 ***10.1618.83 ***2.97
TR1–R52−1.84 **0.44−0.94 ***0.17
R20.94 ***0.96 ***0.88 ***
Topt29.426.9
Trange25.3–32.425.3–32.425.3–32.4
TR1–R5: the average daily mean temperature (°C) during R1–R5, TR1–R52: the quadratic effect of TR1–R5, Topt: estimated optimum temperature (°C) for pod number and pod-set ratio, Trange: TR1–R5 range of data-set used to fit model, S.E.: standard error of parameter estimate. Fixed effects of experiments are not included in the table. ** and *** represent significance at p < 0.01 and p < 0.001, respectively.
Table 3. Regression models for the pod number, pod-set ratio, and flower number of the early- and late-opened-flowers in response to temperature.
ParameterEarlyLate
Pod Number (Plant−1)Pod-Set Ratio (%)Flower Number (Plant−1)Pod Number (Plant−1)Pod-Set Ratio (%)Flower Number (Plant−1)
EstimateS.E.EstimateS.E.EstimateS.E.EstimateS.E.EstimateS.E.EstimateS.E.
Intercept227.1 **12.6291.6 *42.281.3 ns72.8−31.1 ns18.6−33.6 ns22.7−463.1 **111.8
TR1–R5−6.75 **0.42−8.80 *1.400.86 ns2.431.09 ns0.621.26 ns0.7518.02 ***3.74
R20.99 **0.95 *0.48 ns0.61 ns0.58 ns0.79 **
Trange28.1–32.428.1–32.426.0–32.428.1–32.428.1–32.426.0–32.4
TR1–R5: the average daily mean temperature (°C) during R1–R5, Trange: TR1–R5 range of data-set used to fit model, S.E.: standard error of parameter estimate. Fixed effects of experiments are not included in the table. *, **, ***, and ns represent significance at p < 0.05, p < 0.01, p < 0.001, and not significant, respectively.