Abstract
Peach (Prunus persica (L.) Batsch) is one of the most produced and studied stone fruits. Many genetic and genomic resources are available for this species, including a high-quality genome. More recently, a new high-density Illumina peach Single Nucleotide Polymorphism (SNP) chip (9+9K) has been developed by an international consortium as an add-on to the previous 9K array. In the current study, this new array was used to study the genetic diversity and population structure of the National Peach Germplasm Collection of the Agrifood Research and Technology Centre of Aragon (CITA), located in Zaragoza (northern Spain). To accomplish this, 90 peach accessions were genotyped using the new peach SNP chip (9+9K). A total of 9796 SNPs were finally selected for genetic analyses. Through Identity-By-Descent (IBD) estimate analysis, 15 different groups with genetically identical individuals were identified. The genetic diversity and population structure elucidated a possible exchange of germplasm material among regions, mainly in the northern regions of Spain. This study will allow for more efficient management of the National Peach Germplasm Collection by classifying valuable individuals for genetic diversity preservation and will benefit forthcoming Genome-Wide Association Studies (GWAS) of commercially important fruit traits in peach.
1. Introduction
Peach (Prunus persica (L.) Batsch), a model plant within the Rosaceae family, is self-compatible and has a 2–4 year juvenile period. Due to its relatively small genome size (230 Mb) [1] and low ploidy level (2n = 2x = 16), the genetic control of key agronomical traits is better understood for peach than for other Prunus species. Globally, peach production amounts to 25 million tons per year, half of which are produced in China, followed by Spain, Italy and Greece [2]. Peach spread from China to the rest of the temperate and subtropical cultivation regions around 7500 to 4000 years ago [3,4]. The spread of peach to different cultivation regions in Persia, the Mediterranean countries, and America led to an initially high genetic diversity within the species. The successful activity of many breeding programs around the world has led to the release of more than 1000 new cultivars in the last century. However, the promotion of commercial cultivars that have a common and limited ancestry in breeding programs, together with high self-compatibility, has resulted in increased homozygosity and has therefore reduced the genetic diversity in peach populations [5]. The loss of genetic diversity negatively affects reproductive fitness, and thus the adaptive potential of the species [6].
To cope with this issue, germplasm banks are fundamental in preserving genetic diversity and avoiding gene loss. Genetically diverse germplasm can provide useful genes for enhancing pest resistance and disease tolerance and for breeding cultivars with new fruit quality traits and improved postharvest shelf-life [7,8,9,10]. Effective utilization of Prunus accessions in breeding programs requires precise and unambiguous characterization. This is essential for the detection of synonymies, identical individuals with different names, and homonymies, nonidentical individuals with the same name. Knowledge of the genetic diversity and phylogenetic relationships among cultivated and wild Prunus species is necessary to detect gene pools, organize germplasm collections, and to manage plant material effectively [11,12].
In the last decade, Single Nucleotide Polymorphisms (SNPs) have become the preferred markers in molecular genetics due to their high frequency in genomes and high-throughput detection, using various approaches and platforms [13]. For Prunus species, the availability of the peach genome has made it possible to physically position SNPs identified in peach through Next-Generation Sequencing (NGS). SNP arrays can be used to assist breeding processes, such as in deducing the pedigree and parentage of selected individuals, in determining the heritability and breeding values of key agronomical traits, and in generating high-density linkage maps that make it possible to identify Quantitative Trait Loci (QTL) [14] and candidate genes associated with such traits. The first 9K SNP array version developed in peach led to diverse association studies [15,16,17,18,19] and the generation of high-density maps [20].
Diversity in Prunus species germplasm banks has been studied by microsatellites or Simple Sequence Repeats (SSRs) [5,11,21,22,23,24,25,26]. Some of these studies have led to the molecular characterization of local and foreign cultivars in Spain [11,21,27] and demonstrated that Chinese landraces have maintained the highest genetic variability and low linkage disequilibrium [5]. However, SNPs are more frequent than SSRs, which makes them more helpful for polymorphism detection within specific genes. Diverse automated genotyping methods [13] and specific tools for correcting genotyping errors in pedigreed germplasm are available [28]. Recently, Guajardo et al. [12] explored the genetic diversity of Prunus rootstocks by Genotyping-By-Sequencing (GBS) and identified common markers between the RosBREED cherry 6K SNP array [29] and the International Rosaceae SNP Consortium (IRSC) 9K peach SNP array [30].
The usefulness of SNP sets for the study of genetic diversity and population structure has been proven in different Prunus species. The 9K SNP peach array was used to genotype European and Chinese peach germplasm collections, revealing a subdivision into three main populations: Occidental cultivars from breeding programs, Occidental landraces, and Oriental accessions [8]. The Brazilian breeding germplasm was genotyped by means of a GBS approach, and three main subpopulations were discovered [31]. Sequencing a group of Occidental peach varieties showed reduced variability levels, with an average of one SNP every 598 bps and one indel every 4189 bps [32]. Genetic diversity analysis through SNP detection using RAD-seq on the whole genome was assessed in apricot and showed a decrease in genetic diversity during the domestication process [33]. Although the Spanish National Peach Germplasm Collection at CITA has been studied and genetically characterized with SSR markers [11,34], it has never been characterized with a set of SNP markers.
Here, we describe one of the first works with the IRSC Peach 9+9K SNP chip array (https://www.rosaceae.org/Analysis/431, accessed on 15 January 2021), which has been used to genotype a representative sample of the National Peach Germplasm Collection of the Agrifood Research and Technology Centre of Aragon (CITA), located in Zaragoza (Spain). The main goal of this study was a deep genetic characterization of this collection, describing the population structure and its relationship with geographic origin and fruit typology.
2. Materials and Methods
2.1. Plant Material and DNA Extraction
Ninety accessions of Prunus persica (L.) Batsch from the National Peach Germplasm Collection at CITA were chosen. The germplasm collection was established in Zaragoza (northeast Spain; latitude 41 43 42.7 N, longitude 0 48 44.1 W), and the trees were grafted onto the ‘GF 677’ rootstock. Among the 90 accessions, 84 were Spanish and 6 were foreign (‘Andora’ (two replicates), ‘Vivian’ and ‘Aurelio’ from USA, ‘Pepita’ from Brazil, and ‘Aniversario’ from Argentina). The Spanish accessions came from different regions located in the Ebro Valley and/or northeast Spain (Zaragoza (28), Lleida (13), Huesca (12), Navarra (9), Teruel (2), and La Rioja (1)) and two regions in southeast Spain (Murcia (18) and Valencia (1)). The sample list also includes two replicates from ‘Blanco Tardío’, two accessions named ‘La Escola’, and two accessions named ‘Paraguayo Almudí’, but with different IDs. The list included round and flat cultivars with yellow or white flesh (see Supplementary Table S1A for details about the ID, origin, and fruit typology of the accessions). Genomic DNA was extracted from leaf tissue as described by Doyle and Doyle [35]. The samples were quality tested and quantitated using a NanoDrop 2000 spectrophotometer (Thermo Fisher Scientific, Wilmington, DE, USA) and Qubit (Thermo Fisher Scientific, Wilmington, DE, USA), respectively.
2.2. Genotyping
DNA samples were genotyped with the new version of the high-density Illumina peach SNP chip (9+9K) [36], using an iScan at the “Centro de Investigación en Agrigenómica” (CRAG) in Barcelona (Spain). Genotype calls for each SNP were obtained using the iScan output data in the Genotyping Analysis Module of GenomeStudio v2.0.5. (Illumina Inc., San Diego, CA, USA) with the Gen Call Threshold established at 0.15. SNPs were filtered with the software ASSIsT v1.02 [37] to obtain a subset of reliable SNPs, establishing a Frequency Rare Allele value of 0.05. SNPs within the category “ShiftedHomo”, discarded by ASSIsT, were explored to recover some manually using the “SNP Graph” in GenomeStudio (Supplementary Table S1B). For that, Mendelian segregation and Mendelian-inconsistent errors were checked [28] using a F1 full-sib family as reference, which was also genotyped with this array (data not shown). The SNPs approved by ASSIsT and those manually recovered were used as the reliable subset of SNPs for this study.
2.3. Identification of Duplicated Individuals
PLINK v.1.90 software [38] was used to detect clones using genotype data to provide an estimate of pairwise Identity-By-Descent (IBD). Input files used by PLINK were generated in GenomeStudio by “PLINK Input Report Plug-in v2.1.4” using the final subset of SNPs only. Pairs of individuals with an IBD of 100% were considered clones. Additionally, several fruit traits, such as harvest date, skin color, percentage of blush, blush color, flesh color, flesh texture, fruit weight, stone adhesion (free or cling-stone), soluble solids content (SSC) (expressed in °Brix), pH, and titratable acidity (TA) (expressed in g malic acid/L) were measured in 2019 and 2020 in the germplasm collection to complement the genotypic characterization. The clones detected through PLINK were excluded from the subsequent analysis, with only one individual per group retained.
2.4. Genetic Diversity Analysis
The genetic diversity analysis was performed by measuring the fixation index (FST), gST, and DJost of the total of the accessions, and the Allelic Richness (Ar), Observed Heterozygosity (Ho) and Expected Heterozygosity (He) of the populations. These measures were obtained using the “basicStats” function of the DiveRsity v.1.9.90 package of R [39]. Moreover, the pairwise FST, gST, and DJost values among the identified populations were calculated using the “diffCalc” function. For these analyses, only the reliable SNP subset was used, and only Spanish populations were analyzed, excluding those with only one individual. Finally, the inbreeding coefficients of all the individuals were calculated by specifying the flag “--het” in PLINK.
2.5. Genetic Structure Analysis
Linkage Disequilibrium (LD) could modify the genetic structure analysis. For this reason, the reliable SNP subset was pruned for LD in PLINK using the command “--indep-pairwise”. The parameters were as follows: a window size of 50 SNPs, 5 SNPs to shift the window at each step, and an r2 threshold of 0.2. Genetic structure analysis was conducted with fastStructure v.1.0 [40]. Clusters (K) were set from 1 to 10. For the choice of the most likely K, “chooseK.py” script was used.
The total 90 accessions and the LD-pruned SNP subset were used to carry out a Principal Component Analysis (PCA) using the SNPRelate v.1.24.0 package in R [41], and to complement the structure analysis obtained in fastStructure. PCA results were plotted using the ggplot v.3.3.3 R package [42].
3. Results
3.1. Characterization and Selection of SNPs
A total of 16,038 SNPs were scored in GenomeStudio (iScan data of the remaining 1962 SNPs were not received). ASSIsT determined 8954 SNPs as approved (55.83%) (Table 1), and 3247 of them (20.25%) were flagged as robust. In addition, for 2779 SNPs (17.33%), one of the homozygous genotypes was present only in 5% or less individuals, and 2928 SNPs (18.26%) were described as distorted and as having an unexpected segregation. Within the set of discarded SNPs (7083, 44.17%), 2724 were monomorphic and 1018 failed; for 3174 SNPs, one of the homozygous genotypes was absent in our population (ShiftedHomo). Moreover, 842 SNPs (5.25%) from the “ShiftedHomo” category were manually recovered in GenomeStudio. Therefore, a final subset of 9796 SNPs (61.08%) was selected to perform the following analyses (see Supplementary Table S1B for SNP classification done in ASSIsT).

Table 1.
Classification of Single Nucleotide Polymorphisms (SNPs) using ASSIsT.
3.2. Identification of Duplicates and Labeling Errors
Among the 90 accessions, the results obtained with PLINK identified 44 accessions included in 15 different groups of genetically identical individuals or clones (Table 2). The groups contained two to six genetically identical individuals. The estimated IBD was 100% within each group (see Supplementary Table S1F for PLINK results). Genotypic differences were found, however, within the clone group 10 (‘Escolapio’ and ‘Zaragozano’). PLINK analysis provided a pairwise IBD value of 100% (PI_HAT = 1) between these two accessions, but an IBS distance of 95.30%. A different genotype was detected in 462 markers for ‘Escolapio’ and ‘Zaragozano’, and in 458 of these markers, no alleles were shared between the two accessions. These markers were distributed across chromosomes; there were 77 in chromosome 1, 3 in chromosome 2, 94 in chromosome 3, 286 in chromosome 6 and 2 in chromosome 8 (Supplementary Table S1D and Figure 1). In our sample list, the two pairs of replicates were confirmed as identical. On the other hand, two pairs of homonymies were detected: ‘Paraguayo Almudí’ (5138) and ‘Paraguayo Almudí’ (5139) were genetically different (PI_HAT = 0.5), as were the two accessions named ‘La Escola’ (5093 and 5340) (PI_HAT = 0).
Table 2.
Clones detected through Identity-By-Descent (IBD) analysis in Plink.
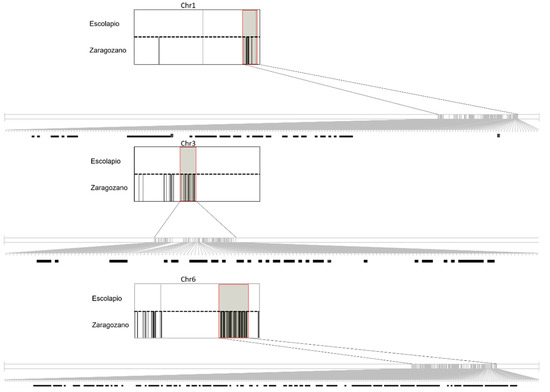
Figure 1.
Representation of genotype differences found in chromosomes 1, 3, and 6 between ‘Escolapio’ and ‘Zaragozano’ accessions represented by Flapjack software [43]. The rectangle represents whole chromosomes of both accessions, separated by dotted lines. A black line means that a different genotype was observed between both accessions, while white means the same genotype. Regions with high genotype differences were zoomed in and highlighted by a red rectangle.
The phenotypic data recorded in 2019 and 2020 (Supplementary Table S1C) showed that clones in group 1 shared the same fruit traits. Similar characteristics were also observed for clones in group 5 and in group 13. The rest of the groups showed some phenotypic intragroup differences, although these differences happened either in one year only (clone groups 2, 3, 11, 12) or in both years but in different individuals each year (clone groups 4, 6, 7, 8, 10, 15). Group 9 (‘Sunmel 1’ and ‘Sunmel 2’) showed the same difference in the harvest date for both years (‘Sunmel 1’ was 19 and 20 days earlier than ‘Sunmel 2’ in 2019 and 2020, respectively). Similarly, group 14 (‘Tambarría B.D.’ and ‘Rojo de Tudela’) showed differences in the harvest date in both years (‘Tambarría B.D.’ was 10 and 24 days earlier than ‘Rojo de Tudela’ in 2019 and 2020, respectively). The phenotypic traits with considerable differences within clone groups were harvest date, percentage of blush, soluble solid content (SSC), and titratable acidity (TA). The maximum difference in harvest day was 24 days in clone group 14 in 2020. Considerable differences in the blush percentage were detected in clone groups 4, 8, 9, and 15. The maximum difference in SSC was 4 °Brix in clone group 4, and the maximum difference in the TA was 0.436 g malic acid/L in clone group 9.
3.3. Genetic Diversity Analysis
The average values of observed heterozygosity (Ho) and expected heterozygosity (He) were 0.197 and 0.253, respectively, but the level of genetic diversity varied among peach populations according to their origin (Table 3).
Table 3.
Genetic diversity measures per population Allelic Richness (Ar), Observed Heterozygosity (Ho), Expected Heterozygosity (He), and inbreeding coefficient per population (FIS) obtained with the DiveRsity package.
The highest allelic richness (Ar) among the populations was observed in the Lleida population (1.543), while Navarra showed the lowest (1.295) (Table 3). This fact indicates that in the Lleida accessions, we can find the two possible alleles in a major number of loci, unlike in other populations. Regarding Ho, Lleida and Murcia showed the highest values (0.285 and 0.234, respectively) and Navarra the lowest (0.081) (Table 3). Therefore, the percentage of heterozygotes for the different loci in Lleida and Murcia is greater than in the rest of populations. The He values ranged from 0.209 in Teruel to 0.312 in Lleida (Table 3). The inbreeding coefficient (FIS) per population showed the highest value in Navarra (0.598) and the lowest in Teruel (−0.142).
The values of the pairwise analysis of the fixation index (FST) determined that the region of Murcia region is the most genetically different with respect to the rest of the populations (Table 4). The values of pairwise FST ranged from 0.111 in Murcia–Teruel to −0.052 in Teruel–Zaragoza. Moderate differentiation was detected between Murcia and Teruel, and between Navarra and Huesca. Regarding gST, values ranged from 0.072 for Murcia–Navarra to −0.003 for Zaragoza–Lleida. The pairwise values for gST follow the same trend as the FST values, identifying Murcia as the population with higher genetic differentiation from the rest of the populations. Similar results were obtained for DJost, indicating a higher presence of private alleles in the Murcia population. The highest DJost values were detected for Navarra–Murcia (0.008) and Navarra–Lleida (0.004). Additionally, pairwise analysis was carried out including the clones detected by PLINK. The differentiation values obtained were notably higher than without clones, and Murcia–Teruel was the pair with the highest FST value (0.235, data not shown). Murcia and Navarra showed the highest gST differentiation (0.106), whereas the highest DJost value (0.015) was obtained between Huesca and Murcia.
Table 4.
Genetic differentiation pairwise analysis.
Global genetic diversity values for the entire group of accessions were calculated (Table 5). An FST value of 0.011 indicates that only 1.1% of the existing genetic variability is related to interpopulation differences. This fact indicates low genetic differentiation among the different geographic populations. The same low differentiation is shown by DJost and gST values (0.003 and 0.040, respectively). Moreover, FIT and FIS values showed moderate global inbreeding (0.309 and 0.262, respectively).
Table 5.
Global genetic differentiation values.
The highest inbreeding coefficient of the 90 accessions was obtained for ‘Calanda Sonrosado’ (0.991) and the lowest for ‘Paraguayo Niqui’ (−0.964) (Supplementary Table S1E). The inbreeding coefficient average in the total population was 0.290. A total of 13 individuals had more than 9700 homozygous SNPs showing inbreeding values higher than 0.980.
3.4. Genetic Structure Analysis
The genetic structure of the accessions, excluding the duplicates, was analyzed using fastStructure. Previously, the subset of reliable SNPs was pruned, and a final dataset of 324 pruned SNPs was used in the genetic structure analysis. The results of the chooseK.py script showed K = 3 as the best option (marginal likelihood = −1.009), but K = 7 (marginal likelihood = −1.015) was selected to provide the best explanation of the genetic structure (Figure 2 and Figure 3).
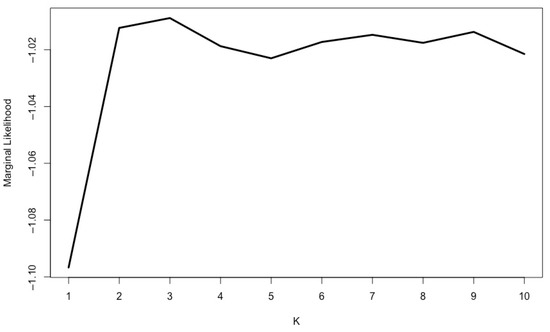
Figure 2.
The most likely K clusters obtained in fastStructure.
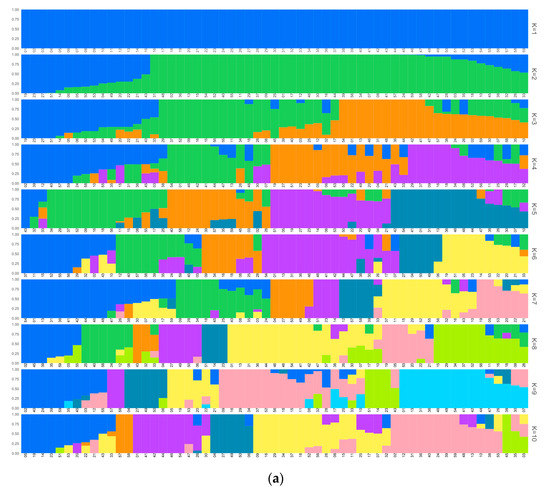
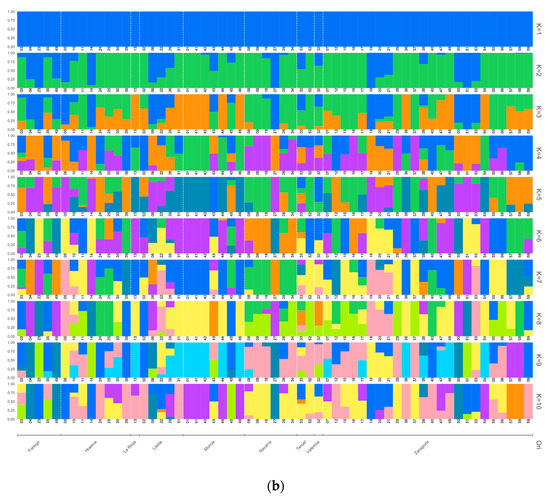
Figure 3.
Structure results for k = 1 to k = 10 of the accessions excluding the duplicates: (a) placed according to cluster order; (b) placed according to geographic origin. The ID numbers can be found in Supplementary Table S1A.
Following the criteria of assigning an individual to the cluster of its maximum estimated membership coefficient value, the size of the cluster ranged from 3 to 18 individuals (Figure 4). Cluster 1 was the largest one (18 individuals) and was composed of ‘Maruja’ (clone group 4 and 6), ‘Jerónimo’ (except ‘Jerónimo Espuña’) (clone group 4), and ‘Calabacero’ (clone group 1) accessions from the Murcia region and another 13 accessions from the north of Spain. Among these accessions from the north, the group formed by ‘Duraznillo 42B’, ‘Generoso’, ‘Sudanell 1’ (2211 AD), Miraflores accessions (clone group 3), and the clonal group 11 (formed by Sudanell cultivars and ‘La Escola’ (5340)) showed a high membership coefficient (0.999). Cluster 2 was composed of some northern Spanish accessions, mainly from Navarra, ‘Jerónimo Espuña’ from Murcia, and ‘Andora’ and ‘Vivian’ (5266) from USA. Cluster 3 was composed of two foreign nectarine accessions (‘Aniversario’ from Argentina and ‘Aurelio’ from USA) and three peach accessions from the north of Spain (‘Blanco Tardío’, ‘Rojo de Azagra’, and ‘Buisan’). All the accessions within cluster 3 had melting flesh, except for ‘Rojo de Azagra’. Cluster 4 was made up of ‘Pepita’ from Brazil, ‘Amarillo Temprano (Ebro)’ from Zaragoza, and ‘La Escola’ (5093) from Lleida. Cluster 5 was composed of three accessions from Zaragoza (‘Gallur’, ‘Pavía Amarilla de Tolosa’, and ‘Pavía Blanca’), one accession from Navarra (‘Campiel M. de Cierzo’), and one accession from Teruel (‘Valdeltormo B.D.’), although this last accession showed a similar membership coefficient with another three different clusters (clusters 4, 6, and 7). Cluster 6 was mainly formed by accessions from the north of Spain, although the accessions ‘Utiel BD’ from Valencia and ‘Brasileño Elipe’ from Murcia showed a considerable membership coefficient with this cluster (0.652 and 0.542, respectively). All of the flat peaches in the study, accompanied by ‘Montaced (Binaced)’ and the clonal group 15 (‘Borracho de Jarque’, ‘Comodin’, and ‘Moret’), formed cluster 7.
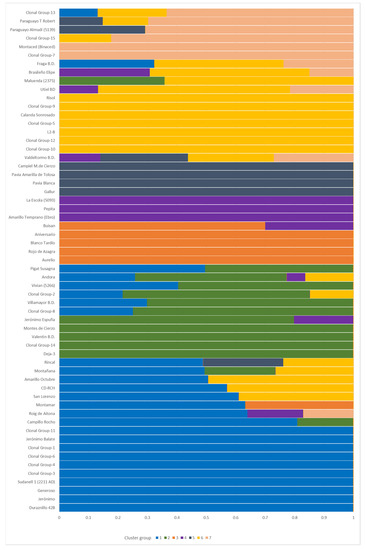
Figure 4.
A more detailed representation of the genetic structure obtained in fastStructure (k = 7). The x-axis represents the membership coefficient.
Considering a threshold of 0.8 for the individual admixture coefficient, a high level of admixture was observed, with 23 (39.98%) admixed accessions. In order to study the intracluster and intercluster distances and the specific case of ‘Escolapio’ (5231) and ‘Zaragozano’ (5004), a PCA analysis was carried out including the 90 accessions (Supplementary Figure S1). The pruning process including the 90 individuals resulted in 308 pruned SNPs, which indicates a loss of 16 SNPs compared to the 324 pruned SNPs obtained with 59 individuals (only one clone per group). The first two PCs explained 31.9% of the cumulative variation (PC1 accounted for 22.9% and PC2 for 9%). The scatterplot shows that PC1 mainly separates flat-fruit cultivars and most nectarine genotypes from the rest of the round peaches, with a high separation of flat cultivars from clone group 7 (ID 5138, 5143, 5259). PC2 clearly separates cluster 6 (formed by northern accessions), mainly from cluster 1 (formed by southern accessions), and in general separates the different clusters from one another. Overall, the PCA shows high agreement with the clustering analysis. In addition, ‘Escolapio’ (5231) and ‘Zaragozano’ (5004) were positioned in the right upper corner, although close to the ‘Rojo del Rito’ clone group (clone group 5), which indicates considerable differentiation compared to the rest of the accessions.
4. Discussion
The availability of the new SNP (9+9K) array allowed us to analyze in-depth the genome-wide allelic variation present in the accessions belonging to the National Peach (Prunus persica) Germplasm Collection at CITA (Spain). To our knowledge, this is the first time this array has been used to genotype a large collection of peach accessions. The new array has made it possible obtain 3–4K more SNPs than the previous 9K array [8,28,30]. As has been suggested in other species [44], SNP arrays seem to be a key control element for the fingerprinting of varieties and their introduction into germplasm collections.
4.1. SNP Genotyping, Identification of Duplicates and Labeling Errors
The high resolution provided by the new SNP array allowed for improved genetic characterization of the accessions of this collection, some of which have turned out to be identical or cloned samples and/or possibly labeling errors. Lack of genetic differences among samples could be due to lack of SNPs in the array from specific regions of the peach genome, although the amount of markers used in this study is clearly higher than in previous studies [8]. Some of the clones detected in the present study have been characterized previously with SSRs [11,21,24,26,27,34]. The clone groups detected here (clone groups 1, 2, 4, 5, 6, 7, 8, 10, 13) are in agreement with the genetic proximity observed in previous works, in which small differences in one or two markers, genetically close, were observed. For other groups of clones (clone groups 12, 14, 15), considerable differences were observed, as described below.
Regarding clone group 12, the accessions ‘Fulla’ and ‘Rojo Amarillo Septiembre’ were placed genetically far away in a previous neighbor-joining dendrogram by Pérez et al. [34] using a set of 10 SSR markers. However, both accessions had a high admixture coefficient for the same cluster in their population structure analysis. Contrarily, Wünsch et al. [24], using the same set of SSR markers, established ‘Fulla’ and ‘Rojo Amarillo Septiembre’ as synonymies. In addition to the different pool of samples studied by these authors, which can influence the dendogram results, this disagreement might be caused by the different methodology (agarose gel electrophoresis vs. capillary electrophoresis) used in both studies. In a different study also using SSR markers, Bouhadida et al. [11] found results similar to ours, identifying ‘Pigat’ and ‘Rojo Amarillo Septiembre’ as genetically close accessions. Our phenotypic records have not shown considerable differences among the three members of the clone group 12 in terms of harvest time and fruit traits, which may indicate that if the genotype differences found by Pérez et al. [34] really exist, these changes can occur in noncoding regions and do not influence gene expression and fruit phenotype.
On the other hand, regarding clone group 14, previous works have placed ‘Rojo de Tudela’ and ‘Tambarría B.D.’ in different subgroups, with a long distance between the two accessions [24,34]. In our study, ‘Tambarría B.D.’ showed an earlier harvest date than ‘Rojo de Tudela’ in both years, with some variability between years. In addition, a different fruit flesh color was observed between both accessions: ‘Tambarría B.D.’ was white-fleshed and ‘Rojo de Tudela’ yellow-fleshed. The accumulation of carotenoids in chromoplasts causes the yellow-flesh color, and the disruption of the ccd4 functional allele prevents carotenoid degradation, resulting in white flesh in peach [45,46]. However, three distinct mutational mechanisms have also been detected as the possible origin of yellow flesh in peach [46]. According to the alignment of an apple ccd4 mRNA [47], the physical position of this gene was between 25,639,600 to 25,641,440 bps [45]. In our final set of SNPs, 32 SNPs have a physical position between 25,545,000 and 26,317,783 bps but do not show any genotypic pattern for yellow and white flesh. To find a possible association, an association test between the whole set of SNPs and flesh color data was performed using the WGassociation function of the R package SNPassoc v2.0-2 [48]. Interestingly, no SNP showed complete association with the yellow-flesh trait only, so SNPs with the lowest p-value were associated with some yellow-flesh individuals, but not with others (data not shown). Similarly, Font i Forcada et al. [19] did not find any significant association with peach flesh color in their study of 43 native local Spanish accessions and 51 modern foreign cultivars with the IPSC 9K peach SNP array v1.0. A possible explanation for this result could be the fact that the ccd4 allele is not included in these arrays or that a different mutational mechanism could have occurred in the Spanish germplasm. Further analysis with a higher number of individuals may help to elucidate these results. These results indicate the importance of complementing genetic analysis with consistent phenotyping in order to detect possible misleading conclusions and the need for greater consensus in future SNP peach arrays to enrich future works.
‘Borracho de Jarque’, ‘Comodin’, and ‘Moret’ were identified for the first time as clones in clone group 15. Consistent results were reported by Alonso et al. [27], after analysis with a set of 16 SSRs, who defined these three accessions as very close genetically. However, other works have shown a large genetic distance between ‘Borracho de Jarque’ on the one hand and ‘Comodin’ and ‘Moret’ on the other hand [24,34]. Few phenotypic differences have been detected among the accessions of this clone group, such as a slightly higher percentage of blush in ‘Borracho de Jarque’, an old variety grown in small and mountainous area (‘Aranda’ Valley) with high altitudes in the Iberian System. This isolated origin could explain the low inbreeding value of this cultivar (−0.619), very unusual for Spanish nonmelting peach cultivars, which are traditionally obtained after the self-fertilization of heirloom cultivars [49,50]. This fact reinforced the clone detection results, discounting the possibility that these accessions were obtained after the self-pollination of a high homozygous peach genotype.
As described by Aranzana et al. [49] and Bouhadida et al. [26] after screening well-known peach sports, the presence of small discrepancies (of one or a few SSRs) between these sports was possible and was not enough to declare genetic dissimilarities. In the current study, the observed discrepancies between SNPs, which provide a broad image of the genome of the individuals, might not be enough to declare the nonclone status of some of the detected clones. Clearly, the ability of breeders and growers to select mutations with different phenotypic expressions, as in the case of ‘Tambarría B.D.’ and ‘Rojo de Tudela’, has helped to create a phenotypically diverse collection, even though the genetic differences are actually quite small. As previously described by Aranzana et al. [51], the presence of unique valuable germplasm is unfortunately scarce in this stone fruit crop species. The high number of synonymies found here, representing the same gene pool, clearly demonstrates this fact in the peach species and confirms the strong need for a complete genetic characterization of each germplasm collection.
In general, the phenotypic traits evaluated in the accessions were in complete agreement with the detection of duplicates, since most of the clones within a clone group shared similar phenotypic characteristics. Small differences in the phenotypic records were observed, but most were not consistent in both years of the study. Further study of the phenotypic traits will clarify whether the presence of variability in some clones is due to genetic differences, such as new mutations, or whether it has been caused by environmental effects. Somatic mutations are relatively frequent in tree species [52] and are an important source of discovery of new cultivars [26,50,53]. In grape, subsequent propagation through vegetative multiplication can explain how somatic mutations have accumulated in clones, causing genetic diversity [54,55]. Carrier et al. [54] detected transposable elements as the major cause of somatic polymorphism in this species. In apple, somatic mutations were observed in the bud sport yellow apple ‘Blondee’ (BLO) from ‘Kidd’s D-8’ (KID), the original name of apple cultivar ‘Gala’. This mutation clearly affects skin color, and, according to the authors, the methylation in the MdMYB10 promoter is likely the causal epigenetic mechanism for the mutation. In our study, the detected clones ‘Sunmel 1’ and ‘Sunmel 2’—with a PI_HAT of 1, a large number of similar genotypes (9796 SNPs), and a coefficient of inbreeding of 0.65—could elucidate a possible parent and sport relationship between these two accessions. Indeed, ‘Sunmel 1’ has an earlier harvest date (260), with a clear difference of 20 days from ‘Sunmel 2’ (280), observed in both years of records. Similar to the case of ‘Blondee’, a transcriptome analysis together with a whole-genome resequencing strategy using these four accessions (‘Sunmel 1’, ‘Sunmel 2’, ‘Tambarría B.D’, ‘Rojo de Tudela’) could improve our knowledge of the mechanisms underlying the harvest date trait in peach.
For the first time, high PI_HAT values (IBD 100%) were obtained between ‘Escolapio’ and ‘Zaragozano’; consequently, both accessions should be classified as synonyms or identical clones. More interestingly, and in contrast to the case of ‘Sunmel 1’ and ‘Sunmel 2’, we observed large genetic differences (462 different SNPs) between these two accessions, mainly in chromosome 6 (286 markers). According to Micheletti et al. [8], the distal end of chromosome 6 seems to be a particularly unstable region in the peach genome, with major rearrangements occurring frequently. Although those authors found a large amount of missing data in this region (between 38 and 60 SNPs with no data), they suggested that the phenotypic differences between an original cultivar and its sports may be caused by genes located in these unstable DNA fragments of chromosome 6. The possible hypothesis of a parental and its sport mutation relationship does not seem to be well supported in this case, due to the large number of hypothetical somatic mutations (426) and their distribution along five chromosomes. Accordingly, the study of the inbreeding coefficients (Supplementary Table S1E) showed high inbreeding values in ‘Zaragozano’ and ‘Escolapio’ (0.9859 in both). Only 41 SNPs from a total of 9796 are heterozygous in these two accessions. This high level of inbreeding may indicate that ‘Zaragozano’ and ‘Escolapio’ were obtained after the self-pollination of the same peach genotype. The differences found in these SNPs between both accessions would therefore come from heterozygous loci in the progenitor that segregated in ‘Zaragozano’ and ‘Escolapio’. Furthermore, PCA analysis showed a considerable distance between them and the rest of the accessions in general, which may indicate unique haploblocks in both compared to the total population. These unique haploblocks may explain the IBD estimate of 100%, despite the genotype differences found between ‘Escolapio’ and ‘Zaragozano’.
4.2. Genetic Diversity of the Accessions
The average heterozygosity (Ho = 0.197) in our study was lower than the Ho observed in breeding germplasm from the University of Florida reported by Chavez et al. [56] using SSRs, with an average value of 0.4. On the other hand, the values obtained here are closer to those obtained by Micheletti et al. [8] after genotyping 1240 peach accessions from different parts of the world, using the previous version of the peach SNP array, with a total of 4271 SNP markers. These authors obtained a Ho of 0.286. The use of biallelic SNP markers or the use of multiallelic SSRs could be the main reason for the discrepancies between these studies, which have also been observed in other species such as walnut or grape [57,58]. In the populations from Lleida, Huesca, Zaragoza, and, especially, Navarra, He was higher than Ho. This was probably due to the Wahlund effect, or, more likely in our case, to inbreeding. The Ho values were only higher than the He values in the case of Murcia and Lleida, which could suggest low inbreeding and large genetic variation. In the case of Lleida, these findings are probably due to the small sample size from this region within the collection analyzed. Increasing the sample size from all these regions would therefore be necessary to provide further support to these assumptions. Regarding FIS, Teruel showed the lowest value, probably due at least in part to the small sample size, too. Navarra showed a high inbreeding value (0.598), which indicates that self-pollination has been frequent in that region.
A global FST value of 0.011 indicates that 99% of the genetic diversity of our accession panel occurs within the five peach populations (Table 5). A global moderate value of FST (0.07) has been observed in walnut populations from Iran [57]. FST values for woody tree species tend to be lower (0.08–0.10) [57,59,60]. In addition, Jost et al. [61] stated that if more than two populations are compared using SNPs, the FST and gST measures give information about the fixation of the alleles, reflecting nearness to fixation rather the actual degree of differentiation of allele frequencies among them. Therefore, it is important to consider in global values other genetic measures, such as DJost, to complement FST. In this case, the DJost global value (0.003) indicates a low proportion of private alleles in the populations. In peach, wide pairwise values of FST have been observed, ranging from low (FST = 0.11) or moderate values (FST = 0.18) when Occidental peaches used in breeding programs were compared to traditional Occidental peaches [8], to high values (Fst = 0.442) when an “Occidental nectarine” cluster and the “Wild-related species” cluster were compared by Li et al. [5]. The pairwise FST analysis suggests that the Murcia population is the most genetically differentiated from the other regions. As the Murcia region (southeast Spain) is geographically far from other regions studied (northeast Spain), neither pollen nor natural seed dispersal coming from any other region is feasible. Although genetic differentiation could be considered as moderate between Murcia and the rest of the populations, it will be interesting to explore the Murcia population more in-depth for crossing in future Spanish peach breeding. On the other hand, the Teruel–Huesca, Teruel–Navarra, Teruel–Zaragoza, and Teruel–Lleida populations showed lower pairwise FST values, suggesting higher gene flow between these regions in the Ebro Valley and surrounding areas. Due to this geographical proximity, the most plausible possibility is that human activities have been pivotal in the gene flow between these regions. Accordingly, human activities and climate have been identified as key drivers of gene flow in a wild temperate apple, providing a practical basis for conservation, agroforestry, and breeding programs for apples in Europe [62].
At the same time, parameters like gST and DJost have confirmed this moderate differentiation value among the northern and southern geographic populations. In general, these results could support an intensive exchange of germplasm material among the populations, occurring mainly in the north of Spain, with the consequent decrease in genetic diversity.
The high inbreeding coefficient detected (higher than 0.9) was expected in a sense, since, as mentioned previously, Spanish nonmelting cultivars have been described genetically as much more homozygous than melting peaches and nectarines [49,50]. According to the mating system of this selfing species and the fact that Spanish cultivars and traditional “Old World” cultivars were selected from seed propagation, a high level of homozygosity is expected. Interestingly, some of the nonmelting nectarines studied here, such as ‘Pavía Blanca’ and ‘Pavía Amarilla de Tolosa’, also showed high inbreeding values, whereas ‘Aurelio’ and ‘Aniversario’, from Argentina and with melting flesh, showed low values (0.352 and −0.136, respectively).
The presence of melting-flesh flat and round peaches among the individuals with the lowest inbreeding values is also remarkable. Nonetheless, we have identified some nonmelting peaches with low inbreeding values (like ‘Comodín’, ‘Borracho de Jarque’, and ‘Moret’). A possible explanation would be that they are hybrids from a cross with a highly heterozygous parent, or two homozygous parents with large differences between their genotypes. Further parent–child detection analysis with more individuals would be useful to elucidate these cases.
4.3. Genetic Population Structure
The general view of the population structure showed a genetic structure mainly influenced by the origin and the fruit type, with a few exceptions. The chosen distribution of the accessions in seven clusters could elucidate the structure of the population studied. These results clearly support a strong exchange of genetic resources among the northern territories of Spain, with a less significant exchange of germplasm between the Murcia region and the north of Spain, with the exception of ‘Duraznillo 42B’ (believed to have originated in Zaragoza), which showed closeness to many accessions from Murcia in the PCA. The foreign accessions are distributed in three different clusters together with Spanish individuals. Previous works have explained the distribution of cultivars from North America in several clusters mixed with Spanish accessions due to the use of ancient nonmelting Spanish individuals in American breeding programs [11,63].
The phenotypic traits indicate some patterns of differentiation among the cluster conformation, mainly in the case of flat peaches (cluster 7), in accordance with previous works [11,24,34,49]. A total of eight accessions out from the total of 17 white-flesh peaches grouped in cluster 2, which could indicate some ancient relationship among these individuals. Moreover, cluster 3 grouped all the melting-flesh peaches and nectarines, with the exception of ‘Rojo de Azagra’, the sole member with nonmelting flesh. PCA analysis confirmed the closeness between cluster 3 and the melting flat peaches (cluster 7).
5. Conclusions
In this work, the new high-density Illumina peach SNP chip (9+9K) was used for the first time to decipher the genetic diversity of the Spanish National Peach (Prunus persica) Germplasm Collection at CITA. The obtained genotype of 90 accessions of the germplasm exposed the usefulness of many new SNPs and contributed new genetic information about this collection and the possible origins and peach material movement in Spain. Genotype data were used to provide an estimate of pairwise Identity-By-Descent (IBD), detecting 15 groups of duplicates and elucidating some synonymies (and some homonymies) within the Germplasm Collection. Genetic diversity and structure analysis could suggest a notable exchange of plant material among regions, especially within the northern regions of Spain. The genetic characterization of the peach accessions with SNP markers provides a useful and efficient way to manage germplasm collections and to help in future breeding decisions for peach improvement.
Supplementary Materials
The following are available online at https://www.mdpi.com/2073-4395/11/3/481/s1, Table S1A: Data information about accessions and fruit characteristics collected from Bouhadida et al. [11], Font i Forcada et al. [10], Wünsch et al. [24], and own data. Table S1B: Classification of SNPs using ASSIsT. Table S1C: Phenotypic traits studied in clone individuals in 2019 and 2020 in the germplasm bank. Table S1D: ‘Escolapio’ and ‘Zaragozano’ genotypes and their differences. Table S1E: Inbreeding coefficients of the 90 accessions obtained in ASSIsT. Table S1F: PLINK results.
Author Contributions
Conceptualization, P.J.M.-G.; methodology, P.J.M.-G. and C.M.C.; investigation, J.M.-G., C.M.C., M.Á.M., Á.S.P., M.G.-A., and P.J.M.-G.; data curation, P.J.M.-G., C.M.C., and J.M.-G.; writing—original draft preparation, J.M.-G., C.M.C., and P.J.M.-G.; writing—review and editing, P.J.M.-G., C.M.C., M.Á.M., Á.S.P., M.G.-A., L.B., M.T., P.M.-G., M.R., and P.J.M.-G. All authors have read and agreed to the published version of the manuscript.
Funding
This work was supported by the Spanish Ministry of Science and Innovation (MCI), the State Research Agency (AEI), and the European Regional Development Fund (FEDER), through the project “PostPeachBreed” (RTI2018-094176-R) (MCI/AEI/FEDER, UE).
Institutional Review Board Statement
Not applicable.
Informed Consent Statement
Not applicable.
Data Availability Statement
Data sharing not applicable.
Acknowledgments
We thank M. J. Muñoz-Morales, F. Jurado-Ruiz, S. Jalili, and B. Nagy for their assistance in DNA extraction, and P. Gómez de Velasco for her assistance in population phenotyping.
Conflicts of Interest
The authors declare no conflict of interest.
References
- Verde, I.; Abbott, A.G.; Scalabrin, S.; Jung, S.; Shu, S.; Marroni, F.; Zhebentyayeva, T.; Dettori, M.T.; Grimwood, J.; Cattonaro, F. The High-Quality Draft Genome of Peach (Prunus persica) Identifies Unique Patterns of Genetic Diversity, Domestication and Genome Evolution. Nat. Genet. 2013, 45, 487–494. [Google Scholar] [CrossRef] [PubMed]
- FAOSTAT. Available online: http://www.fao.org/faostat/en/#data (accessed on 15 January 2021).
- Faust, M.; Timon, B. Origin and Dissemination of Peach. Hortic. Rev. 1995, 17, 331–379. [Google Scholar]
- Zheng, Y.; Crawford, G.W.; Chen, X. Archaeological Evidence for Peach (Prunus persica) Cultivation and Domestication in China. PLoS ONE 2014, 9, e106595. [Google Scholar] [CrossRef] [PubMed]
- Li, X.; Meng, X.; Jia, H.; Yu, M.; Ma, R.; Wang, L.; Cao, K.; Shen, Z.; Niu, L.; Tian, J. Peach Genetic Resources: Diversity, Population Structure and Linkage Disequilibrium. BMC Genet. 2013, 14, 1–16. [Google Scholar] [CrossRef] [PubMed]
- Reed, D.H.; Frankham, R. Correlation between Fitness and Genetic Diversity. Conserv. Biol. 2003, 17, 230–237. [Google Scholar] [CrossRef]
- Baccichet, I.; Chiozzotto, R.; Bassi, D.; Gardana, C.; Cirilli, M.; Spinardi, A. Characterization of Fruit Quality Traits for Organic Acids Content and Profile in a Large Peach Germplasm Collection. Sci. Hortic. 2021, 278, 109865. [Google Scholar] [CrossRef]
- Micheletti, D.; Dettori, M.T.; Micali, S.; Aramini, V.; Pacheco, I.; Linge, C.D.S.; Foschi, S.; Banchi, E.; Barreneche, T.; Quilot-Turion, B. Whole-Genome Analysis of Diversity and SNP-Major Gene Association in Peach Germplasm. PLoS ONE 2015, 10, e0136803. [Google Scholar] [CrossRef] [PubMed]
- Gürcan, K.; Çetinsağ, N.; Pınar, H.; Macit, T. Molecular and Biological Assessment Reveals Sources of Resistance to Plum Pox Virus-Turkey Strain in Turkish Apricot (Prunus armeniaca) Germplasm. Sci. Hortic. 2019, 252, 348–353. [Google Scholar] [CrossRef]
- Font i Forcada, C.; Gradziel, T.M.; Gogorcena, Y.; Moreno, M.Á. Phenotypic Diversity among Local Spanish and Foreign Peach and Nectarine (Prunus persica (L.) Batsch) Accessions. Euphytica 2014, 197, 261–277. [Google Scholar] [CrossRef]
- Bouhadida, M.; Moreno, M.Á.; Gonzalo, M.J.; Alonso, J.M.; Gogorcena, Y. Genetic Variability of Introduced and Local Spanish Peach Cultivars Determined by SSR Markers. Tree Genet. Genomes 2011, 7, 257–270. [Google Scholar] [CrossRef]
- Guajardo, V.; Solís, S.; Almada, R.; Saski, C.; Gasic, K.; Moreno, M.Á. Genome-Wide SNP Identification in Prunus Rootstocks Germplasm Collections Using Genotyping-by-Sequencing: Phylogenetic Analysis, Distribution of SNPs and Prediction of Their Effect on Gene Function. Sci. Rep. 2020, 10, 1–14. [Google Scholar] [CrossRef] [PubMed]
- Pavan, S.; Delvento, C.; Ricciardi, L.; Lotti, C.; Ciani, E.; D’Agostino, N. Recommendations for Choosing the Genotyping Method and Best Practices for Quality Control in Crop Genome-Wide Association Studies. Front. Genet. 2020, 11. [Google Scholar] [CrossRef] [PubMed]
- Martínez-García, P.J.; Parfitt, D.E.; Ogundiwin, E.A.; Fass, J.; Chan, H.M.; Ahmad, R.; Lurie, S.; Dandekar, A.; Gradziel, T.M.; Crisosto, C.H. High Density SNP Mapping and QTL Analysis for Fruit Quality Characteristics in Peach (Prunus persica L.). Tree Genet. Genom. 2013, 9, 19–36. [Google Scholar] [CrossRef]
- Romeu, J.F.; Monforte, A.J.; Sánchez, G.; Granell, A.; García-Brunton, J.; Badenes, M.L.; Ríos, G. Quantitative Trait Loci Affecting Reproductive Phenology in Peach. BMC Plant Biol. 2014, 14, 1–16. [Google Scholar] [CrossRef]
- Fresnedo-Ramírez, J.; Frett, T.J.; Sandefur, P.J.; Salgado-Rojas, A.; Clark, J.R.; Gasic, K.; Peace, C.P.; Anderson, N.; Hartmann, T.P.; Byrne, D.H. QTL Mapping and Breeding Value Estimation through Pedigree-Based Analysis of Fruit Size and Weight in Four Diverse Peach Breeding Programs. Tree Genet. Genomes 2016, 12, 25. [Google Scholar] [CrossRef]
- Zeballos, J.L.; Abidi, W.; Giménez, R.; Monforte, A.J.; Moreno, M.Á.; Gogorcena, Y. Mapping QTLs Associated with Fruit Quality Traits in Peach (Prunus persica (L.) Batsch) Using SNP Maps. Tree Genet. Genomes 2016, 12, 1–17. [Google Scholar] [CrossRef]
- Mora, J.R.H.; Micheletti, D.; Bink, M.; Van de Weg, E.; Cantín, C.; Nazzicari, N.; Caprera, A.; Dettori, M.T.; Micali, S.; Banchi, E. Integrated QTL Detection for Key Breeding Traits in Multiple Peach Progenies. BMC Genom. 2017, 18, 1–15. [Google Scholar]
- Font i Forcada, C.; Guajardo, V.; Chin-Wo, S.R.; Moreno, M.Á. Association Mapping Analysis for Fruit Quality Traits in Prunus persica Using SNP Markers. Front. Plant Sci. 2019, 9, 2005. [Google Scholar] [CrossRef] [PubMed]
- da Silva Linge, C.; Antanaviciute, L.; Abdelghafar, A.; Arus, P.; Bassi, D.; Rossini, L.; Ficklin, S.; Gasic, K. High-Density Multi-Population Consensus Genetic Linkage Map for Peach. PLoS ONE 2018, 13, e0207724. [Google Scholar] [CrossRef]
- Font i Forcada, C.; Oraguzie, N.; Igartua, E.; Moreno, M.Á.; Gogorcena, Y. Population Structure and Marker–Trait Associations for Pomological Traits in Peach and Nectarine Cultivars. Tree Genet. Genom. 2013, 9, 331–349. [Google Scholar] [CrossRef]
- Li, T.; Li, Y.; Li, Z.; Zhang, H.; Qi, Y.; Wang, T. Simple Sequence Repeat Analysis of Genetic Diversity in Primary Core Collection of Peach (Prunus persica). J. Integr. Plant Biol. 2008, 50, 102–110. [Google Scholar] [CrossRef] [PubMed]
- Xie, R.; Li, X.; Chai, M.; Song, L.; Jia, H.; Wu, D.; Chen, M.; Chen, K.; Aranzana, M.J.; Gao, Z. Evaluation of the Genetic Diversity of Asian Peach Accessions Using a Selected Set of SSR Markers. Sci. Hortic. 2010, 125, 622–629. [Google Scholar] [CrossRef]
- Wünsch, A.; Carrera, M.; Hormaza, J. Molecular Characterization of Local Spanish Peach (Prunus persica (L.) Batsch) Germplasm. Genet. Resour. Crop Evolut. 2006, 53, 925–932. [Google Scholar] [CrossRef]
- Martín, C.; Herrero, M.; Hormaza, J.I. Molecular Characterization of Apricot Germplasm from an Old Stone Collection. PLoS ONE 2011, 6, e23979. [Google Scholar] [CrossRef]
- Bouhadida, M.; Casas, A.M.; Moreno, M.; Gogorcena, Y. Molecular Characterization of Miraflores Peach Variety and Relatives Using SSRs. Sci. Hortic. 2007, 111, 140–145. [Google Scholar] [CrossRef]
- Alonso Segura, J.M.; Espiau Ramírez, M.T.; Fernández i Martí, A.V. Available Genetic Variability in the Spanish National Peach Collection. In Proceedings of the VIII International Peach Symposium, Matera, Italy, 17–20 June 2013; p. 101. [Google Scholar]
- Vanderzande, S.; Howard, N.P.; Cai, L.; Da Silva Linge, C.; Antanaviciute, L.; Bink, M.C.; Kruisselbrink, J.W.; Bassil, N.; Gasic, K.; Iezzoni, A. High-Quality, Genome-Wide SNP Genotypic Data for Pedigreed Germplasm of the Diploid Outbreeding Species Apple, Peach, and Sweet Cherry through a Common Workflow. PLoS ONE 2019, 14, e0210928. [Google Scholar] [CrossRef] [PubMed]
- Peace, C.; Bassil, N.; Main, D.; Ficklin, S.; Rosyara, U.R.; Stegmeir, T.; Sebolt, A.; Gilmore, B.; Lawley, C.; Mockler, T.C. Development and Evaluation of a Genome-Wide 6K SNP Array for Diploid Sweet Cherry and Tetraploid Sour Cherry. PLoS ONE 2012, 7, e48305. [Google Scholar] [CrossRef] [PubMed]
- Verde, I.; Bassil, N.; Scalabrin, S.; Gilmore, B.; Lawley, C.T.; Gasic, K.; Micheletti, D.; Rosyara, U.R.; Cattonaro, F.; Vendramin, E. Development and Evaluation of a 9K SNP Array for Peach by Internationally Coordinated SNP Detection and Validation in Breeding Germplasm. PLoS ONE 2012, 7, e35668. [Google Scholar] [CrossRef]
- Thurow, L.B.; Gasic, K.; Raseira, M.; do, C.B.; Bonow, S.; Castro, C.M. Genome-Wide SNP Discovery through Genotyping by Sequencing, Population Structure, and Linkage Disequilibrium in Brazilian Peach Breeding Germplasm. Tree Genet. Genomes 2020, 16, 1–14. [Google Scholar] [CrossRef]
- Aranzana, M.J.; Illa, E.; Howad, W.; Arús, P. A First Insight into Peach (Prunus persica (L.) Batsch) SNP Variability. Tree Genet. Genomes 2012, 8, 1359–1369. [Google Scholar] [CrossRef]
- Li, W.; Liu, L.; Wang, Y.; Zhang, Q.; Fan, G.; Zhang, S.; Wang, Y.; Liao, K. Genetic Diversity, Population Structure, and Relationships of Apricot (Prunus) Based on Restriction Site-Associated DNA Sequencing. Hortic. Res. 2020, 7, 1–13. [Google Scholar] [CrossRef]
- Pérez, V.; Larrañaga, N.; Abdallah, D.; Wünsch, A.; Hormaza, J.I. Genetic Diversity of Local Peach (Prunus persica) Accessions from La Palma Island (Canary Islands, Spain). Agronomy 2020, 10, 457. [Google Scholar] [CrossRef]
- Doyle, J.J.; Doyle, J.L. A Rapid DNA Isolation Procedure for Small Quantities of Fresh Leaf Tissue. Phytochem. Bull. 1987, 19, 11–15. [Google Scholar]
- Gasic, K.; Da Silva Linge, C.; Bianco, L.; Troggio, M.; Rossini, L.; Bassi, D.; Aranzana, M.J.; Arus, P.; Verde, I.; Peace, C.; et al. Development and Evaluation of a 9K SNP Addition to the Peach Ipsc 9K SNP Array V1. In Proceedings of the ASHS 2019 Annual Conference, Las Vegas, NV, USA, 21–25 July 2019; Volume 54, p. 188. [Google Scholar]
- Di Guardo, M.; Micheletti, D.; Bianco, L.; Koehorst-van Putten, H.J.; Longhi, S.; Costa, F.; Aranzana, M.J.; Velasco, R.; Arús, P.; Troggio, M. ASSIsT: An Automatic SNP Scoring Tool for in-and Outbreeding Species. Bioinformatics 2015, 31, 3873–3874. [Google Scholar] [CrossRef] [PubMed]
- Purcell, S.; Neale, B.; Todd-Brown, K.; Thomas, L.; Ferreira, M.A.; Bender, D.; Maller, J.; Sklar, P.; De Bakker, P.I.; Daly, M.J. PLINK: A Tool Set for Whole-Genome Association and Population-Based Linkage Analyses. Am. J. Hum. Genet. 2007, 81, 559–575. [Google Scholar] [CrossRef] [PubMed]
- Keenan, K.; McGinnity, P.; Cross, T.F.; Crozier, W.W.; Prodöhl, P.A. DiveRsity: An R Package for the Estimation and Exploration of Population Genetics Parameters and Their Associated Errors. Methods Ecol. Evolut. 2013, 4, 782–788. [Google Scholar] [CrossRef]
- Raj, A.; Stephens, M.; Pritchard, J.K. FastSTRUCTURE: Variational Inference of Population Structure in Large SNP Data Sets. Genetics 2014, 197, 573–589. [Google Scholar] [CrossRef] [PubMed]
- Zheng, X.; Levine, D.; Shen, J.; Gogarten, S.M.; Laurie, C.; Weir, B.S. A High-Performance Computing Toolset for Relatedness and Principal Component Analysis of SNP Data. Bioinformatics 2012, 28, 3326–3328. [Google Scholar] [CrossRef] [PubMed]
- Wickham, H. Ggplot2: Elegant Graphics for Data Analysis; Springer: New York, NY, USA, 2016; ISBN 978-3-319-24277-4. [Google Scholar]
- Milne, I.; Shaw, P.; Stephen, G.; Bayer, M.; Cardle, L.; Thomas, W.T.; Flavell, A.J.; Marshall, D. Flapjack—Graphical Genotype Visualization. Bioinformatics 2010, 26, 3133–3134. [Google Scholar] [CrossRef] [PubMed]
- Belaj, A.; De La Rosa, R.; Lorite, I.J.; Mariotti, R.; Cultrera, N.G.; Beuzón, C.R.; González-Plaza, J.J.; Muñoz-Mérida, A.; Trelles, O.; Baldoni, L. Usefulness of a New Large Set of High Throughput EST-SNP Markers as a Tool for Olive Germplasm Collection Management. Front. Plant Sci. 2018, 9, 1320. [Google Scholar] [CrossRef] [PubMed]
- Adami, M.; De Franceschi, P.; Brandi, F.; Liverani, A.; Giovannini, D.; Rosati, C.; Dondini, L.; Tartarini, S. Identifying a Carotenoid Cleavage Dioxygenase (Ccd4) Gene Controlling Yellow/White Fruit Flesh Color of Peach. Plant Mol. Biol. Rep. 2013, 31, 1166–1175. [Google Scholar] [CrossRef]
- Falchi, R.; Vendramin, E.; Zanon, L.; Scalabrin, S.; Cipriani, G.; Verde, I.; Vizzotto, G.; Morgante, M. Three Distinct Mutational Mechanisms Acting on a Single Gene Underpin the Origin of Yellow Flesh in Peach. Plant J. 2013, 76, 175–187. [Google Scholar] [CrossRef]
- Huang, F.-C.; Molnár, P.; Schwab, W. Cloning and Functional Characterization of Carotenoid Cleavage Dioxygenase 4 Genes. J. Exp. Bot. 2009, 60, 3011–3022. [Google Scholar] [CrossRef]
- González, J.R.; Armengol, L.; Solé, X.; Guinó, E.; Mercader, J.M.; Estivill, X.; Moreno, V. SNPassoc: An R Package to Perform Whole Genome Association Studies. Bioinformatics 2007, 23, 654–655. [Google Scholar] [CrossRef] [PubMed]
- Aranzana, M.; Carbó, J.; Arús, P. Microsatellite Variability in Peach (Prunus Persica (L.) Batsch): Cultivar Identification, Marker Mutation, Pedigree Inferences and Population Structure. Theor. Appl. Genet. 2003, 106, 1341–1352. [Google Scholar] [CrossRef] [PubMed]
- Aranzana, M.J.; Abbassi, E.-K.; Howad, W.; Arús, P. Genetic Variation, Population Structure and Linkage Disequilibrium in Peach Commercial Varieties. BMC Genet. 2010, 11, 1–11. [Google Scholar] [CrossRef]
- Aranzana, M.J.; Decroocq, V.; Dirlewanger, E.; Eduardo, I.; Gao, Z.S.; Gasic, K.; Iezzoni, A.; Jung, S.; Peace, C.; Prieto, H. Prunus Genetics and Applications after de Novo Genome Sequencing: Achievements and Prospects. Hortic. Res. 2019, 6, 1–25. [Google Scholar] [CrossRef] [PubMed]
- Jarni, K.; Jakše, J.; Brus, R. Vegetative Propagation: Linear Barriers and Somatic Mutation Affect the Genetic Structure of a Prunus Avium L. Stand. For. Int. J. For. Res. 2015, 88, 612–621. [Google Scholar] [CrossRef]
- El-Sharkawy, I.; Liang, D.; Xu, K. Transcriptome Analysis of an Apple (Malus domestica) Yellow Fruit Somatic Mutation Identifies a Gene Network Module Highly Associated with Anthocyanin and Epigenetic Regulation. J. Exp. Bot. 2015, 66, 7359–7376. [Google Scholar] [CrossRef] [PubMed]
- Carrier, G.; Le Cunff, L.; Dereeper, A.; Legrand, D.; Sabot, F.; Bouchez, O.; Audeguin, L.; Boursiquot, J.-M.; This, P. Transposable Elements Are a Major Cause of Somatic Polymorphism in Vitis vinifera L. PLoS ONE 2012, 7, e32973. [Google Scholar] [CrossRef]
- Torregrosa, L.; Fernandez, L.; Bouquet, A.; Boursiquot, J.-M.; Pelsy, F.; Martínez-Zapater, J. Origins and consequences of somatic variation in grapevine. In Genetics, Genomics, and Breeding of Grapes; Adam-Blondon, A.-F., Martínez-Zapater, J.-M., Kole, C., Eds.; CRC Press: Boca Raton, FL, USA, 2011; pp. 68–92. [Google Scholar]
- Chavez, D.J.; Beckman, T.G.; Werner, D.J.; Chaparro, J.X. Genetic Diversity in Peach (Prunus persica (L.) Batsch) at the University of Florida: Past, Present and Future. Tree Genet. Genomes 2014, 10, 1399–1417. [Google Scholar] [CrossRef]
- Arab, M.M.; Marrano, A.; Abdollahi-Arpanahi, R.; Leslie, C.A.; Askari, H.; Neale, D.B.; Vahdati, K. Genome-Wide Patterns of Population Structure and Association Mapping of Nut-Related Traits in Persian Walnut Populations from Iran Using the Axiom J. Regia 700K SNP Array. Sci. Rep. 2019, 9, 1–14. [Google Scholar]
- Emanuelli, F.; Lorenzi, S.; Grzeskowiak, L.; Catalano, V.; Stefanini, M.; Troggio, M.; Myles, S.; Martinez-Zapater, J.M.; Zyprian, E.; Moreira, F.M. Genetic Diversity and Population Structure Assessed by SSR and SNP Markers in a Large Germplasm Collection of Grape. BMC Plant Biol. 2013, 13, 1–17. [Google Scholar] [CrossRef] [PubMed]
- Hamrick, J.L.; Godt, M.J.W.; Sherman-Broyles, S.L. Factors Influencing Levels of Genetic Diversity in Woody Plant Species. New For. 1992, 6, 95–124. [Google Scholar] [CrossRef]
- Dobeš, C.; Konrad, H.; Geburek, T. Potential Population Genetic Consequences of Habitat Fragmentation in Central European Forest Trees and Associated Understorey Species—An Introductory Survey. Diversity 2017, 9, 9. [Google Scholar] [CrossRef]
- Jost, L.; Archer, F.; Flanagan, S.; Gaggiotti, O.; Hoban, S.; Latch, E. Differentiation Measures for Conservation Genetics. Evolut. Appl. 2018, 11, 1139–1148. [Google Scholar] [CrossRef]
- Cornille, A.; Feurtey, A.; Gélin, U.; Ropars, J.; Misvanderbrugge, K.; Gladieux, P.; Giraud, T. Anthropogenic and Natural Drivers of Gene Flow in a Temperate Wild Fruit Tree: A Basis for Conservation and Breeding Programs in Apples. Evolut. Appl. 2015, 8, 373–384. [Google Scholar] [CrossRef]
- Okie, W.R. Handbook of Peach and Nectarine Varieties: Performance in the Southeastern United States and Index of Names; US Department of Agriculture, Agricultural Research Service: Washington, DC, USA, 1998.


Publisher’s Note: MDPI stays neutral with regard to jurisdictional claims in published maps and institutional affiliations. |
© 2021 by the authors. Licensee MDPI, Basel, Switzerland. This article is an open access article distributed under the terms and conditions of the Creative Commons Attribution (CC BY) license (http://creativecommons.org/licenses/by/4.0/).