Article

Molecular Characterization of Genetic Diversity in Apricot Cultivars: Current Situation and Future Perspectives

1
Unidad de Hortofruticultura, Centro de Investigación y Tecnología Agroalimentaria de Aragón (CITA), Avda. Montañana 930, 50059 Zaragoza, Spain
2
Instituto Agroalimentario de Aragón-IA2 (CITA-Universidad de Zaragoza), 50013 Zaragoza, Spain
3
Subtropical Fruit Crops Department, Instituto de Hortofruticultura Subtropical y Mediterránea La Mayora (IHSM La Mayora-CSIC-UMA), 29750 Algarrobo-Costa, Spain
4
Department of Organismic and Evolutionary Biology, Harvard University, Cambridge, MA 02138, USA
*
Author to whom correspondence should be addressed.
Agronomy 2021, 11(9), 1714; https://doi.org/10.3390/agronomy11091714
Submission received: 31 July 2021 / Revised: 24 August 2021 / Accepted: 25 August 2021 / Published: 27 August 2021
(This article belongs to the Collection Genetic Diversity Evaluation of the Fruit Trees)

Abstract

:
In the recent years, an important renewal of apricot cultivars is taking place worldwide with the introduction of a large number of new releases, which are replacing traditional and local cultivars in many situations. To study the current genetic diversity, a group of 202 apricot accessions, including landraces and releases from breeding programs in several countries, has been characterized using 13 microsatellite markers. The diversity parameters showed higher diversity in modern releases than in landraces, but also suggested a loss of diversity associated with recent breeding. Two main clusters according to the pedigree origin of the accessions were clearly differentiated in the phylogenetic analysis based on Nei’s genetic distance. The first group comprised mostly European and North American traditional cultivars, and the second group included the majority of recent and commercial releases from breeding programs. Further population analyses showed the same clustering trend on the distribution of individuals and clusters, confirming the results obtained in the molecular phylogenetic analysis. These results provide a sight of the erosion and the decrease of the genetic diversity in the currently grown apricot and highlight the importance of preserve traditional cultivars and local germplasm to assure genetic resources for further breeding.

1. Introduction

Apricot (Prunus armeniaca L.) is a diploid fruit tree species of the Rosaceae family. It was originated in Central Asia, where the first pieces of evidence of apricot cultivation date from 406-250 BC [1,2]. The crop was spread worldwide throughout three diffusion routes: Eastern Asia to Japan, the Irano-Caucasian region, and Continental Europe [3]. From the Irano-Caucasian region, it reached the Mediterranean countries by two secondary routes, Southern Europe and North Africa, originating three major apricot gene pools throughout the Mediterranean Basin: the “Irano-Caucasian”, the “North-Mediterranean Basin” and the “South-Mediterranean Basin” [4]. A recent study of single nucleotide polymorphisms (SNPs) in apricot revealed that the cultivated apricot resulted as a consequence of two different domestication events. The European cultivated apricots diverged from the wild populations of Northern Central Asia and resulted in four differentiated groups: Mediterranean countries, Continental Europe, North-America and North-Africa. On the other hand, Chinese cultivated apricots were domesticated from Southern Central Asian wild populations [5].
Nowadays, apricots are cultivated in temperate regions around the world, constituting the third stone fruit tree in economic importance worldwide. Near 50% of the world production is concentrated in Mediterranean countries. Turkey was the first world producer in 2019 with 846,606 t (20.7% of world production), followed by Uzbekistan (536,544 t, 13.1%), Iran (329,638 t, 8.1%), Italy (272,990 t, 6.7%) and Algeria (209,224 t, 5.1%) [6].
Apricot cultivars have been traditionally classified into eco-geographical groups according to their geographical origin: Central Asian, East Chinese, North Chinese, Dzhungar-Zailij, Irano-Caucasian, and European [7]. Cultivars from the Central Asian group, which is the oldest and most diverse, are mainly self-incompatible, show high chilling requirements and produce small-medium fruits. The Dzhungar-Zailij group includes mostly self-incompatible and small-fruited cultivars. Asian cultivars have been recently differentiated in two main gene pools: Central Asia and Eastern Asia, which includes Japanese apricots [3]. Most cultivars from the Irano-Caucasian group are characterized by self-incompatibility and low chilling requirements. The European group includes most of the commercial cultivars of Europe, North-America, South Africa and Australia. Most of them are self-compatible [8] and have low chilling requirements [9] and a short ripening time [10,11]. Two main gene pools have been recently differentiated in the European group: Mediterranean Europe and Continental Europe [3].
In the last years, an important renewal of apricot cultivars is taking place worldwide with the introduction of a large number of new releases in response to productive and industrial changes in the crop. Breeding programs from several countries have developed a number of new commercial cultivars focused on common objectives: self-compatibility [12,13], resistance to Plum Pox Virus (PPV), fruit quality, and extension of the ripening period [14]. The release of these new cultivars has led to the displacement of local cultivars in many countries resulting in genetic erosion of apricot diversity [15].
Microsatellites, or simple sequence repeats (SSRs), are highly polymorphic molecular markers uniformly distributed throughout the genome. Their Mendelian inheritance, and the cross-species transportability make them suitable for phylogenetic and population diversity studies [16,17]. Microsatellites have been used to characterize numerous Prunus species [18]. In apricot, they have been used to study the evolutionary history of the crop [3,5,19,20,21], and to characterize traditional [22] and local cultivars from Spain [15,23], Turkey [24], Tunisia [25,26] and Iran [27].
However, information is lacking on the diversity relationships of most of recent apricot releases. In order to fill this gap, a group of 202 apricot accessions, including landraces and releases from breeding programs in several countries were characterized using SSRs to (i) evaluate the current genetic diversity, (ii) establish the similarity relationships between cultivars, and (iii) estimate the levels of population structure in the main cultivars currently grown.

2. Materials and Methods

2.1. Plant Material

A group of 202 apricot accessions was analyzed, including 30 landraces and 171 releases from breeding programs, and one aprium, an interspecific hybrid between apricot (P. armeniaca) and plum (Prunus salicina Lindl.) (Table 1). Plant material was collected from germplasm collections and commercial orchards of Aragón, Cataluña, and Extremadura (Spain). Landraces are originating from six countries and releases are of 33 private and public breeding programs from ten countries. Two groups have been considered within the bred accessions: commercial cultivars registered in the Community Plant Variety Office (N = 132) [28] and recent unregistered releases (N = 39). The aprium hybrid was considered a commercial release for the analysis (Table 1).

2.2. DNA Extraction and Amplification

Young leaves were collected and placed in a plastic bag with silica gel for preservation until DNA extraction [29]. Genomic DNA of each cultivar was extracted from the preserved leaves following the protocol described by Hormaza [22] and using a DNeasy Plant Mini Kit (Qiagen, Hilden, Germany). DNA was quantified using a NanoDrop™ND-1000 spectrophotometer (Bio-Science, Budapest, Hungary). Thirteen selected primer combinations previously developed by different research groups in apricot and peach (Prunus persica L. Batsch) were used for the amplification of SSR loci (Table 2). Amplification reactions were carried out in 15 µL volumes, containing 10x NH4 Reaction Buffer (160 mM (NH4)2SO4, 670 mM Tris-HCl (pH 8.8 at 25 °C) and stabilizer), 25 mM MgCl2, 2.5 mM of each dNTP, 10 µM of each primer, 100 ng of genomic DNA and 0.5 U of BioTaqTM DNA polymerase (Bioline, London, UK). The temperature profile used was an initial step of 1 min at 94 °C, 35 cycles of 30 s at 94 °C, 30 s at 47, 51, 56, 57 or 60 °C depending on each primer pair (Table 2), 1 min at 72 °C, and a final step of 5 min at 72 °C. Fluorescently labeled PCR products were analyzed in a CEQTM 8000 capillary electrophoresis DNA analysis system (Beckman Coulter, Fullerton, CA, USA). Samples were denaturalized at 90°C for 120 s, injected at 2.0 kV for 30 s, and separated at 6.0 kV for 35 min [30]. Each reaction was repeated at least twice to ensure the reproducibility of the results. The amplified fragments were sized using the Beckman Coulter CEQTM 8000 Genetic Analysis System (Beckman Coulter, Fullerton, CA, USA).

2.3. Data Analysis

In order to analyze the genetic variability and the population structure, different statistical analyses were performed using the R programming environment ([36], version 4.1.0). The genetic profiles were stored in a csv file in which each allele was coded by a character string. In order to process the SSR dataset, the file was converted into a matrix of allelic frequencies stored in a genind class with the “df2genind” function using the R package “adegenet” v. 2.1.3 [37]. Missing data (<0.1%) were replaced with the mean frequency of the corresponding allele, which avoids adding artefactual between-group differentiation [38].
Number of alleles per locus (Na), allelic richness (Ar), private alleles (Pa), observed heterozygosity (Ho), expected heterozygosity (He), tests for deviations from Hardy-Weinberg expectations (HWE) and inbreeding coefficients (FIS) were calculated on the landraces and bred cultivars using the “adegenet” v. 2.1.3 [37], “hierfstat” v. 0.5–7 [39], “pegas” v. 1.0–1 [40] and “PopGenReport” v. 3.0.4 [41] packages. The levels of genetic differentiation between all pairs of populations for pre-defined and inferred groups were estimated using Nei’s pairwise FST values using the “hierfstat” v. 0.5–7 R package [39]. In order to validate the FST pairwise values, a bootstrap with 1000 replicates was carried out using the function “boot.ppfst”. Results were plotted as a correlation plot with the R package “corrplot” v. 0.90 [42]. Additionally, the distribution of genetic diversity across the population structure was evaluated with an Analysis of Molecular Variance (AMOVA) using the “poppr” R package v. 2.9.2 [43]. A three-level hierarchical analysis was designed to show the variations within/among the source of origin, the classification (landrace, commercial and recent releases), and the breeding program. All analyses were performed in the “ade4” v. 1.7–16 package [44] using 1000 permutations to assess the significance of variance components.
A R script was developed to detect homonymies and synonymies in the data. Homonymies were identified by the comparison of all accession names by the “duplicated” function, and the allele data were compared using the function “duplicated” in order to detect identical genetic profiles considered as synonymies.
Genetic relatedness among genotypes was analyzed by UPGMA (Unweighted Pair Group Method with Arithmetic averages) cluster analysis based on the Nei and Li similarity index. A dendrogram was generated using the “poppr” package v. 2.9.2 [43] with 1000 bootstrap replicates and plotted with “ape” package v. 5.3 [45].
The genetic structure of the set of accessions was analyzed by a Principal Components Analysis (PCA) and a Discriminant Analysis of Principal Components (DAPC). PCA was performed using “stats” package v. 3.6.0 and was plotted using “ggplot2” v. 3.3.4 package [46]. DAPC was carried out using the “adegenet” package v. 2.1.3 [37]. First, genetic data were transformed using PCA, and then a Discriminant Analysis was performed on the principal components (PC) retained using a cross-validation method. The optimal number of clusters (k) was determined according to the lowest Bayesian Information Criterion (BIC) value obtained with the “find.clusters” function. A cross-validation function (“XvalDapc”) was used to confirm the appropriate number of PCA to be retained.

3. Results and discussion

3.1. Microsatellite Polymorphism and Genetic Diversity

Ten of the 13 microsatellite markers resulted polymorphic in the analysis of the 202 accessions (Table 1), but no amplification patterns were obtained with three loci (UDP96-001, ssrPaCITA12 and ssrPaCITA19) (Table 2). The alleles obtained for each accession and locus can be found in Supplementary Table S1.
In order to evaluate the genetic diversity, different parameters were compared between the landraces and the releases from breeding programs. Additionally, the diversity indexes were studied for each group of landraces, commercial cultivars and recent releases (Table 3). The mean number of alleles found in landraces (6.50) was higher than those obtained in previous reports for traditional cultivars in Spain (4.00 [23]; 4.27 [15]) or Iran (4.62 [47]; 3.01 [27]) resulting presumably from the larger and diverse number of accessions analyzed in this work. However, the number of alleles was lower than those obtained in reports that include wild apricots (23.00 [48]; 16.75 [20]), probably due to not having included cultivars from China, the center of origin [20], as reported by Bourguiba et al. [3]. The highest number of alleles for all of the studied SSR loci was detected in the group of releases from breeding programs, ranging from 7 to 12, in which the average number of alleles (9.40) was higher than that of landraces although without significant differences (p < 0.05) (Supplementary Table S2). Traditional cultivars from different countries have been widely used as material for breeding [49,50]. In Europe, traditional cultivars were susceptible to Sharka (PPV) and most of them were replaced in the late 20th century. Then, most breeding programs focused on developing new cultivars by crossing traditional cultivars from each country, to conserve interesting traits, with PPV-resistant cultivars developed in North America in order to transmit the source of PPV-resistance to the new releases. This admixture in new cultivars could explain the higher number of alleles observed in bred releases due to the incorporation of genotypes developed in North America with Asian ancestors. In commercial cultivars, the average number of alleles (9.30) was higher but not significant (p < 0.05) than in recent releases (6.30), indicating a gradient of decreasing genetic diversity, which suggests that controlled selection in breeding programs may be causing a reduction in the diversity of the crop in recent years. In spite of the higher allelic diversity found in the releases from breeding programs, the allelic richness calculated to measure genetic diversity (6.97) did not showed significant differences (p < 0.05) with respect to landraces (6.20), which can be related to the diversity of origins in the bred accessions.
Only one private allele was exclusively found in the landraces, while 30 were found in releases from breeding programs. The presence of rare alleles in bred cultivars is related to the fact that these cultivars have been enriched with germplasm of landraces from different origins. However, the number of private alleles was lower when two separate groups were considered into the group of bred releases: commercial cultivars (22) and recent releases (1), showing a loss of variability in the next generation of apricot cultivars. In general, most of the private alleles were also unique, as they were exclusive to only one genotype; for example, the one found in the group of landraces is only present in the cultivar “Stella” (Table 1 and Table 3).
The mean observed heterozygosity was lower in the landraces (0.68) compared to the recent releases (0.77) and commercial cultivars (0.77) although without significant differences (p < 0.05). These values are higher than those in previous studies of diversity in apricot (0.51 [22]; 0.32 [51]; 0.52 [52]; 0.63 [19]; 0.58 [53]; 0.68 [23]; 0.65 [54]; 0.39 [15]; 0.52 [27]; 0.63 [55]; 0.36 [26]; 0.72 [20]; 0.65, 0.66 [21]). In the landraces, the expected heterozygosity ranged from 0.57 to 0.84, with a mean value of 0.73. Similar mean values of expected heterozygosity were obtained for the releases from breeding programs (0.74), with slight differences between recent releases (0.70) and commercial cultivars (0.74), probably because the individuals in both groups are related.
The mean inbreeding coefficient (FIS) had a positive value in the landraces (0.08) whereas in both recent and commercial releases was lower (−0.04), indicating a certain degree of inbreeding (Table 3). In all accessions, seven out of ten loci showed no deviation from Hardy-Weinberg Equilibrium (HWE), and three (ssrPaCITA23, ssrPaCITA27 and UDP98-412) showed significant departures from HWE (p < 0.05) (Supplementary Table S2). A loss of apricot genetic diversity during domestication and diffusion from the center of origin to areas of more recent cultivation has been reported in previous works [3,4]. Our results showed an excess of heterozygosity, which is an indicator of recent bottleneck, suggesting a loss of diversity associated to breeding. This can be due to the use of the same or very related parental genotypes in different breeding programs, thus reducing the diversity found in the new cultivars. On the other hand, we found a deficit of heterozygotes in the group of landraces as a result of inbreeding, which is a sign of expansion since traditional cultivars are a source of genetically interesting traits.
To analyze the genetic distance between all pairs of populations, we calculated the Nei’s pairwise FST matrix (Supplementary Table S3). The value of pairwise FST among the pre-defined groups showed a moderate and significative genetic difference ranging from 0.09 to 0.12 (p < 0.001), although lower than that observed in previous studies in which wild apricots (0.14 [48]) or cultivars from different eco-geographic groups were analyzed (0.58 [19]; 0.14 [26]; 0.32 [51]; 0.38 [15]).
The hierarchical population structure examined by an Analysis of Molecular Variance (AMOVA) (Table 4) showed that the highest variation (93.55%) occurred within the cultivars, although no significant differences were found. The distribution of genetic diversity suggested a significant population structure considering two origin levels, landraces and breeding releases, and a moderate (6.18%) and significant differentiation among the breeding programs. The level of variation among populations is lower than that obtained when apricot cultivars are grouped by geographical criteria [3,4] or reported in other Prunus [56,57]. However, these values together with those of fixation index seem to support the hypothesis that there is a certain level of variation among landraces and new releases.

3.2. Identification of the Different Genotypes

The R script developed to detect synonymies and homonymies allowed to distinguish 192 different apricot genotypes from the 202 accessions analyzed based on their unique genetic profiles using ten microsatellite loci. The 23 accessions identified as synonymies were probably samples of the same cultivars with different labeling in each collection. Five synonymies corresponded to the traditional Spanish cultivars “Moniquí (1006)”, “Moniquí (2113)” and the local accessions “Fabara”, “Muñoz”, and “Peñaflor 01”. A high rate of synonymies and homonymies has also been previously found in local Spanish accessions [15], probably due to the predominance of a few traditionally cultivars grown in Spain. Accessions “A159”, “A161”, “A252”, and “JNP” were identified as “Goldstrike”, “Sweet Cot”, “Soledane”, and “Almabar”, respectively. Two different recent releases, “T002” and “T011”, had the same genotype profile. Finally, the identity of accessions with the same name collected from different collections was confirmed (“Cebas 57 01” and “Cebas 57 02;” “Colorado 01” and “Colorado 02;” “Goldrich 01” and “Goldrich 02;” “Mikado 01” and “Mikado 02”) and two pairs of homonymous accessions collected from different orchards were detected (“Tom Cot 01” and “Tom Cot 02;” “Peñaflor 01” and “Peñaflor 02”).

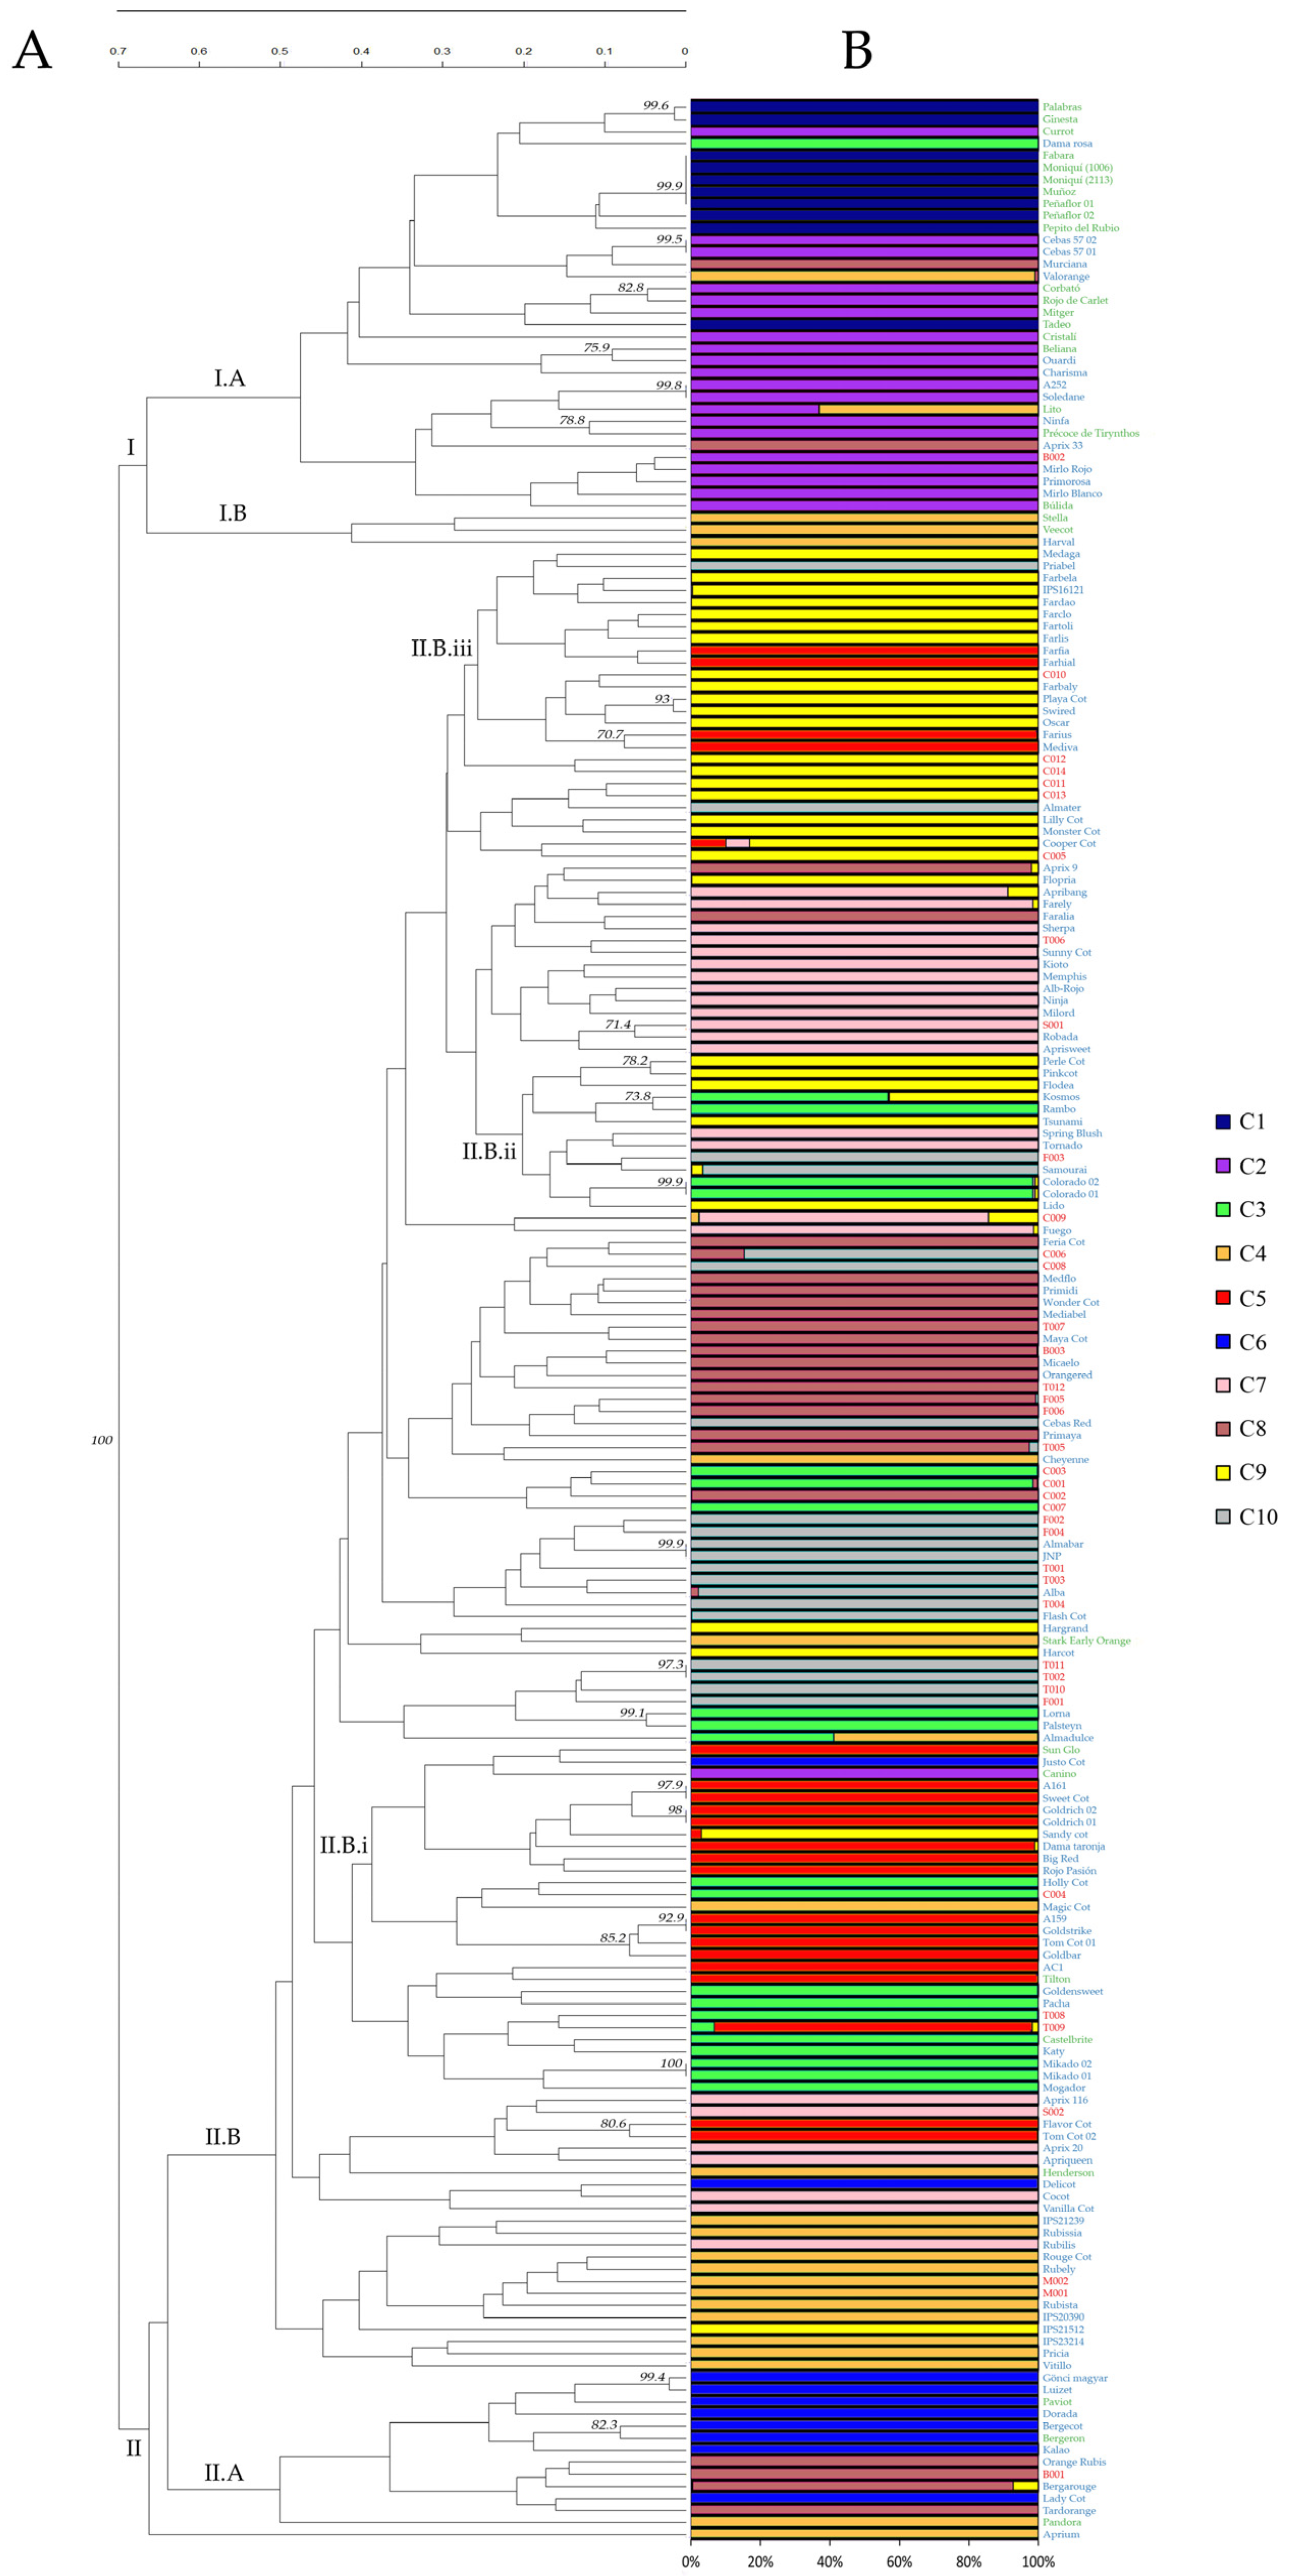
3.3. Genetic Relationships and Similarities among Genotypes

The dendrogram generated from the UPGMA cluster analysis based on the Nei and Li similarity index revealed two main clusters supported by a strong bootstrap value (100) (Figure 1A), which clearly differentiated landraces (I) from breeding releases (II). The first cluster (I), containing mostly European and North American traditional cultivars, was subdivided into two sub-clusters according to the geographical origin. One of them (I.A) was composed of traditional cultivars from Spain (e.g., “Currot”, “Moniqui”, “Búlida”), France (“Beliana”) and Greece (“Lito”, “Précoce de Tirynthos”). Additionally, recent cultivars from Spanish public breeding programs as “Dama rosa” (IVIA), “Mirlo rojo”, “Mirlo blanco” and “Murciana” (CEBAS) were grouped closely to the Spanish traditional cultivars, which is expected since they were developed from local Spanish germplasm. The other sub-cluster (I.B) included three North American cultivars: “Stella” and “Veecot” from USA, and “Harval” from Canada. This grouping supports that North American cultivars originated from European cultivars as suggested by Faust et al. [1] and later shown in different studies [22,58,59]. Our results are also in agreement with the recent breeding activity, since a great varietal renewal has taken place in the last 15 years, with the introduction of 322 new cultivars in Europe [28] from breeding programs worldwide [14]. The fact that breeding programs share some objectives, including resistance to sharka (PPV), has led to the use of a few PPV-resistant North American cultivars as parental lines to introduce this trait into European germplasm to generate new resistant cultivars, since all European cultivars are susceptible to PPV [49,50].
The second cluster (II) comprises the aprium hybrid and two sub-clusters formed mainly of breeding accessions, including recent and commercial releases. Sub-cluster II.A included cultivars from France and Hungary. The Hungarian cultivar “Gönci magyar” was clustered close to the French cultivars “Luizet”, “Paviot”, “Bergeron”, “Bergecot”, which is a mutation of “Bergeron”, and “Bergarouge”, which is a descendent of “Bergeron” [60]. This and previous studies [22,51] support the hypothesis of the presence of Hungarian apricots in the pedigree of some French cultivars [1].
Most recently developed selections were included in sub-cluster II.B and allocated in five sub-groups. In general, recently released cultivars showed only a partial tendency to cluster by their breeding program. One of the sub-groups (II.B.i) comprised a mixture of cultivars from Cot International breeding programs such as “Justo Cot”, “Goldrich”, “Sweet Cot”, “Magic Cot”, or “Goldbar”. Sub-group II.B.ii included mainly some recent releases from France (“Tsunami”, “Tornado”, “Spring Blush”, “Samourai”) and Spain (“Colorado”, “Lido”, “Flodea”, “Rambo”, “Kosmos”). Thirteen accessions from the IPS breeding program (“Medaga”, “Priabel”, “Farbela”, “IPS16121”, “Fardao”, “Farclo”, “Fartoli”, “Farlis”, “Farfia”, “Farhial”, “Farbaly”, “Farius”, and “Mediva”) were clustered highly related in sub-group II.B.iii. In previous studies, commercial cultivars have been grouped according to their geographic origins [3,19,20,22,51,52,55,59]. However, our results showed a tendency to cluster by breeding program rather than by country of origin, probably due to the fact that genotypes developed in the same breeding program would share the same parents, although this information is unknown or has not been made public for most new apricot cultivars.

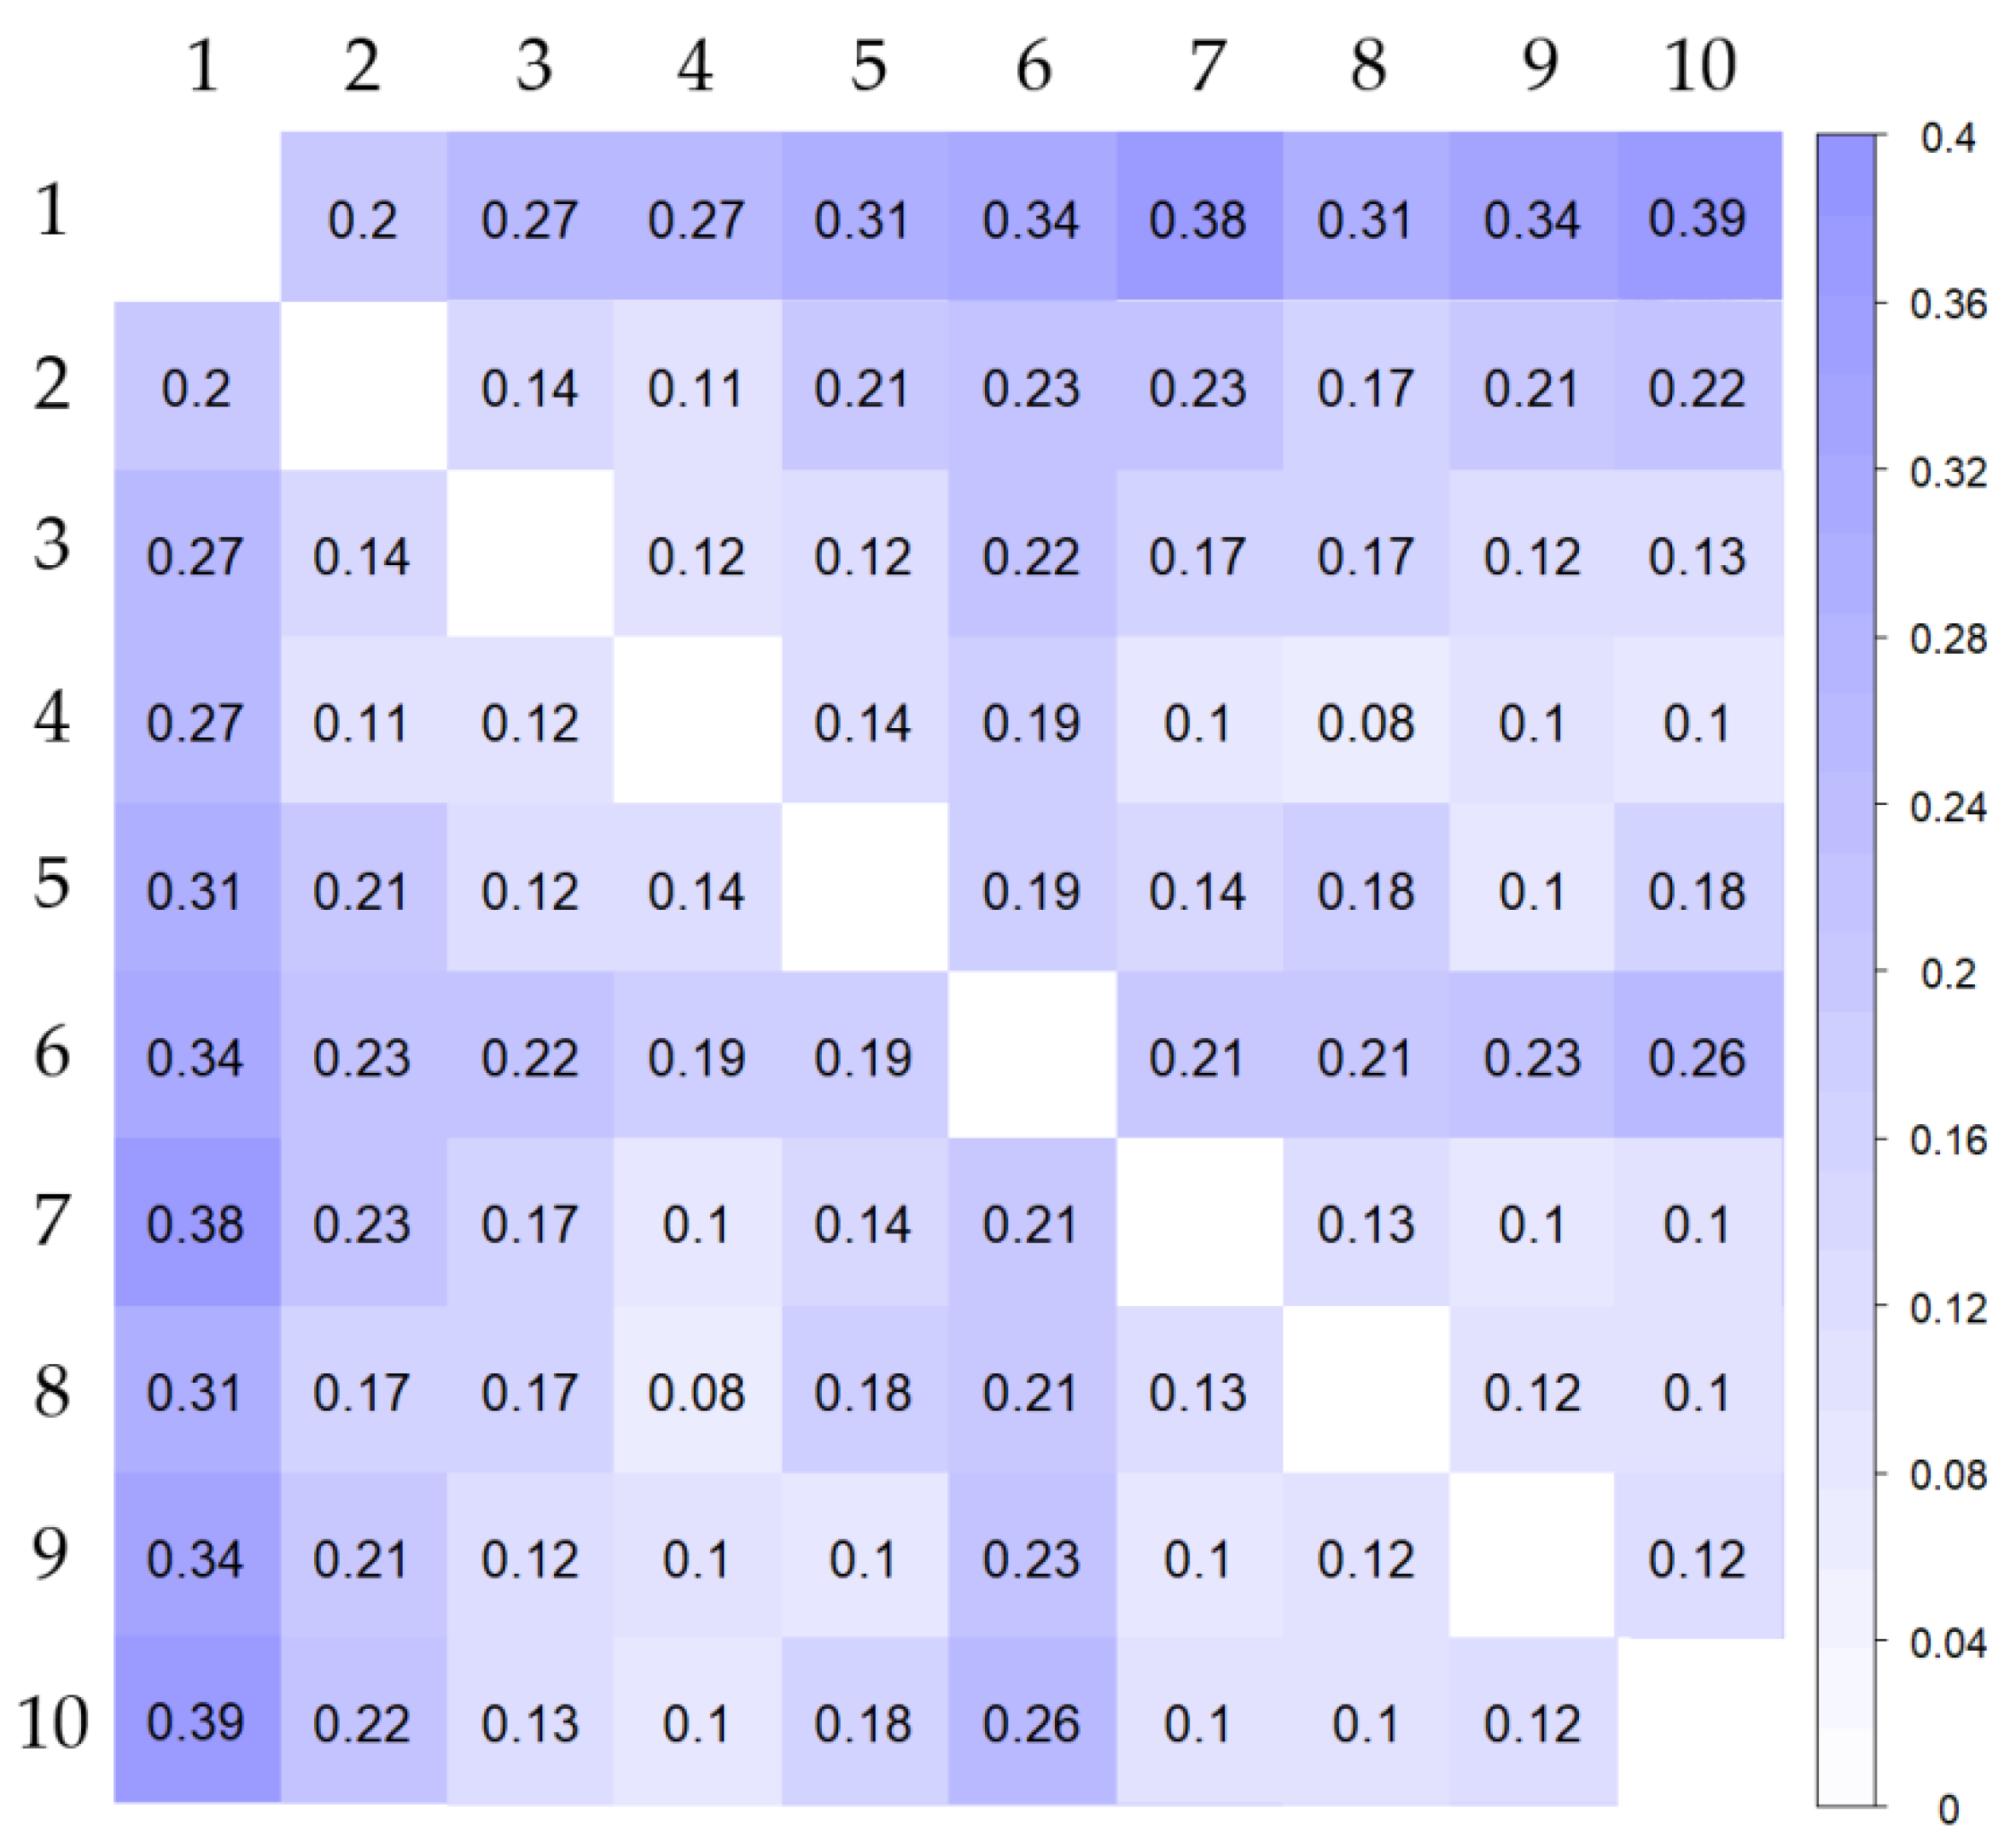
3.4. Population Structure

To study the genetic structure of the set of apricot accessions, a Principal Components Analysis (PCA) was carried, and a Discriminant Analysis of Principal Components (DAPC) to further analyze the population structure. This approach identifies and describes clusters of genetically related individuals, which provide a visual assessment of between-population genetic structures.
The two first components of PCA were represented in Figure 2. The first axis (PC-1, 12.85%) reflected population differentiation corresponding to the breeding origin, forming two main clusters. Landraces were located on the left along the x-axis, and breeding releases on the right, without a clear division between recent releases and commercial cultivars. In the second axis (PC-2, 9.05%), no clear differentiated groups were observed.
In the DAPC, BIC values were used to determine the most appropriate number of clusters (k = 10) (Supplementary Figures S1 and S2). The first two principal components of DAPC were plotted in Figure 3. The distribution of individuals and clusters showed the same clustering trend that we detected in the molecular phylogenetic analysis (Figure 1A,B) with a hierarchical structure where three groups could be identified. Spanish landraces were included in only two clusters (Supplementary Table S4). Clusters 1 (N = 10) and 2 (N = 20) were markedly separated from the others on the first principal component (Figure 3, horizontal axis), suggesting genetic structure differentiation. Although the clusters are partially overlapped, these results corroborate the hypotheses of the existence of two main genetic pools in Spain [23]: Cluster 1 encompassed “Moniquí” and synonymies, and Cluster 2 comprised the cultivars originating in Valencia and Murcia.
Interestingly, North American cultivars (“Harval”, “Henderson”, “Stark Early Orange”, “Stella”, and “Veecot”) and most of the commercial cultivars were included in the other clusters (Supplementary Table S4). This is in agreement with the use of American genotypes as a genetic source for Sharka resistance in apricot breeding. The majority of the recent releases from Spanish breeding programs and a high number of commercial Spanish cultivars, were plotted overlapped and separately from the rest of the bred cultivars in clusters 8 (N = 24) and 10 (N = 20). Finally, the other six clusters were overlapped, indicating a tendency of the relatedness between them within the breeding program. This repeated use of some common genotypes as parental lines in most of the breeding programs may result in loss of genetic diversity and, as consequence, there is a risk of a bottleneck in future generations of this crop.
FST values between each cluster were calculated in order to study the differentiation between the populations obtained by DAPC (Figure 4; Supplementary Table S5). All the correlations were highly significant (p < 0.001), showing moderate or high genetic differentiation among the defined clusters. The values were higher among cluster 1 and the rest of the clusters (0.20–0.39) reflecting a great genetic differentiation. Therefore, these results provide very interesting information for breeding programs and conservation of germplasm collections. The choice of landraces from cluster 1 in breeding programs would increase the diversity of the new cultivars. Furthermore, the use of this traditional germplasm would provide a source of interesting traits that could be used to respond to new market demands or agroclimatic conditions.

4. Conclusions

Results reveal a clear differentiation between apricot landraces, commercial cultivars and recent releases developed from breeding programs. The results showed higher diversity in bred cultivars than in landraces. This could seem a paradox but this situation could be explained by the introduction in most breeding programs of North American genotypes with alleles from Asian genotypes not present in the European landraces. As a consequence, although the introduction of new releases is increasing allelic diversity in cultivated apricot germplasm, our results suggest that the use of common parents in breeding programs can lead to a genetic bottleneck. Thus, the replacement of local landraces and traditional cultivars by genetically related bred genotypes is resulting in an erosion and decrease of the genetic diversity in grown apricot worldwide. The preservation of traditional cultivars and local germplasm is important in order to reduce the genetic erosion and conserve valuable genetic resources for further breeding.

Supplementary Materials

The following are available online at https://www.mdpi.com/article/10.3390/agronomy11091714/s1, Figure S1: Cross-validation procedure to choose the optimal number of Principal Components for the DAPC analysis. (A) A general analysis with 30 replicates of cross-validation each PC. (B) Specifying a number interval of PC around 50 with 1000 replicates. Figure S2: Graph of BIC values shows the optimum number of clusters (k = 10). Table S1: Genotypes of 201 diploid apricot accessions and one interspecific hybrid (aprium) revealed by 10 microsatellite markers. Table S2: Genetic parameters of apricot landraces and cultivars released from breeding programs (commercial and recent) for the 10 studied microsatellite loci. Table S3: Pairwise FST calculated among apricot accessions using “hierfstat” v. 0.5–7 R package. (A) Landraces (LN) and cultivars released from breeding programs (BP). (B) Upper limit (above the diagonal) and lower limit (below the diagonal) of the 99% confidence interval based on 1000 bootstrap replicates between LN and BP. (C) Landraces (LN), commercial (CR) and recent released selections (RR) from breeding programs. (D) Upper limit (above the diagonal) and lower limit (below the diagonal) of the 99% confidence interval based on 1000 bootstrap replicates among LN, CR, and RR. Table S4: List of accessions including group assignment from DAPC analysis (k = 10). Table S5: Upper limit (above the diagonal) and lower limit (below the diagonal) of the 99% confidence interval based on 1000 bootstrap replicates among populations identified by DAPC using “hierfstat” v. 0.5–7 R package.

Author Contributions

Conceptualization, J.I.H., J.L. and J.R.; methodology S.H.; data curation, S.H.; writing—original draft preparation, S.H., J.I.H., J.L. and J.R.; writing—review and editing, S.H., J.I.H., J.L., G.Y. and J.R. All authors have read and agreed to the published version of the manuscript.

Funding

This research was funded by Ministerio de Ciencia e Innovación—European Regional Development Fund, European Union (PDI2019-109566RB-100); Instituto Nacional de Investigación y Tecnología Agraria y Alimentaria (RTA2017-00003-00); Agencia Estatal de Investigación (PID2020-115473RR-I00/AEI 436/10.13039/501100011033) and Gobierno de Aragón—European Social Fund, European Union (Grupo Consolidado A12_17R).

Data Availability Statement

The SSR dataset and the scripts have been deposited at https://github.com/sherreralg/SSR-apricot.git (accessed on 31 July 2021).

Acknowledgments

We thank Yolanda Verdún for technical assistance and Afif Hedhly for assistance with statistical analyses.

Conflicts of Interest

The authors declare no conflict of interest. The funders had no role in the design of the study; in the collection, analyses, or interpretation of data; in the writing of the manuscript, or in the decision to publish the results.

References

  1. Faust, M.; Surányi, D.; Nyujtó, F. Origin and dissemination of Apricot. Hortic. Rev. 1998, 22, 225–266. [Google Scholar] [CrossRef]
  2. Janick, J. The origins of fruits, fruit growing, and fruit breeding. Plant Breed. Rev. 2005, 25, 255–320. [Google Scholar] [CrossRef]
  3. Bourguiba, H.; Scotti, I.; Sauvage, C.; Zhebentyayeva, T.; Ledbetter, C.; Krška, B.; Remay, A.; D’Onofrio, C.; Iketani, H.; Christen, D.; et al. Genetic structure of a worldwide germplasm collection of Prunus armeniaca L. reveals three major diffusion routes for varieties coming from the species’ center of origin. Front. Plant Sci. 2020, 11, 638. [Google Scholar] [CrossRef]
  4. Bourguiba, H.; Audergon, J.M.; Krichen, L.; Trifi-Farah, N.; Mamouni, A.; Trabelsi, S.; D’Onofrio, C.; Asma, B.M.; Santoni, S.; Khadari, B. Loss of genetic diversity as a signature of apricot domestication and diffusion into the Mediterranean Basin. BMC Plant Biol. 2012, 12, 49. [Google Scholar] [CrossRef] [PubMed] [Green Version]
  5. Groppi, A.; Liu, S.; Cornille, A.; Decroocq, S.; Bui, Q.T.; Tricon, D.; Cruaud, C.; Arribat, S.; Belser, C.; Marande, W.; et al. Population genomics of apricots unravels domestication history and adaptive events. Nat. Commun. 2021, 12, 3956. [Google Scholar] [CrossRef] [PubMed]
  6. FAOSTAT. Available online: http://www.fao.org/faostat/es/ (accessed on 26 July 2021).
  7. Layne, R.E.C.; Bailey, C.; Hough, L.F. Apricots. In Fruit Breeding, Volume I: Tree and Tropical Fruits; Janick, J., Moore, J.N., Eds.; JohnWiley & Sons, Inc.: New York, NY, USA, 1996; pp. 79–111. [Google Scholar]
  8. Herrera, S.; Lora, J.; Hormaza, J.I.; Rodrigo, J. Pollination management in stone fruit crops. In Production Technology of Stone Fruits; Mir, M.M., Iqbal, M., Mir, S.A., Eds.; Springer: Singapore, 2021; pp. 75–102. [Google Scholar] [CrossRef]
  9. Fadón, E.; Herrera, S.; Guerrero, B.I.; Guerra, M.E.; Rodrigo, J. Chilling and heat requirements of temperate stone fruit trees (Prunus sp.). Agronomy 2020, 10, 409. [Google Scholar] [CrossRef] [Green Version]
  10. Mehlenbacher, S.A.; Cociu, V.; Hough, L.F. Apricot (Prunus). Acta Hortic. 1991, 290, 65–110. [Google Scholar] [CrossRef]
  11. Hormaza, J.I.; Yamane, H.; Rodrigo, J. Apricot. In Fruits and Nuts. Genome Mapping and Molecular Breeding in Plants; Kole, C., Ed.; Springer: Berlin/Heidelberg, Germany, 2007; Volume 4, pp. 171–187. [Google Scholar] [CrossRef]
  12. Herrera, S.; Rodrigo, J.; Hormaza, J.I.; Lora, J. Identification of self-incompatibility alleles by specific PCR analysis and S-RNase sequencing in Apricot. Int. J. Mol. Sci. 2018, 19, 3612. [Google Scholar] [CrossRef] [Green Version]
  13. Herrera, S.; Lora, J.; Hormaza, J.I.; Herrero, M.; Rodrigo, J. Optimizing production in the new generation of apricot cultivars: Self-incompatibility, S-RNase allele identification, and incompatibility group assignment. Front. Plant Sci. 2018, 9, 527. [Google Scholar] [CrossRef] [PubMed] [Green Version]
  14. Zhebentyayeva, T.; Ledbetter, C.; Burgos, L.; Llácer, G. Apricot. In Fruit Breeding; Badenes, M.L., Byrne, D.H., Eds.; Springer: Boston, MA, USA, 2012; ISBN 978-1-4419-0762-2. [Google Scholar]
  15. Martín, C.; Hormaza, J.I.; Herrero, M. Molecular Characterization of apricot germplasm from an old stone collection. PLoS ONE 2011, 6, e23979. [Google Scholar] [CrossRef] [Green Version]
  16. Oliveira, E.J.; Pádua, J.G.; Zucchi, M.I.; Vencovsky, R.; Vieira, M.L.C. Origin, evolution and genome distribution of microsatellites. Genet. Mol. Biol. 2006, 29, 294–307. [Google Scholar] [CrossRef]
  17. Vieira, M.C.; Santini, L.; Diniz, A.L.; Munhoz, C.D.F. Microsatellite markers: What they mean and why they are so useful. Genet. Mol. Biol. 2016, 39, 312–328. [Google Scholar] [CrossRef]
  18. Badenes, M.L.; Fernandez i Marti, A.; Ríos, G.; Rubio-Cabetas, M.J. Application of genomic technologies to the breeding of trees. Front. Genet 2016, 7, 198. [Google Scholar] [CrossRef] [PubMed] [Green Version]
  19. Maghuly, F.; Fernandez, E.B.; Ruthner, S.; Pedryc, A.; Laimer, M. Microsatellite variability in apricots (Prunus armeniaca L.) reflects their geographic origin and breeding history. Tree Genet. Genomes 2005, 1, 151–165. [Google Scholar] [CrossRef]
  20. Decroocq, S.; Cornille, A.; Tricon, D.; Babayeva, S.; Chague, A.; Eyquard, J.P.; Karychev, R.; Dolgikh, S.; Kostritsyna, T.; Liu, S.; et al. New insights into the history of domesticated and wild apricots and its contribution to Plum pox virus resistance. Mol. Ecol. 2016, 25, 4712–4729. [Google Scholar] [CrossRef]
  21. Liu, S.; Cornille, A.; Decroocq, S.; Tricon, D.; Chague, A.; Eyquard, J.P.; Liu, W.S.; Giraud, T.; Decroocq, V. The complex evolutionary history of apricots: Species divergence, gene flow and multiple domestication events. Mol. Ecol. 2019, 28, 5299–5314. [Google Scholar] [CrossRef]
  22. Hormaza, J.I. Molecular characterization and similarity relationships among apricot (Prunus armeniaca L.) genotypes using simple sequence repeats. Theor. Appl. Genet. 2002, 104, 321–328. [Google Scholar] [CrossRef] [PubMed]
  23. Martínez-Mora, C.; Rodríguez, J.; Cenis, J.L. Genetic variability among local apricots (Prunus armeniaca L.) from the Southeast of Spain. Span. J. Agric. Res. 2009, 7, 855–868. [Google Scholar] [CrossRef] [Green Version]
  24. Murathan, Z.T.; Kafkas, S.; Asma, B.M.; Topçu, H. S_allele identification and genetic diversity analysis of apricot cultivars. J. Hortic. Sci. Biotechnol. 2017, 92, 251–260. [Google Scholar] [CrossRef]
  25. Bourguiba, H.; Khadari, B.; Krichen, L.; Trifi-Farah, N.; Mamouni, A.; Trabelsi, S.; Audergon, J.M. Genetic relationships between local North African apricot (Prunus armeniaca L.) germplasm and recently introduced varieties. Sci. Hortic. 2013, 152, 61–69. [Google Scholar] [CrossRef]
  26. Batnini, M.A.; Krichen, L.; Bourguiba, H.; Trifi-Farah, N.; Ruiz, D.; Martínez-Gómez, P.; Rubio, M. Comparative analysis of traditional and modern apricot breeding programs: A case of study with Spanish and Tunisian apricot breeding germplasm. Span. J. Agric. Res. 2016, 14, e0706. [Google Scholar] [CrossRef] [Green Version]
  27. Raji, R.; Jannatizadeh, A.; Fattahi, R.; Esfahlani, M.A. Investigation of variability of apricot (Prunus armeniaca L.) using morphological traits and microsatellite markers. Sci. Hortic. 2014, 176, 225–231. [Google Scholar] [CrossRef]
  28. CPVO. Community Plant Variety Office. Available online: https://cpvo.europa.eu/en (accessed on 26 July 2021).
  29. Pérez, V.; Larrañaga, N.; Abdallah, D.; Wünsch, A.; Hormaza, J.I. Genetic diversity of local peach (Prunus persica) accessions from La Palma island (Canary Islands, Spain). Agronomy 2020, 10, 457. [Google Scholar] [CrossRef] [Green Version]
  30. Herrera, S.; Lora, J.; Hormaza, J.I.; Rodrigo, J. Determination of Self- and Inter-(in)compatibility Relationships in Apricot Combining Hand-Pollination, Microscopy and Genetic Analyses. J. Vis. Exp. 2020, 160, e60241. [Google Scholar] [CrossRef] [PubMed]
  31. Sosinski, B.; Gannavarapu, M.; Hager, L.D.; Beck, L.E.; King, G.J.; Ryder, C.D.; Rajapakse, S.; Baird, W.V.; Ballard, R.E.; Abbott, A.G. Characterization of microsatellite markers in peach [Prunus persica (L.) Batsch]. Theor. Appl. Genet. 2000, 101, 421–428. [Google Scholar] [CrossRef]
  32. Cipriani, G.; Lot, G.; Huang, W.G.; Marrazzo, M.T.; Peterlunger, E.; Testolin, R. AC/GT and AG/CT microsatellite repeats in peach [Prunus persica (L) Batsch]: Isolation, characterisation and cross-species amplification in Prunus. Theor. Appl. Genet. 1999, 99, 65–72. [Google Scholar] [CrossRef]
  33. Lopes, M.S.; Sefc, K.M.; Laimer, M.; Machado, A.D.C. Characterization of microsatellite loci in Apricot. Mol. Ecol. Notes 2002, 2, 24–26. [Google Scholar] [CrossRef]
  34. Messina, R.; Lain, O.; Marrazzo, M.T.; Cipriani, G.; Testolin, R. New set of microsatellite loci isolated in apricot. Mol. Ecol. Notes 2004, 4, 432–434. [Google Scholar] [CrossRef]
  35. Testolin, R.; Marrazzo, T.; Cipriani, G.; Quarta, R.; Verde, I.; Dettori, M.T.; Pancaldi, M.; Sansavini, S. Microsatellite DNA in peach (Prunus persica L. Batsch) and its use in fingerprinting and testing the genetic origin of cultivars. Genome 2000, 43, 512–520. [Google Scholar] [CrossRef]
  36. R: The R Project for Statistical Computing. Available online: https://www.r-project.org/ (accessed on 26 July 2021).
  37. Jombart, T. Adegenet: A R package for the multivariate analysis of genetic markers. Bioinformatics 2008, 24, 1403–1405. [Google Scholar] [CrossRef] [Green Version]
  38. Jombart, T.; Devillard, S.; Balloux, F. Discriminant analysis of principal components: A new method for the analysis of genetically structured populations. BMC Genet. 2010, 11, 94. [Google Scholar] [CrossRef] [Green Version]
  39. Goudet, J. Hierfstat, a package for R to compute and test hierarchical F-statistics. Mol. Ecol. Notes 2005, 5, 184–186. [Google Scholar] [CrossRef] [Green Version]
  40. Paradis, E. Pegas: An R package for population genetics with an integrated–modular approach. Bioinformatics 2010, 26, 419–420. [Google Scholar] [CrossRef] [PubMed] [Green Version]
  41. Adamack, A.T.; Gruber, B. PopGenReport: Simplifying basic population genetic analyses in R. Methods Ecol. Evol. 2014, 5, 384–387. [Google Scholar] [CrossRef]
  42. Wei, T.; Simko, V. R Package corrplot: Visualization of a Correlation Matrix (Version 0.90). 2021. Available online: https://github.com/taiyun/corrplot (accessed on 26 July 2021).
  43. Kamvar, Z.N.; Tabima, J.F.; Grünwald, N.J. Poppr: An R package for genetic analysis of populations with clonal, partially clonal, and/or sexual reproduction. PeerJ 2014, 2, e281. [Google Scholar] [CrossRef] [PubMed] [Green Version]
  44. Dray, S.; Dufour, A.-B. The ade4 package: Implementing the duality diagram for ecologists. J. Stat. Softw. 2007, 22, 1–20. [Google Scholar] [CrossRef] [Green Version]
  45. Paradis, E.; Claude, J.; Strimmer, K. APE: Analyses of phylogenetics and evolution in R language. Bioinformatics 2004, 20, 289–290. [Google Scholar] [CrossRef] [PubMed] [Green Version]
  46. Wickham, H. Ggplot2: Elegant Graphics for Data Analysis; Springer: New York, NY, USA, 2009; Available online: https://ggplot2.tidyverse.org (accessed on 26 July 2021).
  47. Khadivi-Khub, A.; Yarahmadi, M.; Jannatizadeh, A.; Ebrahimi, A. Genetic relationships and diversity of common apricot (Prunus armeniaca L.) based on simple sequence repeat (SSR) markers. Genet. Resour. Crop Evol. 2013, 61, 357–368. [Google Scholar] [CrossRef]
  48. Tian-Ming, H.; Xue-Sen, C.; Zheng, X.; Jiang-Sheng, G.; Pei-Jun, L.; Wen, L.; Qing, L.; Yan, W. Using SSR markers to determine the population genetic structure of wild apricot (Prunus armeniaca L.) in the Ily Valley of West China. Genet. Resour. Crop Evol. 2007, 54, 563–572. [Google Scholar] [CrossRef]
  49. Gatti, E.; Defilippi, B.G.; Predieri, S.; Infante, R. Apricot (Prunus armeniaca L.) quality and breeding perspectives. J. Food Agric. Environ. 2009, 7, 573–580. [Google Scholar]
  50. Krška, B. Genetic Apricot resources and their utilisation in breeding. In Breeding and Health Benefits of Fruit and Nut Crops; Soneji, J.R., Nageswara-Rao, M., Eds.; IntechOpen: London, UK, 2018. [Google Scholar] [CrossRef] [Green Version]
  51. Romero, C.; Pedryc, A.; Muñoz, V.; Llácer, G.; Badenes, M.L. Genetic diversity of different apricot geographical groups determined by SSR markers. Genome 2003, 46, 244–252. [Google Scholar] [CrossRef] [PubMed]
  52. Zhebentyayeva, T.N.; Reighard, G.L.; Gorina, V.M.; Abbott, A.G. Simple sequence repeat (SSR) analysis for assessment of genetic variability in apricot germplasm. Theor. Appl. Genet. 2003, 106, 435–444. [Google Scholar] [CrossRef]
  53. Ruthner, S.; Pedryc, A.; Kriska, B.; Romero, C.; Badenes, M.L. Molecular characterization of apricot (Prunus armeniaca L.) cultivars using cross species SSR amplification with peach primers. Int. J. Hortic. Sci. 2006, 12, 53–57. [Google Scholar] [CrossRef]
  54. Akpinar, A.E.; Koçal, H.; Ergül, A.; Kazan, K.; Şelli, M.E.; Bakir, M.; Aslantaş, Ş.; Kaymak, S.; Saribaş, R. SSR-based molecular analysis of economically important Turkish apricot cultivars. Genet. Mol. Res. 2010, 9, 324–332. [Google Scholar] [CrossRef]
  55. Gürcan, K.; Önal, N.; Yilmaz, K.U.; Ullah, S.; Erdoğan, A.; Zengin, Y. Evaluation of Turkish apricot germplasm using SSR markers: Genetic diversity assessment and search for Plum pox virus resistance alleles. Sci. Hortic. 2015, 193, 155–164. [Google Scholar] [CrossRef]
  56. Urrestarazu, J.; Errea, P.; Miranda, C.; Santesteban, L.G.; Pina, A. Genetic diversity of Spanish Prunus domestica L. germplasm reveals a complex genetic structure underlying. PLoS ONE 2018, 13, e0195591. [Google Scholar] [CrossRef] [Green Version]
  57. Halász, J.; Kodad, O.; Galiba, G.M.; Skola, I.; Ercisli, S.; Ledbetter, C.A.; Hegedűs, A. Genetic variability is preserved among strongly differentiated and geographically diverse almond germplasm: An assessment by simple sequence repeat markers. Tree Genet. Genomes 2019, 15, 12. [Google Scholar] [CrossRef] [Green Version]
  58. Sánchez-Pérez, R.; Ruiz, D.; Dicenta, F.; Egea, J.; Martínez-Gómez, P. Application of simple sequence repeat (SSR) markers in apricot breeding: Molecular characterization, protection, and genetic relationships. Sci. Hortic. 2005, 103, 305–315. [Google Scholar] [CrossRef]
  59. Pedryc, A.; Ruthner, S.; Hermán, R.; Krska, B.; Hegedus, A.; Halász, J. Genetic diversity of apricot revealed by a set of SSR markers from linkage group G1. Sci. Hortic. 2009, 121, 19–26. [Google Scholar] [CrossRef]
  60. Milatović, D.; Nikolić, D.; Krška, B. Testing of self-(in)compatibility in apricot cultivars from European breeding programmes. Hortic. Sci. 2013, 40, 65–71. [Google Scholar] [CrossRef] [Green Version]
Figure 1. Clustering of the 201 apricot cultivars and one interspecific hybrid (aprium) included in this study. (A) The dendrogram was constructed based on UPGMA analysis using the similarity matrix generated by the Nei and Li coefficient. The numbers at specific nodes represent the bootstrap support >70% that results from 1000 bootstrap replicates. Cultivars are color-coded by breeding origin: landrace (green), recent releases from breeding programs (red) and commercial releases from breeding programs (blue). (B) Representative estimate of population structure. The bar-plot colors indicate the individual’s estimated membership fractions of each apricot cultivar to the population (k = 10). The clusters are depicted in dark blue (C1), in purple (C2), in green (C3), in orange (C4), in red (C5), in blue (C6), in pink (C7), in brown (C8), in yellow (C9), and in grey (C10).
Agronomy 11 01714 g001
Figure 2. Principal Component Analysis based on ten microsatellite allele frequency data. Cultivars are color-coded by breeding origin: landraces (green), recent releases from breeding programs (red) and commercial releases from breeding programs (blue).
Agronomy 11 01714 g002
Figure 3. Scatterplot of DAPC of 202 apricot accessions, showing the first two principal linear discriminants of the DAPC according to the optimal K value (K = 10). Each circle represents a group and each dot represents an accession. The groups are depicted in dark blue (G1), in purple (G2), in green (G3), in orange (G4), in red (G5), in blue (G6), in pink (G7), in brown (G8), in yellow (G9), and in grey (G10).The insets represent the eigenvalues of the Principal Component Analysis (PCA) and Discriminant Analysis (DA).
Agronomy 11 01714 g003
Figure 4. Corrplot of pairwise FST values calculated among populations identified by DAPC using “hierfstat” v. 0.5–7 R package.
Agronomy 11 01714 g004
Table 1. Origin of the 201 apricot accessions and one interspecific hybrid (aprium) analyzed in this study.
AccessionCountryAccessionCountryAccessionCountryAccessionCountry
BelianaFrance aF003Spain b,9FaraliaFrance c,18Mikado 01Spain c,23
BergeronFrance aF004Spain b,9FarbalyFrance c,18Mikado 02Spain c,28
BúlidaSpain aF005Spain b,9FarbelaFrance c,18MilordSpain c,23
CaninoSpain aF006Spain b,9FarcloFrance c,18Mirlo BlancoSpain c,4
CastelbriteItaly aM001France b,21FardaoFrance c,18Mirlo RojoSpain c,4
CorbatóSpain aM002France b,21FarelyFrance c,18MogadorSpain c,23
CristalíSpain aT001Spain b,28FarfiaFrance c,18Monster CotUSA c,27
CurrotSpain aT002Spain b,28FarhialFrance c,18MurcianaSpain c,4
FabaraSpain aT003Spain b,28FariusFrance c,18NinfaItaly c,6
GinestaSpain aT004Spain b,28FarlisFrance c,18NinjaFrance c,7
HendersonUSA aT005Spain b,28FartoliFrance c,18Orange RubisFrance c,8
LitoGreece aT006Spain b,28Feria CotFrance c,5OrangeredUSA c,20
MitgerSpain aT007Spain b,28Flash CotUSA c,27OscarSpain c,23
Moniquí (1006)Spain aT008Spain b,28Flavor CotUSA c,31OuardiTunisia c,15
Moniquí (2113)Spain aT009Spain b,28FlodeaSpain c,23PachaSpain c,23
MuñozSpain aT010Spain b,28FlopriaSpain c,23PalsteynSouth Africa c,2
PalabrasSpain aT011Spain b,28FuegoSpain c,23Perle CotUSA c,26
PandoraGreece aT012Spain b,28GoldbarUSA c,31PinkcotFrance c,7
PaviotFrance aA159Unknown c,33GoldensweetUSA c,17Playa CotFrance c,5
Peñaflor 01Spain aA161Unknown c,33Goldrich 01USA c,29PriabelFrance c,18
Peñaflor 02Spain aA252Unknown c,33Goldrich 02USA c,29PriciaFrance c,18
Pepito del RubioSpain aAC1USA c,26GoldstrikeUSA c,31PrimayaFrance c,18
P. de TirynthosGreece aAlbaSpain c,33Gönci magyarHungary c,3PrimidiFrance c,21
Rojo de CarletSpain aAlb-RojoSpain c,28HarcotCanada c,12PrimorosaSpain c,4
Stark E. OrangeUSA aAlmabarSpain c,9HargrandCanada c,12RamboSpain c,23
StellaUSA aAlmadulceSpain c,9HarvalCanada c,12RobadaUSA c,30
Sun GloUSA aAlmaterSpain c,9Holly CotFrance c,5Rojo PasiónSpain c,4
TadeoSpain aApribangFrance c,1IPS16121France c,18Rouge CotFrance c,5
TiltonUSA aApriqueenFrance c,1IPS20390France c,21RubelyFrance c,21
VeecotCanada aAprisweetFrance c,1IPS21239France c,21RubilisFrance c,21
S001France b,1ApriumSpain c,28IPS21512France c,21RubissiaFrance c,21
S002France b,1Aprix 116Spain c,24IPS23214France c,21RubistaFrance c,18
C001France b,5Aprix 20Spain c,24JNPUnknown c,33SamouraiFrance c,7
C002France b,5Aprix 33Spain c,24Justo CotFrance c,5Sandy cotFrance c,5
C003France b,5Aprix 9Spain c,24KalaoSpain c,23SherpaSpain c,23
C004France b,5BergarougeFrance c,13KatyUSA c,32SoledaneFrance c,14
C005France b,5BergecotFrance c,22KiotoFrance c,7Spring BlushFrance c,7
C006France b,5Big RedFrance c,7KosmosSpain c,23Sunny CotUSA c,26
C007France b,5Cebas 57 01Spain c,4Lady CotFrance c,19Sweet CotUSA c,31
C008France b,5Cebas 57 02Spain c,4LidoSpain c,23SwiredSwitzerland c,25
C009France b,5Cebas RedSpain c,4Lilly CotUSA c,26TardorangeSpain c,4
C010France b,5CharismaSouth Africa c,2LornaUSA c,30Tom Cot 01USA c,31
C011France b,5CheyenneSpain c,23LuizetFrance c,11Tom Cot 02USA c,31
C012France b,5CocotFrance c,5Magic CotUSA c,26TornadoFrance c,7
C013France b,5Colorado 01Spain c,23Maya CotFrance c,5TsunamiFrance c,7
C014France b,5Colorado 02Spain c,23MedagaFrance c,18ValorangeSpain c,4
B001Spain b,4Cooper CotFrance c,5MedfloFrance c,21Vanilla CotUSA c,26
B002Spain b,4Dama rosaSpain c,16MediabelFrance c,18VitilloItaly c,10
B003Spain b,4Dama taronjaSpain c,16MedivaFrance c,18Wonder CotUSA c,26
F001Spain b,9DelicotFrance c,19MemphisSpain c,23
F002Spain b,9DoradaSpain c,4MicaeloSpain c,4
a Landrace; b Recent release from breeding program; c Commercial cultivar from breeding program; 1 Agro Selection Fruits; 2 ARC Infruitec-Nietvoorbij; 3 Brózik Sándor and Korponai Gyula; 4 CEBAS-CSIC; 5 COT International; 6 Daniele Bassi (Università di Bologna); 7 Escande; 8 Europépinières; 9 Frutaria; 10 G. Pugliano (Università degli Studi di Napoli); 11 Gabriel Luizet; 12 Harrow Research Center; 13 INRAE; 14 INRAE/Centrex; 15 INRAT; 16 IVIA; 17 L. Bradford and N. Bradford (Le Grand, CA); 18 Marie-France BOIS (International Plant Selection); 19 Marie-Laure ETEVE (COT International); 20 New Jersey Agricultural Experiment Station; 21 Newcot S.A.S. (International Plant Selection); 22 Norbert and Pierre-Gilles Servien (COT International); 23 PBS Producción Vegetal SL; 24 Proseplan; 25 Regibus (COT International); 26 SDR FRUIT LLC; 27 SMS UNLIMITED (COT International); 28 Tulare; 29 USDA ARS (COT International); 30 USDA-Fruit Genetics and Breeding Research Unit of Fresno; 31 Washington State University (COT International); 32 Zaiger Genetics; 33 Unknown.
Table 2. List of the 13 apricot SSR loci from different Prunus species, primer sequences, linkage group, SSR motive, predicted length, and annealing temperature (Ta) used in this study.
LocusSequence (5′→ 3′)Linkage GroupSSR MotivePredicted Length (bp)Ta (°C)Species
pchgms3 1ACGGTATGTCCGTACACTCTCCATG1(CT)1917957Peach
CAACCTGTGATTGCTCCTATTAAAC
UDP96-001 2AGTTTGATTTTCTGATGCATCCUnknown(CA)1712057Peach
TGCCATAAGGACCGGTATGT
ssrPaCITA7 3CTTTTGTGCCTCAGCTTCCCAACAC1(AG)2221151Apricot
CCTGGCCTGACCCTAAGCAATTCG
ssrPaCITA10 3GGTGAGGTCTGTGCTGAATATGCCA3(CT)2617547Apricot
CGATTAAAGAAATAAGAAAAAGAGC
ssrPaCITA12 3GAGACACCCCAACCACCCATCATGT6(TC)1615147Apricot
GGTGTTGGAAATGTGGAAAGAAATG
ssrPaCITA19 3GACAAATACAATCAAGAAGTGTCGC2(TC)1611451Apricot
GAACAGCTAGCCCCTTTGTCATAC
ssrPaCITA23 3GTGAATACAAAATTTTACTACATTG3(AC)2(AG)1814651Apricot
CGGTCTCTGACTCTCTGACTTGCGG
ssrPaCITA27 3GATCCCTCAACTGAATCTCTCUnknown(TC)8(TA)6(TG)1726247Apricot
CGTCACAACAATAGATGCGAAGG
UDAp-410 4TTGTTGACAAGAAGAAAACAAAGC1(AG)2415556Apricot
CAACGGGTTGGTTTCAGAAG
UDAp-415 4AACTGATGAGAAGGGGCTTG1(GA)2115656Apricot
ACTCCCGACATTTGTGCTTC
UDAp-420 4TTCCTTGCTTCCCTTCATTG6(CT)2017556Apricot
CCCAGAACTTGATTCTGACCA
UDP98-409 2GCTGATGGGTTTTATGGTTTTC8(AG)1912960Peach
CGGACTCTTATCCTCTATCAACA
UDP98-412 5AGGGAAAGTTTCTGCTGCAC6(AG)2812960Peach
GCTGAAGACGACGATGATGA
1: [31]; 2: [32]; 3: [33]; 4: [34]; 5: [35].
Table 3. Genetic parameters of apricot landraces and cultivars released from breeding programs (commercial and recent). Mean number of alleles (Na), mean allelic richness (Ar), number of private alleles (Pa), mean observed heterozygosity (Ho), mean expected heterozygosity (He), and mean inbreeding coefficient (FIS).
GroupStatisticNaArPaHoHeFIS
Landraces 6.506.2010.680.730.08
Bred cultivars 9.40 *6.97300.770.74−0.04
t-testnsns nsns
p-value1.0000.999 0.9940.866
Recent releases 6.305.8410.770.70−0.10
Commercial releases 9.30 **7.17220.770.74−0.03
t-testnsns nsns
p-value1.0001.000 0.4470.989
* Percentage of missing data 0.06%; ** Percentage of missing data 0.08%; ns: non-significant values at p < 0.05 significance level.
Table 4. Analysis of Molecular Variance (AMOVA) calculated using three population levels for 202 apricot accessions.
Source of VariationdfSum of SquaresEstimated Variance% of Variationp-Value
Among Source187.340.5206.550.001
Among Classification within Source118.210.0180.220.241
Among Breeding Program within Classification37386.140.4906.180.001
Among Cultivars within Breeding Program1621034.95−0.516−6.501.000
Within Cultivars2021498.837.42093.550.214
Total4033025.477.931100
df: degree of freedom.
Publisher’s Note: MDPI stays neutral with regard to jurisdictional claims in published maps and institutional affiliations.

