Article

Analyzing NPP Response of Different Rangeland Types to Climatic Parameters over Mongolia

by
Lkhagvadorj Nanzad
1,2,3,
Jiahua Zhang
1,2,*,
Gantsetseg Batdelger
3,
Til Prasad Pangali Sharma
1,2,
Upama Ashish Koju
4,
Jingwen Wang
1,2 and
Mohsen Nabil
1,2,5
1
Key Laboratory of Digital Earth Science, Aerospace Information Research Institute (AIR), Chinese Academy of Sciences (CAS), Dengzhuang South Road, Haidian District, Beijing 100094, China
2
College of Earth and Planetary Sciences, University of Chinese Academy of Sciences, Beijing 100049, China
3
National Remote Sensing Center, Information and Research Institute of Meteorology, Hydrology and Environment (IRIMHE), Ulaanbaatar 15160, Mongolia
4
Boreal and Temperate Primary Forest Research Project, Kathmandu Forest College, Kathmandu 44600, Nepal
5
Division of Agriculture Applications, Soils, and Marine (AASMD), National Authority for Remote Sensing and Space Sciences (NARSS), Cairo, New Nozha, Alf Maskan 1564, Egypt
*
Author to whom correspondence should be addressed.
Agronomy 2021, 11(4), 647; https://doi.org/10.3390/agronomy11040647
Submission received: 28 January 2021 / Revised: 13 March 2021 / Accepted: 25 March 2021 / Published: 27 March 2021
(This article belongs to the Special Issue Climate Factors Contribute to Grassland Net Primary Productivity)

Abstract

:
Global warming threatens ecosystem functions, biodiversity, and rangeland productivity in Mongolia. The study analyzes the spatial and temporal distributions of the Net Primary Production (NPP) and its response to climatic parameters. The study also highlights how various land cover types respond to climatic fluctuations from 2003 to 2018. The Boreal Ecosystem Productivity Simulator (BEPS) model was used to simulate the rangeland NPP of the last 16 years. Satellite remote sensing data products were mainly used as input for the model, where ground-based and MODIS NPP were used to validate the model result. The results indicated that the BEPS model was moderately effective (R2 = 0.59, the Root Mean Square Error (RMSE) = 13.22 g C m−2) to estimate NPP for Mongolian rangelands (e.g., grassland and sparse vegetation). The validation results also showed good agreement between the BEPS and MODIS estimates for all vegetation types, including forest, shrubland, and wetland (R2 = 0.65). The annual total NPP of Mongolia showed a slight increment with an annual increase of 0.0007 Pg (0.68 g C per meter square) from 2003 to 2018 (p = 0.82) due to the changes in climatic parameters and land cover change. Likewise, high increments per unit area found in forest NPP, while decreased NPP trend was observed in the shrubland. In conclusion, among the three climatic parameters, temperature was the factor with the largest influence on NPP variations (r = 0.917) followed precipitation (r = 0.825), and net radiation (r = 0.787). Forest and wetland NPP had a low response to precipitation, while inter-annual NPP variation shows grassland, shrubland, and sparse vegetation were highly sensitive rangeland types to climate fluctuations.

1. Introduction

Rangeland ecosystems are vital for farming and the environments that regulate the global carbon cycle [1]. Rangeland includes several vegetation types such as grasslands, shrublands, savannas, and marshes, which together cover about 40% of the world’s land area [2,3]. Mongolia has 2.6% of the world’s rangelands, constituting around 83% of the country’s territory [4,5]. Although the livestock industry is the primary engine of the country’s economy, Mongolian rangelands face unprecedented threats from climate change and overgrazing. Both of them have almost an equal impact on Mongolian rangelands [6,7], whereas the effects of livestock grazing are well documented [4,6,8,9,10,11,12,13,14,15,16] compared to climate change impacts [10,16,17].
Several studies have revealed that the average global surface temperature has increased by 0.91°C between 1850 and 2015 [18]. In Mongolia, the average temperature rise exceeds the global average, making it one of the countries under the extreme risk of climate change [19,20,21]. Moreover, the total annual precipitation in the central and Gobi regions has decreased by 9.4% to 17.6% over the last 70 years with accelerating glacial retreat, increased aridity, and a decline in the number of lakes and rivers [22]. Most of the Mongolian rangelands are located in the arid and semi-arid areas, making them more sensitive to climate change [23]. During the last decades, Mongolia experienced severe and prolonged disasters, including droughts [24,25,26] and dzuds (harsh winter). The extreme drought events were recorded during 1999–2002, 2004–2007, and 2009. The dzuds that occurred during the years 1999–2001 and 2009–2010 were the worst recorded during the last 18 years that caused 20–35% of Mongolia’s livestock losses [26,27,28,29,30].
In addition to extreme climatic events, the climatic parameters’ fluctuations directly impact rangeland productivity [1]. For instance, the grassland productivity has declined in Mongolia over the last 40 years by 20–30% in fenced areas (where grazing is not allowed), which is directly attributed to increased temperatures during the winter and summer seasons [4]. These challenges in the climatic conditions led to ecologically fragile rangelands due to high fluctuations in their productivity and accelerated degradation rate [31]. Hence, the frequent and up-to-date monitoring of rangeland productivity changes as a response to climate change is vital for sustainable management and hazard mitigation.
Quantifying the changes in rangeland productivity could be achieved through remote sensing as well as field inventory-based methods. In small-scale studies, estimating productivity via field inventory is highly accurate, but the processes are time-consuming and costly. Instead, remote sensing data provide broad coverage with the least cost and acceptable accuracy in quantifying the rangeland productivity from local to global scale [32]. Various vegetation indices derived from satellite remote sensing data (such as NDVI—Normalized Difference Vegetation Index, EVI—Enhanced Vegetation Index, and LAI—Leaf Area Index) have been used to measure the Net Primary Production (NPP). However, numerical and simulation models derived NPP using remote sensing data with other climatic and physical variables was the frequently used indicator for monitoring rangeland ecosystem functions and ecological monitoring activities [10,17,33,34,35,36]. The spatial distribution of NPP reflects the differences in the vegetation distribution and land cover type, while the temporal NPP changes are linked with seasonal weather variability (fast process), and climate change (slow process) [37].
Remote sensing-based NPP models are useful for estimating standing biomass because NPP is closely related to above-ground biomass [38]. Numerous ecosystem models, such as the TEM model [39,40], Century model [41], Carnegie–Ames–Stanford–Approach (CASA) model [42], Biome-BGC model [43], BIOME3 model [44], Boreal Ecosystem Productivity Simulator (BEPS), MOD-Sim-Cycle model [45] and GLO-PEM model [46], have been developed over the last two decades to estimate NPP over different parts of the world. Among them, the CASA model has already been used in Mongolia to calculate NPP [47,48,49], while the BEPS model has been verified for one year over the East Asia region including Mongolia [50]. However, it has not been used in the national level NPP calculation in Mongolia. The BEPS is a simple and widely used model [51], which was initially developed and validated for boreal ecosystems. Recently it has been applied and validated to monitor the dynamic changes in the productivity of various vegetation types, such as shrubland, farmland, and grassland ecosystems [52]. Accordingly, the model was used in mapping NPP spatial and temporal variations as a response to multiple distributors (e.g., forest fires, extreme climate events, drought, and climate change) at regional, continental, and global scales [50,53,54,55,56,57] to quantify the water-use efficiency in dryland ecosystems [58], and to assess the grazing impact on ecosystem carbon sequestration [59].
Bao et al. [47] have quantified spatiotemporal patterns of terrestrial NPP over Mongolia from 1982 to 2011, mainly focusing climatic constraints on NPP during the growing season. Bat-oyun et al. [48] focused on climatic and grazing effects on grassland productivity for 2005 to 2007; Lin et al. [49] calculated monthly NPP from 2000 to 2004. Although their study covered different periods, they focused only on growing season at a monthly time scale and relied on station data for meteorological input. However, it is still unclear how different rangeland types in Mongolia respond to climatic parameter changes. Considering this background, this study focuses on daily and annual spatial and temporal variation of rangeland NPP in Mongolia as a response to the fluctuation in three climatic parameters (precipitation, temperature, and solar radiation).
This study first examines the spatiotemporal variation of NPP over five different vegetation types due to the climatic parameters over the last 16 years (2003–2018) using the BEPS model. The second objective was to highlight the most vulnerable rangeland types to the climatic parameters, which is very urgent to intervene the adverse impacts and ensure environmental sustainability.

2. Materials and Methods

2.1. Study Area

The study has focused on Mongolia, which is located in Central Asia. In terms of climate, the country is located in the arid and semi-arid regions between the Great Siberian boreal forest and the Central Asian deserts. As a result, Mongolian rangelands are highly sensitive to environmental changes [60]. Mongolian rangelands have diverse ecosystems ranging from the Gobi Desert in the south to the forest-steppe in the north (Figure 1), with high inter-annual precipitation variations and fluctuations in annual and seasonal rangeland productivity.
The country has a total area of 1.565 million km2; the border extends between the latitudes of 41°35′ N to 52°09′ N and the longitudes of 87°44′ E to 119°56′ E (Figure 1). This country’s elevation decreases gradually from west to east, with an average elevation of 1580m above sea level. The region has a wide variety of climatic conditions with four distinct seasons; it has high annual and diurnal temperature fluctuations and low rainfall. Annual total precipitation varies from 50 mm in the Gobi Desert region to about 400 mm in the northern mountain region, whereas the annual temperature ranges in the study area from −8 °C to 6 °C [61]. The majority of the annual rainfall (about 85%) falls in the growing season (May to September), where 50–60% of rain is concentrated in June, July, and August. Meanwhile, less than 20% of precipitation falls in the form of snow in winter [62]. There are 230–260 sunny days in a year [61], and the number of rainy days increases from south to north direction. The average total sunshine duration in Mongolia is about 2600–3300 h per year [63].

2.2. Data Processing Method

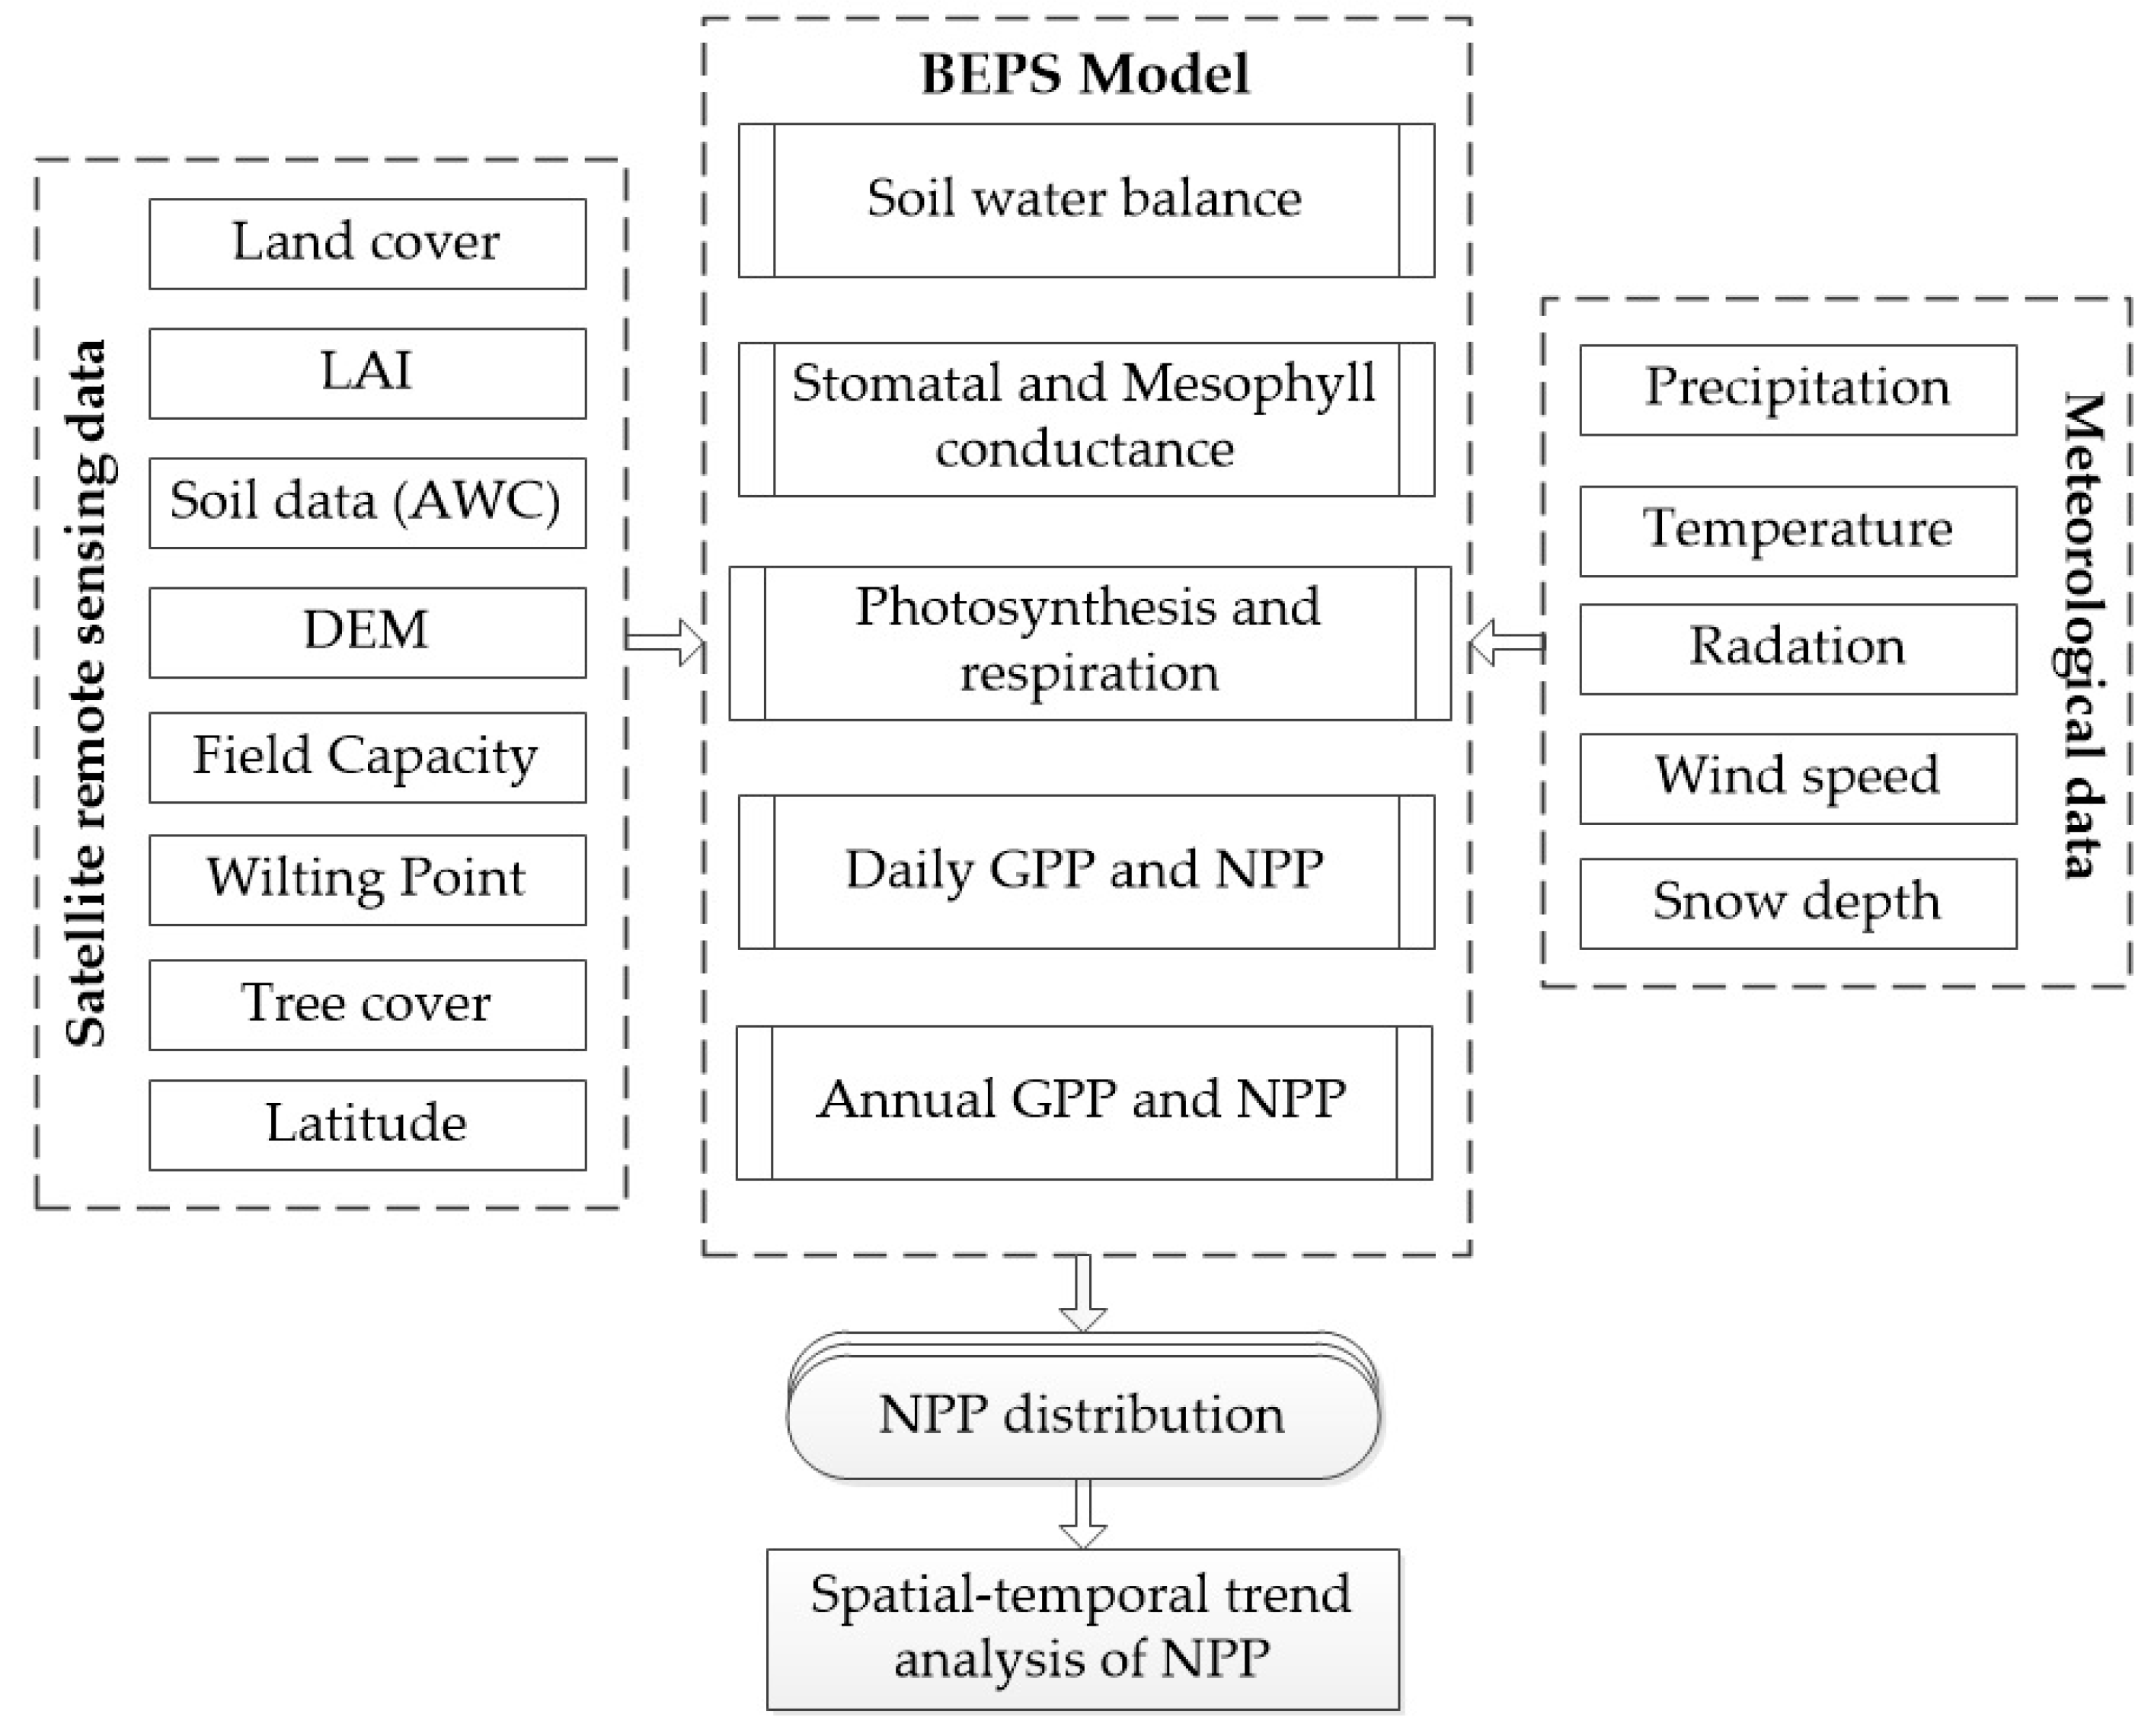
2.2.1. NPP Estimation from BEPS Model

The study applied BEPS model simulation to examine the spatial-temporal of NPP variation over Mongolian rangelands. The model was operated in ArcGIS environments and continuously run for years from 2003 to 2018. The annual NPP at the spatial resolution of 500m was calculated as the sum of the daily NPP value between 1 January and 31 December, respectively (day of the year). At last, the statistical analysis of NPP at different land cover types was performed, and the spatial and temporal trend analysis of NPP was investigated. The general flowchart of the overall methodological process and the primary inputs is presented in Figure 2. The BEPS calculates Gross Primary Productivity (GPP), NPP, and Evapotranspiration (ET) for each pixel based on; (1) remotely sensed vegetation parameters such as Leaf Area Index (LAI), vegetation cover types, field capacity, tree cover, and wilting point, (2) topographic parameters such as elevation and latitude, and (3) daily meteorological data. Likewise, land cover data used to determine vegetation structure and type. Spatially distributed LAI is needed to calculate canopy conductance, photosynthesis, and leaf respiration. The model requires daily meteorological data to specify the environmental conditions of plant growth [64]. The DEM and soil data are for defining hydrological parameters for the hydrological module. Finally, the model needs annual tree cover, latitude, and plant type data (C3).
The model consists of a soil water balance model, stomatal and mesophyll conductance model, photosynthesis, and respiration model, which eventually estimate daily and yearly accumulated NPP. In the BEPS, the NPP is computed as the difference between the total carbon uptake through photosynthesis (GPP) and the carbon release due to respiration (Ra) [55,65]. The following Equations (1)–(3) were used to run the NPP [66].
NPP = GPP R a
GPP = ( A sun LAI sun + A shade LAI shade ) Day Length Factor
R a = R m + R g
where NPP is net primary productivity, GPP (gross primary productivity) is the carbon flux during photosynthesis. The subscripts ‘sun’ and ‘shade’ denote the sunlight and shaded components of daily mean photosynthesis rate (A) and LAI. The factor converts the GPP unit into g C m−2 day−1. Daily R a is the autotrophic respiration, while R m and R g are the maintenance respiration and growth respiration by all living parts including fine roots and leaves, respectively [67,68,69].

2.2.2. Validation Analysis

The NPP estimated from the BEPS model was compared with the corresponding NPP measured from field observations at the exact time and geographical location. We conducted two statistical analyses to evaluate BEPS model accuracy. Firstly, the R2 (Coefficient of determination) represents the BEPS model’s fitness to simulate NPP compared to the ground observations (Equation (4)). The second statistical analysis to evaluate the model efficiency is the Root Mean Square Error (RMSE) from Equation (5).
r x , y = i = 1 n ( x i x ¯ ) ( y i y ¯ ) i = 1 n ( x i x ¯ ) 2 i = 1 n ( y i y ¯ ) 2 , R 2 = ( r x , y ) 2
where x and y represent NPP values estimated from the observed data and BEPS model, respectively, in the ith year; x ¯ represents the mean annual amount of NPP estimated from the ground, y ¯ represents the annual average NPP estimated from the model; n = 206 represents the number of biomass samples; and R x , y is the correlation coefficient between x and y. The R2 value is the coefficient of determination which ranges from 0 to 1. The high R2 value reflects how the model fitness in predicting NPP over the study area.
RMSE = i = 1 n ( x i y i )   2 n
where x i is the ground-measured NPP, y i is the simulated NPP, and n is the number of samples. The smaller the RMSE value, the higher the accuracy of the model in estimating NPP.

2.2.3. Trend Analysis

The non-parametric Mann–Kendall (MK) test was used to assess trends in the time series of the variables [69]. The significance of the annual NPP and its driving three climatic parameters (temperature, precipitation, and net radiation) were tested at the 95% level, and MK statistics for time series was calculated as Equation (6):
S = j < 1 n sgn ( Z i Z j )
where Z i and Z j are mean NPP and climatic parameters value in the year i and j, respectively, i > j, n = 16 years, representing the length of time series from 2003 to 2018 and sgn ( Z i Z j ) is sign function defined by Equation (7):
sgn ( Z i Z j ) = { 1 ,       if   Z i Z j > 1 0 ,       if   Z i Z j = 0 1 ,       if   Z i Z j < 1 }
The null hypothesis (Ho) is that there is no trend in the series, whereas the alternative hypothesis (H1) is that an increasing or decreasing monotonic trend exists in the series. The presence of a statistically insignificant trend was evaluated based on the p-value. Ho (no trend) is rejected if the p-value is less than a predefined significance level of 0.05. In addition to the linear regression method, the Sen’s slope method was also used to estimate the slope of NPP and its driving parameters. If the time series data presents a linear trend, the true slope (change per unit time) of a trend can be estimated by the non-parametric index developed by Sen [70], which is based on the assumption of a linear trend [71]:
Sen’s slope = Median { ( x i x j ) / ( i j ) } ,   i > j ,
where x i and x j are changing NPP and climate parameters value at the time i and j, respectively. The annual NPP and climate parameters trend is computed as an average change: a negative slope indicates a decreased trend and a positive slope denotes an increasing trend.

2.2.4. Statistical and Correlation Analysis

We extracted each climate parameter and NPP of five different vegetation types from 2003 to 2018 within the study area using the zonal statistical analysis. Then, Pearson correlation analysis was used to study the correlation between NPP and climatic parameters (temperature, precipitation, and net radiation). Their correlation level in different vegetation types was analyzed separately (9).
R x , y = i = 1 n ( x i x ¯ ) ( y i y ¯ ) i = 1 n ( x i x ¯ ) 2 i = 1 n ( y i   y ¯ ) 2
where x and y represent NPP values and climatic parameters (temperature, precipitation, and net radiation) in the ith year; x ¯ represents the mean annual NPP, y ¯ represents the mean annual value of climatic parameters (temperature, precipitation, and net radiation) from 2003 to 2018; n = 16 years, representing the length of time series. R x , y < 0 means a negative correlation coefficient between x and y and vice versa [72].

2.3. Data Acquisition and Preparation

All the input datasets were processed beforehand NPP estimation in the same coordinate system (latitude/longitude) and unified spatial resolution. The following section explains the input data characteristics and their preparation.

2.3.1. LAI Data

The Leaf Area Index (LAI) is one of the main input variables to most distributed ecosystem process models. In this study, the LAI product was derived from Moderate Resolution Imaging Spectroradiometer (MODIS) reflectance data. The MODIS LAI product (MCD15A3H) can be obtained from the Earth data (https://doi.org/10.5067/MODIS/MCD15A3H.006, accessed on 1 January 2019), with 4-day temporal resolution by composing the pixel value of each four days from NASA’s Terra and Aqua satellites in 500-m spatial resolution. In this study, we downloaded the 4-days temporal products of MCD15A3H for the years 2003–2018. Then, LAI gaps were interpolated to daily intervals from the original four days raster using the direct linear interpolation method.

2.3.2. Climate Data

The daily climate data (precipitation, air temperature, net surface radiation, wind speed, snow depth, and dew point temperature) for 2003–2018 were derived from the European Centre for Medium-Range Weather Forecast (ECMWF) data products. The ECMWF provides global gridded three-hour time-varying climate products (http://www.ecmwf.int/research/era, accessed on 10 December 2018) with a spatial resolution of 0.125° × 0.125°. The daily input data was estimated from 3 hourly gridded climate data, while the daily precipitation was derived as the sum of the daily rainfall. The net surface radiation was calculated as the sum of the surface net thermal radiation and surface net solar radiation. ECMWF meteorological data used in this study was successfully applied in modeling [73], including the BEPS model [74]. Besides that, data reliability was achieved through the correlation analysis between ECMWF climate data and ground data (70 stations), which showed R2 values 0.64 and 0.70 for precipitation and temperature, respectively.

2.3.3. Land Cover and Tree Cover Data

Land cover plays a crucial role in terrestrial carbon biogeochemical processes, and thus, the land cover data is a significant input variable to the BEPS model. The global land cover dataset was downloaded from the European Space Agency (ESA) Climate Change Initiative Land Cover (CCI-LC) product through the project website (http://maps.elie.ucl.ac.be/CCI/viewer/download.php, accessed on 17 June 2019). The maps are available on an annual basis from 1992 to 2015 at 300 m spatial resolution. The CCI-LC classifies land cover into 22 types based on the Land Cover Classification System (LCCS) method. We transformed the original 22 classes of CCI-LC products into two separate codes to suit the model and vegetation analysis (Table 1). The first was to estimate NPP through the BEPS model, while the second was for analyzing NPP variation for different vegetation types. Also, we clipped the global maps to derive the LC dataset for Mongolia between 2003 and 2015. Then, the 22 CCI-LC classes were aggregated into 18 categories as input to the BEPS model. We transformed the CCI-LC classes into nine general classes to estimate the NPP of each vegetation type for vegetation analysis. Besides the LC maps, the BEPS model requires an additional layer of percent tree cover. The MODIS has a percent tree cover product with a spatial resolution of 250 m from vegetation continuous vegetation fields (MOD44B) product at the yearly interval [75]. We derived the percent tree cover layers over Mongolia to cover the whole study period.

2.3.4. Soil Data and Digital Elevation Model (DEM)

The soil-related variable required by BEPS is the Available soil Water-holding Capacity (AWC). AWC is defined as the water content difference between field capacity and permanent wilting point in the soil. Both, wilting point and field capacity at a spatial resolution of 0.083° × 0.083° were downloaded from the International Geosphere-Biosphere Program, Data, and Information System (IGBP-DIS; https://daac.ornl.gov/cgi-bin/dsviewer.pl?ds_id=569, accessed on 15 January 2019). Besides that, DEM and latitude data are also important input variables to the BEPS model. Hence, the 30 m DEM was downloaded from the Shuttle Radar Topography Mission (SRTM) (https://dwtkns.com/srtm30m/, accessed on 15 June 2019). Then, the latitude data was derived from the DEM data based on its y-coordinates.

2.3.5. Field Sampling Data and Data Collection

For model validation, we used the aboveground biomass (AGB) data derived from 47 stations across the country (Figure 1), which was provided by the Information and Research Institute of Meteorology, Hydrology, and Environment (IRIMHE) of Mongolia. The dominant plant community in the Mongolian rangeland is characterized by C3, cool-season species [77]. The AGB of grass was measured once per month: on the twenty-fifth of each months during the growing season (from May to September of the year) for 2003–2018. Forty-seven plots (1 × 1 m) were hand-harvested (clipped) at 1 cm above the ground surface. Later, it was dried in the lab until the weight remained constant and weighted using a balance with an accuracy of 0.1 g. The dried AGB values were expressed as gram per meter square area (g/m2), then converted to NPP using a carbon conversion factor of 0.475 (for grass and foliage components) as C per gram dry mass [39]. Finally, the NPP model results were compared with the corresponding observed NPP from the same time and location.

3. Results and Discussion

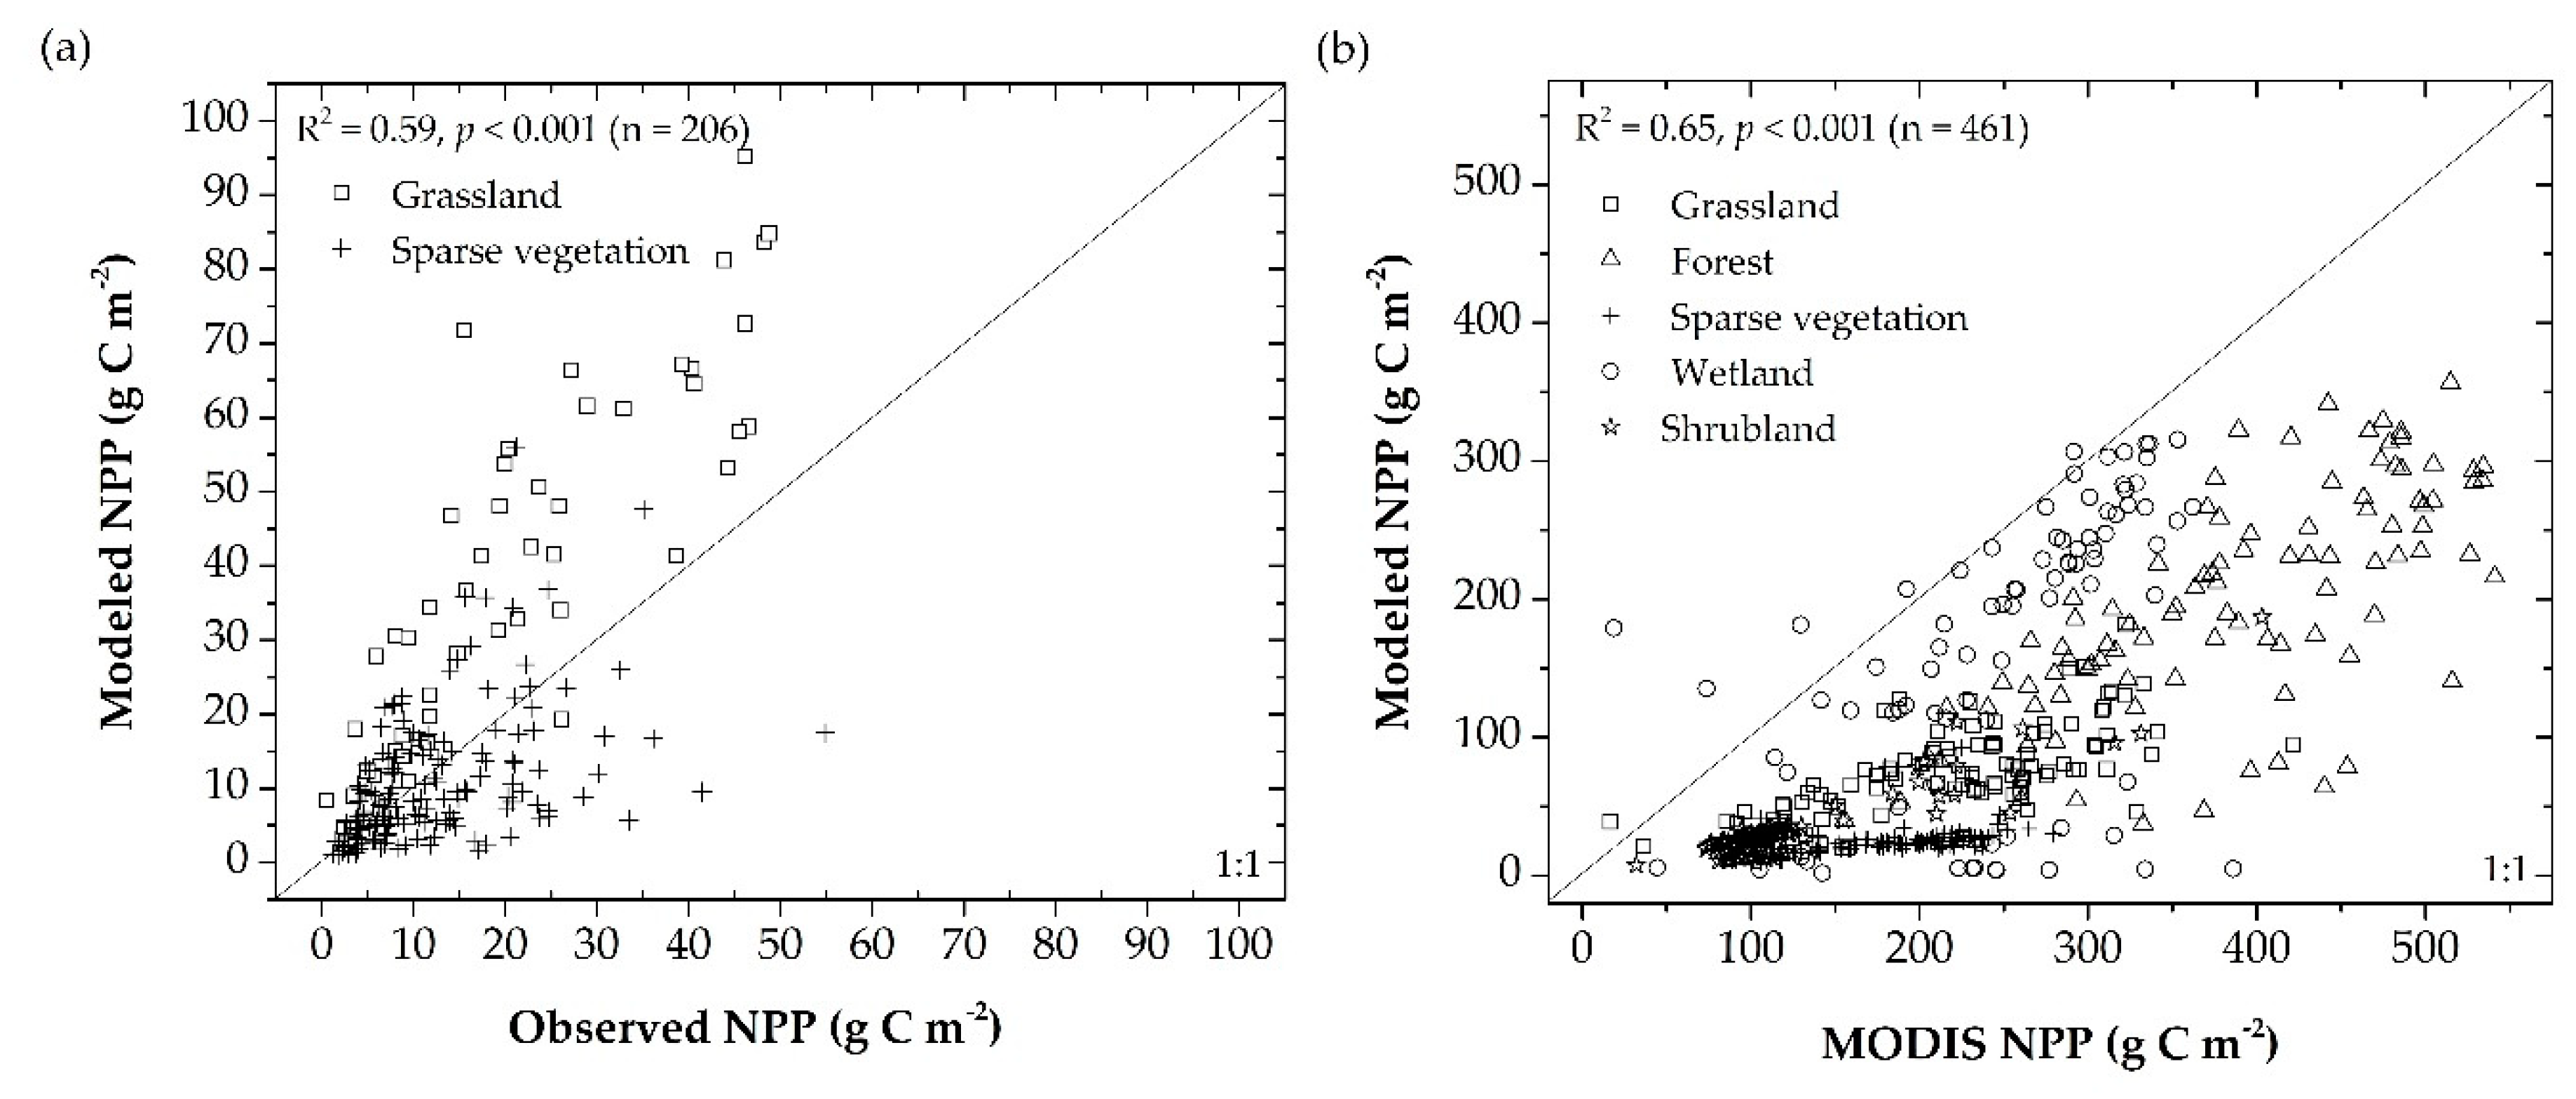
3.1. The Accuracy of Estimating NPP from the BEPS Model

The correlation analysis examined between BEPS-simulated NPP with AGB gathered from May to September for the whole study period showed a moderate positive correlation (R2 = 0.59) with root-mean-square-error (RMSE) of 13.22 g C m−2 (Figure 3a). The mean annual NPP over Mongolian rangelands was 0.1839 Pg C y−1 (1 Pg C = 1015 g C) from 2003 to 2018. However, the derived NPP of this study is smaller than previous studies by Bao et al. [47] and Li et al. [49] (NPP correspond 0.3 Pg C y−1 and 0.71 Pg C y−1, respectively. The results show discrepancies, possibly because different data input and methods were used to estimate vegetation production. For example, Bao et al. [47] have used NDVI products of 8 km spatial resolution as vegetation index, while we have used LAI of 500-m spatial resolution. In addition to that, previous studies have estimated monthly NPP using station-based monthly meteorological data. The BEPS model also considers the foliage clumping effect, which reduces sunlit leaves and increases shaded leaves. Therefore, the BEPS NPP value might be less than another model result.
Although collected field sample plots for model validation were evenly distributed across the study area, most of them have located over the grazed rangelands (e.g., grassland and sparse vegetation). Hence we used MODIS/Terra Annual NPP (MOD17A3HGF, 500 m) product [78] to validate the BEPS model result for all vegetation types, including shrubland, forest and wetland. The comparison was made over randomly selected 461 locations covering all vegetation types. A good agreement (R2 = 0.65) was found between BEPS and MODIS NPP over the study area (Figure 3b). Overall, the analyses indicated that the good efficiency of the BEPS model to estimate the NPP over Mongolian rangelands. However, the BEPS estimated NPP result was higher compared to the observed NPP, while MODIS NPP predicted much higher NPP than BEPS did in the study area (Figure 3).

3.2. NPP Spatiotemporal Distribution and Its Trends

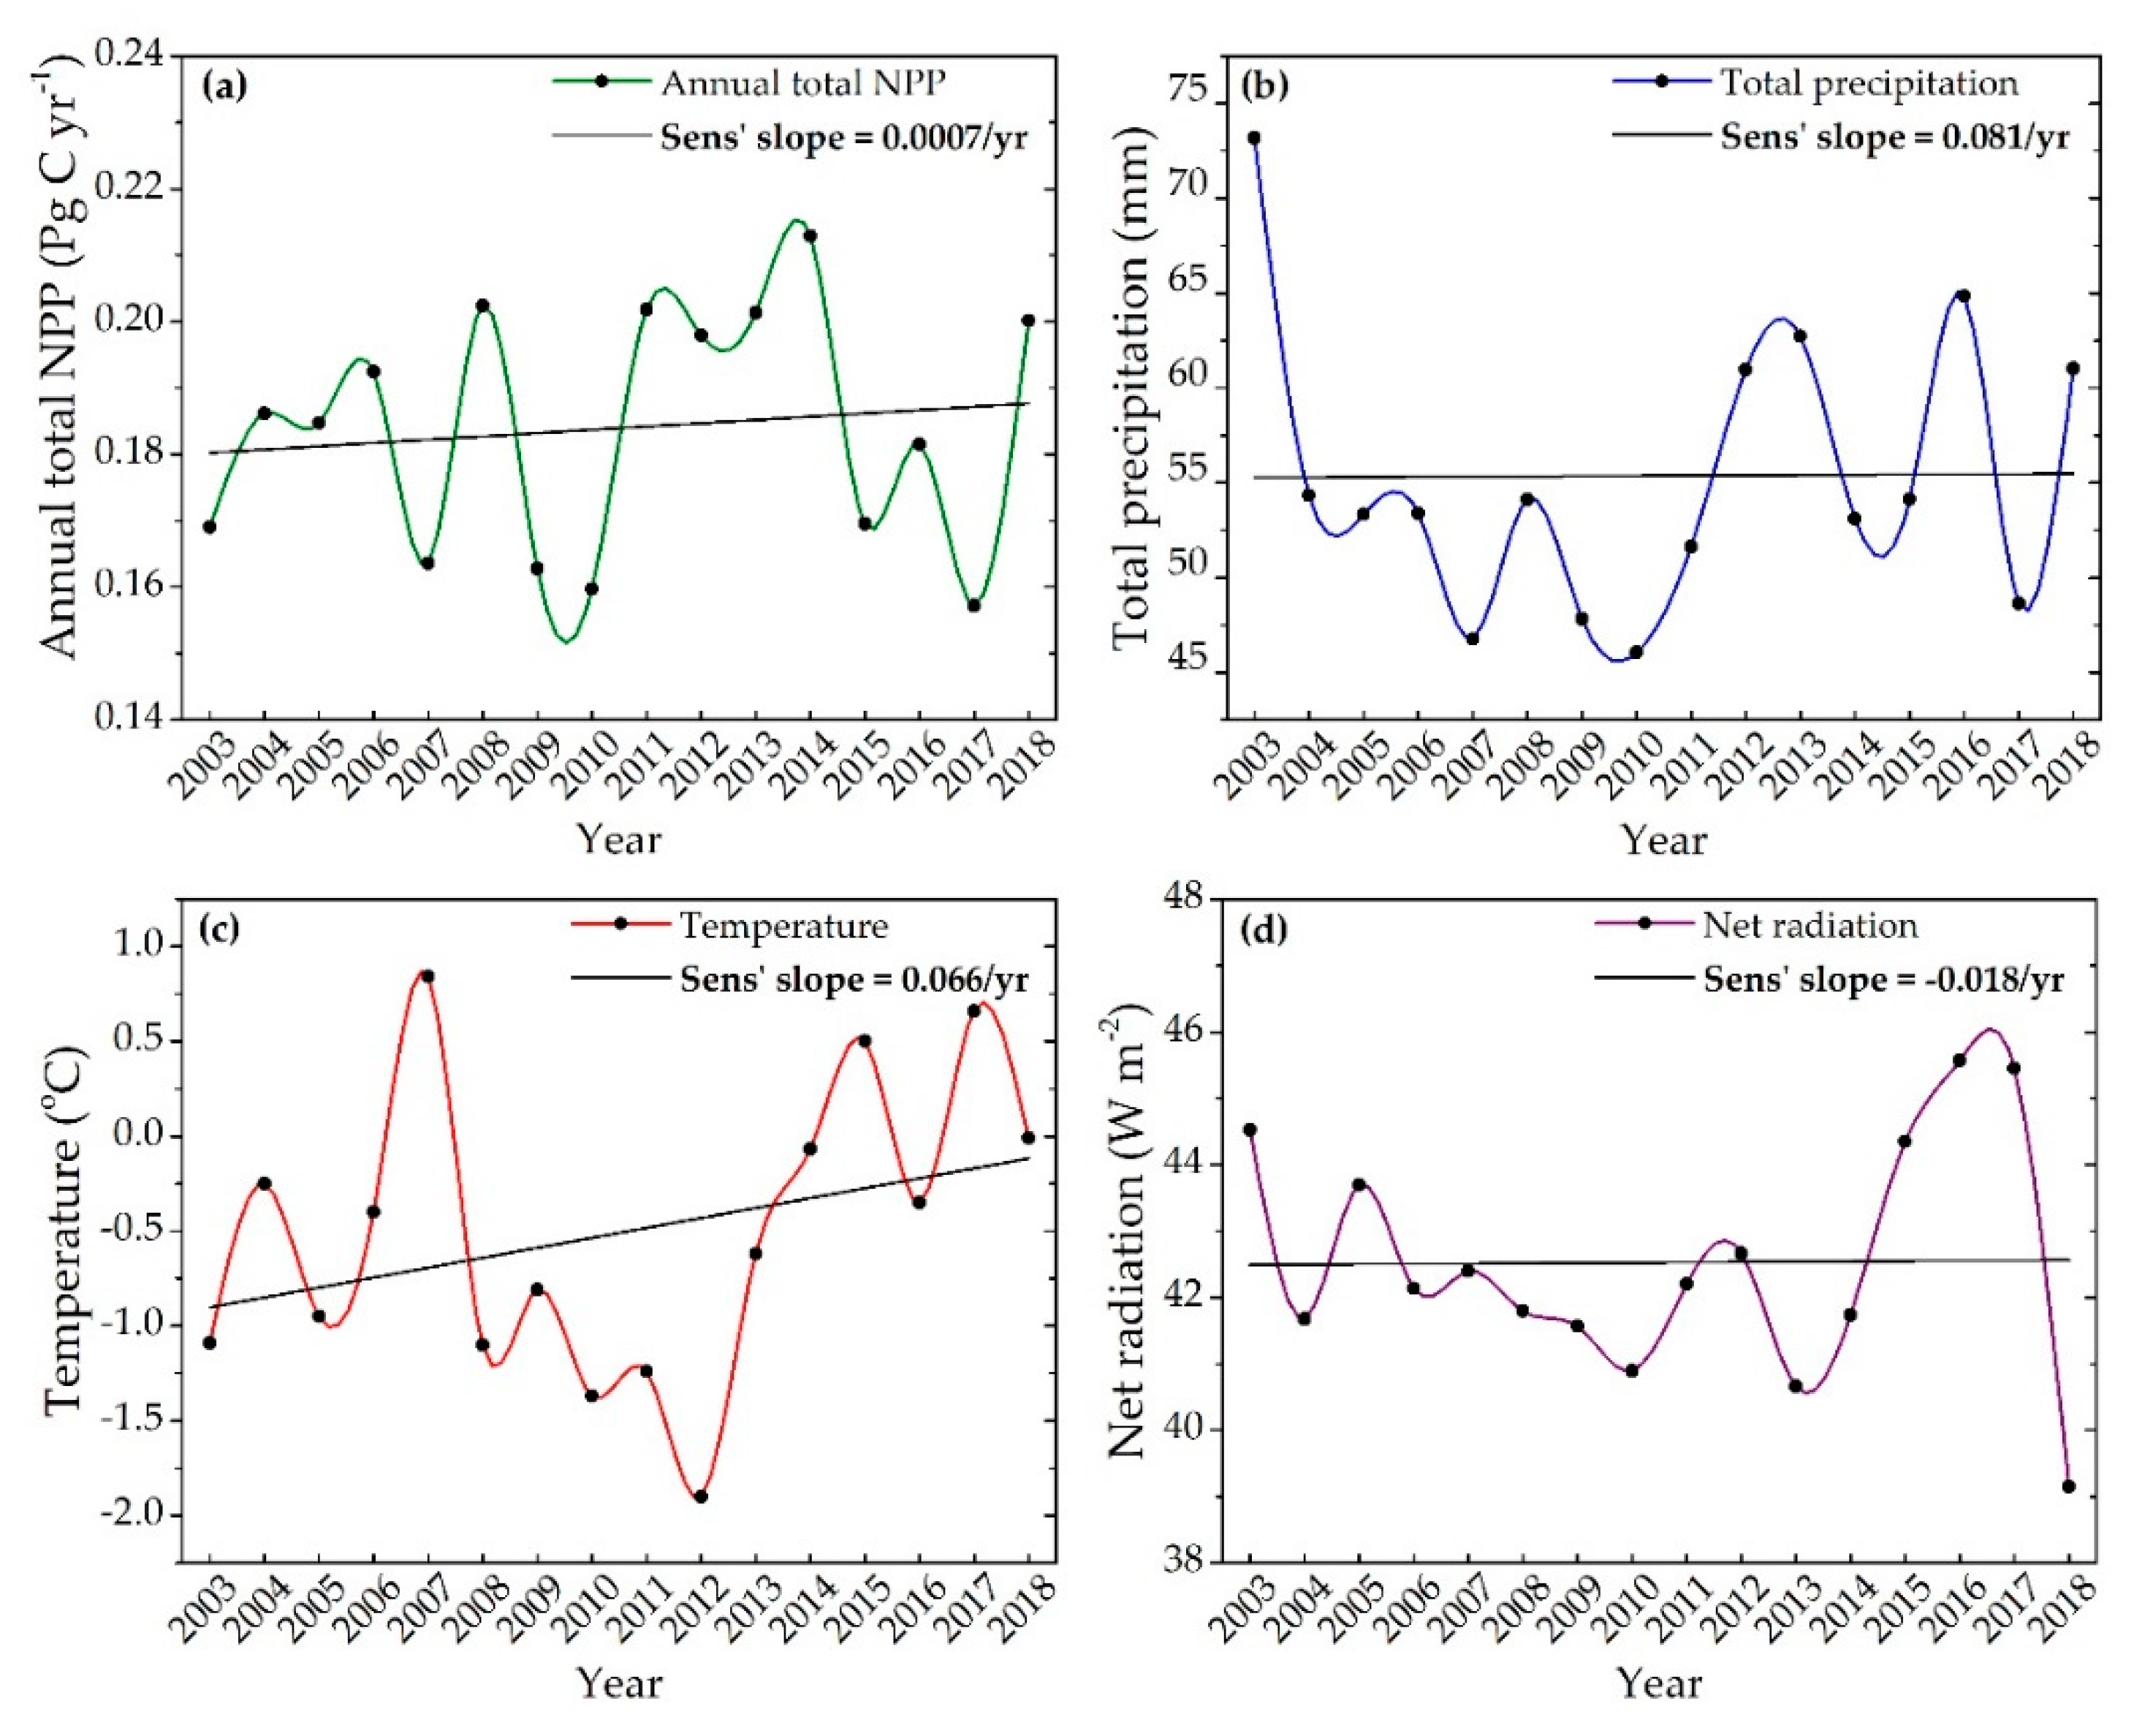
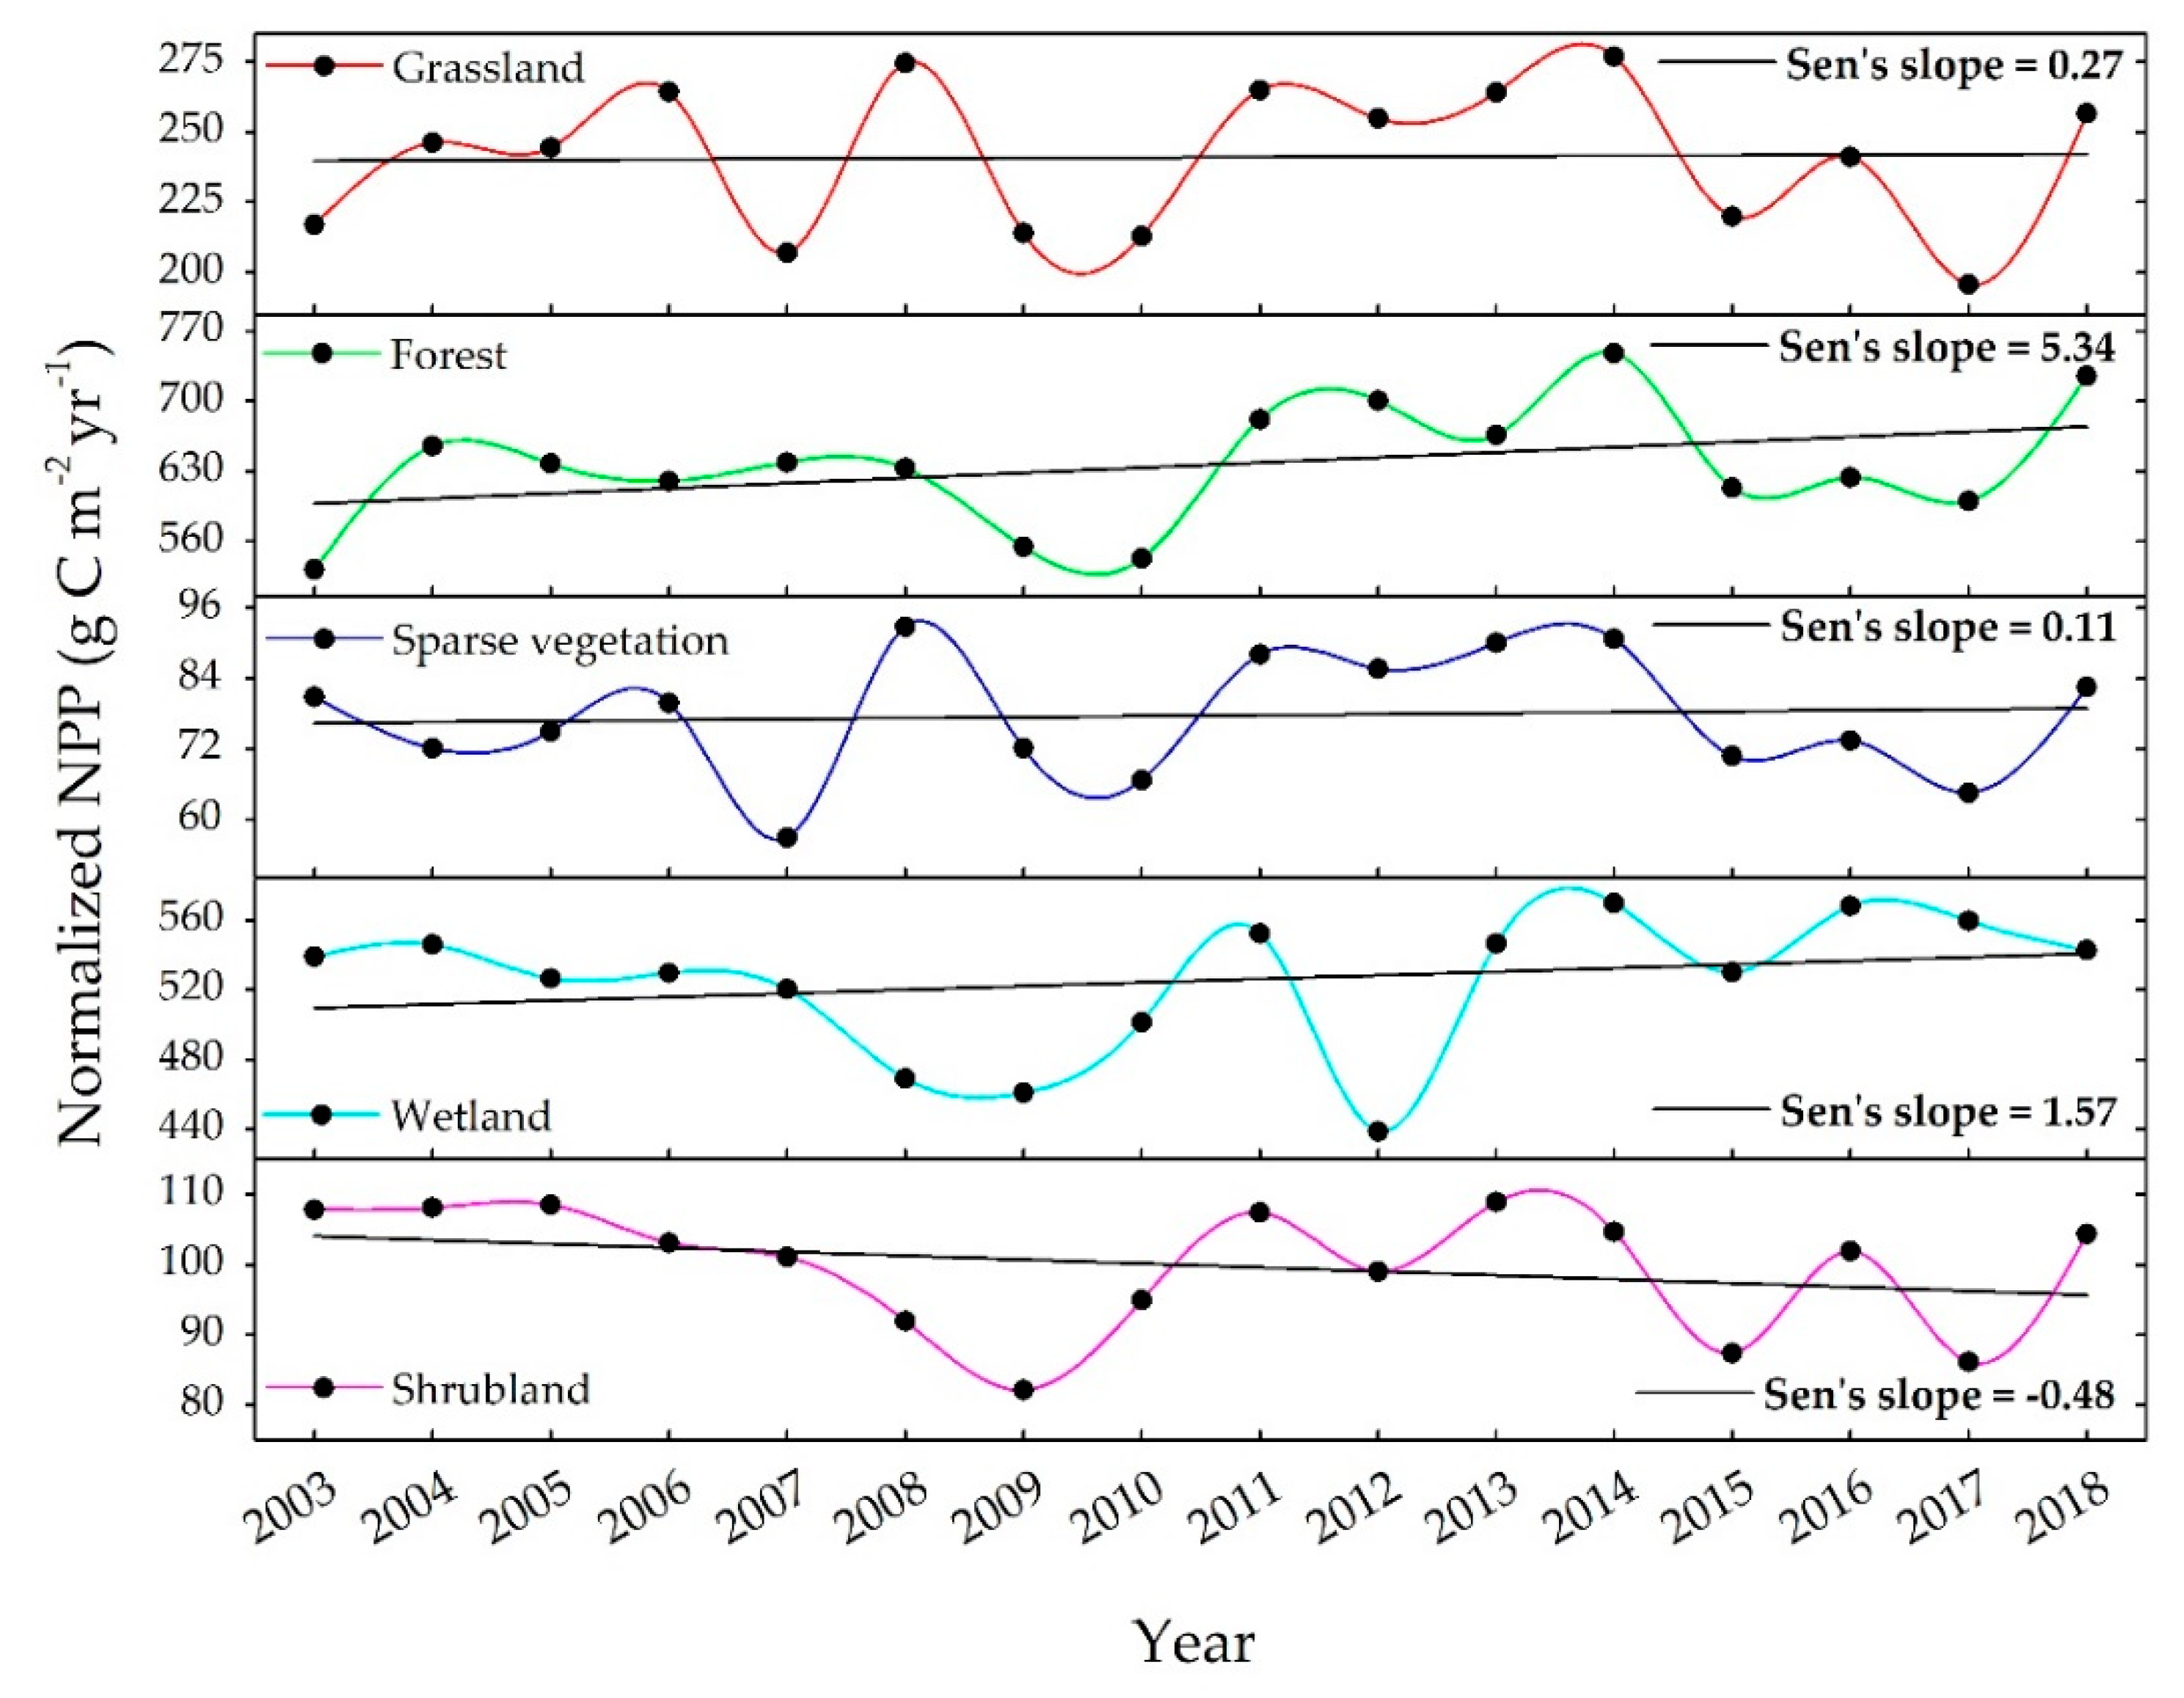
3.2.1. Inter-Annual Variations in NPP

The mean annual NPP’s spatial distribution over Mongolia from 2003 to 2018 was estimated (Figure 4). NPP spatially increases from the south to the north. While the minimum NPP was estimated over sparse vegetation in the south, the maximum NPP was concentrated over forested areas in the north. The spatial and temporal NPP trends based on the Mann–Kendall test and the Sen’s slope have presented in Figure 4b and Figure 5a. During the study period, the annual NPP across Mongolia has increased in 59% of total vegetated areas (up to 13.74 g C m−2) where the Mann–Kendall test indicates increment was not significant (Figure 4b). A decreasing trend was found in about 41% of the vegetated areas (up to –14.75 g C m−2), and 7.66% of them were significantly decreased for the spatial dimension. The increasing NPP trend in the region indicates that the vegetation has played an increasing role in carbon sequestration. This is consistent with the study of Li et al. [79], who reported that the NPP of middle and high latitude regions generally increased from 1961 to 2010. Li et al. [79] also noted that climate change was the second most crucial factor that controls global terrestrial NPP’s inter-annual variability after atmospheric carbon dioxide. By contrast, Nemani et al. [80] suggested that climatic parameters mainly determine the global terrestrial NPP: temperature, precipitation, and net radiation; are the main affecting parameters of the inter-annual variability of NPP. Our research considered the 16-y datasets of climatic parameters: temperature, precipitation, and net radiation were used to explore the patterns of inter-annual variability of NPP (Figure 5b–d). As shown in Figure 5a, the annual NPP has slightly increased from 0.169 Pg C y−1 in 2003 to 0.20 Pg C y−1 in 2018, with an annual increase of 0.0007 Pg C (p-value = 0.82). This can be attributed to the annual total precipitation and mean temperature slightly increased over the study period (with an average of 0.081 mm per year, 0.066 °C per year, respectively), while net radiation decreased by −0.018 W/m−2 per year from 2003 to 2018 (Figure 5b–d). This finding is also consistent with that of a previous study, which showed that overall trends of average annual temperature and precipitation have been increasing worldwide from 2000 to 2014 [81]. In addition, the ESA land cover map showed barren land has decreased over the study period, also supported by [82], and the vegetated area has increased. This land-use change could be a reason that annual NPP has risen slightly in the study area. Moreover, the annual NPP variation is probably due to changes in the vegetation growing season length in Mongolia [83].
Specifically, lower NPP was found in 2007, 2009, 2010, and 2017 which were attributed to the combined effect of temperature, solar radiation, and precipitation. For example, high temperature and low rainfall were observed in 2007, 2009, 2010, and 2017, which inevitably brought about low NPP values for Mongolian rangelands (Figure 5b–d). Some studies have mentioned that droughts’ influences certainly led to a decrement in NPP [84,85,86,87]. Recent research has also confirmed that Mongolia has experienced frequent droughts [24] and warming over the last two decades, which has reduced aboveground biomass by 20% to 65% [87].
At the vegetation type level, the NPP exhibited large variations across five major vegetation types (Table 2). The forest has the highest NPP with an average value of 195.23 g C m−2 y−1 than other vegetation types. The accumulated annual NPP of the forest was less than grassland (0.05268 Pg C) because the forest only covers 10.83% of the vegetated lands. A large area of the country covered by grassland (41.74%) has the highest annual NPP (0.07693 Pg C). While the dominant rangeland type is the sparse vegetation (45.76%), its annual NPP was only 0.02717 Pg C (Table 2).
To further differentiate the NPP trends of different vegetation types, we performed a statistical analysis to derive annual NPP values per unit area. Annual NPP per square meter for different vegetation types differed greatly, and forest showed the highest annual NPP with an average value of 635.97 g C m−2 y−1 during the last 16 years (Figure 6). Wetland vegetation had a slightly lower NPP than the forest, with an average value of 525.07 g C m−2 y−1. The grassland NPP was about 241 g C m−2 y−1, while shrubland and sparse vegetation were almost lower than 100 g C m−2 y−1 from 2003 to 2018.
Normalized NPP by land cover areas showed increment by 0.27, 5.34, 1.57, and 0.11 g C m−2 y−1 in grassland, forest, wetland, and sparse vegetation, respectively; while NPP in shrubland vegetation decreased by -0.48 g C m−2 y−1 (Figure 6). However these NPP trends were not statistically significant, and the NPP fluctuated due to the changes in climatic parameters. For example, grassland and sparse vegetation NPP were lower during the dry years (2007/2009/2010/2017), reflecting these two vegetation types are more sensitive to climatic parameters. All vegetation types show depressed NPP in 2009 and 2010, which mainly correspond with less precipitation and higher temperature, while net radiation was average. In contrast, high NPP values were observed in 2014 for all vegetation types, which was also the wettest year of the study period.

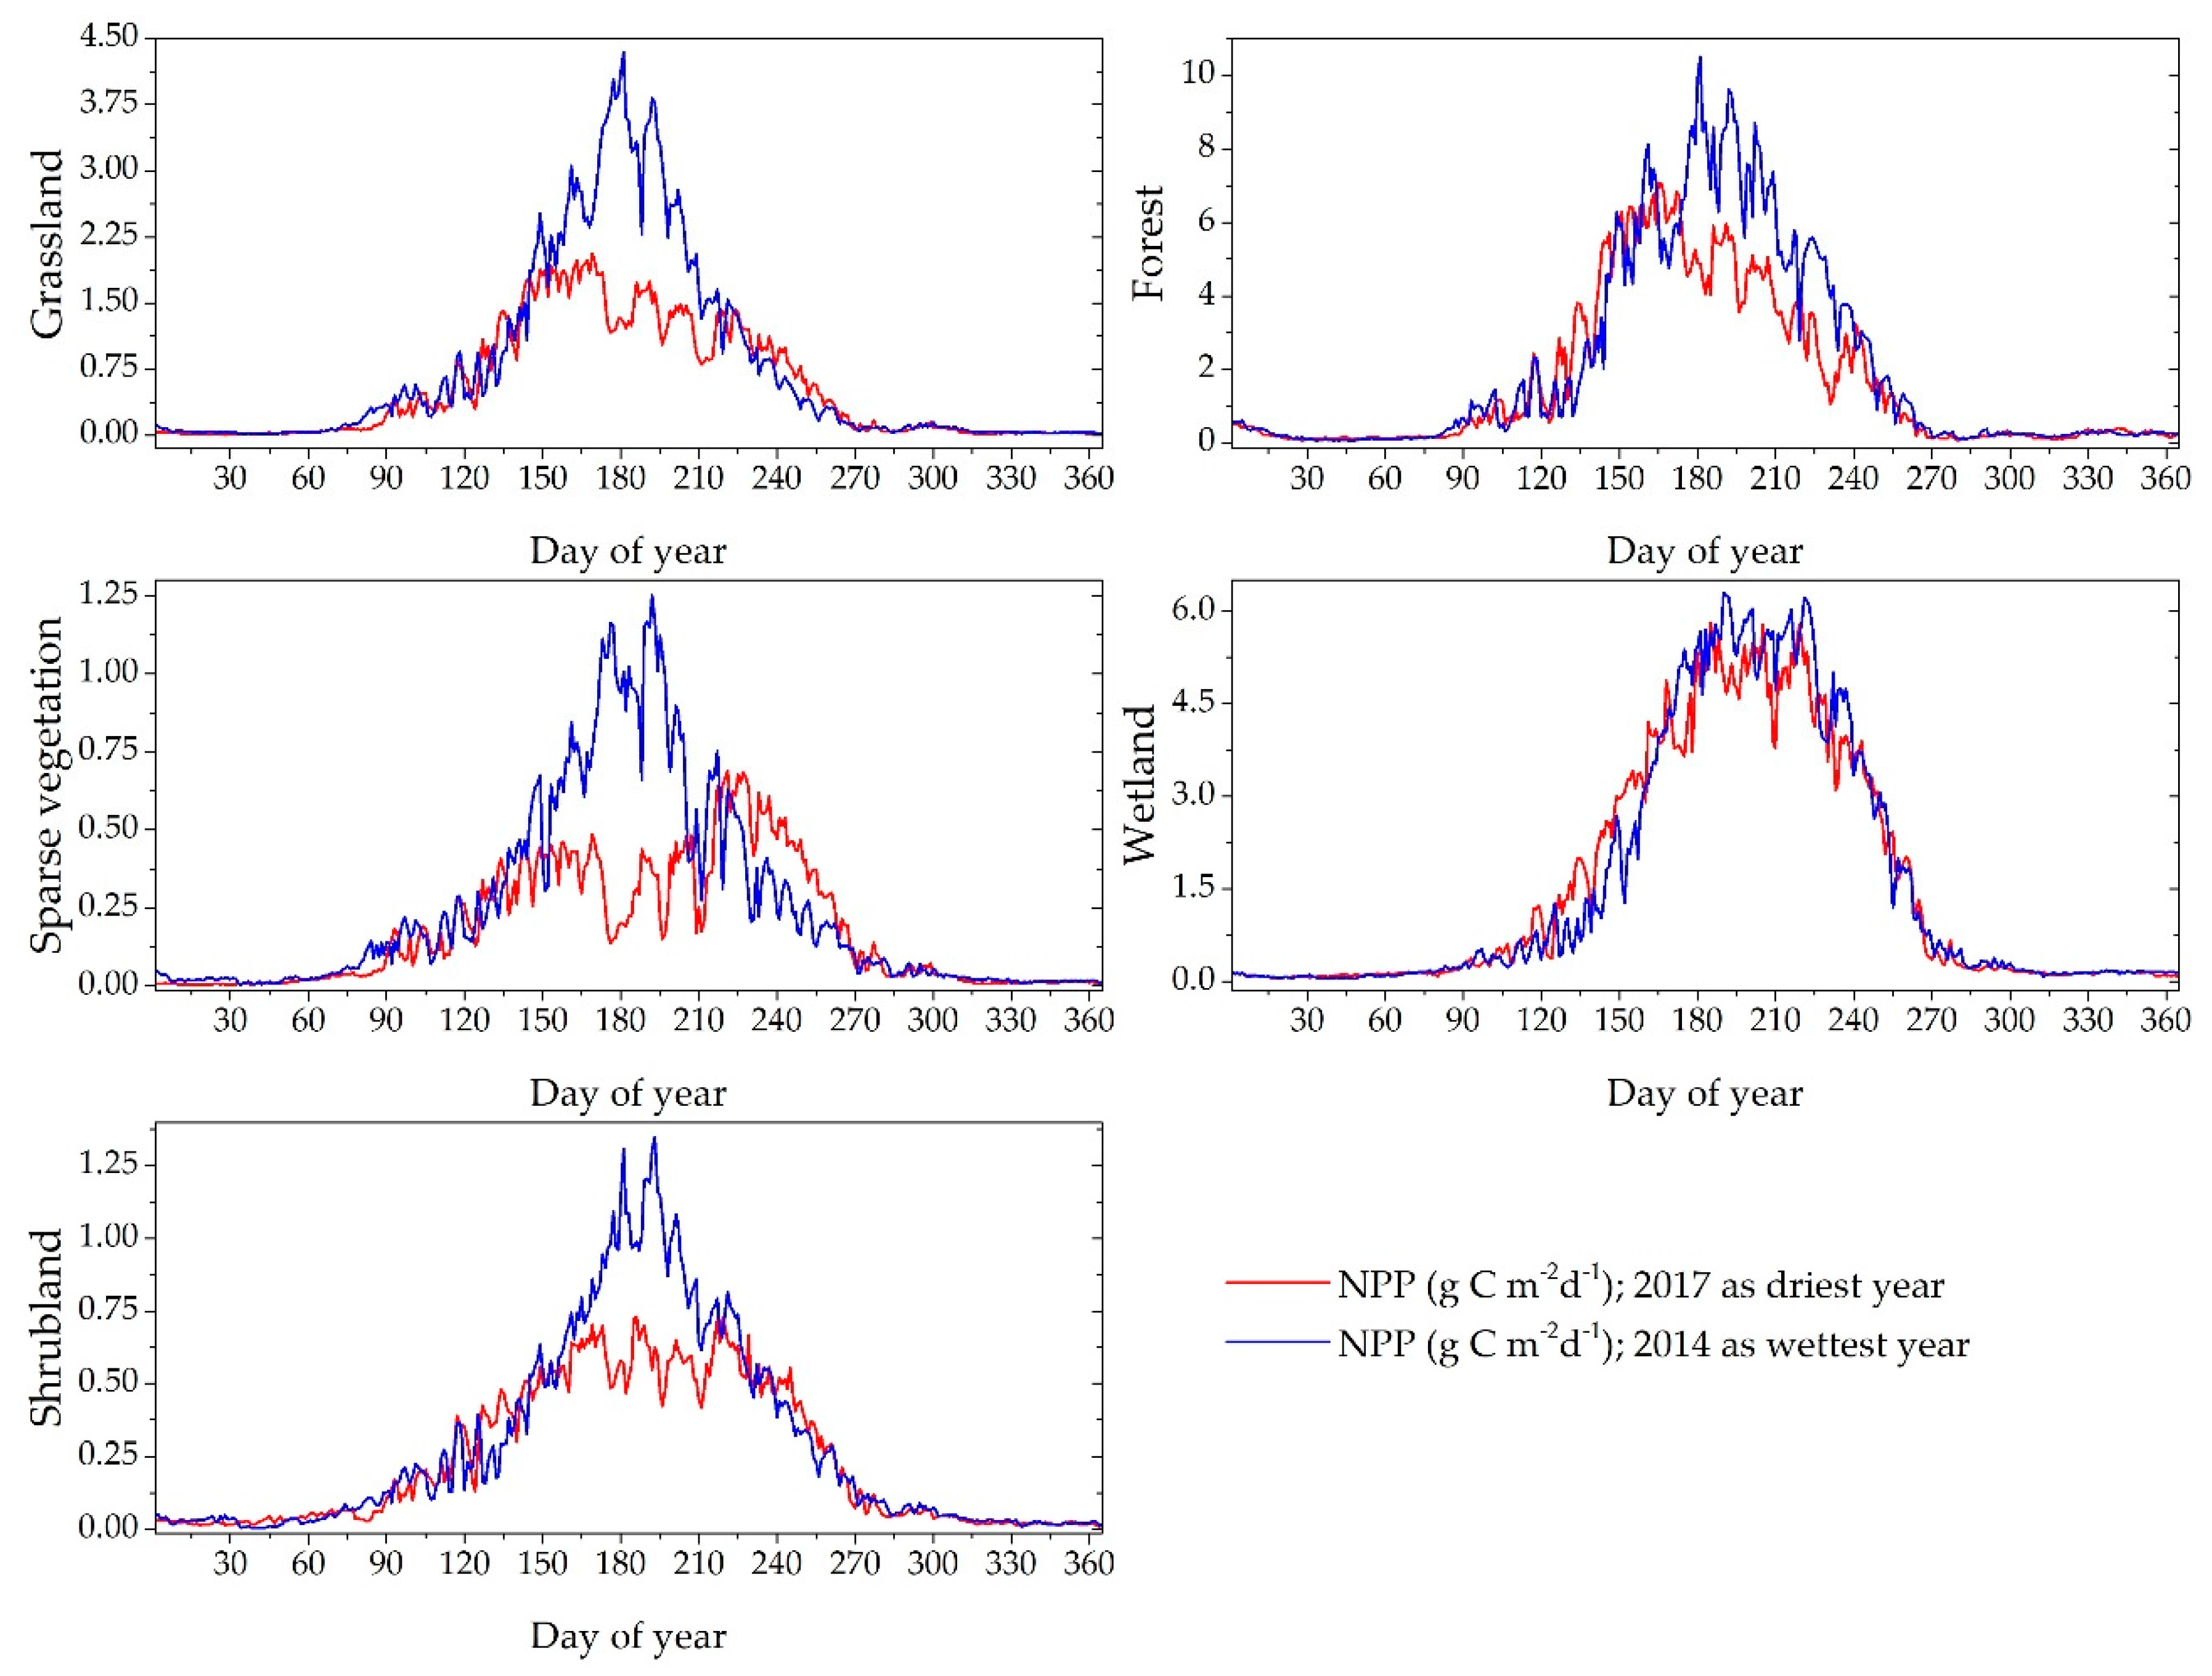
3.2.2. Seasonal NPP Variations by Vegetation Types

Furthermore, the statistical analysis was performed to understand seasonal variation in two contrasting (dry and wet) years for the five land cover types because seasonality is a dominant characteristic of most ecosystems. There was an apparent seasonal vegetation NPP pattern depicted in Figure 7: low and stable from October to April of each year, and high in summer, which coincided with the growing season from May to September. A large variation in the growing season NPP was found between dry and wet years, particularly in grassland, sparse vegetation and shrubland. This further verifies that these vegetation types are susceptible to climatic parameters than others. On the other hand, the wetland has less NPP difference among dry and wet years followed by forest, which can be attributed to soil and vegetation water content. Among other vegetation types, sparse vegetation was not following the general NPP trend of the growing season in the dry year, while it soared when NPP in other land cover types started declining (Figure 7).

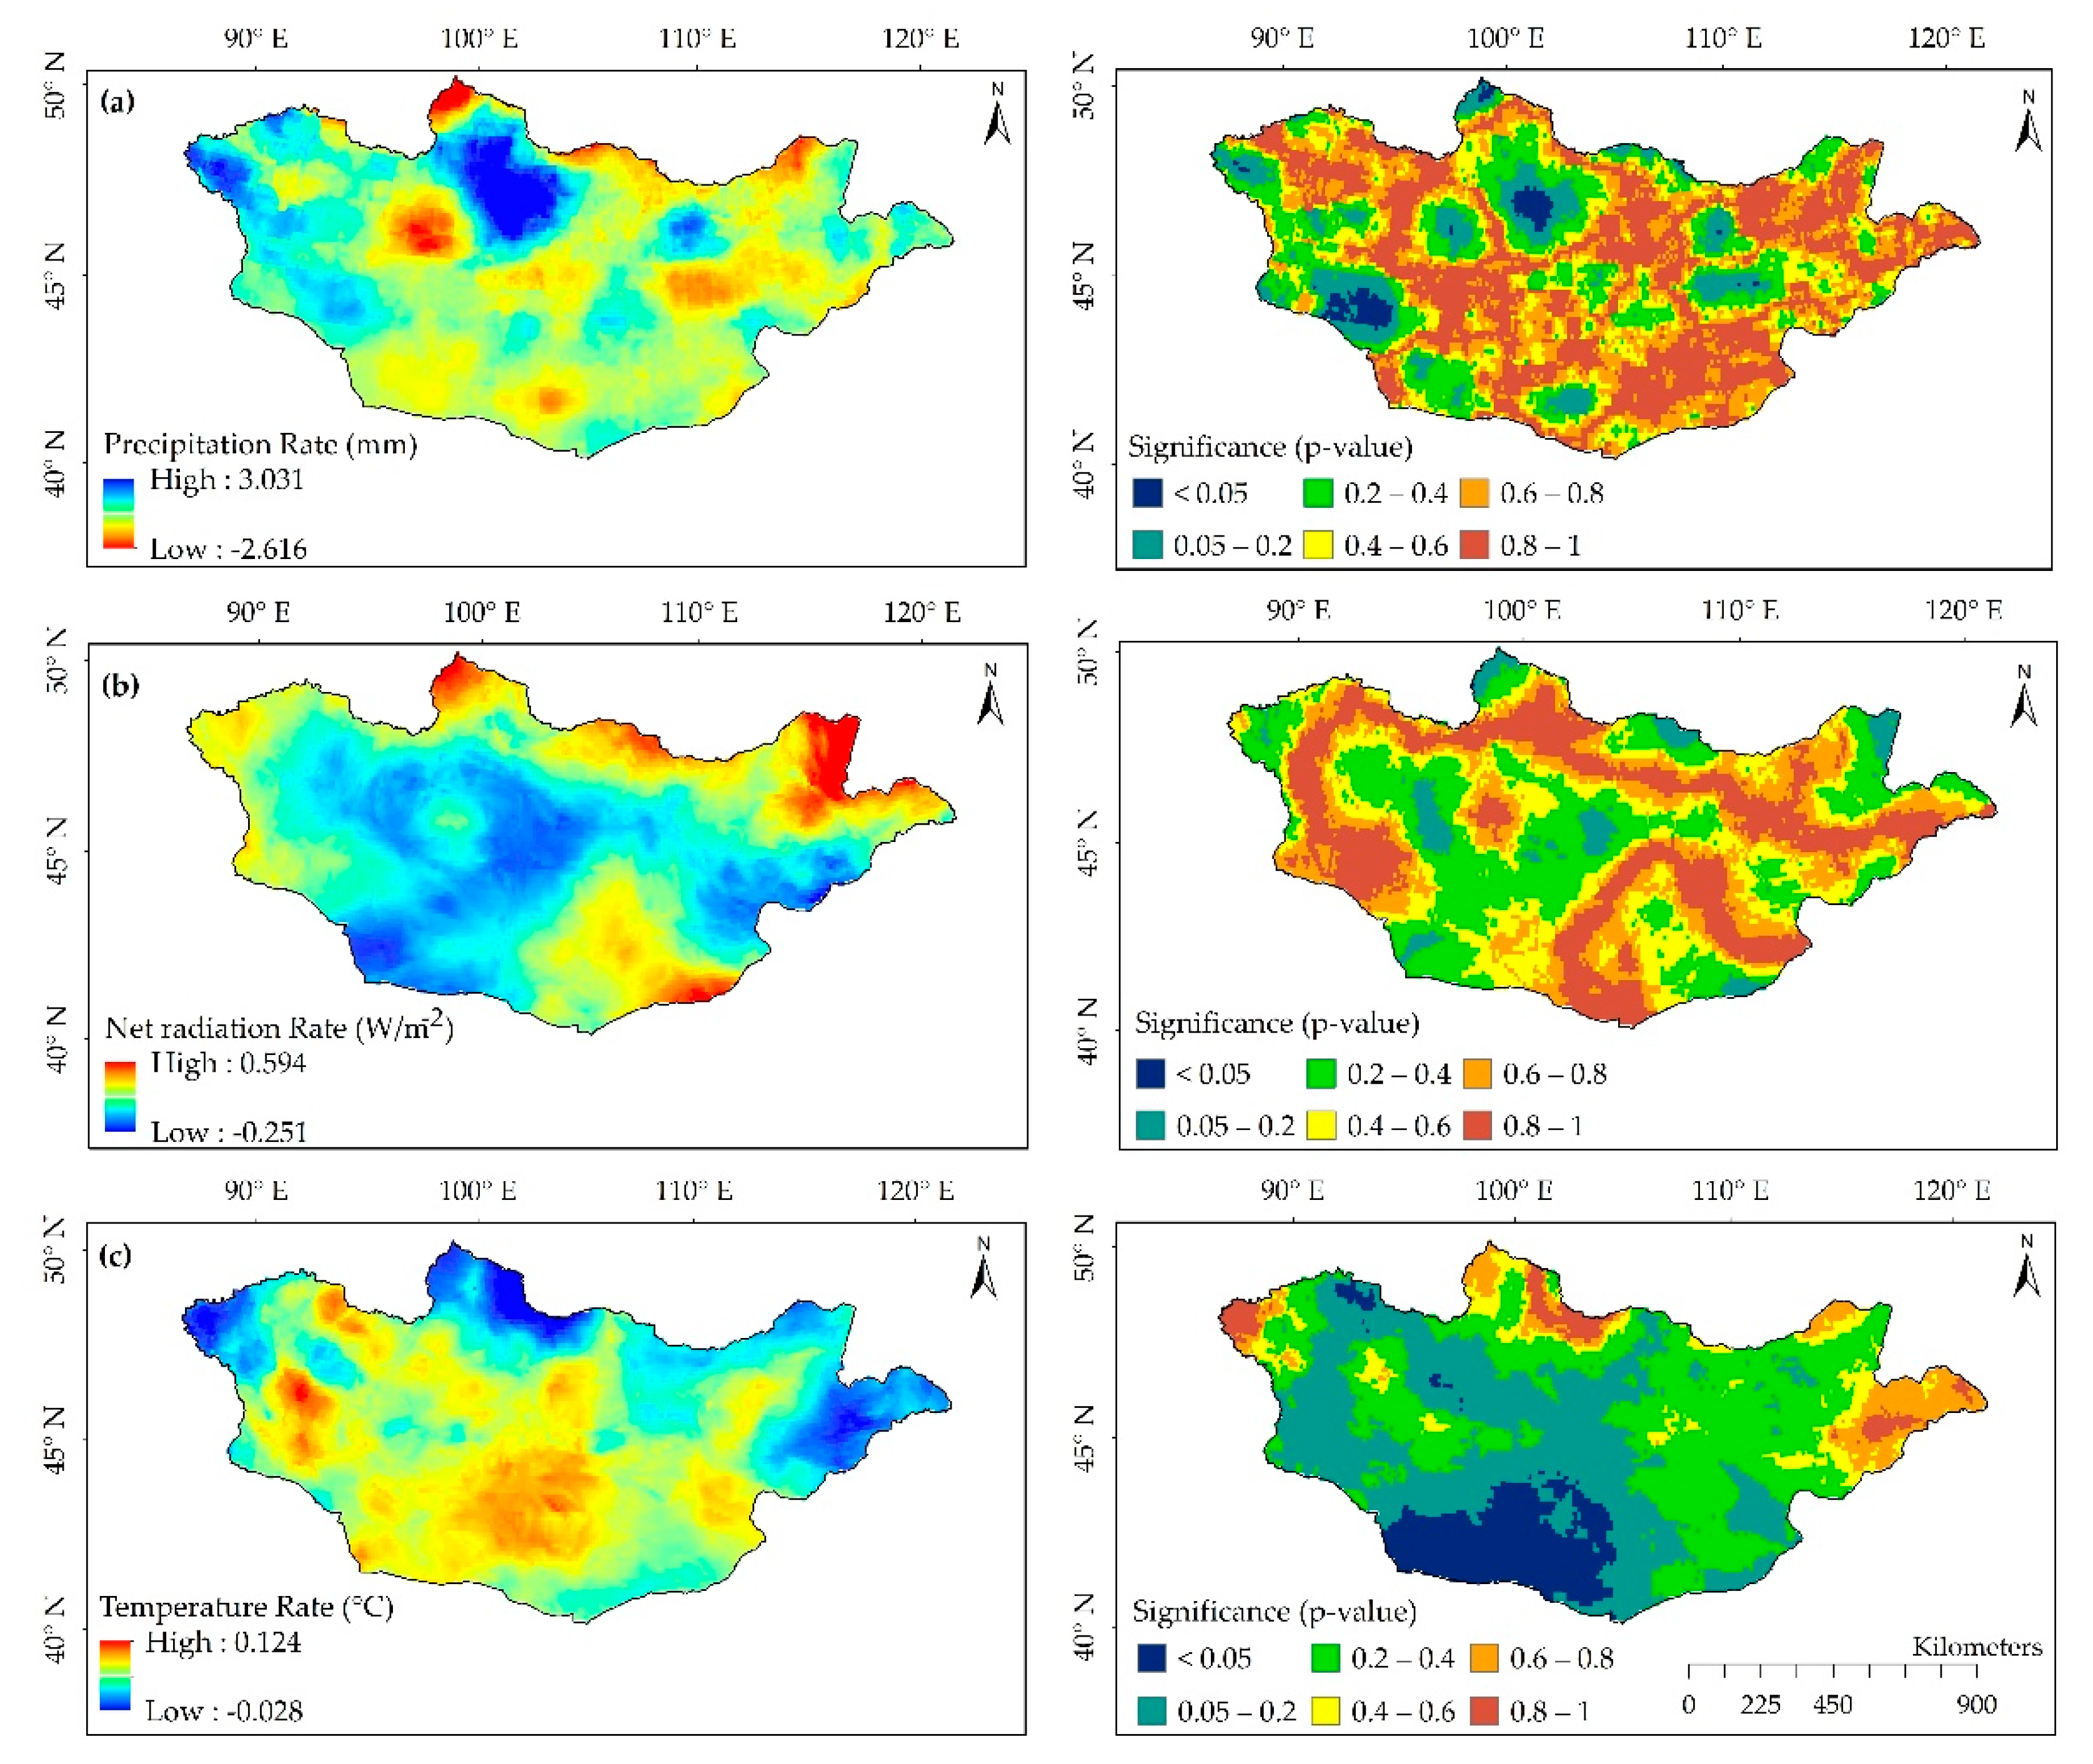
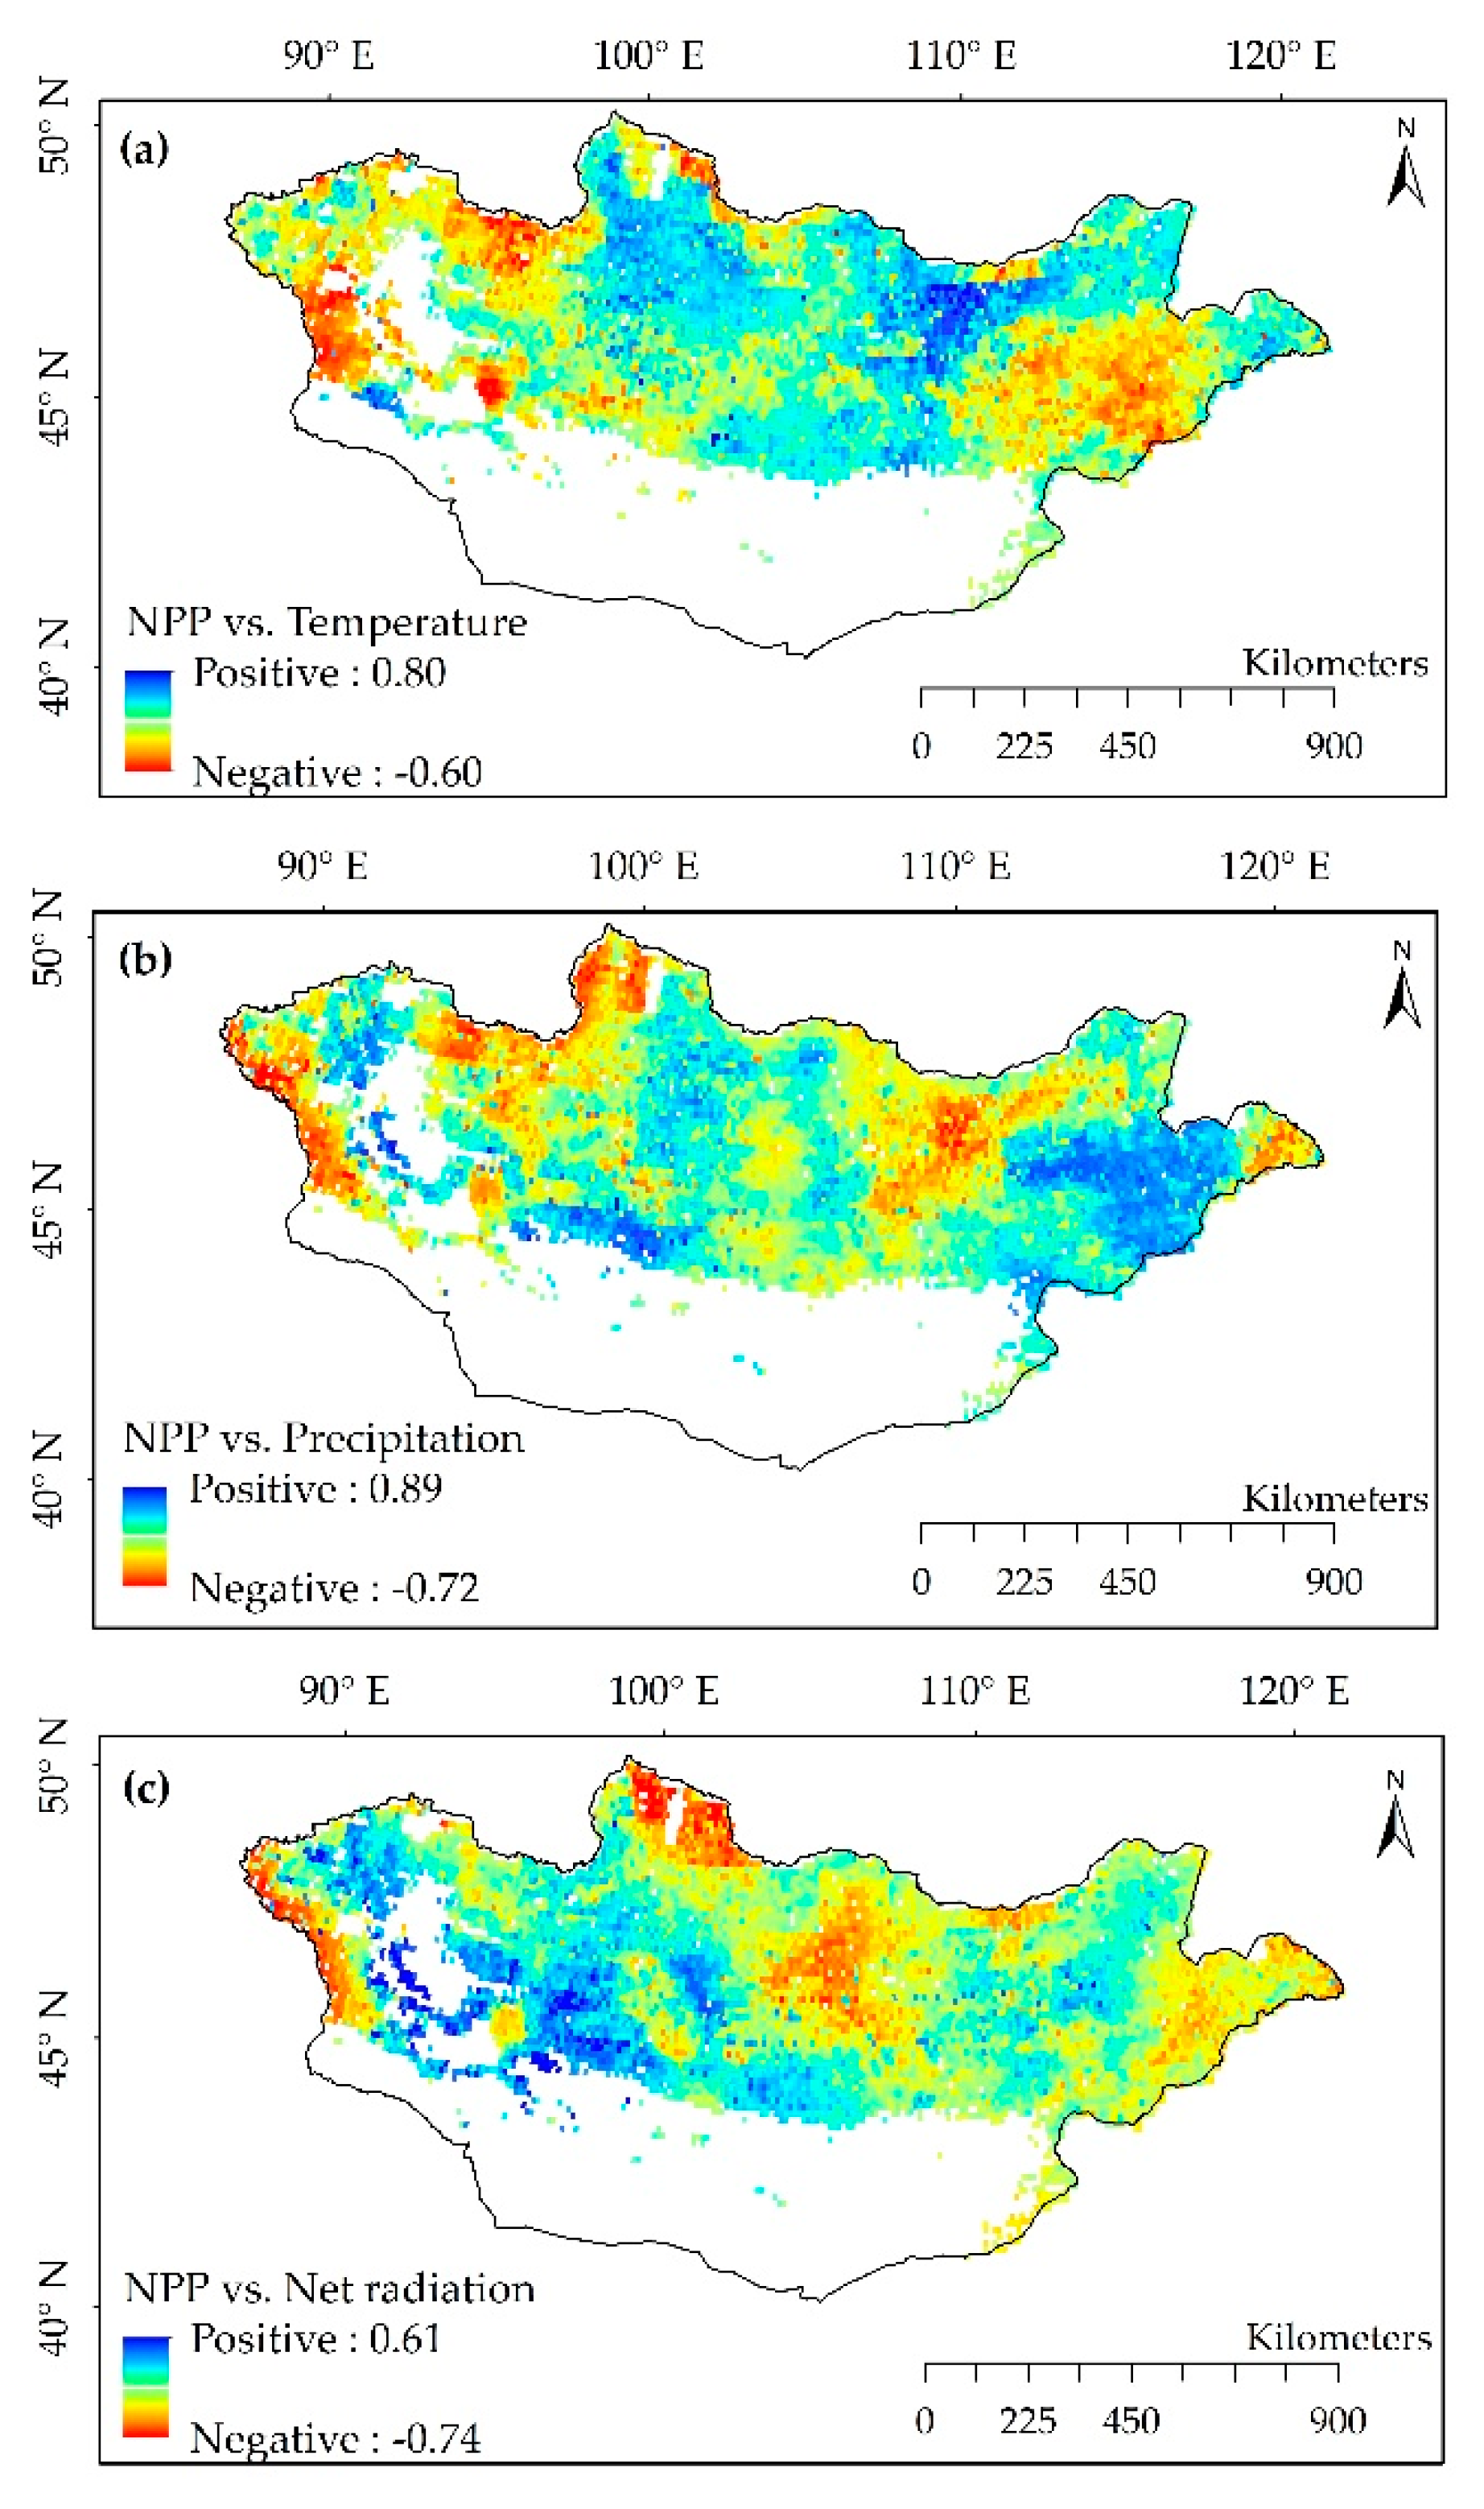
3.2.3. The Spatiotemporal Correlation between NPP and the Driving Parameters

Since the growing season lasts from May to September, we focused only on the growing season (121st to 273rd day of the year) for the relationships between daily NPP and climatic parameters. At a regional scale, temperature showed the highest correlation with daily NPP (r = 0.904), followed by precipitation (r = 0.770) and net radiation (r = 0.745). Some studies revealed that precipitation was an important parameter influencing NPP than temperature [48,49], but we found the temperature was the dominant parameter on NPP in the entire Mongolian rangelands compared to precipitation and net radiation. Different temporal scales of previous studies (mean growing season NPP) and the present study (daily NPP) might explain this discrepant concern.
In terms of NPP over all vegetation types, the temperature was also a dominant climatic parameter, followed by precipitation except in forest and grassland, where net radiation remains the second dominant parameter (Table 3). Though different vegetation NPP responses to precipitation diverse, precipitation played a crucial role after temperature to determine NPP in grassland, shrubland, and sparse vegetation. In the forest and wetland, net radiation was the second dominant climatic parameter after temperature. Because water stress is less significant in the forest and wetland since they have enough water content, and it needs a suitable temperature for grow vegetation.
Although the temporal correlation between daily NPP and climatic parameters was positive, the spatial correlation analysis indicated negative correlations for temperature, precipitation, and net radiation, which account for 28.4%, 24.5%, and 67.32% of the vegetated lands, respectively. Annual NPP was positively correlated with temperature over central parts of Mongolia, while it was moderately correlated with net radiation in the northeast (Figure 8a,c). This could be attributed to the increased precipitation and decreased temperature in particular regions (Appendix A Figure A1a,c), where annual NPP was showed an increasing trend (Figure 4b). This is primarily attributed to the fact that these regions experience a lower mean temperature and high precipitation, which was also found by previous studies [24,47]. A similar finding was obtained over northern China, where a positive correlation between NPP and net radiation and temperature was observed [88].
Meanwhile, the correlation between NPP and precipitation was negative over northwestern parts (indicated by red color in Figure 8b), where temperature highly tended to increase with a decrement of the net radiation (Figure A1b,c). These conditions could lead to plant water scarcity caused by accelerated evaporation, which would work against vegetation growth. This existing negative correlation was possibly either due to previous-year precipitation or available annual plants [89]. On the other hand, the area with a positive correlation in east Mongolia can be attributed to perennial plants.

4. Conclusions

The spatiotemporal variation of NPP and its correlation with the climatic parameters (net radiation, temperature, and precipitation) during 2003–2018 in Mongolia were investigated to highlight the most vulnerable rangeland types to climatic parameters. The major conclusions as follows:
  • The validation of BEPS model against observed NPP showed its high accuracy in estimating daily NPP over the study period. The model results showed a high agreement with MODIS NPP product. This confirms the efficiency of the BEPS model in estimating NPP over Mongolian rangelands.
  • Annual NPP showed a slightly increasing trend from 0.169 Pg C y−1 in 2003 to 0.20 Pg C y−1 in 2018, with an annual increase of 0.0007 Pg (0.68 g C per meter square). In terms of vegetation types, grassland, forest, wetland, and sparse vegetation NPP has increased by 0.27, 5.34, 1.57, and 0.11 g C m−2 y−1, respectively; while NPP of shrublands has decreased by −0.48 g C m−2 y−1.
  • The dynamic changes of annual NPP of all rangeland types were mainly driven by variation in precipitation and temperature; particularly grassland, shrubland, and sparse vegetation were found to be more susceptible to fluctuations in climate parameters than other rangeland types.
  • Among all rangeland types, the NPP pattern along the growing season over forest and wetland was relatively stable between dry and wet years, while a significant reduction in estimated NPP was found during the dry years compared to wet years over grassland, shrubland, and sparse vegetation.

Author Contributions

J.Z., conceptualization, funding acquisition; L.N., data curation, writing—original draft preparation, software, methodology, validation, formal analysis; G.B., investigation; T.P.P.S., writing—reviewing and editing; U.A.K., methodology, software; J.W., methodology, software; M.N., writing—reviewing and editing. All authors have read and agreed to the published version of the manuscript.

Funding

This research was funded by the CAS Strategic Priority Research Program (No. XDA19030402), the National Natural Science Foundation of China (No. 41871253, 31671585), Taishan Scholar Project of Shandong Province.

Acknowledgments

This study was supported by the CAS Strategic Priority Research Program (No. XDA19030402), the National Natural Science Foundation of China (No. 41871253, 31671585), Taishan Scholar Project of Shandong Province. The authors would like to thank you for the valuable comments on the manuscript provided by the chief editor and anonymous reviewers. Authors would like to thank Foyez Ahmed Prodhan from Bangladesh for his valuable contribution in this manuscript.

Conflicts of Interest

The authors declare no conflict of interest.

Appendix A

Figure A1. Trends of (a) temperature and its significance level (p-value); (b) precipitation and its significance level (p-value); and (c) net radiation and its significance level (p-value) from 2003 to 2018.
Agronomy 11 00647 g0a1

References

  1. Polley, H.W.; Bailey, D.W.; Nowak, R.S.; Stafford-Smith, M. Ecological Consequences of Climate Change on Rangelands. In Rangeland Systems Processes, Management and Challenges; Springer Series on Environmental Management; Springer: Cham, Swityerland, 2017; pp. 229–260. [Google Scholar]
  2. Reid, R.S.; Fernández-Giménez, M.E.; Galvin, K.A. Dynamics and Resilience of Rangelands and Pastoral Peoples Around the Globe. Ann. Rev. 2014, 39, 217–242. [Google Scholar] [CrossRef]
  3. Mccollum, D.W.; Tanaka, J.A.; Morgan, J.A.; Mitchell, J.E.; Fox, W.E.; Maczko, K.A.; Hidinger, L.; Duke, C.S.; Kreuter, U.P. Climate Change Effects on Rangelands and Rangeland Management: Affirming the Need for Monitoring. Ecosyst. Health Sustain. 2017, 3, e01264. [Google Scholar] [CrossRef] [Green Version]
  4. Angerer, J.; Han, G.; Fujisaki, I.; Havstad, K. Climate Change and Ecosystems of Asia With Emphasis on Inner Mongolia and Mongolia. Rangelands 2008, 30, 46–51. [Google Scholar] [CrossRef] [Green Version]
  5. Li, S.-G.; Asanuma, J.; Eugster, W.; Kotani, A.; Liu, J.-J.; Urano, T.; Oikawa, T.; Davaa, G.; Oyunbaatar, D.; Sugita, M. Net Ecosystem Carbon Dioxide Exchange over Grazed Steppe in Central Mongolia. Glob. Chang. Biol. 2005, 11, 1941–1955. [Google Scholar] [CrossRef]
  6. Hilker, T.; Natsagdorj, E.; Waring, R.H.; Lyapustin, A.; Wang, Y. Satellite Observed Widespread Decline in Mongolian Grasslands Largely Due to Overgrazing. Glob. Chang. Biol. 2014, 20, 418–428. [Google Scholar] [CrossRef] [Green Version]
  7. Liu, Y.Y.; Evans, J.P.; McCabe, M.F.; de Jeu, R.A.M.; van Dijk, A.I.J.M.; Dolman, A.J.; Saizen, I. Changing Climate and Overgrazing Are Decimating Mongolian Steppes. PLoS ONE 2013, 8, e57599. [Google Scholar] [CrossRef] [PubMed] [Green Version]
  8. Cheng, Y.; Tsubo, M.; Ito, T.Y.; Nishihara, E.; Shinoda, M. Impact of Rainfall Variability and Grazing Pressure on Plant Diversity in Mongolian Grasslands. J. Arid Environ. 2011, 75, 471–476. [Google Scholar] [CrossRef]
  9. Wesche, K.; Ronnenberg, K.; Retzer, V.; Miehe, G. Effects of Large Herbivore Exclusion on Southern Mongolian Desert Steppes. Acta Oecologica 2010, 36, 234–241. [Google Scholar] [CrossRef]
  10. Miao, L.; Fraser, R.; Sun, Z.; Sneath, D.; He, B.; Cui, X. Climate Impact on Vegetation and Animal Husbandry on the Mongolian Plateau: A Comparative Analysis. Nat. Hazards 2016, 80, 727–739. [Google Scholar] [CrossRef]
  11. Sankey, T.T.; Sankey, J.B.; Weber, K.T.; Montagne, C. Geospatial Assessment of Grazing Regime Shifts and Sociopolitical Changes in a Mongolian Rangeland. Rangel. Ecol. Manag. 2009, 62, 522–530. [Google Scholar] [CrossRef]
  12. Khishigbayar, J.; Fernández-Giménez, M.E.; Angerer, J.P.; Reid, R.S.; Chantsallkham, J.; Baasandorj, Y.; Zumberelmaa, D. Mongolian Rangelands at a Tipping Point? Biomass and Cover Are Stable but Composition Shifts and Richness Declines after 20 years of Grazing and Increasing Temperatures. J. Arid Environ. 2015, 115, 100–112. [Google Scholar] [CrossRef]
  13. Nandintsetseg, B.; Shinoda, M. Assessment of Drought Frequency, Duration, and Severity and Its Impact on Pasture Production in Mongolia. Nat. Hazards 2013, 66, 995–1008. [Google Scholar] [CrossRef]
  14. Bruegger, R.A.; Jigjsuren, O.; Fernández-Giménez, M.E. Herder Observations of Rangeland Change in Mongolia: Indicators, Causes, and Application to Community-Based Management. Rangel. Ecol. Manag. 2014, 67, 119–131. [Google Scholar] [CrossRef]
  15. Jambal, S.; Urianhai, N.G.; Otoda, T.; Yamada, Y.; Jamsran, U.; Sakamoto, K.; Yoshikawa, K. Effect of Grazing Pressure on the Structure of Rangeland Plant Community in Mongolia. J. Arid Land Stud. 2012, 22, 235–238. [Google Scholar]
  16. Chen, Y.; Lee, G.; Lee, P.; Oikawa, T. Model Analysis of Grazing Effect on Above-Ground Biomass and above-Ground Net Primary Production of a Mongolian Grassland Ecosystem. J. Hydrol. 2007, 333, 155–164. [Google Scholar] [CrossRef]
  17. Bao, G.; Bao, Y.; Sanjjava, A.; Qin, Z.; Zhou, Y.; Xu, G. NDVI-Indicated Long-Term Vegetation Dynamics in Mongolia and Their Response to Climate Change at Biome Scale. Int. J. Climatol. 2015, 35, 4293–4306. [Google Scholar] [CrossRef]
  18. Cowtan, K.; Way, R.G. Coverage Bias in the HadCRUT4 Temperature Series and Its Impact on Recent Temperature Trends. Q. J. R. Meteorol. Soc. 2014, 140, 1935–1944. [Google Scholar] [CrossRef] [Green Version]
  19. Eckstein, D.; Künzel, V.; Schäfer, L.; Winges, M. Global Climate Risk Index 2020 Who Suffers Most from Extreme Weather Events? Germanwatch: Bonn, Germany, 2020; ISBN 978-3-943704-77-8. [Google Scholar]
  20. Harmeling, S. Global Climate Risk Index 2010: Who Is the Most Vulnerable? Weather-Related Loss Events since 1990 and How Copenhagen Needs to Responds; Germanwatch: Bonn, Germany, 2010. [Google Scholar]
  21. UNDP Climate Change Adaptation. Mongolia Achieves a Milestone in National Adaptation Planning. 2019. Available online: https://www.adaptation-undp.org/ (accessed on 27 March 2021).
  22. Pfeiffer, M.; Dulamsuren, C.; Wesche, K. Grasslands and Shrublands of Mongolia; Elsevier Inc.: Amsterdam, The Netherlands, 2020; ISBN 9780124095489. [Google Scholar]
  23. Jun, W.; Daniel, G.B.; Jiquan, C. Drivers of the Dynamics in Net Primary Productivity across Ecological Zones on the Mongolian Plateau. Landsc. Ecol. 2013, 28, 725–739. [Google Scholar] [CrossRef]
  24. Nanzad, L.; Zhang, J.; Tuvdendorj, B.; Nabil, M.; Zhang, S.; Bai, Y. NDVI Anomaly for Drought Monitoring and Its Correlation with Climate Factors over Mongolia from 2000 to 2016. J. Arid Environ. 2019, 164, 69–77. [Google Scholar] [CrossRef]
  25. Dorjsuren, M.; Liou, Y.A.; Cheng, C.H. Time Series MODIS and in Situ Data Analysis for Mongolia Drought. Remote Sens. 2016, 8, 509. [Google Scholar] [CrossRef] [Green Version]
  26. Tong, S.; Lai, Q.; Zhang, J.; Bao, Y.; Lusi, A.; Ma, Q.; Li, X.; Zhang, F. Spatiotemporal Drought Variability on the Mongolian Plateau from 1980–2014 Based on the SPEI-PM, Intensity Analysis and Hurst Exponent. Sci. Total Environ. 2018, 615, 1557–1565. [Google Scholar] [CrossRef] [PubMed]
  27. Sternberg, T. Investigating the Presumed Causal Links between Drought and Dzud in Mongolia. Nat. Hazards 2018, 92, 27–43. [Google Scholar] [CrossRef] [Green Version]
  28. Otani, S.; Onishi, K.; Kurozawa, Y.; Kurosaki, Y.; Bat-Oyun, T.; Shinoda, M.; Mu, H. Assessment of the Effects of Severe Winter Disasters (Dzud) on Public Health in Mongolia on the Basis of Loss of Livestock. Disaster Med. Public Health Prep. 2016, 10, 549–552. [Google Scholar] [CrossRef] [PubMed]
  29. Liu, Z.; Yao, Z.; Huang, H.; Batjav, B.; Wang, R. Evaluation of Extreme Cold and Drought over the Mongolian Plateau. Water 2019, 11, 74. [Google Scholar] [CrossRef] [Green Version]
  30. Rao, M.P.; Davi, N.K.; D’Arrigo, R.D.; Skees, J.; Nachin, B.; Leland, C.; Lyon, B.; Wang, S.Y.; Byambasuren, O. Dzuds, Droughts, and Livestock Mortality in Mongolia. Environ. Res. Lett. 2015, 10, 074012. [Google Scholar] [CrossRef]
  31. United Nations. Environmental Performance Reviews (Mongolia Synopsis); United Nations: New York, NY, USA; Geneva, Switzerland, 2018. [Google Scholar]
  32. Al-bukhari, A.; Hallett, S.; Brewer, T. A Review of Potential Methods for Monitoring Rangeland Degradation in Libya. Pastoralism 2018, 8, 1–14. [Google Scholar] [CrossRef]
  33. Peng, D.; Zhang, B.; Wu, C.; Huete, A.R.; Gonsamo, A.; Lei, L.; Ponce-Campos, G.E.; Liu, X.; Wu, Y. Country-Level Net Primary Production Distribution and Response to Drought and Land Cover Change. Sci. Total Environ. 2017, 574, 65–77. [Google Scholar] [CrossRef] [PubMed]
  34. Liang, W.; Yang, Y.; Fan, D.; Guan, H.; Zhang, T.; Long, D.; Zhou, Y.; Bai, D. Analysis of Spatial and Temporal Patterns of Net Primary Production and Their Climate Controls in China from 1982 to 2010. Agric. For. Meteorol. 2015, 204, 22–36. [Google Scholar] [CrossRef]
  35. Shinoda, M.; Nachinshonhor, G.U.; Nemoto, M. Impact of Drought on Vegetation Dynamics of the Mongolian Steppe: A Field Experiment. J. Arid Environ. 2010, 74, 63–69. [Google Scholar] [CrossRef]
  36. Crabtree, R.; Potter, C.; Mullen, R.; Sheldon, J.; Huang, S.; Harmsen, J.; Rodman, A.; Jean, C. A Modeling and Spatio-Temporal Analysis Framework for Monitoring Environmental Change Using NPP as an Ecosystem Indicator. Remote Sens. Environ. 2009, 113, 1486–1496. [Google Scholar] [CrossRef] [Green Version]
  37. Cao, M.; Prince, S.D.; Small, J.; Goetz, S.J. Remotely Sensed Interannual Variations and Trends in Terrestrial Net Primary Productivity 19812000. Ecosystems 2004, 7, 233–242. [Google Scholar] [CrossRef]
  38. Fensholt, R.; Sandholt, I.; Schultz, M.; Stisen, S.; Diouf, A. Evaluation of Satellite Based Primary Production Modelling in the Semi-Arid Sahel. Remote Sens. Environ. 2006, 105, 173–188. [Google Scholar] [CrossRef]
  39. Raich, J.W.; Rastetter, E.B.; Melillo, J.M.; Kicklighter, D.W.; Steudler, P.A.; Grace, A.L.; More, B., III; Vörösmarty, C.J. Potential Net Primary Productivity in South America: Application of a Global Model. Ecol. Appl. 1991, 1, 399–429. [Google Scholar] [CrossRef] [PubMed] [Green Version]
  40. Melillo, J.M.; McGuire, A.D.; Kicklighter, D.W.; Moore, B.; Vorosmarty, C.J.; Schloss, A.L. Global Climate Change and Terrestrial Net Primary Production. Nature 1993, 363, 234–240. [Google Scholar] [CrossRef]
  41. Parton, W.J.; Scurlock, J.M.O.; Ojima, D.S.; Gilmanov, T.G.; Scholes, R.J.; Schimel, D.S.; Kirchner, T.; Menaut, J.-C.; Seastedt, T.; Garcia Moya, E.; et al. Observations and Modeling of Biomass and Soil Organic Matter Dynamics for the Grassland Biome Worldwide. Glob. Biogeochem. Cycles 1993, 7, 785–809. [Google Scholar] [CrossRef] [Green Version]
  42. Potter, S.; Randerson, T.; Field, B.; Matson, A.; Mooney, H.A. Terrestrial Ecosystem Production: A Process Model Based on Global Satellite and Surface Data. Glob. Biogeochem. Cycles 1993, 7, 811–841. [Google Scholar] [CrossRef]
  43. Running, S.W.; Hunt, E.R. Generalization of a forest ecosystem process model for other biomes, BIOME-BGC, and an application for global-scale models. In Scaling Physiological Processes: Leaf to Globe; Ehleringer, J.R., Field, C.B., Eds.; Academic Press: San Diego, CA, USA, 1993; pp. 141–158. [Google Scholar]
  44. Haxeltine, A.; Prentice, I.C. A General Model for the Light-Use Efficiency of Primary Production. Funct. Ecol. 1996, 10, 551. [Google Scholar] [CrossRef]
  45. Hazarika, M.K.; Yasuoka, Y.; Ito, A.; Dye, D. Estimation of Net Primary Productivity by Integrating Remote Sensing Data with an Ecosystem Model. Remote Sens. Environ. 2005, 94, 298–310. [Google Scholar] [CrossRef]
  46. Prince, S.D.; Goward, S.N. Global Primary Production: A Remote Sensing Approach. J. Biogeogr. 2006, 22, 815. [Google Scholar] [CrossRef]
  47. Bao, G.; Tuya, A.; Bayarsaikhan, S.; Dorjsuren, A.; Mandakh, U.; Bao, Y.; Li, C.; Vanchindorj, B. Variations and Climate Constraints of Terrestrial Net Primary Productivity over Mongolia. Quat. Int. 2020, 537, 112–125. [Google Scholar] [CrossRef]
  48. Bat-oyun, T.; Shinoda, M.; Tsubo, M. Estimation of Pasture Productivity in Mongolian Grasslands: Field Survey and Model Simulation. J. Agric. Meteorol. 2010, 66, 31–39. [Google Scholar] [CrossRef] [Green Version]
  49. Lin, C.; Dugarsuren, N. Deriving the Spatiotemporal NPP Pattern in Terrestrial Ecosystems of Mongolia Using MODIS Imagery. Photogramm. Eng. Remote Sens. 2015, 81, 587–598. [Google Scholar] [CrossRef]
  50. Matsushita, B.; Tamura, M. Integrating Remotely Sensed Data with an Ecosystem Model to Estimate Net Primary Productivity in East Asia. Remote Sens. Environ. 2002, 81, 58–66. [Google Scholar] [CrossRef]
  51. Chen, J.M.; Liu, J.; Cihlar, J.; Goulden, M.L. Daily Canopy Photosynthesis Model through Temporal and Spatial Scaling for Remote Sensing Applications. Ecol. Model. 1999, 124, 99–119. [Google Scholar] [CrossRef] [Green Version]
  52. Zhou, W.; Li, J.; Yue, T. Remote Sensing Monitoring and Evaluation of Degraded Grassland in China Accounting of Grassland Carbon Source and Carbon Sink; Springer Nature: Basingstoke, UK, 2020; ISBN 9789813293816. [Google Scholar]
  53. Chen, J.M.; Mo, G.; Pisek, J.; Liu, J.; Deng, F.; Ishizawa, M.; Chan, D. Effects of Foliage Clumping on the Estimation of Global Terrestrial Gross Primary Productivity. Glob. Biogeochem. Cycles 2012, 26, GB1019. [Google Scholar] [CrossRef]
  54. Feng, X.; Liu, G.; Chen, J.M.; Chen, M.; Liu, J.; Ju, W.M.; Sun, R.; Zhou, W. Net Primary Productivity of China’s Terrestrial Ecosystems from a Process Model Driven by Remote Sensing. J. Environ. Manag. 2007, 85, 563–573. [Google Scholar] [CrossRef] [PubMed]
  55. Liu, J.; Chen, J.M.; Cihlar, J.; Chen, W. Net Primary Productivity Distribution in the BOREAS Region from a Process Model Using Satellite and Surface Data the Model Results, the Following Statistics Were Obtained for (Excluding Burnt Areas in the Re _• on t Equal to g C m NPP for the SSA c = V. J. Geophys. Res. 1999, 104, 27735–27754. [Google Scholar] [CrossRef]
  56. Wang, Q.; Tenhunen, J.; Falge, E.; Bernhofer, C.; Granier, A.; Vesala, T. Simulation and Scaling of Temporal Variation in Gross Primary Production for Coniferous and Deciduous Temperate Forests. Glob. Chang. Biol. 2004, 10, 37–51. [Google Scholar] [CrossRef]
  57. Zhang, F.; Chen, J.M.; Chen, J.; Gough, C.M.; Martin, T.A.; Dragoni, D. Evaluating Spatial and Temporal Patterns of MODIS GPP over the Conterminous U.S. against Flux Measurements and a Process Model. Remote Sens. Environ. 2012, 124, 717–729. [Google Scholar] [CrossRef]
  58. Chen, Y.; Li, J.; Ju, W.; Ruan, H.; Qin, Z.; Huang, Y.; Jeelani, N.; Padarian, J.; Propastin, P. Quantitative Assessments of Water-Use Efficiency in Temperate Eurasian Steppe along an Aridity Gradient. PLoS ONE 2017, 12, e0179875. [Google Scholar] [CrossRef] [Green Version]
  59. Chen, Y.; Ju, W.; Mu, S.; Fei, X.; Cheng, Y.; Propastin, P.; Zhou, W.; Liao, C.; Chen, L.; Tang, R.; et al. Explicit Representation of Grazing Activity in a Diagnostic Terrestrial Model: A Data-Process Combined Scheme. J. Adv. Modeling Earth Syst. 2019, 11, 957–978. [Google Scholar] [CrossRef] [Green Version]
  60. Gomboluudev, P.; Natsagdorj, L. The Impact of Desertification on Mongolian Climate and Its Numerical Study Using Regional Climate Model (RegCM3). In Proceedings of the 3rd International Workshop on Terrestrial Change in Mongolia, Tsukuba, Japan, 9–10 November 2004; pp. 112–113. [Google Scholar]
  61. Nandintsetseg, B.; Greene, J.S.; Goulden, C.E. Trends in Extreme Daily Precipitation and Temperature near Lake Hövsgöl, Mongolia. Int. J. Climatol. 2007, 27, 341–347. [Google Scholar] [CrossRef]
  62. Batima, P.; Natsagdorj, L.; Gombluudev, P.; Erdenetsetseg, B. Observed Climate Change in Mongolia. AIACC Work. Pap. 2005, 12, 1–26. [Google Scholar]
  63. Mandakh, N.; Tsogtbaatar, J.; Dash, D.; Khudulmur, S. Spatial Assessment of Soil Wind Erosion Using WEQ Approach in Mongolia. J. Geogr. Sci. 2016, 26, 473–483. [Google Scholar] [CrossRef] [Green Version]
  64. Chen, B.; Coops, N.C. Understanding of Coupled Terrestrial Carbon, Nitrogen and Water Dynamics—An Overview. Sensors 2009, 9, 8624–8657. [Google Scholar]
  65. Liu, J.; Chen, J.M.; Cihlar, J.; Park, W.M. A Process-Based Boreal Ecosystem Productivity Simulator Using Remote Sensing Inputs. Remote Sens. Environ. 1997, 62, 158–175. [Google Scholar] [CrossRef]
  66. Liu, J.; Chen, J.M.; Cihlar, J.; Chen, W. Net Primary Productivity Mapped for Canada at 1-Km Resolution. Glob. Ecol. Biogeogr. 2002, 11, 115–129. [Google Scholar] [CrossRef] [Green Version]
  67. Ryan, M.G. A Simple Method for Estimating Gross Carbon Budgets for Vegetation in Forest Ecosystems. Tree Physiol. 1991, 9, 255–266. [Google Scholar] [CrossRef] [PubMed]
  68. Ryan, M.G.; Lavigne, M.B.; Gower, S.T. Annual Carbon Cost of Autotrophic Respiration in Boreal Forest Ecosystems in Relation to Species and Climate. J. Geophys. Res. Atmos. 1997, 102, 28871–28883. [Google Scholar] [CrossRef] [Green Version]
  69. Mann, H.B. Nonparametric Tests against Trend. Econom. J. Econom. Soc. 1945, 13, 245–259. [Google Scholar] [CrossRef]
  70. Sen, P.K. Estimates of the Regression Coefficient Based on Kendall’s Tau. J. Am. Stat. Assoc. 1968, 63, 1379–1389. [Google Scholar] [CrossRef]
  71. Baniya, B.; Tang, Q.; Xu, X.; Haile, G.; Chhipi-Shrestha, G. Spatial and Temporal Variation of Drought Based on Satellite Derived Vegetation Condition Index in Nepal from 1982–2015. Sensors 2019, 19, 430. [Google Scholar] [CrossRef] [Green Version]
  72. Tong, S.; Zhang, J.; Bao, Y.; Terigele, W.; Weilisi, L. Spatial and Temporal Variations of Vegetation Cover and the Relationships with Climate Factors in Inner Mongolia Based on GIMMS NDVI3g Data. J. Arid Land 2017, 9, 394–407. [Google Scholar] [CrossRef] [Green Version]
  73. Pangali Sharma, T.P.; Zhang, J.; Khanal, N.R.; Prodhan, F.A.; Paudel, B.; Shi, L.; Nepal, N. Assimilation of Snowmelt Runoff Model (SRM) Using Satellite Remote Sensing Data in Budhi Gandaki River Basin, Nepal. Remote Sens. 2020, 12, 1951. [Google Scholar] [CrossRef]
  74. Koju, U.A.; Zhang, J.; Maharjan, S.; Bai, Y.; Zhang, S.; Yao, F. Analysis of Spatiotemporal Dynamics of Forest Net Primary Productivity of Nepal during 2000–2015. Int. J. Remote Sens. 2020, 41, 4336–4364. [Google Scholar] [CrossRef]
  75. Dimiceli, C.; Carroll, M.; Sohlberg, R.; Kim, D.H.; Kelly, M.; Townshend, J.R.G. MOD44B MODIS/Terra Vegetation Continuous Fields Yearly L3 Global 250m SIN Grid V006. NASA EOSDIS Land Processes DAAC 2015. [Google Scholar] [CrossRef]
  76. Liang, L.; Liu, Q.; Liu, G.; Li, H.; Huang, C. Accuracy Evaluation and Consistency Analysis of Four Global Land Cover Products in the Arctic Region. Remote Sens. 2019, 11, 1396. [Google Scholar] [CrossRef] [Green Version]
  77. Pyankov, V.I.; Gunin, P.D.; Tsoog, S.; Black, C.C. C 4 Plants in the Vegetation of Mongolia: Their Natural Occurrence and Geographical Distribution in Relation to Climate. Oecologia 2000, 123, 15–31. [Google Scholar] [CrossRef]
  78. Running, S.; Zhao, M. MODIS/Terra Net Primary Production Gap-Filled Yearly L4 Global 500m SIN Grid V006. 2019. Available online: https://lpdaac.usgs.gov/news/release-modis-version-6-net-evapotranspiration-gpp-and-npp-gap-filled-products/ (accessed on 27 March 2021).
  79. Li, P.; Peng, C.; Wang, M.; Li, W.; Zhao, P.; Wang, K.; Yang, Y.; Zhu, Q. Quantification of the Response of Global Terrestrial Net Primary Production to Multifactor Global Change. Ecol. Indic. 2017, 76, 245–255. [Google Scholar] [CrossRef]
  80. Nemani, R.R.; Keeling, C.D.; Hashimoto, H.; Jolly, W.M.; Piper, S.C.; Tucker, C.J.; Myneni, R.B.; Running, S.W. Climate-Driven Increases in Global Terrestrial Net Primary Production from 1982 to 1999. Science 2003, 300, 1560–1563. [Google Scholar] [CrossRef] [PubMed] [Green Version]
  81. Li, Z.; Chen, Y.; Wang, Y.; Fang, G. Dynamic Changes in Terrestrial Net Primary Production and Their Effects on Evapotranspiration. Hydrol. Earth Syst. Sci. 2016, 20, 2169–2178. [Google Scholar] [CrossRef] [Green Version]
  82. Wang, J.; Wei, H.; Cheng, K.; Ochir, A.; Davaasuren, D.; Li, P.; Shun Chan, F.K.; Nasanbat, E. Spatio-Temporal Pattern of Land Degradation from 1990 to 2015 in Mongolia. Environ. Dev. 2020, 34, 100497. [Google Scholar] [CrossRef]
  83. Bao, G.; Chen, J.; Chopping, M.; Bao, Y.; Bayarsaikhan, S.; Dorjsuren, A.; Tuya, A.; Jirigala, B.; Qin, Z. Dynamics of Net Primary Productivity on the Mongolian Plateau: Joint Regulations of Phenology and Drought. Int. J. Appl. Earth Obs. Geoinf. 2019, 81, 85–97. [Google Scholar] [CrossRef]
  84. Liu, Y.; Xiao, J.; Ju, W.; Zhou, Y.; Wang, S.; Wu, X. Water Use Efficiency of China’s Terrestrial Ecosystems and Responses to Drought. Sci. Rep. 2015, 5, 1–12. [Google Scholar] [CrossRef]
  85. Sun, B.; Zhao, H.; Wang, X. Effects of Drought on Net Primary Productivity: Roles of Temperature, Drought Intensity, and Duration. Chin. Geogr. Sci. 2016, 26, 270–282. [Google Scholar] [CrossRef] [Green Version]
  86. Pei, F.; Li, X.; Liu, X.; Lao, C. Assessing the Impacts of Droughts on Net Primary Productivity in China. J. Environ. Manag. 2013, 114, 362–371. [Google Scholar] [CrossRef]
  87. Nandintsetseg, B.; Boldgiv, B.; Chang, J.; Ciais, P.; Enkhbaatar, D.; Altangerel, B.; Tserenpurev, B.-O.; Stenseth, N.C. Risk and Vulnerability of Mongolian Grasslands under Climate Change. Environ. Res. Lett. 2021, 16, 034035. [Google Scholar] [CrossRef]
  88. Yang, J.; Zhang, X.C.; Luo, Z.H.; Yu, X.J. Nonlinear Variations of Net Primary Productivity and Its Relationship with Climate and Vegetation Phenology, China. Forests 2017, 8, 361. [Google Scholar] [CrossRef] [Green Version]
  89. Nakano, T.; Bat-Oyun, T.; Shinoda, M. Responses of Palatable Plants to Climate and Grazing in Semi-Arid Grasslands of Mongolia. Glob. Ecol. Conserv. 2020, 24, e01231. [Google Scholar] [CrossRef]
Figure 1. Location map of the study area and the distribution of main land cover categories in Mongolia (derived from the Climate Change Initiative Land Cover (CCI-LC) product for 2015, as explained in Section 2.3.3).
Agronomy 11 00647 g001
Figure 2. The framework of the Boreal Ecosystem Productivity Simulator (BEPS) model. LAI—leaf area index; AWC—available soil water-holding capacity; DEM—digital elevation model; GPP—gross primary productivity; NPP—net primary productivity.
Agronomy 11 00647 g002
Figure 3. (a) Comparisons between daily observed Net Primary Production (NPP) and BEPS-simulated NPP. (b) Comparisons of annual MODIS NPP and BEPS-simulated NPP. Symbols represent the mean NPP values from 2003 to 2018 by land cover types.
Agronomy 11 00647 g003
Figure 4. (a) Spatial pattern of mean annual NPP from the year 2003 to 2018. (b) The spatial pattern of the trend in annual NPP during the study period. Note: The white-colored areas in figure NPP represent a non-vegetation.
Agronomy 11 00647 g004
Figure 5. Annual changes in (a) NPP, (b) total precipitation, (c) the mean annual temperature, and (d) net radiation across Mongolia.
Agronomy 11 00647 g005
Figure 6. The annual NPP per unit area of different vegetation types from 2003 to 2018.
Agronomy 11 00647 g006
Figure 7. Daily variation of total NPP per unit area over five vegetation types for the years 2014 and 2017.
Agronomy 11 00647 g007
Figure 8. Spatial correlation coefficients between annual NPP and (a) temperature, (b) precipitation, and (c) net radiation from 2003 to 2018.
Agronomy 11 00647 g008
Table 1. Generalized regional land-cover legend [76].
CCI-LCCodeTarget Legend (Boreal Ecosystem Productivity Simulator)CodeTarget Legend (Veg. Analysis)
Broadleaf deciduous closed to open (>15%)60Needleleaf evergreen forest1Forest
Broadleaf deciduous closed (>40%)61
Broadleaf deciduous open (15–40%)62Broadleaf evergreen forest2
Needleleaf evergreen closed to open (>15%)70
Needleleaf evergreen closed (>40%)71Needleleaf deciduous forest3
Needleleaf evergreen open (15–40%)72
Needleleaf deciduous closed to open (>15%)80Broadleaf deciduous forest4
Mixed leaf type90
Mosaic tree and shrub (>50%)100Mixed forest5
Wetland tree160
Shrubland120Closed shrublands6Shrubland
Shrubland evergreen121
Shrubland deciduous122Open shrublands7
Mosaic herbaceous cover (>50%)110Woody savannas8Grassland
Grassland130Savannas9
Grasslands10
Wetland shrub or herbaceous180Permanent wetland11Wetland
Cropland10Cropland12Cropland
Herbaceous cover11
Mosaic cropland (>50%)/natural vegetation30
Mosaic natural vegetation40Cropland/vegetation mosaic14
Urban areas190Urban13Urban
Permanent snow and ice220Snow/ice15Snow/ice
Lichens and mosses140Sparse vegetation16Sparse vegetation
Sparse vegetation (<15%)150
Sparse shrub (<15%)152
Sparse herbaceous cover (<15%)153
Bare areas200Bare areas17Barren land
Consolidated bare areas201
Unconsolidated bare areas202
Water bodies210Water bodies0Water bodies
Table 2. Mean annual and total NPP over different vegetation types from 2003 to 2018.
Vegetation TypesMean Annual NPP (g C m−2 year−1)Annual Total NPP (Pg C)Percentage of Area (%)Percentage of NPP (%)
Grassland77.720.0769341.7448.05
Forest195.230.0526810.8332.4
Sparse vegetation25.270.0271745.7616.98
Wetland167.280.002010.52.03
Shrubland32.750.000891.170.54
Table 3. Correlation coefficients (r) between daily NPP of different vegetation types and climatic parameters in the growing season during the study period.
Climatic ParametersGrassland ForestWetlandSparse VegetationShrubland
Temperature0.8840.9130.9290.9510.951
Precipitation0.7470.5920.5290.7250.634
Net Radiation0.7690.7470.3480.5940.494
Publisher’s Note: MDPI stays neutral with regard to jurisdictional claims in published maps and institutional affiliations.

