Article

Root Response to Soil Water Status via Interaction of Crop Genotype and Environment

1
The United Graduate School of Agricultural Sciences, Kagoshima University, Kagoshima 890-0065, Japan
2
National Agriculture and Forestry Research Institute, Vientiane 7170, Laos
3
Faculty of Agriculture, Kagoshima University, Kagoshima 890-0065, Japan
4
Japan International Research Center for Agricultural Sciences, 1-1 Ohwashi, Tsukuba, Ibaraki 305-8686, Japan
5
Faculty of Agriculture, University of the Ryukyu, Okinawa 903-0213, Japan
*
Author to whom correspondence should be addressed.
Agronomy 2021, 11(4), 708; https://doi.org/10.3390/agronomy11040708
Submission received: 9 February 2021 / Revised: 2 April 2021 / Accepted: 4 April 2021 / Published: 8 April 2021

Abstract

:
Flooding and drought are major causes of reductions in crop productivity. Root distribution indicates crop adaptation to water stress. Therefore, we aimed to identify crop roots response based on root distribution under various soil conditions. The root distribution of four crops—maize, millet, sorghum, and rice—was evaluated under continuous soil waterlogging (CSW), moderate soil moisture (MSM), and gradual soil drying (GSD) conditions. Roots extended largely to the shallow soil layer in CSW and grew longer to the deeper soil layer in GSD in maize and sorghum. GSD tended to promote the root and shoot biomass across soil moisture status regardless of the crop species. The change of specific root density in rice and millet was small compared with maize and sorghum between different soil moisture statuses. Crop response in shoot and root biomass to various soil moisture status was highest in maize and lowest in rice among the tested crops as per the regression coefficient. Thus, we describe different root distributions associated with crop plasticity, which signify root spread changes, depending on soil water conditions in different crop genotypes as well as root distributions that vary depending on crop adaptation from anaerobic to aerobic conditions.

1. Introduction

According to the United Nations [1], the world’s population is expected to grow by more than 2 billion people by 2050. The distribution of new growth will be about 50% in sub-Sahara Africa and 30% in South and Southeast Asia. The main crop production of these regions is rainfed, especially among cereal crops. Rainfed agriculture will continue to play a dominant role in providing food and generating livelihoods, particularly in poor countries [2]. Climate change and weather disasters are major causes of reductions in agricultural productivity [3,4]. The impact of natural disasters on rainfed agriculture in terms of total damage and loss across all sectors was 17% and 83% by flooding and drought, respectively [5].
The plant root system is an important part that absorbs water and nutrients from the soil for sustainable crop production, particularly in rainfed ecosystems that suffer from the increasing frequency of erratic rainfall patterns due to climate change. The optimization of root architecture for resource capture is vital for enabling the next Green Revolution [6,7]. Root distribution is included as root architecture, including root length and root mass, as a function of several factors, such as depth in the soil, distance from the stem, and others [8]. Thus, scientists have been looking for optimum root development that may help plants use water more efficiently, better withstand drought conditions, and survive flood conditions [9,10,11,12,13,14]. The growth and development of roots are under genetic control, but the genotypic performance of root distribution is highly influenced by abiotic stress [15,16,17]. Root distribution relates to deeper rooting traits in cereal crops, which can allow them to absorb water from further underground under drought stress [18,19,20,21]. Dense and shallow root traits might better capture nutrients, such as phosphorus, that accumulate at the surface [22,23].
The agronomic significance of understanding the regulation of lateral root development is now widely accepted because of its role in anchorage, soil resource acquisition, and establishment of the plant microbial community [24]. Plant root distribution at the subsoil layer has the potential to increase water accessibility, particularly under water-limited conditions. Maize and rice root systems comprise different types of roots; for example, rice consists of crown root and lateral root, but maize consists more of nodal root number traits and lateral root such as primary root, crown root, seminal root, and lateral root [24,25]. However, recognition of lateral roots as a distinct category is a prerequisite for gaining fundamental knowledge about root development in these species. This is because root development is difficult to observe, quantify, and interpret. Roots grow in soil, an opaque medium from which they cannot be extricated or readily observed without introducing artifacts and destroying the native root architecture, precluding subsequent analysis of the same individual. Root systems themselves are complex structures, typically composed of thousands of individual root axes that vary developmentally, physiologically, and morphologically.
Plant phenotypes are sensitive to genotype and the environment and are influenced by the interaction between the two. By analyzing the genotype-environmental interaction using the observed phenotype, it is possible to infer the robustness of that genotype in the environment. Understanding how genetic and environmental factors influence complex traits, such as shoot and root growth, is a challenging issue in the field of plant sciences. The phenotypic expression of an individual is determined by both genotypic and environmental effects [26]. To account for genotypic and environmental interaction effects, breeders evaluate genotypes in varying environmental conditions to identify those with a stable performance. The selection of suitable crop genotypes that can be adapted to poor environmental conditions has become important in rainfed conditions. By contrast, determining genetic variations among crop genotypes and comparing them to the variations caused by environmental differences is important in evaluating the environmental performance of the crop [14,15]. The manner in which the resources are partitioned to the roots and the resulting belowground morphology are important in determining the ability of a plant to capture resources and its subsequent productivity [27]. Both partitioning and morphology of roots are affected by the environment [28,29], and a plant can change its rooting behavior to maximize resource capture [30]. Therefore, it is reasonable to measure the relative proportions of genetic and environmental interactions in root phenotyping.
Root development across environmental factors among the crop genotypes varies. In maize, our enhanced knowledge of root development regulation has already led to measurable gains in the ability of maize to exploit soil resources, with corresponding enhancements in shoot and yield attributes. Genotypic variation in the angles of the root segments of the first and second flushes of nodal roots and mean diameter of nodal roots could be considered a suitable target for large-scale screening of root architecture in breeding [31]. Rice is a semiaquatic plant that is well adapted to flooding, ranging from partial to prolonged. Rice stems develop an adventitious root primordial at each node that slowly matures but emerges only when the plant is flooded, leading to the formation of a whole new secondary root system upon flooding [14,32]. In the root system of sorghum, severe deficit irrigation increases the angle of crown roots, root mass, root length density, and fine root surface area as compared with full irrigation [33]. In sorghum, relationships were derived by which total root mass could be estimated from 0–10 cm root mass (r = 0.94, p < 0.001) or 0–20 cm root mass (r = 0.99, p < 001). Total root length is also a good predictor of total root mass (r = 0.799, p < 0.001), and 0–10 cm root length is equally satisfactory (r = 0.802, p < 0.01) [34]. The role of the nodal root of sorghum in plant growth responds to variation in soil moisture, as does that of millet. Pearl millet is better adapted to hot semiarid conditions, and the common millet is better adapted to environments ranging from temperate to tropical. This study aimed to identify crop roots’ response based on root distribution for nodal and lateral roots separately under various soil conditions, including dry and waterlogged and to assess crop adaptation under changing environments, such as various soil moisture contents, by using maize, millet, rice, and sorghum.

2. Materials and Methods

2.1. Site and Materials

The experiment was carried out in a greenhouse from 24 October 2019 to 25 November 2019. Four crop species including maize (Zea mays L. cv. Honey Bantam), millet (Echinochloa utilis Ohwi. cv. Kumamoto local), sorghum (Sorghum bicolor Moench. cv. High grain sorghum), and rice (interspecific progeny cv. NERICA1) were used in this study.

2.2. Experimental Design and Water Treatments

The seeds of all crops were done using the same processing for a seed germination phase. Seeds of each crop were placed in a petri dish containing filter paper moisturized with distilled water and left to germinate at 28 °C in an incubator under dark condition for 2–3 days [31]. Then, the germinated seeds of each crop were sown in a seedling tray (size: 59 cm × 30 cm, containing 128 holes). The rice seeds were sown about five days earlier than other crops to adjust the same leaf age (2.5 leaves) at the transplanting time. Before transplanting, all root boxes were watered abundantly for three hours and allowed to drain excess water overnight to reach field capacity. The next day, 30 uniform seedlings of each crop were selected and transplanted one seedling per root box. After transplanting, the seedlings of all crops were allowed to grow for 10 days with adequate watering before treatment.
A root box was made from a waterproof wooden plate to prevent water absorption by the root box. The size (L × H × W: 40 cm × 40 cm × 3 cm) and design of the root box was modified from previous studies [35,36,37]. Air-dried sandy loam soil was mixed with sand at a 4:1 ratio to provide adequate water permeability of the soil in the root box during the experiment. Then, about 5.6 kg soil at 10% (w/w) of moisture content) was well mixed with 12 g balanced compound of N, P, and K fertilizer (8–8–8). To make sure that the soil was homogeneously packed bulk density (1.2 g cm−3), the soil (5.6 kg box−1) was equally spread into eight layers (about 0.7 kg of each portion). Then, each layer of soil was carefully filled to achieve about 5 cm of a soil layer. At 10 days after transplanting, the treatments as were started. Five of 30 root boxes of each crop were selected for water treatment, and each root box represented a replication. The treatments included three water statuses and five replications. The treatments consisted of moderate soil moisture (MSM) as a control, gradual soil drying (GSD), and continuous soil waterlogging (CSW). Under MSM, the soil moisture content was kept at field capacity by daily irrigation with approximately 200 mL of tap water onto the soil surface. This water amount was adequate for plant growth requirement, and confirmed by soil moisture sensors that it was equally spread throughout the root boxes. At the bottom of the root box, there was a hole to allow for draining of any excess water under MSM. Under GSD, irrigation was withheld from the root box until the end of the experiment. Under CSW, the root boxes were submerged in a container with controlled water level at 2~3 cm over the soil surface until the end of the experiment. The mean day and nighttime temperatures, and humidity were 27.2 °C, 14.8 °C and 47.6%, 77.9%, respectively, during the experiment, and the mean of solar radiation from October to November 2019 was in the range of 11.9–13.5 MJ m−2 (Japan Meteorological Agency).

2.3. Measurements

Soil moisture content was monitored at 20 cm depth from the soil surface using a soil moisture sensor (5TE), and data were recorded using a Datalogger Em50 Series (Decagon Devices Inc., Pullman, WA, USA) with a 60 min interval between measurements. At 25 days after treatment (35 days after transplanting), the shoot was cut and the leaf and stem were separated. Leaf area was measured using digital image analysis software (LIA32, developed by Kazukiyo Yamamoto, Nagoya University, Nagoya, Japan). After leaf area measurement, the gathered leaves and stems were oven-dried at 80 °C to a constant weight before determining shoot dry weight. One of five root boxes of each treatment and crop was chosen as a representative for two-dimension root images. The processing of root image, the selected root boxes of each treatment and crop were opened at one side and placed on a pinboard. After that, the root box was removed and gently washed to remove the soil without root damage, and then the roots were photographed (Nikon 3500 digital camera). After photographing, the root was cut for further root analysis, as explained below. The rest of the root boxes were opened on one side, and the root samples (included soil) were divided using a knife into four layers (0–10 cm, 10–20 cm, 20–30 cm, and 30–40 cm) and three columns equally (left side, middle and right side) in the root box before the roots were washed. The root samples were kept in tap water and preserved in the freezer (–5 °C) for two weeks before root scanning. Root samples from each soil layer were scanned at 6400 dpi (EPSON XT-X830, Epson American Inc., Los Alamitos, CA 90720, USA), and the scanned images were analyzed using an image analysis system (WinRHIZO, Regent Instruments Inc., QC, Canada) with a pixel threshold value range between approximately 165 and 175 to assess the total root length, lateral root length, surface area, and volume, while the nodal root length was different between total root length and lateral root length. The root classification of lateral roots was categorized by a root diameter of less than 0.2 mm in rice [38,39,40], but in the maize, millet and sorghum, the root diameter classification was modified [31,38,41]. In these crops, a root diameter of less than 0.35 mm was classified as a lateral root. After root analysis, root samples were oven-dried at 80 °C to a constant weight using the same process as with the leaf samples to determine root dry weight. We calculated the root parameters, such as total root length density in each soil layer, total root length density distribution in each soil column and layer such as sides (left and right sides of soil column) and middle, and specific root length density distribution in each soil layer. We also assessed the interaction effect of crop genotype × soil water status (G × E) using Finlay–Wilkinson regression analysis [42] as a measure of the adaptability of crop genotype to environment (water status) and environment to crop genotype. In general, the term “genotype × environment (G × E) interaction effect” referred both to the modification of genetic risk factors by environmental risk and protective factors and to the role of specific genetic risk factors in determining individual differences in vulnerability to environmental risk factors. In this study, crop phenotypes are sensitive to genotype and the environment. The phenotype is influenced not only by the genotype and the environment, but also by the interaction between the genotype and the environment. By analyzing the interaction between G × E using the observed phenotypes, it becomes possible to infer the robustness of that genotype to the environment. The environmental index in this study showed the average value of aboveground or underground biomass of different crop species under three different soil moisture conditions. Between different crop genotypes, we analyzed the response of biomass to soil water status, so it is also important of regression coefficient of regression line of G × E to understand phenotype under different environments.

2.4. Statistical Analysis

The experiment was arranged in a randomized block design with five replications. One-way and two-way analysis of variance (ANOVA) was conducted to determine the effects of soil moisture on individual crops (maize, millet, rice, and sorghum) and interaction of crops genotype and soil moisture status, respectively. Tukey’s honest significant different test was calculated to compare the mean value at the 5% probability in IBM SPSS v. 26. (IBM Corp. Released in 2019. IBM SPSS Statistics for Windows, Version 26.0. Armonk, NY, USA: IBM Corp.).

3. Results

3.1. Soil Moisture Content Distribution

Figure 1 shows the volumetric soil moisture content of MSM and GSD. The soil moisture content was controlled at field capacity before the start of the treatment. After treatment, the average of soil moisture content under MSM was controlled at field capacity (21%), while the soil moisture content under GSD in maize, millet, rice, and sorghum was dynamically decreased by withholding irrigation for 25 days. On the other hand, the volumetric soil moisture content under CSW showed very little change during when the plots were submerged.

3.2. Shoot and Root Growth under Different Soil Moisture Statuses

Table 1 shows the effect of soil moisture treatment on shoot and root traits. The effect of soil moisture treatment on shoot and root traits was dependent on the crop. There was a significant effect of soil moisture treatment on shoot dry weight and leaf area in maize, millet, and sorghum, but no effect was found in rice. For shoot development, GSD significantly increased shoot dry weight and leaf area in maize, millet, and sorghum compared to CSW. In particular, CSW decreased the shoot dry weight and leaf area of maize (68% and 66% of shoot dry weight and leaf area, respectively) and sorghum (60% and 69% of shoot dry weight and leaf area, respectively) compared to MSM, but CSW did not show a significant difference in shoot dry weight and leaf area compared with MSM in millet. There was a significant effect of soil moisture treatment in all crops on all root traits, with the exception of rice, in which root dry weight and root volume did not show significant differences among the soil moisture treatments. GSD significantly increased lateral root length in all crops compared to CSW; in particular, maize and millet had a higher lateral root length under GSD than under MSM and CSW.

3.3. Root Distribution among Different Soil Layers and Soil Moisture Statuses

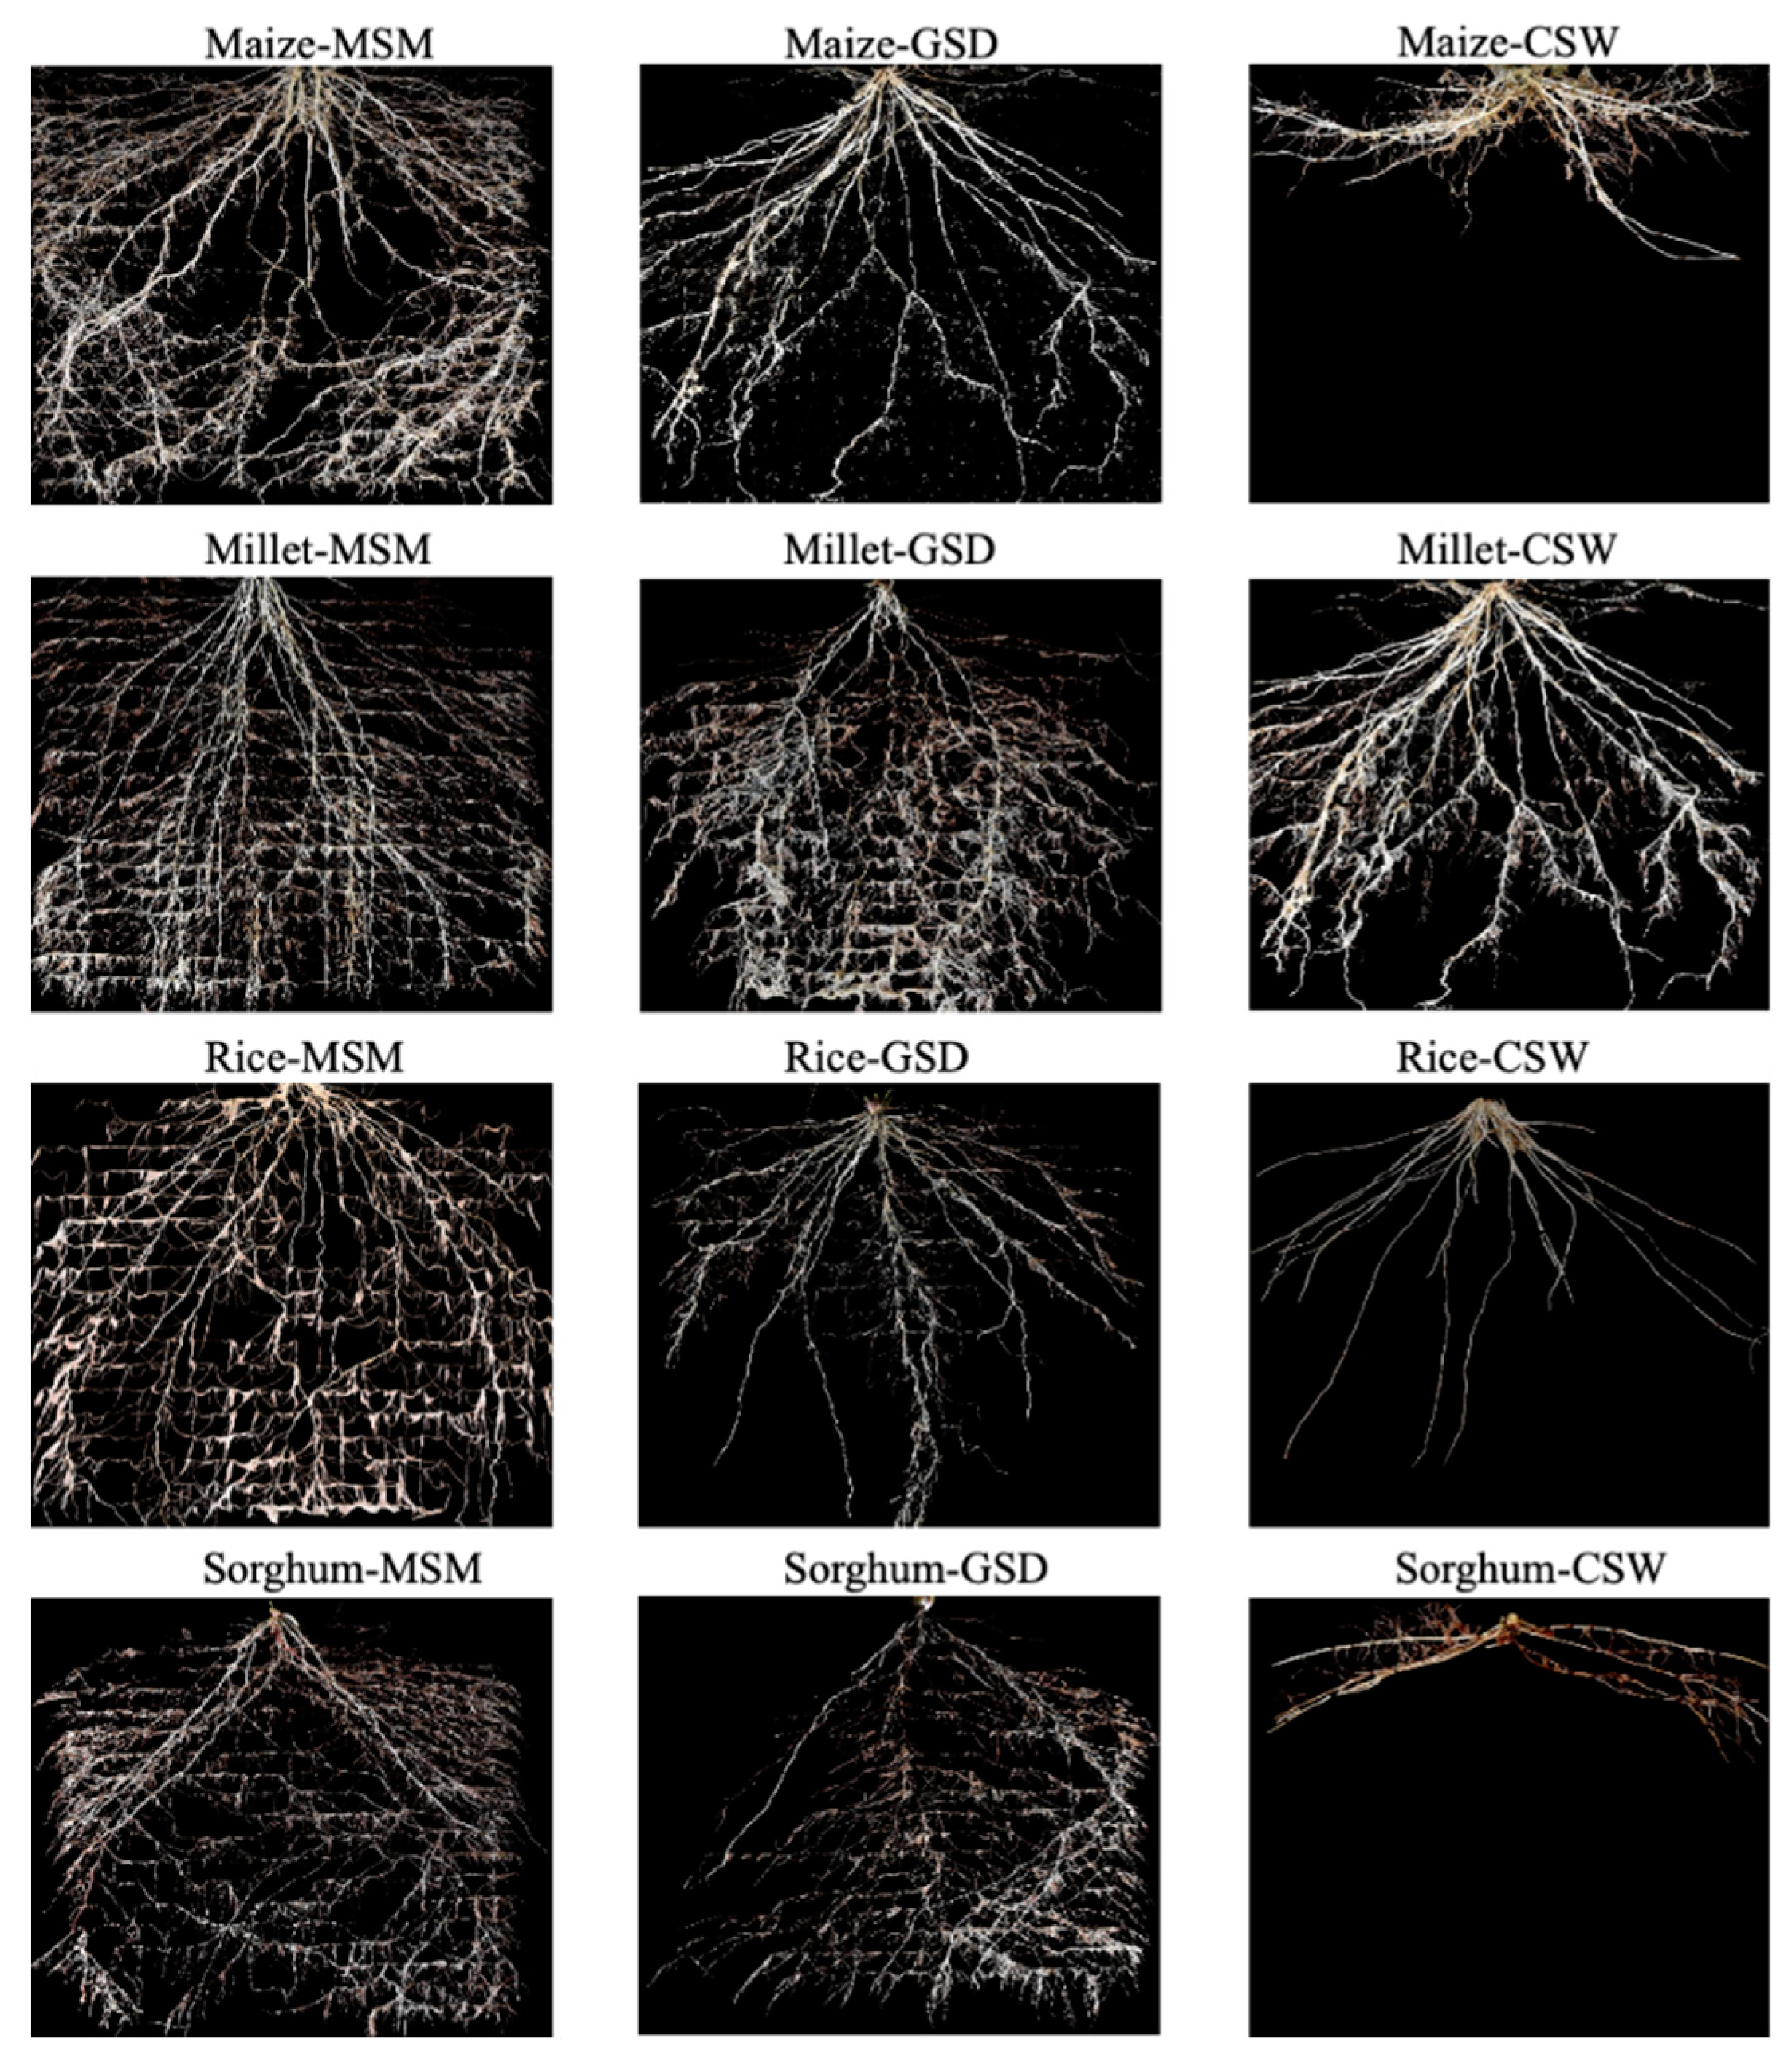
Figure 2 shows representative 2D images of roots of maize, millet, rice, and sorghum grown in root boxes under MSM, GSD, and CSW at 25 days after treatment. Each crop produced greater fine root than primary root. The details of root growth development are explained in Table 1, and Figure 3 and Figure 4. The total root length density distribution showed different patterns subject to soil moisture status and crop species (Figure 3). In maize, a significant effect of soil moisture treatment was found in the 10–40 cm soil layer (p < 0.001) with GSD significantly increasing total root length density distribution compared to MSM and CSW in the 10–30 cm soil layer, but there was no significant difference in total root length density distribution between the GSD and MSM in the 30–40 cm soil layer; CSW showed an extremely decreased total root length density distribution in the 10–40 cm soil layer compared to MSM and GSD. The effect of soil moisture treatment on the total root length density distribution of millet was similar to that of maize under GSD, but the total root length density distribution under CSW was not significantly decreased in the 10–30 cm soil layer compared to that in MSM. In sorghum, there was a significant effect of soil moisture treatment on the total root length density distribution in the 10–30 cm (p < 0.001) and 30–40 cm (p < 0.05) soil layers; total root length density distribution was greatly decreased by CSW in the 10–40 cm soil layer compared to MSM and GSD, but a comparison between MSM and GSD did not show a significantly different total root length density distribution in all soil layers. In rice, a significant effect of soil moisture treatment was found for all soil layers (p < 0.05), and the total root length distribution was significantly decreased by CSW in all soil layers compared to MSM, while the GSD was not significantly different in terms of total root length density distribution compared to MSM and CSW.
Figure 4 demonstrates the vertical total root length density distribution in different soil columns (sides and middle). The sides related to shallower root angle, and the middle related to steeper root angle, especially in the 0–20 cm soil layer. In maize, root density of the sides were higher than the middle in MSM, but those of GSD were higher in the middle than sides in the 0–40 cm soil layer. Under CSW, as we explained above in Figure 3, most of the root distribution was not able to elongate in subsoil layer (20–40 cm soil layer); total root length density of maize was significant in the middle, higher than in the sides (p < 0.001). In millet, total root length density distribution in comparison between MSM and GSD showed a similar trend, with the middle showing a higher total root length density distribution than the sides in the 0–40 cm soil layer. Under CSW, the total root length density distribution in the 0–10 cm soil layer was significantly (p < 0.001) higher in the middle than in the sides, but in the 10–40 cm soil layer, significantly had no difference between the middle and the sides. In rice, total root length density was significantly higher in the middle than in the sides for MSM in the 0–10 cm and 20–40 cm soil layers (p < 0.05), GSD in the 0–10 cm (p < 0.05) soil layer, and CSW in the 0–10 cm soil layer (p < 0.001). In sorghum, in the 0–10 cm soil layer, it showed a significantly higher total root length density in the middle than in the sides for MSM (p < 0.001), GSD (p < 0.05) and CSW (p < 0.001). However, other soil layers were not significantly different between the middle and the sides for all treatments, except in the 10–20 soil layer for MSM (p < 0.05).
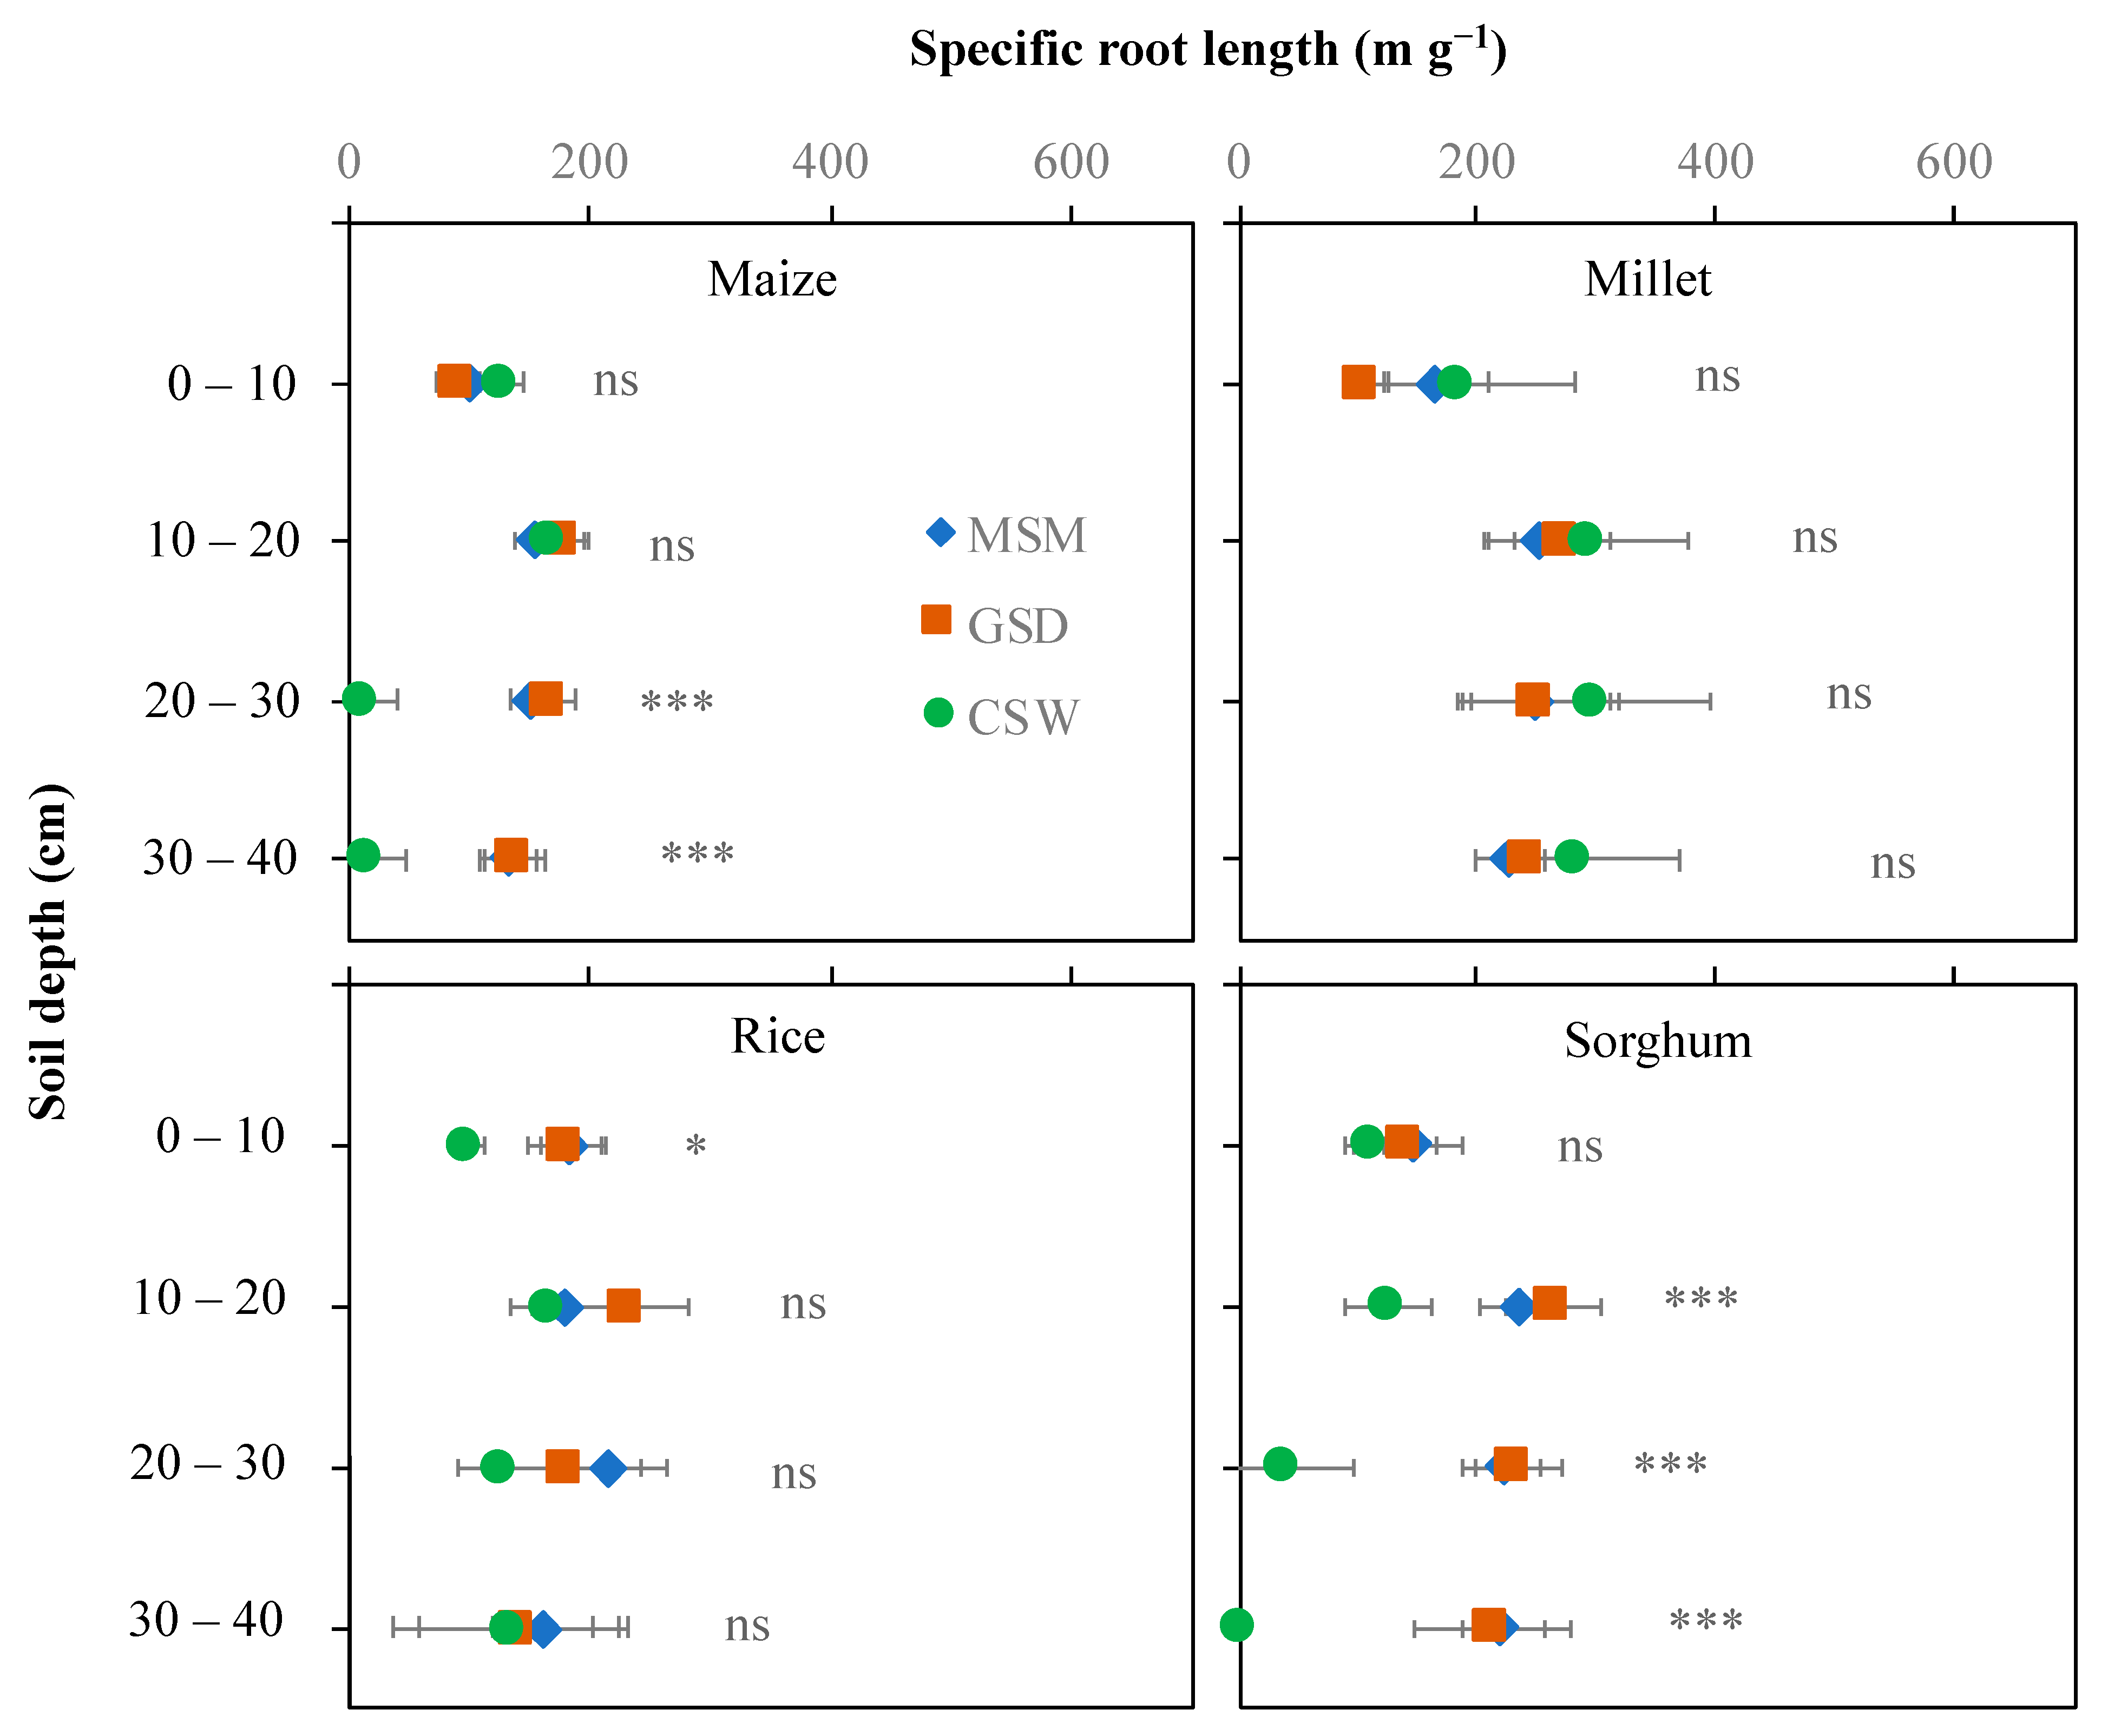
The effect of soil moisture content on specific root length differed depending on the crop and soil layer (Figure 5). In maize, a significant effect of soil moisture treatment was found in the 20–40 cm soil layer, whereas CSW reduced specific root length in the 20–30 cm soil layer compared with MSM and GSD. In rice and millet, there were no significant effects of soil moisture treatment on specific root length in any soil layer, except in rice grown under CSW, which showed a significantly reduced specific root length in the 0–10 cm soil layer compared with both MSM and GSD. In sorghum, a significant effect of water treatment in the 10–40 cm soil layer under CSW decreased specific root length compared with MSM but not under GSD compared with MSM.

3.4. Analysis of Interaction between Biomass Production of Crops and Soil Moisture Environment

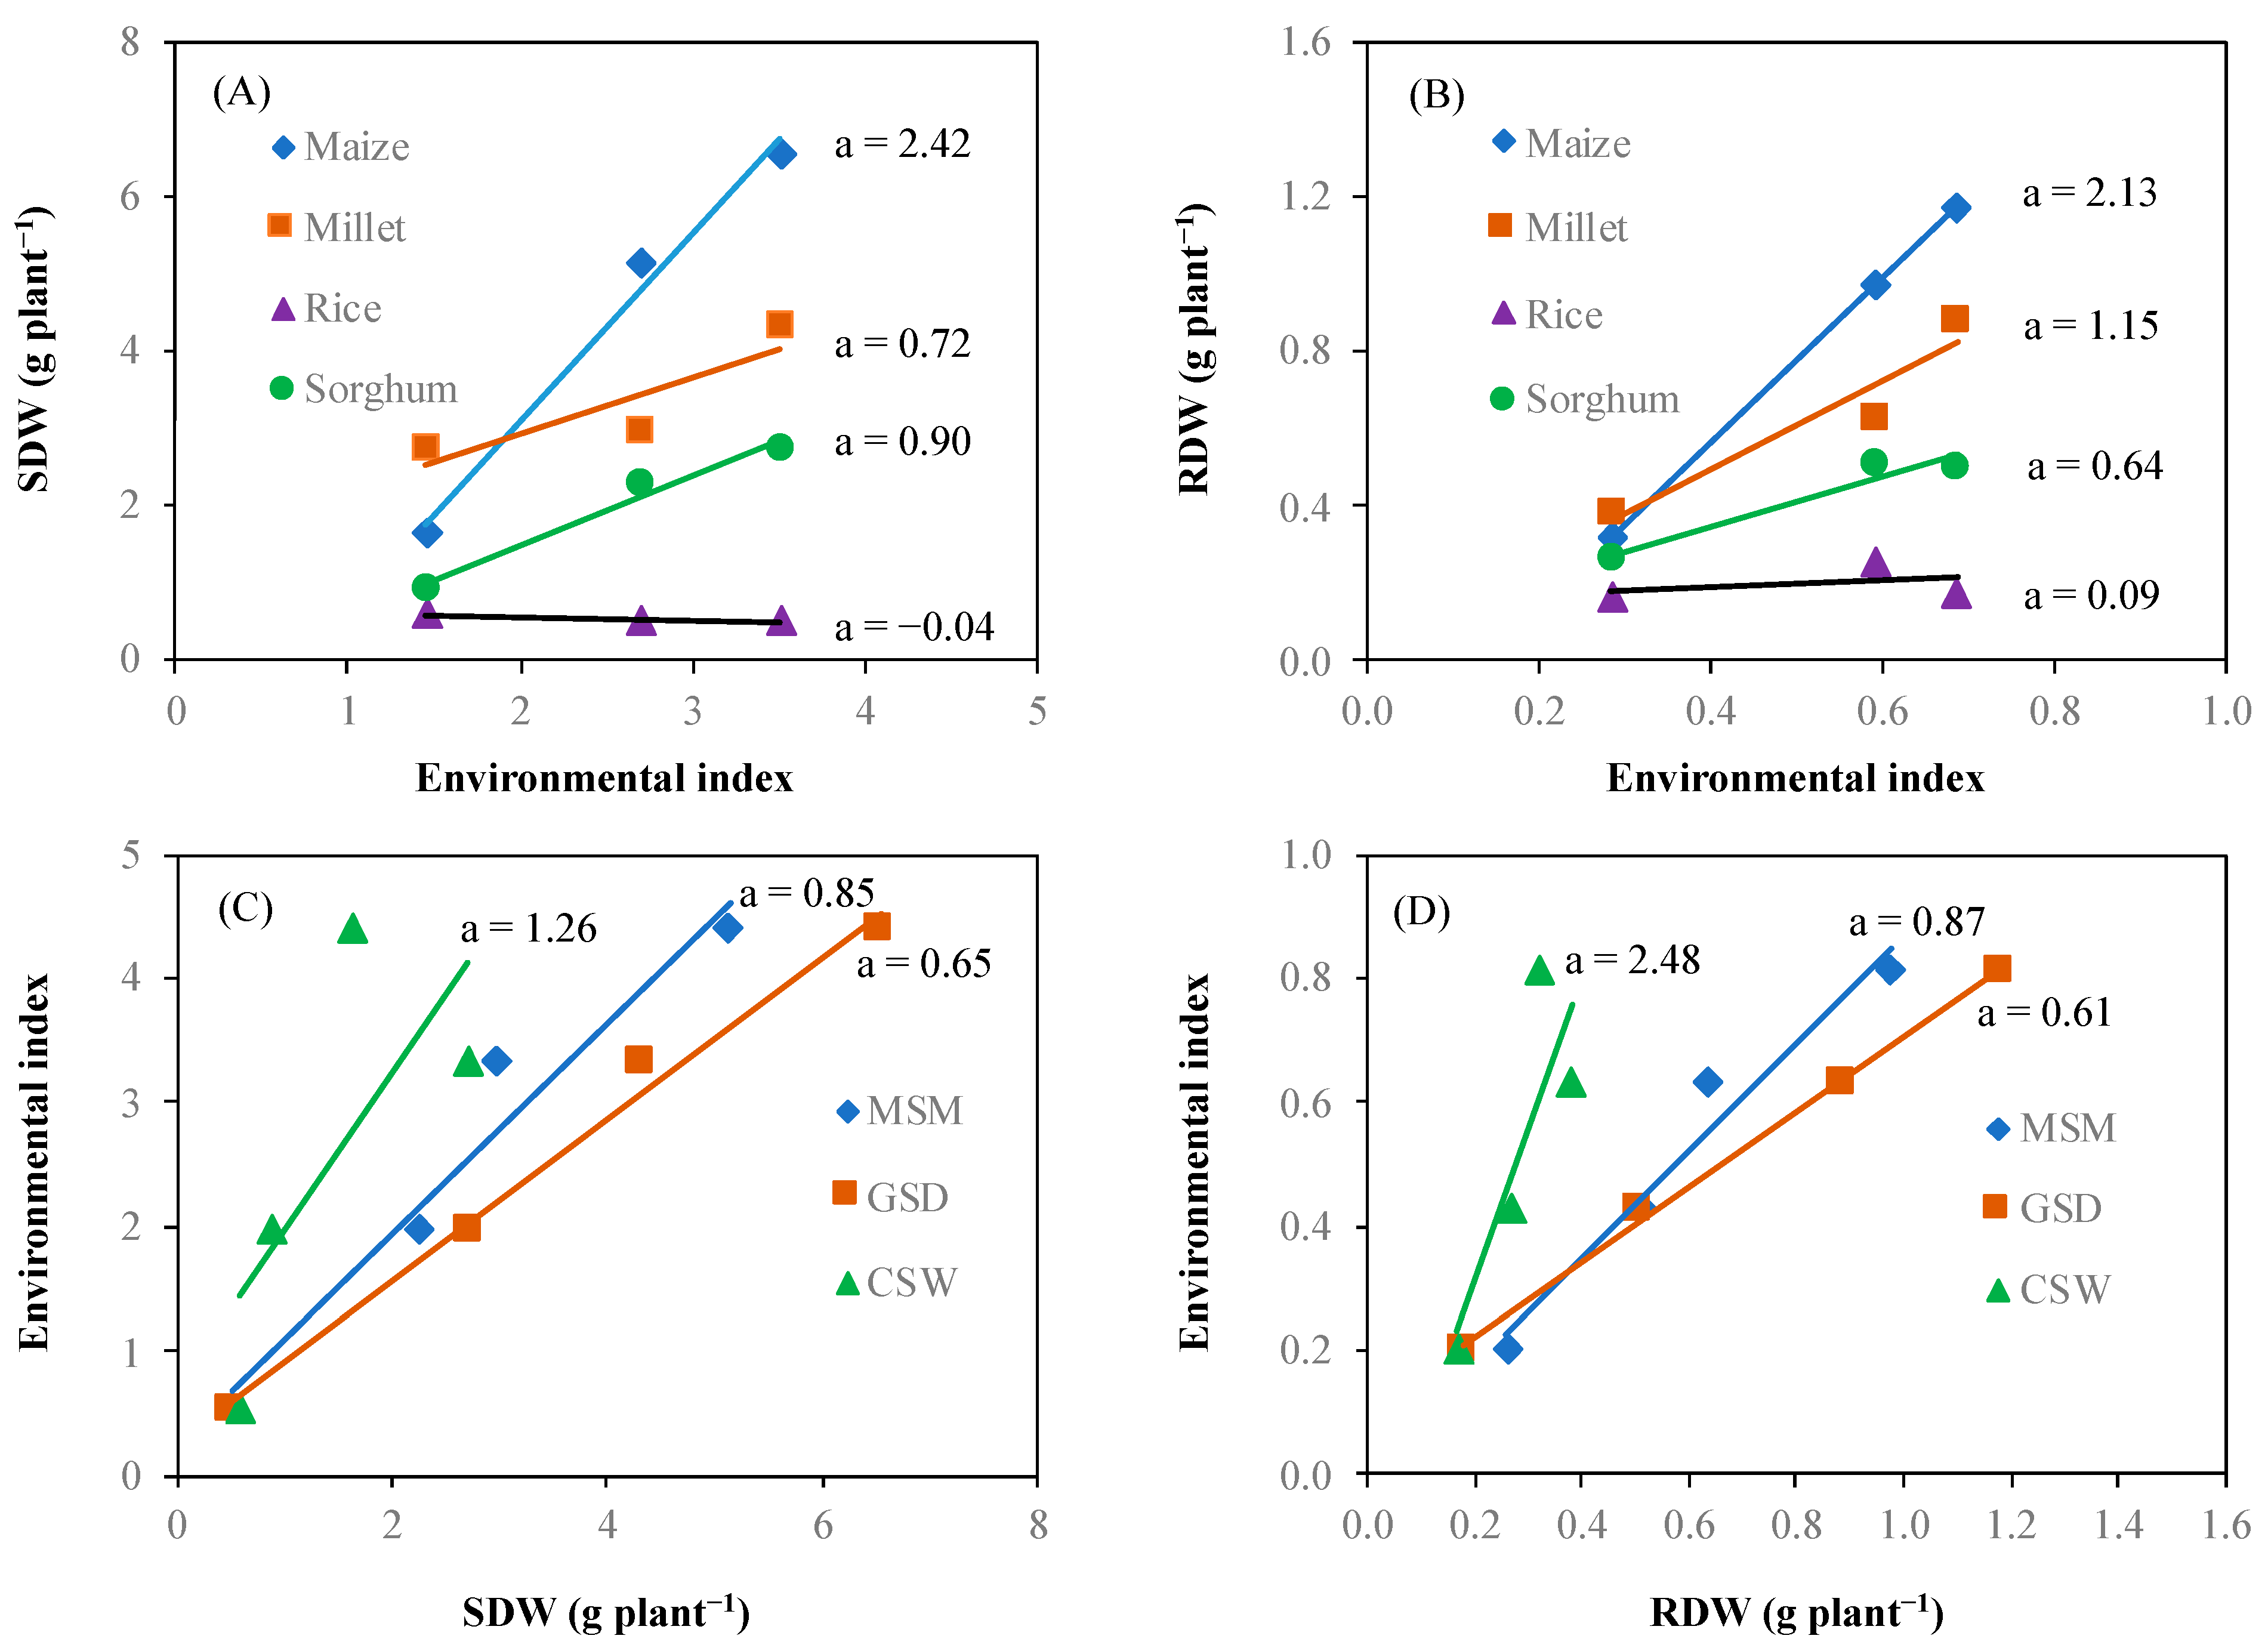
Figure 6 shows the crop genotype × environment interaction for shoot dry weight and root dry weight. Crops showed different responses to changes in the environmental index. The relationship between the environmental index and shoot dry weight of specific crop genotype showed that the difference of shoot dry weight between crop genotype at the lowest environmental index (1.46) was smaller than that of the highest environmental index (3.51) (a). According to the simple regression equation of interaction between the environmental index and crop genotype based on shoot dry weight, the regression coefficients (a) showed positive values for maize (2.42), sorghum (0.90), and millet (0.72). However, rice showed a negative regression coefficient (−0.04). The interaction between environment and crop genotype based on root dry weight demonstrated similarly tendency with shoot dry weight among the crop genotypes with respect to the environmental index. The regression coefficient of the simple regression equation for the interaction was 2.13 for maize, 1.15 for millet, 0.64 for sorghum, and 0.09 for rice. The average of shoot dry weight across crop genotypes indicated a lowest value at 0.50 g plant−1 and highest value at 6.53 g plant−1. According to the simple regression equation, CSW had the highest environmental index. The regression coefficient between the average shoot dry weight and root dry weight across crop genotypes and environmental indices was lower in GSD than in CSW, which showed the highest regression coefficient.
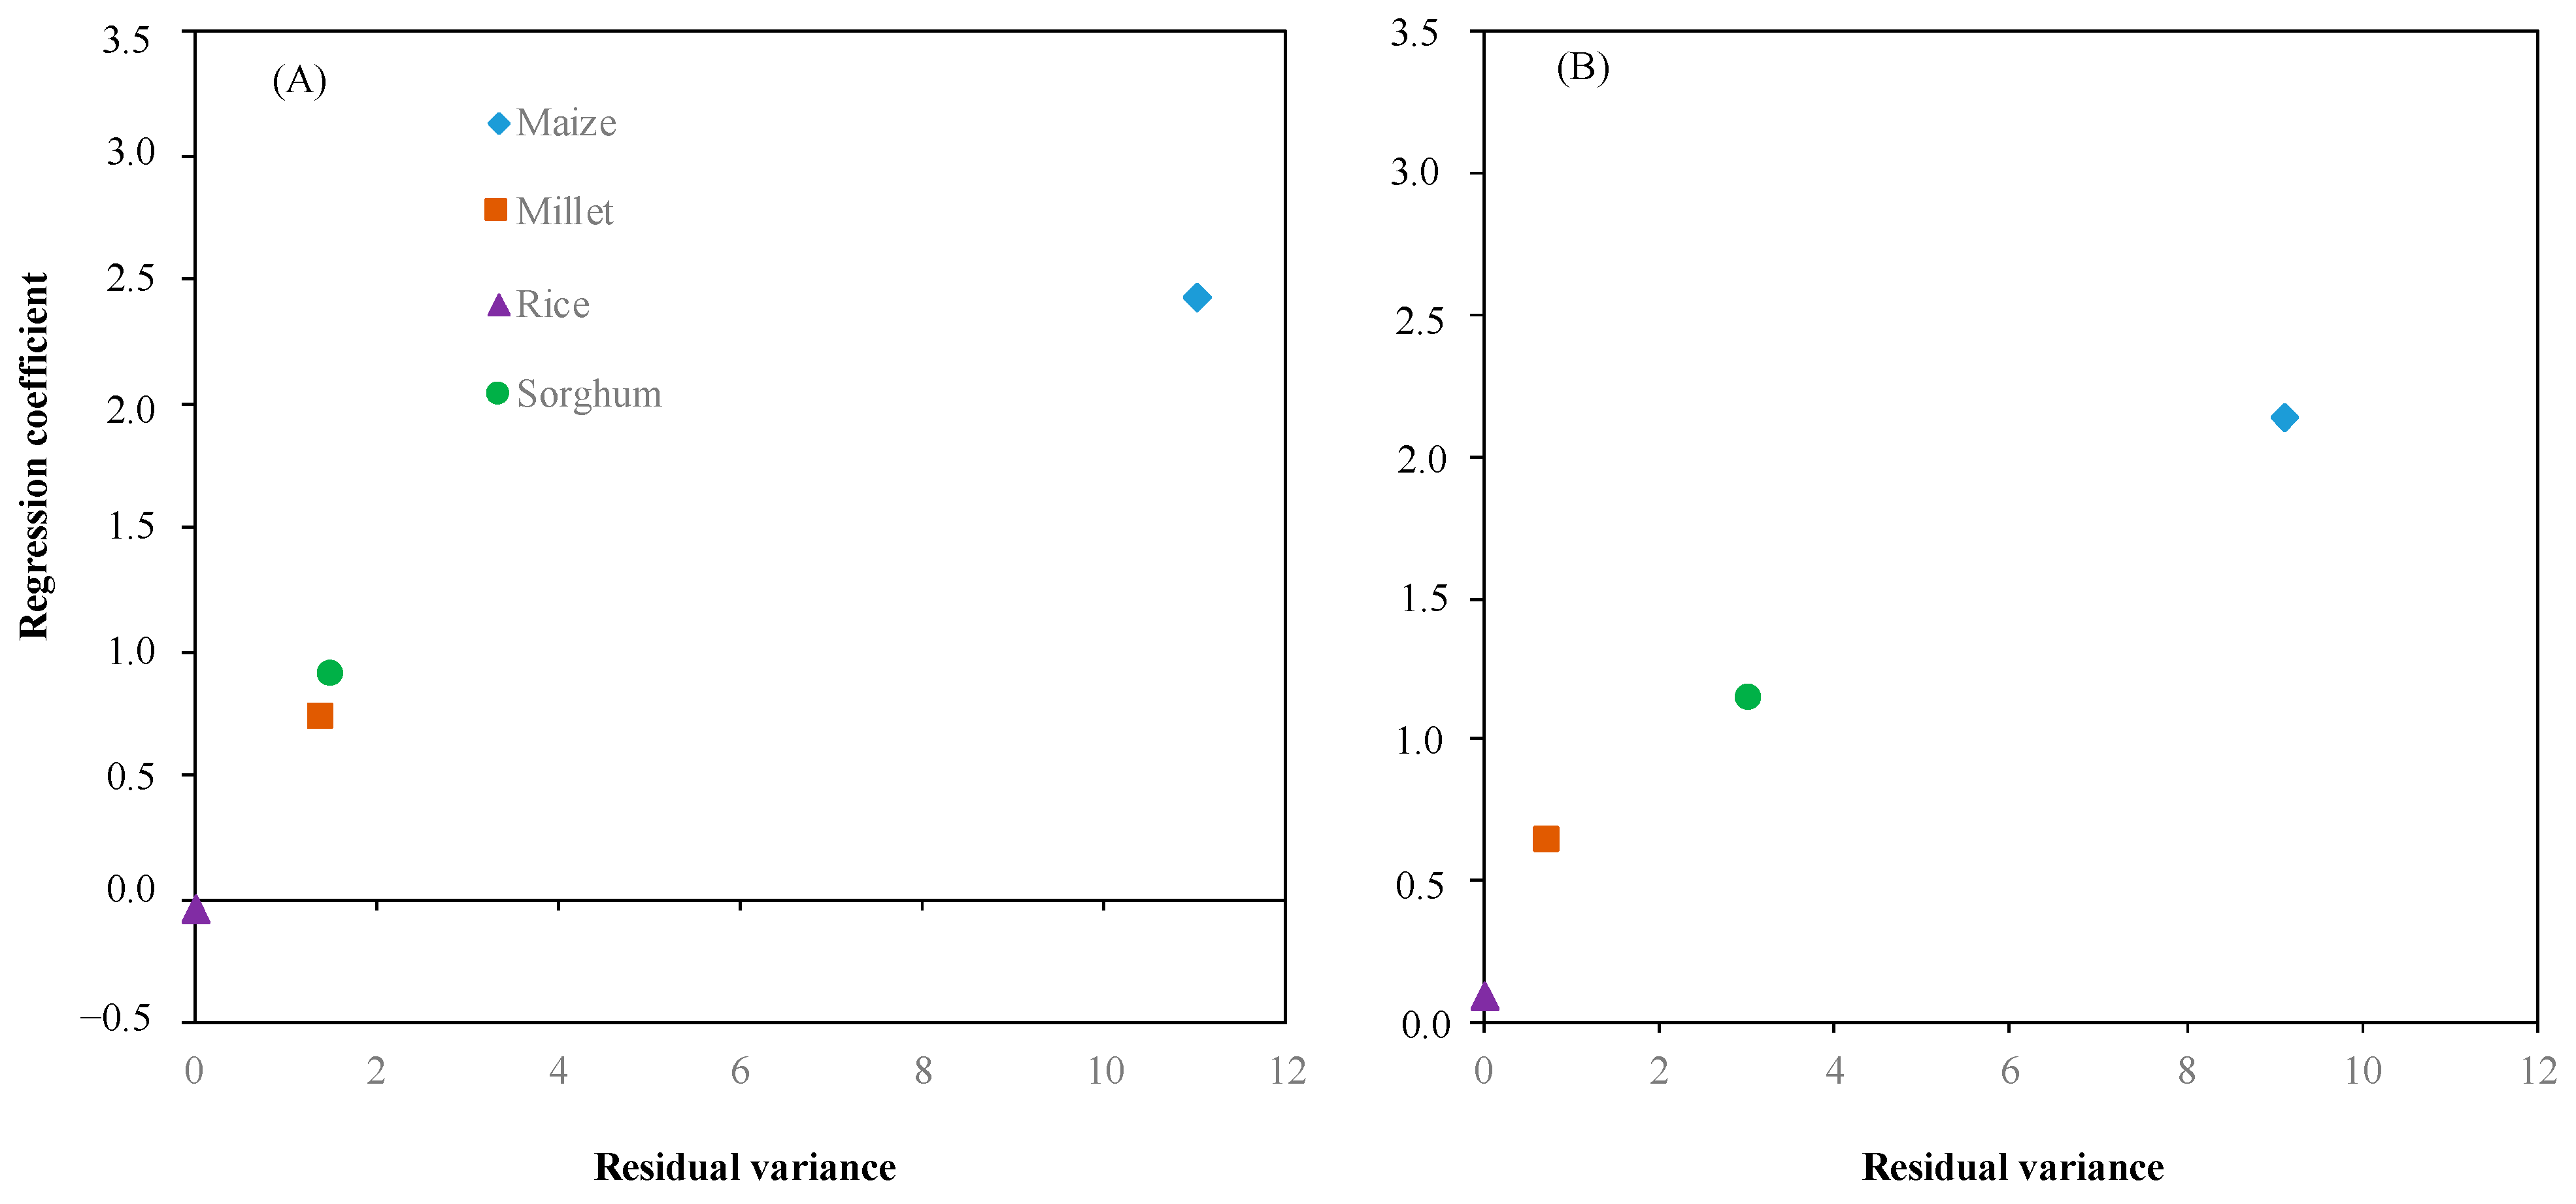
Based on crop response to the environment (Figure 6A,B), we calculated the residual variance to plot against the regression coefficient for estimating the ability of crop adaptation to the environments. Figure 7 illustrates each crop adaptation to the environments. The performance of each crop showed a similar trend of response for shoot dry weight and root dry weight. Maize displayed the highest regression coefficient 2.42 and 2.13 for shoot dry weight and root dry, respectively, and residual variance 10.99 and 9.08 for shoot dry weight and root dry weight, respectively. On the other hand, rice has the lowest regression coefficient −0.04 and 0.09 for shoot dry weight and root dry weight, respectively, and residual variance 0.00 and 0.01 for shoot dry weight and root dry weight, respectively. Regression coefficient and residual variance of millet and sorghum were close to rice on shoot dry weight and root dry weight compared to maize.

4. Discussion

4.1. Soil Moisture Status Affects Root Morphology and Distribution

In this study, we evaluated the root distribution of major cereal crops under water stress conditions at an early growth stage. The response of root distribution to different soil moisture treatments was distinctively different among the four cereal crops. Based on the root distribution at the subsoil layer, maize, millet, and sorghum had more extensive root growth compared to dry soil conditions (Figure 3). On the other hand, under waterlogged conditions, rice and millet exhibited more vigorous root elongation compared to maize and sorghum in the root length distribution. The root distribution at the deeper soil layer is important for maintaining or promoting better shoot growth under dry soil conditions. Maize and millet had a higher SDW under GSD than under MSM and CSW in this study. An advantage of root distribution in the deep soil layer is that it is beneficial to absorb water from further underground under drought conditions [18,19,20,21]. The poor extensive root growth under CSW in maize and sorghum resulted in less leaf expansion and shoot growth. The limitation of root distribution in the subsoil layer under waterlogging is caused by anoxic conditions [43,44], which prohibit root respiration and elongation because waterlogged soil supplies insufficient oxygen to the submerged root. It is well known that rice grows well under anaerobic conditions. Its root induces aerenchyma and a tight barrier to radial oxygen loss (ROL) along the root during waterlogging for transport of oxygen to the root tip [14,45]. Similarly, Japanese barnyard millet can induce thick cortical sclerenchyma in the nodal root [46]. Maize and sorghum are also able to form aerenchyma in new adventitious roots just as rice does when the root zone is flooded, but maize has smaller and larger aerenchyma and living cells, respectively, within the root as compared to rice, which causes an insufficient oxygen diffusion rate from the aerenchyma to the root tip [45]. Such aerenchyma formation in maize might be the same as that in sorghum. Sorghum (Sorghum bicolor Moench. cv. high grain sorghum) is susceptible to waterlogging at the early growth stage, even though its root traits can induce aerenchyma [47]. Our study did not generate data on physiological traits, such as aerenchyma formation, and ROL barrier oxygen loss in the root might be the key to crop adaptation under waterlogging. Thus, further study is required to evaluate the genotypic difference in aerenchyma formation and ROL barriers among these four crops.

4.2. Effect of Soil Moisture Status on Shoot and Root Biomass Production

The genotype by environment interaction was analyzed in terms of shoot and root biomass (Figure 6). The four crops exhibited a distinct difference in response to water status. The root and shoot growth of maize, millet, and sorghum strongly responded to favorable water status environments, while rice did not show a correlation of root and shoot growth between specific environments (Figure 6A,B). This indicates that rice is well adapted across soil moisture conditions from dry to waterlogged. In other words, the reaction of rice to moisture is insensitive in this study. The wide adaptability specific to rice is in good agreement with a previous study, which reported that short-term GSD and decrease in soil moisture content (from 16% to 6%) had no or little effect on the shoot growth of rice [48]. The root dry weight of millet was decreased by CSW, but its shoot dry weight did not decrease compared to MSM (Table 1). However, shoot dry weight and root dry weight increased under GSD, and shoot dry weight and root dry weight adequately responded to a favorable soil moisture condition with a higher environmental index. Japanese barnyard millet can induce cortical sclerenchyma in the nodal root [46]; this enhances water use efficiency for maintaining or increasing the aboveground parts [49]. However, shoot growth of the Japanese barnyard cultivar decreases when it is grown under severe drought and compacted soil conditions due to the limitations of root elongation with regard to uptake of water in deep soil [46,49]. Our study showed that roots increased at deeper soil layers under GSD. The correlation between environmental index and average of shoot dry weight and root dry weight showed that the different responses to soil moisture treatments under GSD promoted higher shoot dry weight and root dry weight in the favorable soil moisture condition with a higher environmental index than in the unfavorable soil moisture condition with a lower environmental index in CSW (Figure 6C,D). Consequences of the phenotypic variation depend largely on the environment. This interaction between the crop genotype and environment can be used to analyze the stability of genotypes in cereal crops under various soil water statuses. Genetic and environmental interactions occur when the effect of the environmental exposure on a certain outcome is strongly influenced or is contingent upon the genotype [50]. In this study, the interaction between the crop genotype and environment was identified and was analyzed using the regression coefficient and regression residual variance (Figure 6 and Figure 7). Among the four crop genotypes, it was discerned that rice showed almost constant biomass productivity, which was mostly unaffected by the macroenvironmental factors evaluated in this study. In addition sorghum and millet also showed similar results because there was a lower regression coefficient and regression residual variance. By contrast, it was inferred that maize reacted variably to macro and specific environment and that variability in the environmental factors affected the variability in this genotype. As a result, GSD was the favorable environment for extending roots and shoots; however, CSW showed weak growth in maize. On the other hand, the growth response of rice across water status was poor. This means that rice can be widely adapted to soil moisture conditions ranging from dry to waterlogged.

4.3. Horizontal and Vertical Root Architecture Distribution across Soil Moisture Status

Genotypic differences were identified not only for root distribution in different soil columns, as mentioned above, but also for root distribution in different soil layers. The direction of root elongation in the soil column can be estimated by the root angle [51,52]. The root distribution to the sides of soil columns indicate shallow root angle, but middle soil column indicates steeper root angle. In the case of rice, vertical root elongation was related to a high degree of root angle-associated deep rooting, which is controlled by genes and governs the modification of root plasticity by the environment [21,35]. Under GSD, maize, millet, and sorghum promoted more horizontal root distribution at deeper soil layers. However, the root growth development in the vertical soil column showed different directions of root distribution at various soil layers; for example, maize showed more root development at the sides compared to middle of the soil column in all soil layers, but millet had higher root development in the middle than at the sides (Figure 4). These results mean the vertical root growth development is important for evaluating root response to soil drying conditions. Waterlogging limited the root distribution in different soil layers and root elongation to deeper soil layers in maize and sorghum (Figure 3). Besides the root distribution in maize and sorghum, most of the root developed only in the middle of the soil column, close to the stem base. By observation, some new emerging roots were produced, and some roots escaped above the soil surface. Similarly, other studies have found that oxygen is the limiting factor for maize and sorghum grown under CSW conditions [53]. Some cereal crop species form aerenchyma to transport oxygen diffusion from the shoot to the root tip and induce ROL as a barrier against oxygen loss in the root under flooded soil. Rice and maize form aerenchyma in the root under flooded soil, but rice can induce a tight type of ROL in the outer cell layer of the roots [54,55]. It is suggested that soil moisture status affects the root architecture of crop genotype in cereals. In particular, in this study, the roots of maize and sorghum tended to increase their surface area to promote oxygen uptake from the air under waterlogged conditions with plasticity compared with the roots of rice and millet. Crop genotypes that showed high productivity regardless of whether the environment was good or bad have general adaptability but low regression coefficient based on the analysis of the environmental index. In that respect, the ability of rice to adapt to a wide range of moisture conditions is particularly beneficial for growth under rainfed conditions. By contrast, other crops, such as maize, are variable to unique environmental factors, which was clarified from the analysis of environmental impacts.

5. Conclusions

Root distribution associated with crop plasticity was influenced by soil water conditions in contrasting crop genotypes. Maize and sorghum depicted large changes in root distribution by promoting root plasticity in shallow and deep soil layers under anaerobic and aerobic conditions, respectively, while the root distribution of rice and millet was largely unaffected by soil moisture conditions. Root distribution was correlated with crop response and adaptation to changing soil water. The response of shoot dry weight and root dry weight under changing soil moisture environments from aerobic to anaerobic conditions showed a similar tendency and depended on the crops. Rice demonstrated a wider response and adaptation to a wide range of soil moisture conditions, which is beneficial for growth under rainfed conditions, unlike maize, which was adapted to unique soil moisture factors.

Author Contributions

Conceptualization, J.-I.S. and P.K.; methodology, P.K. and S.Y.; validation and analysis, J.-I.S. and P.K.; investigation, P.K.; writing—original draft preparation, P.K.; writing—review and editing, J.-I.S., H.A., S.Y., M.A.H. and I.A. All authors have read and agreed to the published version of the manuscript.

Funding

This research received no external funding.

Institutional Review Board Statement

Not applicable.

Informed Consent Statement

Not applicable.

Data Availability Statement

No new data were created or analyzed in this study. Data Sharing is not applicable to this article.

Acknowledgments

We are very grateful for the involvement of several of our colleagues. In particular, we would like to thank Yusaku Uga, a member of the National Agriculture and Food Organization (NARO), Japan, for giving suggestions on this study.

Conflicts of Interest

The authors declare no conflict of interest.

References

  1. United Nations. World Population Prospects 2019: Highlights; United Nations: New York, NY, USA, 2019. [Google Scholar]
  2. Rockström, J.; Karlberg, L.; Wani, S.P.; Barron, J.; Hatibu, N.; Oweis, T.; Bruggerman, A.; Farahani, J.; Qiang, Z. Managing water in rainfed agriculture—The need for a paradigm shift. Agric. Water Manag. 2010, 97, 543–550. [Google Scholar] [CrossRef] [Green Version]
  3. Giorgi, F.; Raffaele, F.; Coppola, E. The response of precipitation characteristics to global warming from climate projections. Earth Syst. Dyn. 2019, 10, 73–89. [Google Scholar] [CrossRef] [Green Version]
  4. Berg, A.; de Noblet-Ducoudre, N.; Sultan, B.; Lengaigne, M.; Guimberteau, M. Projections of climate change impacts on potential C4 crop productivity over tropical regions. Agric. For. Meteorol. 2013, 170, 89–102. [Google Scholar] [CrossRef]
  5. FAO. The Impact of Disasters and Crises on Agriculture and Food Security; FAO: Rome, Italy, 2018. [Google Scholar]
  6. Lynch, J.P. Roots of the second green revolution. Aust. J. Bot. 2007, 55, 493–512. [Google Scholar] [CrossRef]
  7. Den Herder, G.; Van Isterdael, G.; Beeckman, T.; De Smet, I. The roots of a new green revolution. Trends Plant Sci. 2010, 15, 600–607. [Google Scholar] [CrossRef] [PubMed]
  8. Lynch, J. Root architecture and plant productivity. Plant Physiol. 1995, 109, 7–13. [Google Scholar] [CrossRef]
  9. Comas, L.H.; Becker, S.R.; Cruz, V.M.V.; Byrne, P.F.; Dierig, D.A. Root traits contributing to plant productivity under drought. Front. Plant Sci. 2013, 4, 442. [Google Scholar] [CrossRef] [Green Version]
  10. Suralta, R.; Inukai, Y.; Yamauchi, A. Shoot dry matter production in relation to root growth, oxygen transport and water uptake under transient soil moisture stresses in rice. Plant Soil 2010, 332, 87–104. [Google Scholar] [CrossRef]
  11. Vadez, V. Root hydraulics: The forgotten side of roots in drought adaptation. Field Crops Res. 2014, 165, 15–24. [Google Scholar] [CrossRef] [Green Version]
  12. Wasson, A.P.; Richards, R.A.; Chatrath, R.; Misra, S.C.; Prasad, S.V.P.; Rebetzke, G.J.; Kirkegaard, J.A.; Christopher, J.; Watt, M. Traits and selection strategies to improve root systems and water uptake in water-limited wheat crops. J. Exp. Bot. 2012, 63, 3485–3498. [Google Scholar] [CrossRef] [Green Version]
  13. Weaver, J.E.; Jean, F.C.; Crist, J.W. Development and Activities of Roots of Crop Plants: A Study in Crop Ecology; Carnegie Institution of Washington: Washington, DC, USA, 1922. [Google Scholar]
  14. Yamauchi, T.; Colmer, T.D.; Pedersen, O.; Nakazono, M. Regulation of root traits for internal aeration and tolerance to soil waterlogging-flooding stress. Plant Physiol. 2018, 176, 1118–1130. [Google Scholar] [CrossRef] [Green Version]
  15. McMichael, B.; Quisenberry, J. The impact of the soil environment on the growth of root systems. Environ. Exp. Bot. 1993, 33, 53–61. [Google Scholar] [CrossRef]
  16. Grossman, J.D.; Rice, K.J. Evolution of root plasticity responses to variation in soil nutrient distribution and concentration. Evol. Appl. 2012, 5, 850–857. [Google Scholar] [CrossRef]
  17. Fry, E.L.; Evans, A.L.; Sturrock, C.J.; Bullock, J.M.; Bardgett, R.D. Root architecture governs plasticity in response to drought. Plant Soil 2018, 433, 189–200. [Google Scholar] [CrossRef] [Green Version]
  18. Gregory, P.J. Plant Roots: Growth, Activity and Interactions with the Soil; John Wiley & Sons: Hoboken, NJ, USA, 2008. [Google Scholar]
  19. Hund, A.; Ruta, N.; Liedgens, M. Rooting depth and water use efficiency of tropical maize inbred lines, differing in drought tolerance. Plant Soil 2009, 318, 311–325. [Google Scholar] [CrossRef] [Green Version]
  20. Lynch, J.; Wojciechowski, T. Opportunities and challenges in the subsoil: Pathways to deeper rooted crops. J. Exp. Bot. 2015, 66, 2199–2210. [Google Scholar] [CrossRef] [Green Version]
  21. Uga, Y.; Sugimoto, K.; Ogawa, S.; Rane, J.; Ishitani, M.; Hara, N.; Kitomi, Y.; Inukai, Y.; Ono, K.; Kanno, N.; et al. Control of root system architecture by DEEPER ROOTING 1 increases rice yield under drought conditions. Nat. Genet. 2013, 45, 1097–1102. [Google Scholar] [CrossRef] [PubMed]
  22. Liao, H.; Rubio, G.; Yan, X.; Cao, A.; Brown, K.M.; Lynch, J.P. Effect of phosphorus availability on basal root shallowness in common bean. Plant Soil 2001, 232, 69–79. [Google Scholar] [CrossRef]
  23. Li, Y.; Song, X.; Li, S.; Salter, W.T.; Barbour, M.M. The role of leaf water potential in the temperature response of mesophyll conductance. New Phytol. 2020, 225, 1193–1205. [Google Scholar] [CrossRef] [PubMed]
  24. Orman-Ligeza, B.; Parizot, B.; Gantet, P.P.; Beeckman, T.; Bennett, M.J.; Draye, X. Post-embryonic root organogenesis in cereals: Branching out from model plants. Trends Plant Sci. 2013, 18, 459–467. [Google Scholar] [CrossRef] [PubMed]
  25. Coudert, Y.; Perin, C.; Courtois, B.; Khong, N.G.; Gantet, P. Genetic control of root development in rice, the model cereal. Trends Plant Sci. 2010, 15, 219–226. [Google Scholar] [CrossRef]
  26. Falconer, D.; Mackay, T. Introduction to Quantitative Genetics, 4th ed.; Addison Wesley Longman: Harlow, UK, 1996. [Google Scholar]
  27. MacMillan, K.; Emrich, K.; Pepho, H.-P.; Mullins, C.E.; Price, A.H. Assessing the importance of genotype× environment interaction for root traits in rice using a mapping population II: Conventional QTL analysis. Theor. Appl. Genet. 2006, 113, 953–964. [Google Scholar] [CrossRef]
  28. Lopez-Bucio, J.; Cruz-Ramirez, A.; Herrera-Estrella, L. The role of nutrient availability in regulating root architecture. Curr. Opin. Plant Biol. 2003, 6, 280–287. [Google Scholar] [CrossRef]
  29. Malamy, J. Intrinsic and environmental response pathways that regulate root system architecture. Plant Cell Environ. 2005, 28, 67–77. [Google Scholar] [CrossRef] [PubMed]
  30. Ho, M.D.; McCannon, B.C.; Lynch, J.P. Optimization modeling of plant root architecture for water and phosphorus acquisition. J. Theor. Biol. 2004, 226, 331–340. [Google Scholar] [CrossRef]
  31. Singh, V.; van Oosterom, E.J.; Jordan, D.R.; Messina, C.D.; Cooper, M.; Hammer, G.L. Morphological and architectural development of root systems in sorghum and maize. Plant Soil 2010, 333, 287–299. [Google Scholar] [CrossRef]
  32. Lin, C.; Sauter, M. Control of adventitious root architecture in rice by darkness, light, and gravity. Plant Physiol. 2018, 176, 1352–1364. [Google Scholar] [CrossRef] [PubMed] [Green Version]
  33. Magalhães, P.C.; de Souza, T.C.; Lavinsky, A.O.; Albuquerque, P. Phenotypic plasticity of root system and shoots of Sorghum bicolor under different soil water levels during pre-flowering stage. Aust. J. Crop Sci. 2016, 10, 81–87. [Google Scholar]
  34. Myers, R. The root system of a grain sorghum crop. Field Crops Res. 1980, 3, 53–64. [Google Scholar] [CrossRef]
  35. Kano-Nakata, M.; Gowda, V.R.P.; Henry, A.; Serraj, R.; Inukai, Y.; Fujita, D.; Kobayashi, N.; Suralta, R.R.; Yamauchi, A. Functional roles of the plasticity of root system development in biomass production and water uptake under rainfed lowland conditions. Field Crops Res. 2013, 144, 288–296. [Google Scholar] [CrossRef]
  36. Kano-Nakata, M.; Nakamura, T.; Mitsuya, S.; Yamauchi, A. Plasticity in root system architecture of rice genotypes exhibited under different soil water distributions in soil profile. Plant Prod. Sci. 2019, 22, 501–509. [Google Scholar] [CrossRef]
  37. Kono, Y.; Yamauchi, A.; Nonoyama, T.; Tatsumi, J.; Kawamura, N. A revised experimental system of root-soil interaction for laboratory workr. Environ. Control Biol. 1987, 25, 141–151. [Google Scholar] [CrossRef]
  38. Yamauchi, A.; Kono, T.; Tatsumi, J. Quantitative analysis on root system structures of upland rice and maize. Jpn. J. Crop Sci. 1987, 56, 608–617. [Google Scholar] [CrossRef] [Green Version]
  39. Sandhu, N.; Raman, K.A.; Torres, R.O.; Audebert, A.; Dardou, A.; Kumar, A.; Henry, A. Rice root architectural plasticity traits and genetic regions for adaptability to variable cultivation and stress conditions. Plant Physiol. 2016, 171, 2562–2576. [Google Scholar] [CrossRef] [PubMed] [Green Version]
  40. Gu, D.; Zhen, F.; Hannaway, D.B.; Zhu, Y.; Liu, L.; Cao, W.; Tang, L. Quantitative classification of rice (Oryza sativa L.) root length and diameter using image analysis. PLoS ONE 2017, 12, e0169968. [Google Scholar] [CrossRef]
  41. Passot, S.; Gnacko, F.; Moukouanga, D.; Lucas, M.; Guyomarc’h, S.; Ortega, B.M.; Atkinson, J.A.; Belko, M.N.; Bennett, M.J.; Gantet, P.; et al. Characterization of pearl millet root architecture and anatomy reveals three types of lateral roots. Front. Plant Sci. 2016, 7, 829. [Google Scholar] [CrossRef] [Green Version]
  42. Finlay, K.W.; Wilkinson, G.N. The analysis of adaptation in a plant-breeding programme. Aust. J. Agric. Res. 1963, 14, 742–754. [Google Scholar] [CrossRef] [Green Version]
  43. Vartapetian, B.B.; Jackson, M.B. Plant adaptations to anaerobic stress. Ann. Bot. 1997, 79, 3–20. [Google Scholar] [CrossRef]
  44. Biemelt, S.; Keetman, U.; Albrecht, G. Re-aeration following hypoxia or anoxia leads to activation of the antioxidative defense system in roots of wheat seedlings. Plant Physiol. 1998, 116, 651–658. [Google Scholar] [CrossRef] [Green Version]
  45. Yamauchi, T.; Abe, F.; Tsutsumi, N.; Nakazono, M. Root cortex provides a venue for gas-space formation and is essential for plant adaptation to waterlogging. Front. Plant Sci. 2019, 10, 259. [Google Scholar] [CrossRef]
  46. Galamay, T.O.; Kono, Y.; Yamauchi, A.; Shimizu, M. Comparative root anatomy of seminal and nodal root axes of summer cereals with special reference to the development of hypodermis and cortical sclerenchyma. Jpn. J. Crop Sci. 1991, 60, 184–190. [Google Scholar] [CrossRef] [Green Version]
  47. Promkhambut, A.; Polthanee, A.; Akkasaeng, C.; Younger, A. Growth, yield and aerenchyma formation of sweet and multipurpose sorghum (Sorghum bicolor L. Moench) as affected by flooding at different growth stages. Aust. J. Crop Sci. 2011, 5, 954–965. [Google Scholar]
  48. Kartika, K.; Sakagami, J.-I.; Lakitan, B.; Yabuta, S.; Wijaya, A.; Kadir, S.; Widuri, L.I.; Siaga, E.; Nakao, Y. Morpho-physiological response of Oryza glaberrima to gradual soil drying. Rice Sci. 2020, 27, 67–74. [Google Scholar] [CrossRef]
  49. Zegada-Lizarazu, W.; Iijima, M. Deep root water uptake ability and water use efficiency of pearl millet in comparison to other millet species. Plant Prod. Sci. 2005, 8, 454–460. [Google Scholar] [CrossRef]
  50. Kang, M.S. Using genotype-by-environment interaction for crop cultivar development. Adv. Agron. 1997, 62, 199–252. [Google Scholar]
  51. Borrell, A.K.; Mullet, J.E.; George-Jaeggli, B.; van Oosterom, E.J.; Hammer, G.L.; Klein, P.E.; Jordan, D.R. Drought adaptation of stay-green sorghum is associated with canopy development, leaf anatomy, root growth, and water uptake. J. Exp. Bot. 2014, 65, 6251–6263. [Google Scholar] [CrossRef]
  52. Ali, M.L.; Luetchens, J.; Nascimento, K.; Shaver, T.M.; Kruger, G.R.; Lorenz, A.J. Genetic variation in seminal and nodal root angle and their association with grain yield of maize under water-stressed field conditions. Plant Soil 2015, 397, 213–225. [Google Scholar] [CrossRef]
  53. Colmer, T.D.; Voesenek, L. Flooding tolerance: Suites of plant traits in variable environments. Funct. Plant Biol. 2009, 36, 665–681. [Google Scholar] [CrossRef]
  54. Yamauchi, T.; Shimamura, S.; Nakazono, M.; Mochizuki, T. Aerenchyma formation in crop species: A review. Field Crops Res. 2013, 152, 8–16. [Google Scholar] [CrossRef]
  55. Colmer, T. Long-distance transport of gases in plants. A perspective on internal aeration and radial oxygen loss from roots. Plant Cell Environ. 2003, 26, 17–36. [Google Scholar] [CrossRef] [Green Version]
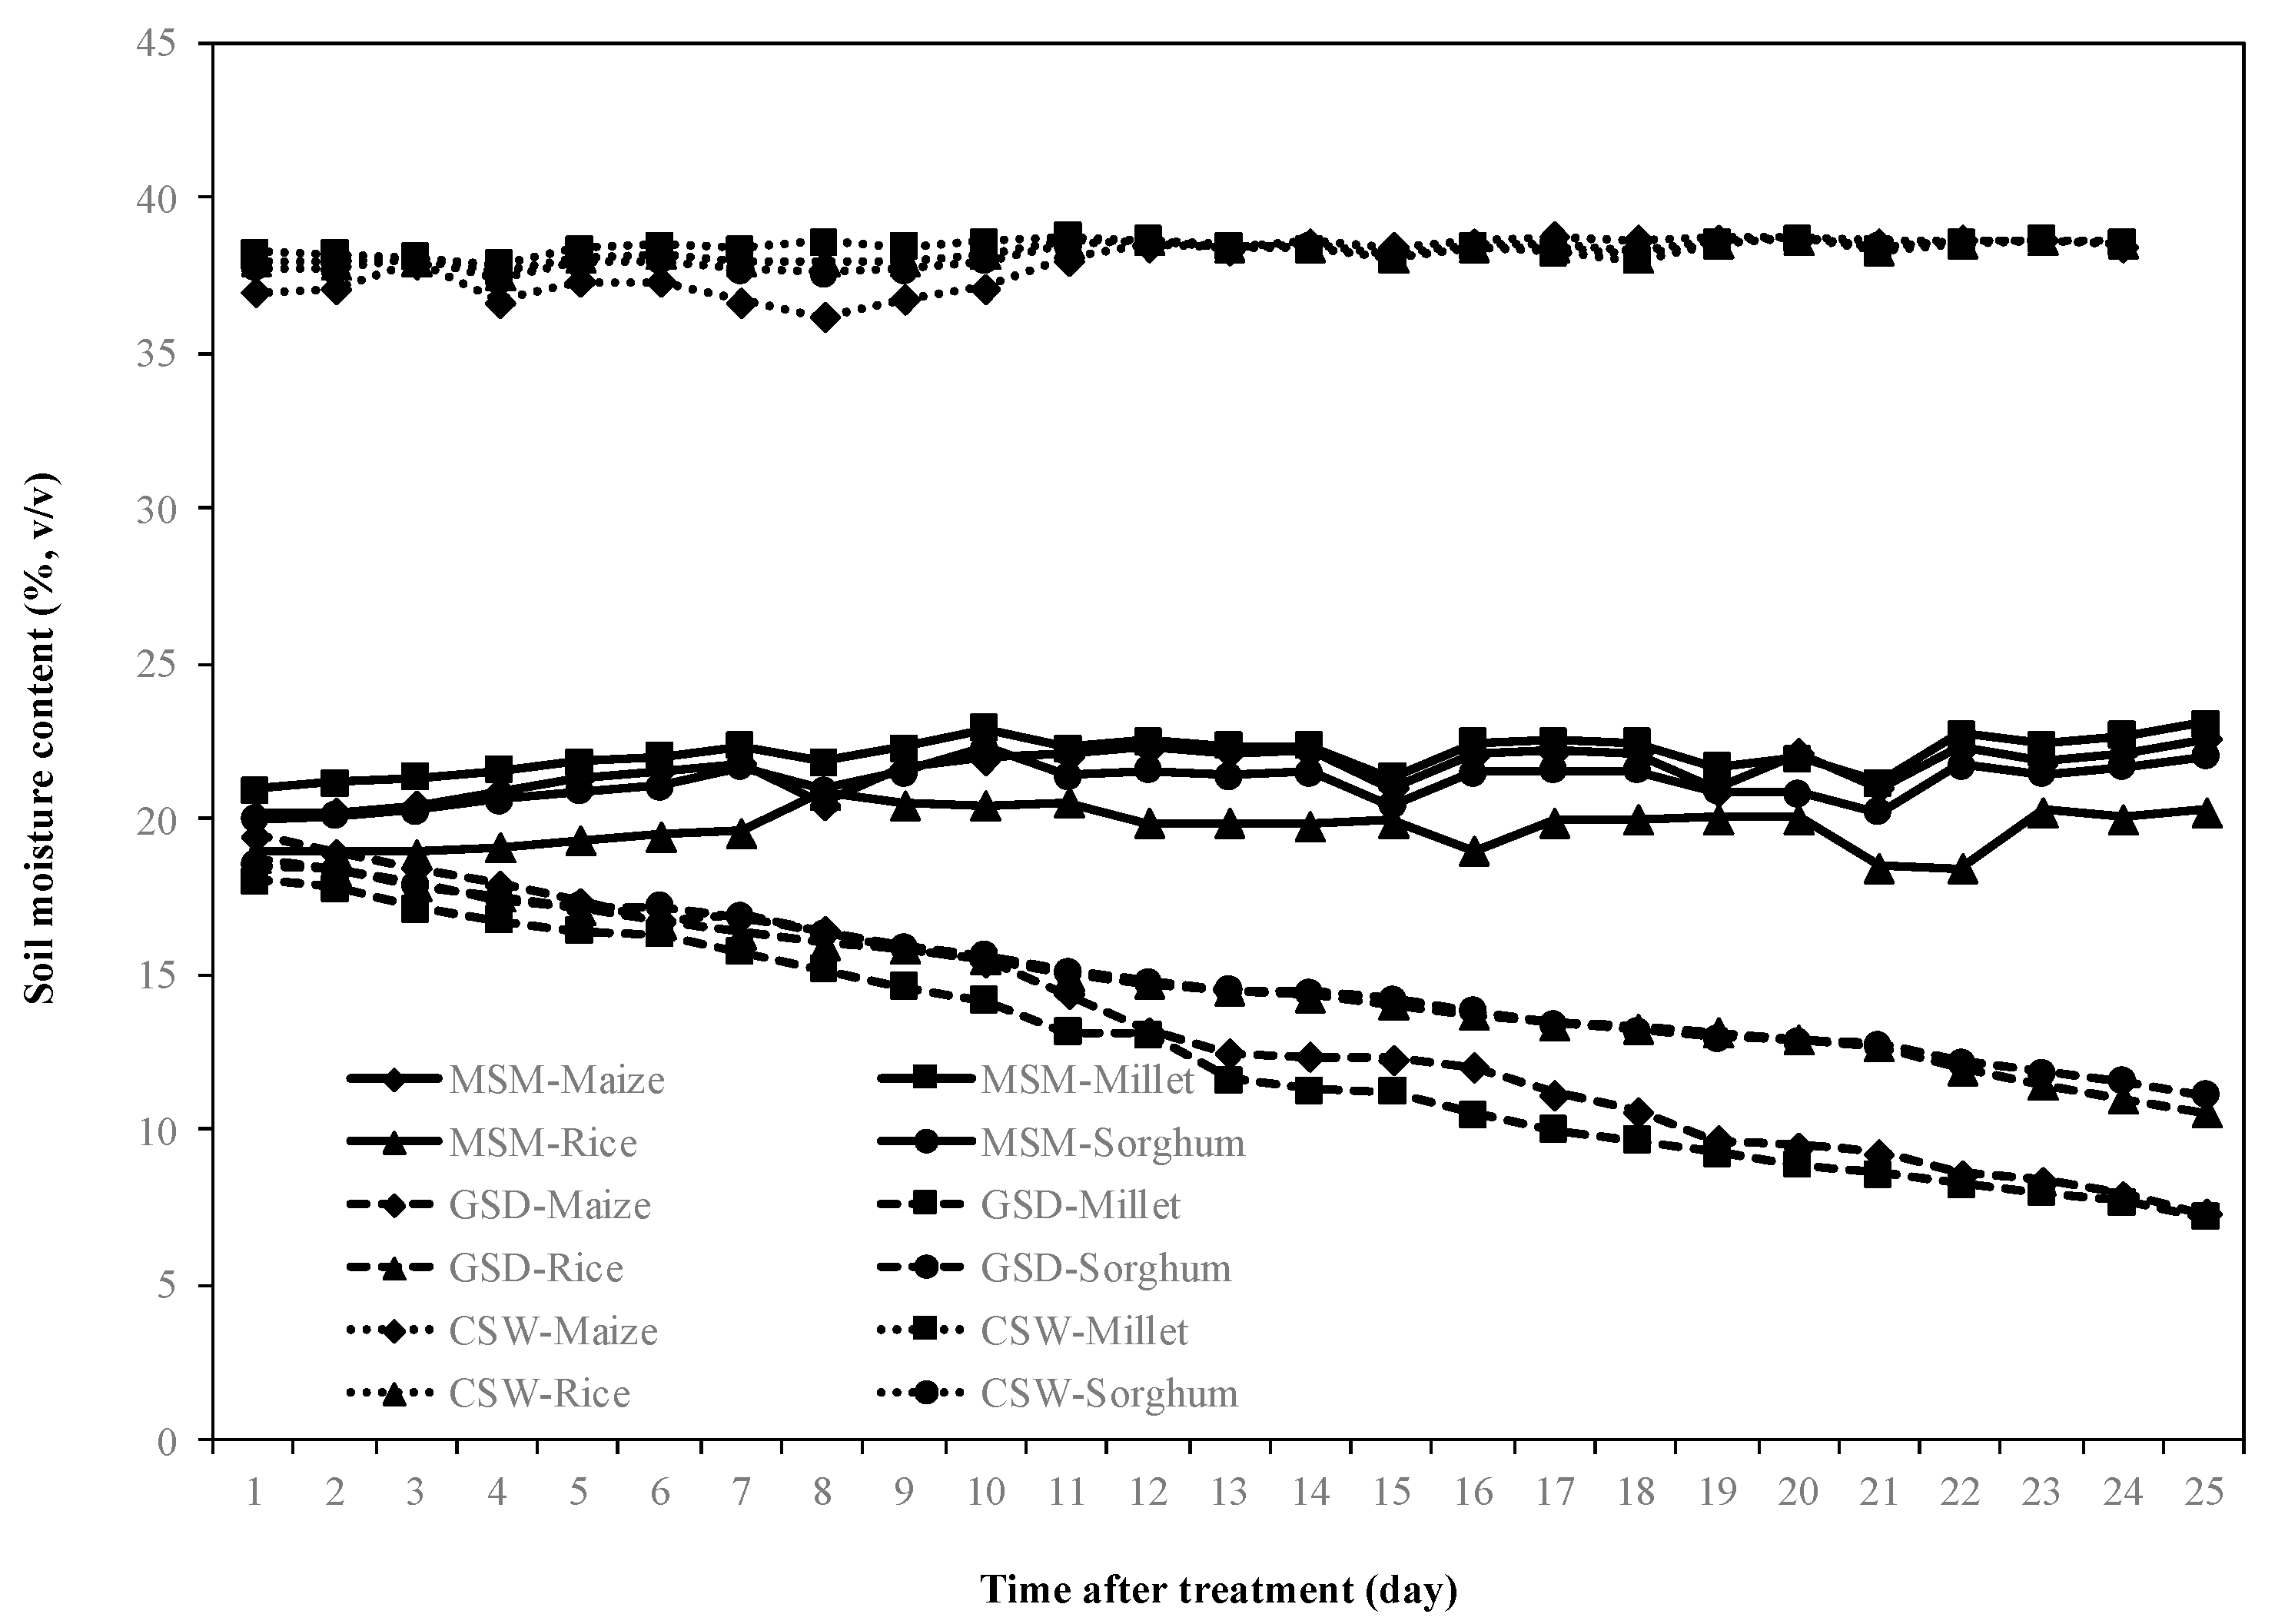
Figure 1. Soil moisture dynamics at a depth of 20 cm from the top of the root box during the experiment. The value shown is an average of readings from maize (◆), millet (■), rice (▲), and sorghum (●) under moderate soil moisture content (MSM) (straight line), gradual soil drying (GSD) (stitch line) and continuous soil waterlogging (CSW) (dotted line).
Agronomy 11 00708 g001
Figure 2. Representative two-dimensional root images of maize, millet, rice, and sorghum grown under moderate soil moistures (MSM), gradual drying soil (GSD), and continuous waterlogging (CSW) for 25 days after treatment.
Agronomy 11 00708 g002
Figure 3. Effect of moderate soil moisture (MSM (◆)), gradual soil drying (GSD (■) and continuous soil waterlogging (CSW (●)) on the total root length density distribution in different soil layers in maize, millet, rice, and sorghum. *, ***, and ns indicate statistical significance at p < 0.05, p < 0.001, and nonsignificance, respectively. Bar values indicate means ± standard deviation.
Agronomy 11 00708 g003
Figure 4. Effect of moderate soil moisture (MSM), gradual soil drying (GSD) and continuous soil waterlogging (CSW) on total root length density distribution in different soil columns in maize, millet, rice, and sorghum. Middle (○) denotes the value of total root length density distribution in the middle of the soil column, and Sides (●) signifies the average value of total root length density distribution in the left side and right side of the soil columns. *, ***, and ns indicate statistical significance at p < 0.05, p < 0.001, and nonsignificance, respectively. Bar values indicate means ± standard deviation.
Agronomy 11 00708 g004
Figure 5. Specific root length distribution in different soil layers of maize, millet, rice, and sorghum grown under moderate soil moisture (MSC (◆)), gradual soil drying (GSD (■)) and continuous soil waterlogging (CSW (●)). *, ***, and ns indicate statistical significance at p < 0.05, p < 0.001, and nonsignificance, respectively.
Agronomy 11 00708 g005
Figure 6. Interaction between the crop genotype and environment. Shoot dry weight (SDW) (A) and root dry weight (RDW) (B) of each crop (maize (◆), millet (■), rice (▲), and sorghum (●)) responses to the environment, and environment (moderate soil moisture (MSM (◆)), gradual soil drying (GSD (■)), and continuous soil waterlogging (CSW (▲)) effect on shoot dry weight (SDW) (C) and root dry weight (RDW) (D). Environmental index is mean value of SDW or RDW of different crop species under three different soil moisture statuses. a means regression coefficient of response.
Agronomy 11 00708 g006
Figure 7. Interaction between the residual variance and regression coefficient of shoot dry weight (A) and root dry weight (B) for evaluating crops: maize (◆), millet (■), rice (▲), and sorghum (●) adapted to environment (soil moisture).
Agronomy 11 00708 g007
Table 1. Average of shoot dry weight (SDW), leaf area (LA), root dry weight (RDW), nodal root length (NRL), lateral root length (LRL), total root length (TRL), surface area (SA), and volume (VL) across gradual soil drying (GSD), moderate soil moisture (MSM), and continuous soil waterlogging (CSW) at 25 days after treatment.
TreatmentShoot TraitsRoot Traits
SDW (mg Plant−1)LA (cm2 Plant−1)RDW (mg Plant−1)NRL (m Plant−1)LRL (m Plant−1)TRL (m Plant−1)SA (cm2 Plant−1)VL (cm3 Plant−1)
Maize
GSD653.2±64.0a1257.5±58.1a117.7±19.0a36.4±6.7a128.9±11.8a165.3±14.2a1788.3±189.3a18.1±2.7a
MSM513.9±101.8b1034.4±88.1b97.6±12.3a31.4±4.9a94.1±15.7b125.5±17.0b1460.8±187.3b14.0±2.5b
CSW163.0±30.4c351.9±50.8c32.0±5.3b12.2±1.2b27.9±3.2c40.1±2.7c523.5±26.9c5.5±0.5c
Millet
GSD487.0±59.8a721.3±115.5a88.5±16.6a30.6±5.5a156.9±30.0a182.4±33.3a1662.4±242.2a11.9±0.8a
MSM282.8±44.3b491.0±39.3b62.2±8.9b16.8±3.3b117.0±33.3b138.8±26.5b1119.1±218.3b7.9±1.4b
CSW271.1±92.8b407.7±95.5b38.1±12.3c11.2±5.1b70.2±15.8b85.8±19.3c690.0±182.4c4.0±0.6c
Rice
GSD58.2±21.6a93.2±23.1a20.8±8.0a11.6±4.5ab27.3±11.0a38.9±12.6a352.8±119.9ab2.7±0.9a
MSM50.8±11.5a89.6±24.2a26.1±3.9a12.9±2.2a35.9±3.4a48.8±5.6a421.0±60.8a3.0±0.5a
CSW58.9±20.6a98.8±30.0a16.9±4.2a7.2±1.6b12.7±3.0b19.9±4.2b229.9±65.6b2.2±0.8a
Sorghum
GSD271.5±52.4a586.3±122.6a50.5±9.9a11.6±1.8a86.6±14.4a102.8±22.0a942.1±119.3a6.2±1.1a
MSM252.8±43.2a537.5±107.9a55.7±10.5a12.9±1.8a85.0±14.2a96.4±17.9a880.0±120.0a6.1±1.0a
CSW89.4±12.2b167.6±24.5b26.7±5.4b7.3±1.5b21.9±5.2b29.3±6.5b349.0±70.6b3.6±0.9b
Crop ×
soil moisture
*** *** *** *** *** *** *** ***
The average value is shown as ±standard deviation. Columns with similar letters within a crop did not significantly differ according to Tukey’s test at the 0.05 probability level. *** and ns indicate statistical significance at p < 0.001 and nonsignificance, respectively.
Publisher’s Note: MDPI stays neutral with regard to jurisdictional claims in published maps and institutional affiliations.