Article

High Land-Use Intensity Diminishes Stability of Forage Provision of Mountain Pastures under Future Climate Variability

by
Bernd Josef Berauer
1,2,*,
Peter Allan Wilfahrt
1,3,
Max Anatol Schuchardt
1,
Marcus Schlingmann
4,5,
Anne Schucknecht
4 and
Anke Jentsch
1
1
Department of Disturbance Ecology, Bayreuth Center of Ecology and Environmental Research (BayCEER), University of Bayreuth, Universitätsstraße 30, 95447 Bayreuth, Germany
2
Department of Plant Ecology, Institute of Landscape and Plant Ecology, University of Hohenheim, Ottilie-Zeller-Weg 2, 70599 Stuttgart, Germany
3
Department of Ecology, Evolution and Behavior, University of Minnesota, St. Paul, MN 55108, USA
4
Karlsruhe Institute of Technology (KIT), Institute of Meteorology and Climate Research—Atmospheric Environmental Research (IMK-IFU), Kreuzeckbahnstr. 19, 82467 Garmisch-Partenkirchen, Germany
5
Agricultural Centre Baden-Wuerttemberg (LAZBW), Grassland Division, Atzenberger Weg 99, 88326 Aulendorf, Germany
*
Author to whom correspondence should be addressed.
Agronomy 2021, 11(5), 910; https://doi.org/10.3390/agronomy11050910
Submission received: 19 March 2021 / Revised: 20 April 2021 / Accepted: 4 May 2021 / Published: 6 May 2021
(This article belongs to the Section Grassland and Pasture Science)

Abstract

:
Semi-natural, agriculturally used grasslands provide important ecologic and economic services, such as feed supply. In mountain regions, pastures are the dominant agricultural system and face more severe climate change impacts than lowlands. Climate change threatens ecosystem functions, such as aboveground net primary production [ANPP] and its nutrient content. It is necessary to understand the impacts of climate change and land-management on such ecosystems to develop management practices to sustainably maintain provision of ecosystem services under future climatic conditions. We studied the effect of climate change and different land-use intensities on plant-soil communities by the downslope translocation of plant-soil mesocosms along an elevation gradient in 2016, and the subsequent application of two management types (extensive vs. intensive). Communities’ response to ANPP and leaf carbon (C), nitrogen (N), and phosphorus (P) content was quantified over the subsequent two years after translocation. ANPP increased with warming in 2017 under both management intensities, but this effect was amplified by intensive land-use management. In 2018, ANPP of intensively managed communities decreased, in comparison to 2017, from 35% to 42%, while extensively managed communities maintained their production levels. The changes in ANPP are coupled with an exceptionally dry year in 2018, with up to 100 more days of drought conditions. The C:N of extensively managed communities was higher than those of intensively managed ones, and further increased in 2018, potentially indicating shifts in resource allocation strategies that may explain production stability. Our results revealed a low resistance of intensively managed communities’ ANPP under especially dry conditions. The ability to alter resource allocation likely enables a constant level of production under extensive management, but this ability is lost under intensive management. Thus, future drought events may leave intensive management as a non-sustainable farming practice, and ultimately threaten ecosystem services of montane pastures.

1. Introduction

On a global scale, grasslands as natural grasslands (35 mio km2) and as human transformed semi-natural grasslands (15 mio km2 cropland and 31.5 mio km2 pasture) are among the largest terrestrial biomes [1,2]. Mountain grasslands are predominantly used as pasture for forage-based dairy and livestock production, forming the dominant habitat in the Alps and their foothills. However, these ecosystems are exposed to climate and land-use changes which will affect the provision of ecosystem services in the future. Mean annual temperature is predicted to rise over the 21st century [3], being most severe in high altitudes [4,5]. Besides the change in long-term average temperature, intra- and inter-annual temperature variability will increase [6], and has already increased in Europe [7]. Additionally, precipitation patterns may shift, and a reduction in precipitation during the summer months is projected for the Alps [5]. The coupled effects of climate change on temperature and precipitation are expected to increase the frequency and intensity of drought periods [8]. This likely impairs grasslands and their provided amount and chemical composition of biomass [9], causing persisting long-term effects [10]. To cope with limiting soil-moisture under drought conditions, plants can either increase their ability for acquiring limited resources by increasing root development [11], or be more efficient with their use of limited resource by constructing more water-use efficient and drought-tolerant leaf tissue [12,13]. Thus, it is necessary to understand mechanisms controlling managed communities’ dynamic reaction to resource acquisition and allocation in response to fluctuating climatic conditions, as these mechanisms determine the stability of ecosystem functions. This will help to preserve provided ecologic and economic value under future climatic conditions.
Climate change and land-use intensity both have significant potential to change resource availability in managed grasslands. The strong seasonality and short growing season in cold-temperature limited mountain grasslands of the northern hemisphere strongly regulate productivity [14,15]. An earlier snowmelt caused by warmer temperature elongates the growing season length [16] and stimulates growth [17], though only if not water limited [18,19]. Further, warmer temperatures induced by climate change enhance the decomposition of soil organic matter [20], stimulate soil microbial activity [21], and will increase gross nitrogen turnover [22] and nitrification rates [23], ultimately increasing plant nitrogen availability while reducing phosphorus availability via immobilization [24]. In grasslands, where cold temperatures have caused the accumulation of large soil organic matter and total nitrogen stocks [25], the climate change-induced increase in gross nitrogen turnover may be pronounced. External nutrient input via fertilization (e.g., slurry application) directly increases soil nitrogen and phosphate (P2O5) content. Acidification of soils can indirectly increase phosphorous solubility [26], yet low pH can also decrease phosphorous availability due to adsorption mechanisms (e.g., ligand exchange with aluminium or iron oxides) [27]. Classic knowledge states that the highest phosphorus solubility occurs at a pH ranging between 6.5 and 7 [28], which was recently confirmed by Penn and Camberato in 2019 [27]. Temperature induced increases in turnover rates and external nutrient input both alleviate belowground nutrient limitation and stimulate the growth of grasslands [29,30], and may be of high importance in nitrogen-limited grasslands at high altitudes or latitudes [30]. An increase in soil nutrient availability can also improve nutritive quality of produced biomass [31]. During the last few decades, land-use intensity in the Alps has changed, with grasslands at high altitude and with difficult terrain being abandoned due to high-cost management, while grassland management in valley bottoms has intensified [32].
Shifting nutrient availability under climate change and differing land-use intensities likely entails changes in uptake and allocation of nutrients, ultimately altering element contents and elemental stoichiometry of plant tissue [24,33]. For example, plants can alter their nutrient allocation and shift towards higher investment into above- rather than belowground biomass under a surplus of soil nutrient availability [34,35], which is reflected in stoichiometric flexibility in tissues [36,37]. The elemental stoichiometry of an organism is linked to its growth rate. A decreasing C:N or C:P ratio, equivalent to a lower amount of carbon per unit nitrogen, respectively, phosphor, is coupled with an increasing growth rate [38]. Though the relationship of the N:P ratio to growth rate is not that simple, as, in theory, it peaks at intermediate growth rate [38]; this can be confounded by excess uptake of a non-limiting nutrient under a single limitation of a different nutrient [36]. A recent meta-analysis by Yuan and Chen (2015b) [39] showed that fertilization with N, P, and their combination increases respective tissue element content. The ratios of C:N and C:P respond according to tissue element content across various plant functional types and habitats [31]. Additionally, leaf stoichiometry is strongly dependent on the phenology and maturity of plants [40], and is thereby affected by the frequency of biomass removal from land-use practices (e.g., mowing) [41]. Yet, the effect of warming-induced increases in nutrient availability on plant tissue element contents depends on plant type and the environmental conditions under which plants are growing [31]. Warming likely increases aboveground plant tissue C:N ratio of warm, moisture-limited temperate grasslands, as a result of increased structural carbon-rich compounds in leaves to reduce water loss [12], or by increased nutrient-use efficiency [42]. In contrast to this, effects of warming on cold-temperature limited systems with sufficient moisture remain ambiguous. Warming-induced changes of the C:N ratio were shown to either increase by increasing nutrient uptake [43], decrease via dilution of nitrogen by increased production [44], or reveal no effects [45]. In the long run, changes in nutrient availability and balances alter community composition [46], provided ecosystem services [47], multi-trophic interactions [48], and, ultimately, global coupled biogeochemical cycles [49].
Nutritive quality may decrease with warming [50], though these effects can be variable in high-elevation mountain grasslands [51], and often are mediated by community turnover [52,53]. Community composition and species richness are altered by climate change [54,55] and land-use [56], and community composition is key in determining forage quality and medicinal value [57]. For instance, increasing temperature and nutrient availability will likely favour fast-growing resource-acquisitive species [58,59]. In cold temperature adapted ecosystems, graminoids often increase under warmer climates [60], potentially reducing nutritive quality. Changes in nutrient availability, allocation, and plasticity within a community will affect the amount and stability of ecosystem services provided by managed grasslands, such as quantity and chemical composition of forage. Mountain grasslands are predominantly used for agriculture and are vulnerable to climate-change. Thus, it is of high importance to understand grasslands dynamic responses in elemental stoichiometry under future climatic conditions to maintain provided ecologic and economic value.
Here, we investigated the interacting effects of experimental, implemented climate change and contrasting land-use intensities (high/intensive vs. low/extensive) on forage provision (ANPP and elemental stoichiometry) of two montane grasslands within the German Alps. We hypothesize that (i) ANPP increases with both warming and high-intensity land-use, (ii) elemental stoichiometry changes due to increased nitrogen availability and uptake (decreasing C:N and increasing N:P ratio), with high-intensity management, and (iii) warming-induced changes of nutrient availability amplify the effects of land-use intensity on elemental stoichiometry.

2. Materials and Methods

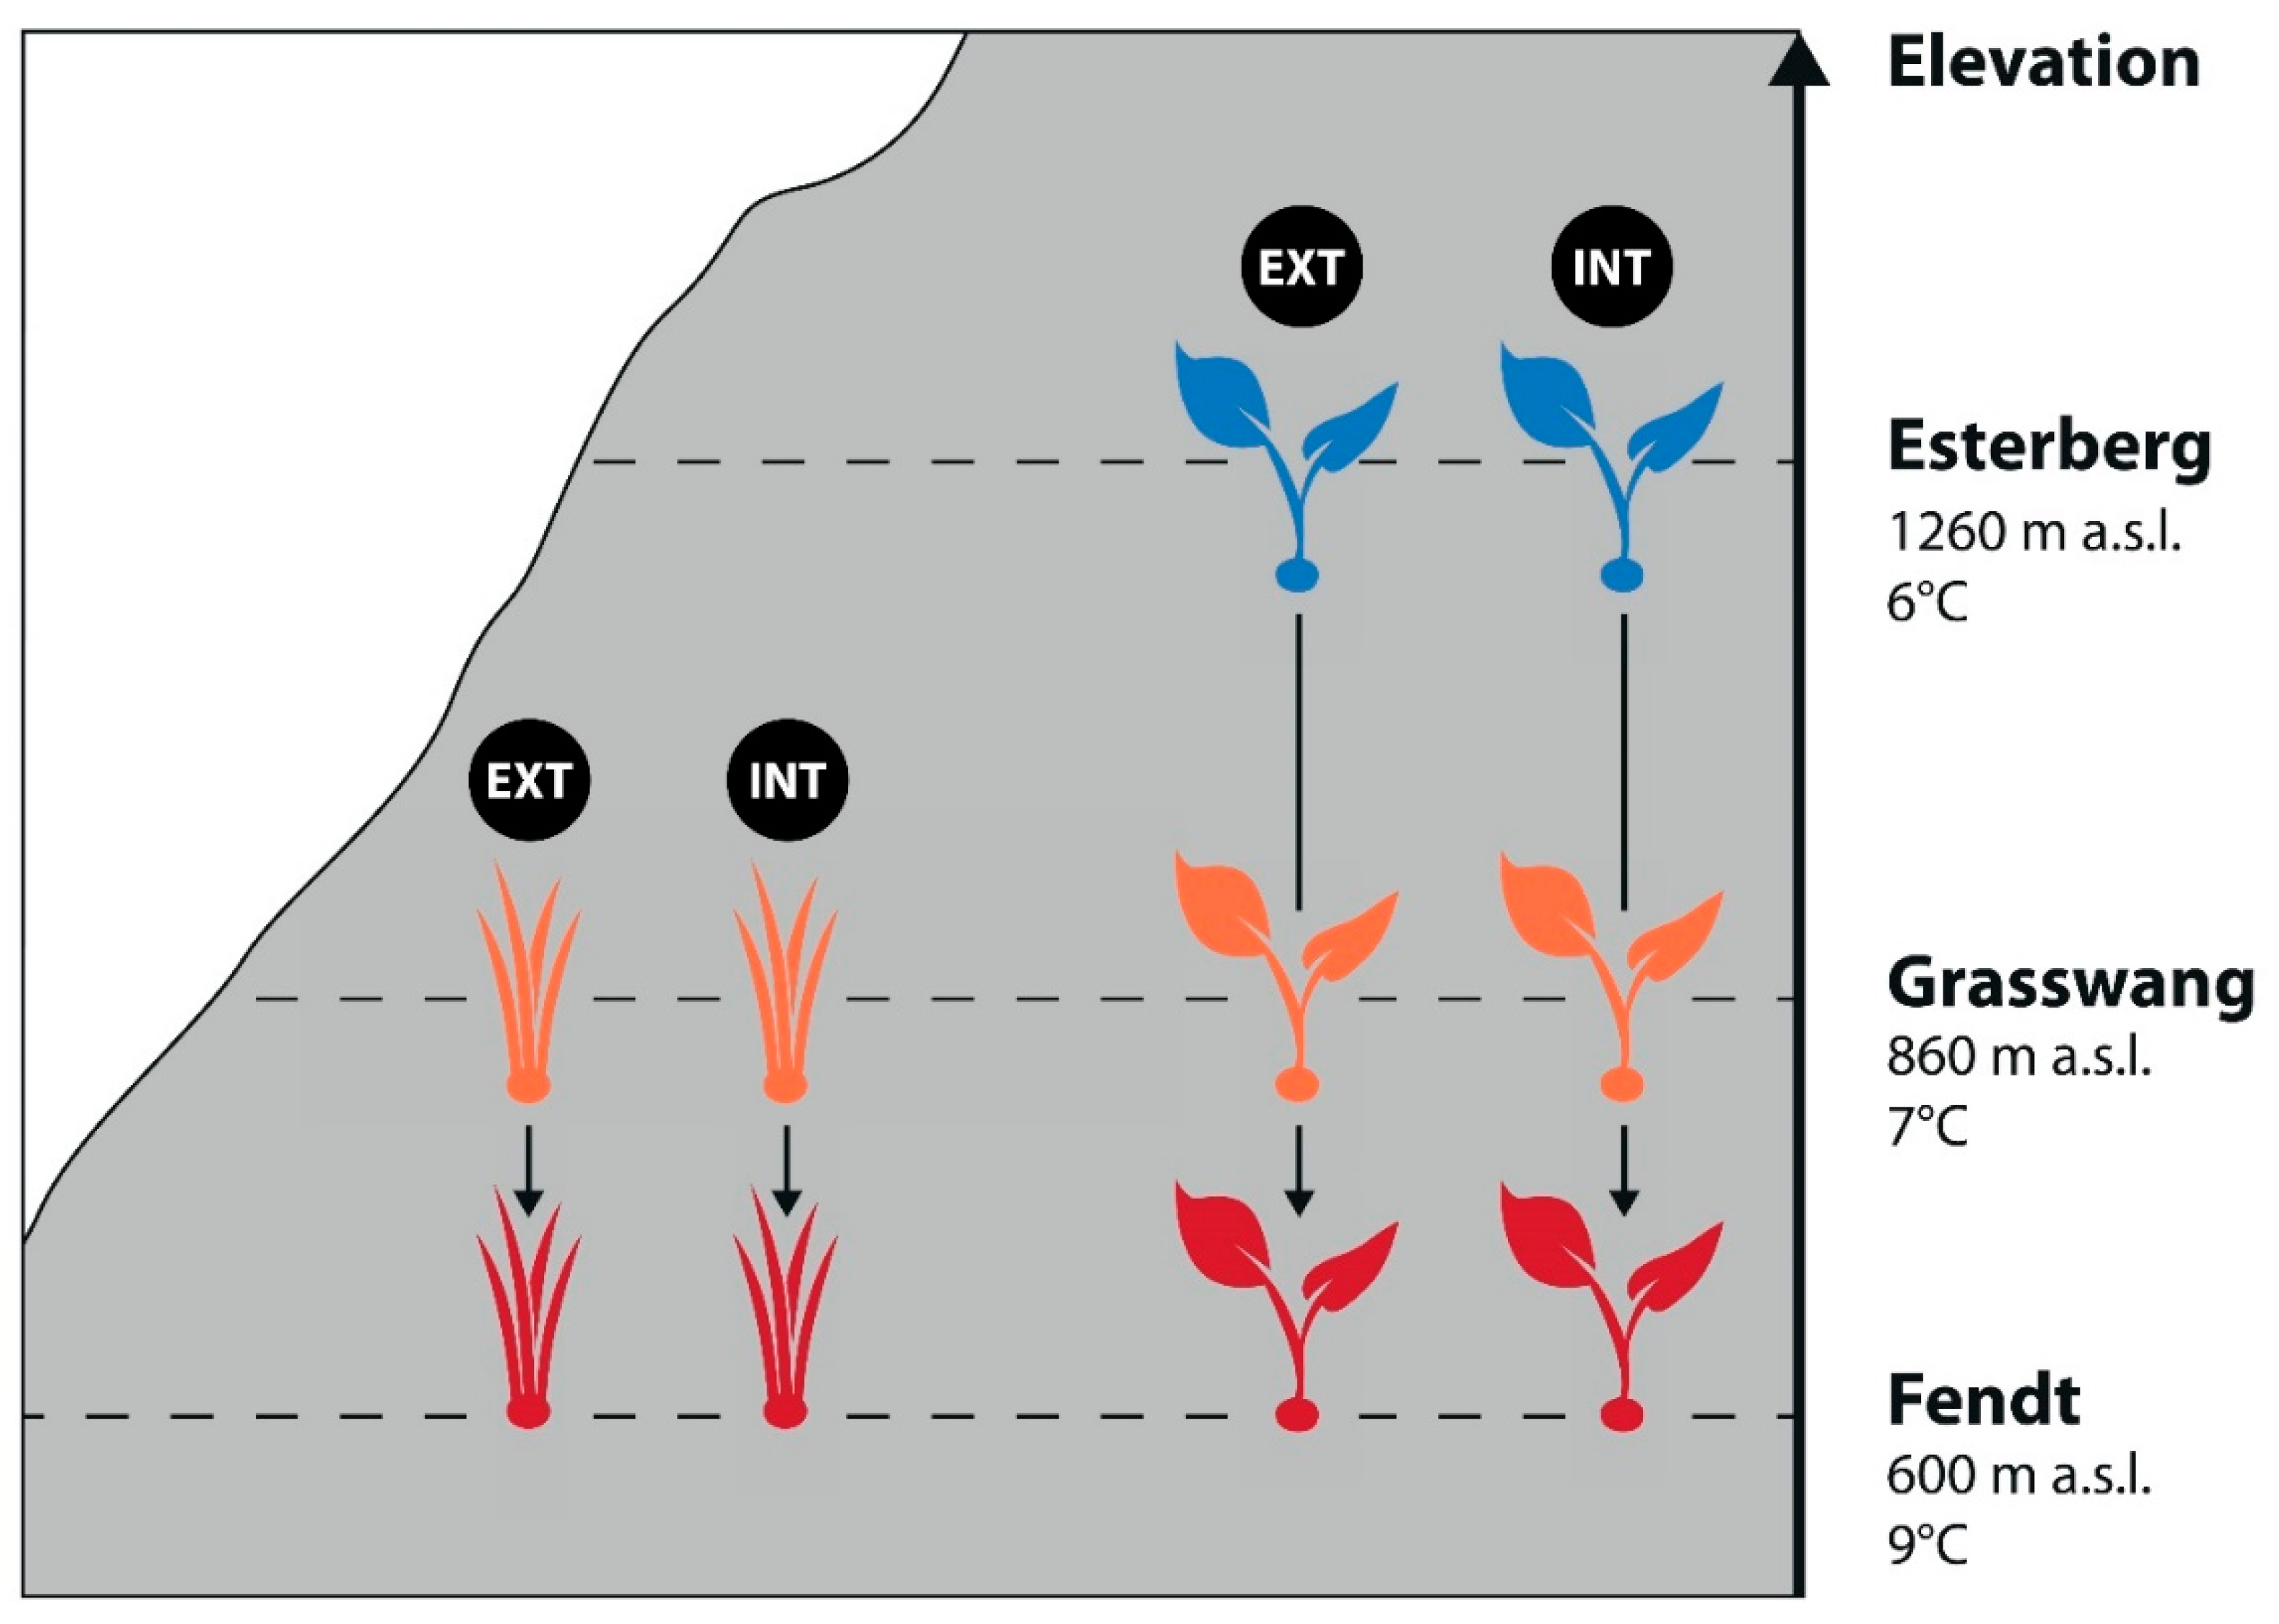
2.1. Experimental Setup

This study was conducted at three experimental sites of the project “Sustainable use of alpine and pre-alpine grassland soils in a changing climate” (SUSALPS; https://www.susalps.de/en/, accessed on 5 May 2021), along an elevational gradient within the German Alps. During the experimental campaigns in 2017 and 2018, this elevational gradient represented a temperature gradient of +3 K, spanning between the high-elevation site (Esterberg; 1260 m a.s.l.; mean annual temperature: 6 °C, mean annual precipitation: 1113 mm) via the mid-elevation site (Graswang; 860 m a.s.l.; 7 °C, 1433 mm), to the low-elevation site (Fendt; 600 m a.s.l.; 9°C, 1036 mm). All of these sites are characteristic semi-natural grasslands of this region and are agriculturally used as cattle pastures. For edaphic and plant sociologic information, see Supplementary Table S1 (or see Berauer et al. (2020) [51] for more detailed site descriptive information).
In 2016, intact natural plant-soil monoliths (communities) from the high-elevation and mid-elevation sites were translocated downslope to each lower elevational site to passively simulate climate change. Climatic control monoliths were reburied at the site of origin. Each translocated plant-soil community had a diameter of 30 cm and a depth of 40 cm. The procedure of translocation was as described in Berauer et al. (2019) [19]. A total replicate amount of 60 communities (3 × 12 from high-elevation and 2 × 12 from mid-elevation) were translocated. Each set of 12 translocated communities was equally split into intensive and extensive land management (n = 6 per origin × recipient × management combination; see Figure 1).
Intensively managed communities were cut five times per year and received a slurry application after each cut, whereas extensively managed communities were cut three times per year and received a slurry application only after the first and last cut per year, matching common agricultural practices of the region. For details on the chemical composition of the applied cattle slurry, see Supplementary Table S2. Cuts were conducted 3 cm aboveground using scissors. This cutting height was chosen to follow the scientific standards [61] that best represented aboveground biomass while avoiding damage to plant roots and allowing regrowth, even though this may not best represent typical agricultural practices. Fertilizer application consisted of 130 mL of slurry (corresponding to 42 ± 10 kg N ha−1) spread homogenously on the surface after each cutting. In total, intensively managed monoliths received ~250 kg N ha−1 a−1 and extensively managed monoliths received ~100 kg N ha−1 a−1, following typical amounts applied by farmers in this study region. The exact timing of land-use management application was linked to the local farmers’ application as tightly as possible, and started in 2017.

2.2. Data Collection

After each cut, aboveground biomass bulk samples of each community (from now on “ANPP”—aboveground net primary production) were dried at 60 °C for 48 hours and weighed. ANPP was scaled to g m−2 (see Appendix A Formula (A1)).
Due to different time intervals between land management applications, we standardized biomass production by time (from now on called “productivity”). To do so, production was either divided by the number of days between two consecutive harvest dates or, in the case of the first cut of the year, the number of days between the start of the growing season and first cut (see Appendix A, Formula (A2)). We defined the start of the growing season as the first five consecutive days with mean air temperature above 5 °C [62]. This standardization allows for comparison with a similar standardized wetness index (see below).
To analyze leaf chemistry, we first ensured a homogenous and representative mixture and quality of dried community aboveground biomass bulk samples by shredding them to 2 mm [SK1, Retsch GmbH; Haan, Germany]}, and, afterwards, pulverizing them using a ball mill [MM301, Retsch GmbH; Haan, Germany]. Carbon (C in percentage of dry weight) and nitrogen content (N in percentage of dry weight) of mixed community bulk samples were analyzed using elemental analysis [Thermo Quest Flash EA 1112, Thermo Fisher Scientific; Waltham, USA], and phosphorous content (P in g kg−1 equivalent to permille) was analyzed using inductively coupled plasma optical emission spectrometry [Vista-Pro radial, Varian Inc.; Palo Alto, USA] after pressure digestion in 65% HNO3, all following international standardized protocols (Bayreuth Center of Ecology and Environmental Research, central analytical chemistry laboratory; Bayreuth, Germany). We derived C:N, C:P, and N:P ratios (note, phosphorous was transformed to percent prior to calculation), as well as absolute amounts of elements (as produced biomass times relative portion of each respective element).
With the experimental set-up in 2016, sensors for soil temperature and moisture [EcH2O 5-TM, Decagon Devices Inc.; Pullman, USA] were installed horizontally at 5 and 15 cm depth, together with data loggers [EcH2O Em50, Decagon Devices Inc.; Pullman, USA]. Soil temperature and moisture were monitored at 30 min intervals at both depths in two separate monoliths, and in an additional third monolith at only 5 cm depth for each origin × recipient × treatment combination. Soil moisture was aggregated on a daily basis. Each site had operating weather stations and their precipitation and temperature data were used in this study.
We calculated the soil wetness index (SWI, e.g., Dirmeyer et al., 2000) [63]
soil   wetness   index = θ θ W P θ F C θ W P If   θ   >   θ FC     θ = θ FC
with θ as in situ measured soil moisture, θWP as wilting point, and θFC as field capacity. This wetness index represents plant available water at a given time. Field capacity and wilting point were calculated based on soil texture, including a relative amount of sand and clay, using the USDA’s Soil Water Characteristics program (following Saxton and Rawls, 2006 [64]), with soil texture data presented in Berauer et al. (2020) [51]. We excluded organic matter in the calculation, as we lacked data for 2017 and 2018.
The SWI was calculated for each occurring origin*recipient*treatment combination, aggregated across both soil depths, to quantify potential occurring drought condition. We use the SWI to calculate the number of days with no plant available water (SWI < 0) during the growing season.

2.3. Statistical Analysis

We aggregated data per year (sum of ANPP, total N, total P, mean productivity, C, N, P content and C:N, C:P, and N:P) of each origin*recipient*treatment combination, and examined a Pearson’s correlation among them. Due to high correlations of many of these variables, we opted to analyze and report in detail ANPP, C:N, and N:P ratios, as the biological stoichiometry of plants is a powerful predictor of nutrient limitation and resource allocation strategies [65]. To test for effects of climate change and land-use intensity on the amount and elemental stoichiometry of ANPP over the course of the two studied years, we conducted generalized least square models with land-use intensity (LUI), recipient site as a proxy for climate change (CC), and year, all interacting with each other as predictors. To cope with the non-independence of repeated sampling of replicates (single experimental communities), we included an auto-correlation AR-1 model structure with a replicate nested in year. We conducted separate models for the two sites of origin, because of differing comparisons by experimental set-up and communities. When needed, we used a pairwise Tukey HSD as a post hoc test to test for significant differences if more than two comparisons were possible. Model assumptions of all models were confirmed visually (normal distribution: histogram, QQ plot and variance homoscedasticity: standardized residuals vs. fitted values; Zuur et al. (2009) [66]).
All statistical tests were performed using R-Version 3.6.1 [67], using the packages nlme [68] and lsmeans [69]. An exhaustive summary of mean and standard error of all measured parameters and model outputs is provided in Supplementary Tables S3–S5.

3. Results

Intensively managed communities had low resistance of ANPP in warmer climates when originating from both high-elevation (pLUI*CC*Year = 0.0132) and mid-elevation (pLUI*Year < 0.001, pCC*year = 0.0108) sites. More specifically, ANPP in 2017 increased under warmer conditions for both intensively and extensively managed communities originating from high-elevation, but this effect was higher at mid-elevation (+1 °C: intensive +166%; extensive +128%) than the warmest low-elevation site (+3 °C: intensive +98%; extensive +101%, Figure 2a). In the second year of study (2018), extensive management maintained a similar level of ANPP, whereas ANPP of intensively managed communities decreased in comparison to 2017 at warmer sites (by −42% at +1 °C and −35% at +3 °C; Figure 2a). In 2018, the positive effect of warming in intensively managed communities only remained under +1 °C warming (pctrl|+1 < 0.05), and was nullified at the warmest recipient site (pctrl|+3 = 0.402). Communities originating from mid-elevation sites similarly showed increasing ANPP under warmer conditions for intensive (+41%) and extensive (+29%) land-use intensity, while, in 2018, no effect of warming was apparent under either land-use intensity. Again, ANPP of extensively managed communities remained constant in 2018, whereas intensively managed communities had less (−37%) ANPP than in 2017 under +2 °C warmer conditions (Figure 2b).
The C:N ratio of intensively managed communities remained constant across sites and years, while the C:N ratio of extensively managed communities originating from high-elevation sites increased with time (pLUI*Year < 0.001) and warming (pCC*year < 0.05; pLUI*CC < 0.001). The increased C:N ratio of extensively managed communities (2017:+18% at +1 °C; +22% at +3 °C | 2018:+18% at +1 °C; +22% at +3 °C; Figure 2c) was primarily induced by a reduced nitrogen tissue content under warmed conditions in 2017 (−15% at both +1°C and +3 °C) and 2018 (−13% at +1°C and −15% at +3°C, Supplementary Figure S1). Additionally, the C:N ratio increased in 2018 at climatic control site (+12%), +1 °C (+12%) and +3 °C (+13%), driven by a concordant but non-significant decrease in nitrogen and an increase in carbon content (see Supplementary Figure S2).
The C:N ratio of intensively managed communities originating from mid-elevation sites was invariant across time and climatic conditions. In contrast, the C:N ratio of extensively managed communities increased over time (pLUI*Year < 0.001) at both the climate control (+10%) and +2°C site (+15%), but did not show differences between sites (Figure 2d).
C:N and N:P were negatively correlated, though this relationship was stronger in intensively managed communities (Figure 3). C:N and N:P ratios ranged from 16.3 to 26.6, and from 6.1 to 9.4, respectively. The range of N:P ratios is comparable for extensively (6.3 to 9.4) and intensively (6.1 to 9.2) managed communities. In contrast, the C:N ratio of intensively managed communities revealed a lower, narrower range (16.3 to 19.9) than the extensively (17.8 to 26.6) managed communities, demonstrating higher nutritive value of intensively managed communities and less stoichiometric plasticity.
The strong differences in ANPP between both study years of intensively managed communities and for C:N ratio of extensively managed communities can be linked to the observed plant available water content during both study years (Figure 4, Supplementary Figure S3). The number of days without plant available water (number of days with SWI < 0) increased for all origin × recipient × management combinations in 2018, except in the high-elevation climatic control. Irrespective of site of origin and land-use intensity, the number of days without plant available water increased in 2018 in comparison to 2017 at mid-elevation sites by ~55 days, and at low-elevation sites by ~106 days. The increase in number of days without plant available water between both study years, irrespective of site of origin, was stronger under extensive than intensive land-use intensity at both mid-elevation (extensive: ~71 days; intensive: ~39 days) and low-elevation (extensive: ~122 days; intensive: ~90 days) sites (see Supplementary Table S6). The number of days without plant available might appear very high and unreasonable. Different methodological limitations are contributing to the pattern. First, both field capacity and wilting point were calculated based on measured soil texture, but not in situ determined. Second, soil moisture was tracked using TDR-sensors reporting soil volumetric water content. Prior to field installations, sensors were calibrated and ensured to be comparable against each other. Though, volumetric water content still slightly misrepresents gravimetric water content. Ultimately, these methodological difficulties might cause a slight overestimation of days without plant available water. Yet, as the sensors are comparable to each other, the induced systematic error is neglectable. Similarly, due to calculus, the fixed lower benchmark of wilting point will not result in in changes of the here presented and discussed pattern.

4. Discussion

Warmer environments led to increased productivity, as long as precipitation did not become limiting. The positive effect of warming on ANPP was amplified by intensive land-use management. Intensively managed communities were more productive and nutrient rich than extensively managed communities, regardless of warming. However, an especially dry year in 2018 revealed low resistance of ANPP under intensive land-use intensity, whereas extensive land-use intensity was able to maintain a constant level of ANPP, even under dry conditions, by shifting to a resource conservative strategy, indicated by higher C:N. Changes in elemental stoichiometry and content indicate a changed nutrient resource allocation under extensive land-use intensity, and may encourage investment in drought tolerance.
ANPP increases with warming in grasslands [21,70]. Specifically, cold-temperature limited grasslands were shown to profit from warming by increasing vegetation length and nutrient availability [71], as long as soil moisture conditions remained sufficient [18,19]. Higher nutrient input relieves nutrient limitations, leading to increased production [30]. On a global scale, land-use intensification increases ANPP at the cost of species loss [72]. Similarly, a supplied surplus of nitrogen by fertilization might cause the lower C:N ratio of intensive managed communities, as more nitrogen is available for plant growth and excess supply can be stored—so called luxury uptake [36]. Additionally, the generally lower C:N ratio of intensively managed communities in comparison to extensively managed communities might result from the two different cutting frequencies, yielding harvested tissue at different stages of maturity and phenology, both of which affect C:N ratio. Young tissues are known to be nutrient rich [40], adding evidence to the observed pattern.
The alternating resistance between both land-use intensities might be caused by different community compositions with different resource use strategies. Warming of cold-temperature limited grasslands causes loss of species [19] and changes in community composition [54,55], most likely favouring fast-growing resource acquisitive species [59], i.e., graminoids [60]. The warming-induced loss of species is likely fuelled by increasing land-use intensity [73]. The asynchronous reaction of species—the loss of performance from one species suffering is filled by another species profiting from changed environmental conditions—to environmental changes and stressors affects communities’ stability and the provision of ecosystem multifunctionality [74,75]. Ma et al. (2017) [76] found weakened species asynchrony induced by warming to be the main factor reducing the temporal stability of production. Our results add further evidence to suggest that ongoing climate change alters both mean [4,77] and variability of climates [8,78], which will have critical impacts on ecosystem functioning and stability in general [79,80], especially in mountain regions [14,32]. These effects can be direct or indirectly mediated via changed community composition and species dominance, though we lacked the data to test for composition effects here. Nutrient enrichment likely favours species with a high growth rate (acquisitive species) as the demand and supply of high N and P are met [36]. Though benefitting from high resource availability, acquisitive species are at a disadvantage under low resource availability [59]. Thus, we speculate the low resistance of intensively managed communities to be caused by the dominance of acquisitive species, whereas more species with a conservative resource strategy within the extensive communities are the potential cause of stability. This might also be supported by the constant C:N ratio of intensively managed communities, suggesting that species are less capable of changing resource allocation, or that resource conservative species were lost from these communities.
As the cutting regime remained constant for both land-use intensities in both years, the increase in C:N ratio of extensively managed communities is unlikely to be caused by changed maturity of harvested tissue. This poses the question of shifting resource allocation in extensively managed communities. The observed increase in C:N is driven by opposed changes in tissue carbon (increase) and nitrogen (decrease) content. The decreasing nitrogen tissue content might result from nitrogen immobilization and altered soil microbial communities in managed mountain grasslands under drought conditions [81]. However, because we did not detect a consistent nitrogen content pattern under intensive management, the consistent pattern in extensive management might hint towards shifting resource allocation belowground [11], though we lacked the data to test this. On the other hand, increasing leaf tissue carbon content, as increased structural investment to reduce water loss [12] or soluble non-structural carbohydrates to lower leaf water potential at stomatal closure [13], are possible mechanisms underlying the pattern observed in this study.
The observed N:P ratios for communities of both land-use intensities are below 10, suggesting N-limited growth conditions rather than P-limitation [46,82]. This potential N-limitation might be surprising, given the amount of slurry fertilizer added to the communities. Yet, it adds indirect evidence to a low slurry use efficiency of montane pasture communities, which ultimately may lead to C- and N-mining from soil organic matter [83]. Nonetheless, the N:P rations are within the optimum range for agricultural managed grasslands in mountain regions of Switzerland proposed by Liebisch et al. (2013) [84], rating the optimum between 5.5 and 9. In a previous study, crude protein content of those montane pasture communities was shown to be sufficient for dairy production, irrespective of management intensity [51].
Human-induced changes in the availability of carbon, nitrogen, and phosphorous are reflected in changed elemental stoichiometry, and cause an inexorable imbalance in global nutrient cycles (especially a deficiency of phosphorous in comparison to carbon and nitrogen) already impacting managed ecosystems around the world [47]. Further intensification of agriculture—potentially exceeding sustainable limits of stock density or carbon export—can reduce soil organic carbon stocks [85] and, in a worst case scenario, can cause the decoupling of biogeochemical cycles [86]. In excess, the likely reduction of species richness by intensification [72] may further reduce ecosystem stability [87] and multifunctionality [88].

5. Conclusions

Our result revealed a low resistance of ANPP of intensively managed communities under dry conditions, whereas extensively managed communities were able to maintain production, likely by altering resource allocation. A communities’ inherent ability to cope with interannual climate variability is crucial for maintaining stable ecosystem function. Thus, by restricting a community’s plasticity in resource allocation strategies, intensive management may prove unsuitable for the sustainable provision of ecologic and economic services of montane pastures in future climates. We recommend shifting from intensive to extensive management in montane regions to preserve cultural heritage, in addition to the economic and ecologic value provided by these ecosystems.

Supplementary Materials

The following are available online at https://www.mdpi.com/article/10.3390/agronomy11050910/s1.

Author Contributions

B.J.B., A.J. conceived the ideas and designed the methodology. B.J.B., M.A.S., M.S., A.S. collected data. B.J.B. and P.A.W. analyzed the data. All authors contributed critically to interpretation of data, writing of draft and gave final approval for publication. All authors have read and agreed to the published version of the manuscript.

Funding

This research was conducted within the SUSALPS project (https://www.susalps.de/en/, accessed on 5 May 2021) funded by the German Federal Ministry of Education and Research, grant numbers 031B0027C and 031B0516C for UBT-DE, 031B0027A and 031B0516A for KIT.

Data Availability Statement

Data are available at the GitHub repository: (https://github.com/BJBerauer/SUSALPS_ForageProvision, accessed on 5 May 2021).

Acknowledgments

We thank the project partners of SUSALPS, especially the team from the Karlsruhe Institute of Technology (IMK-IFU) for their strong support during the field campaign and the land-use management applications. Sincere thanks go to the analytical chemistry keylab facility of the “Bayreuth Center for Ecological and Environmental Research” (BayCEER) for analyzing the elemental content and showing fundamental patience. This publication was funded by the German Research Foundation (DFG) and the University of Bayreuth in the funding program Open Access Publishing. BJB’s personal gratitude goes to Ralf Hafner for helping to visualize the experimental setup.

Conflicts of Interest

The authors declare no conflict of interest.

Appendix A. Formulas

Upscaling of ANPP to [g m−2].
P r o d u c t i o n   [ g m ² ] = [ P r o d u c t i o n   [ g m o n o l i t h ] [ 1 ( π r 2 ) ] ]
With r = 0.15 m, 1/ π r 2 equalling [1/surface area] of monolith equals the multiplier from [g/monolith] to [g m−2]).
Calculation of productivity as production scaled by time
P r o d u c t i v i t y   [ g m ² d 1 ] = P r o d u c t i o n D a y s   b e t w e e n   c u t t i n g D a y s   b e t w e e n   c u t t i n g ( M i d s e a s o n ) = C u t t i n g [ D O Y ] P r e v i o u s   C u t t i n g [ D O Y ] D a y s   b e t w e e n   c u t t i n g ( 1 s t   c u t   o f   t h e   y e a r ) = C u t t i n g [ D O Y ] S t a r t   G r o w i n g   S e a s o n [ D O Y ]

References

  1. Dixon, A.P.; Faber-Langendoen, D.; Josse, C.; Morrison, J.; Loucks, C.J. Distribution mapping of world grassland types. J. Biogeogr. 2014, 41, 2003–2019. [Google Scholar] [CrossRef]
  2. Ramankutty, N.; Evan, A.T.; Monfreda, C.; Foley, J.A. Farming the planet: 1. Geographic distribution of global agricultural lands in the year 2000. Glob. Biogeochem. Cycles 2008, 22. [Google Scholar] [CrossRef]
  3. Collins, M.; Knutti, R.; Arblaster, J.; Dufresne, J.-L.; Fichefet, T.; Friedlingstein, P.; Gao, X.; Gutowski, W.J.; Johns, T.; Krinner, G.; et al. Chapter 12. In Long-Term Climate Change: Projections, Commitments and Irreversibility; Cambridge University Press: New York, NY, USA, 2013. [Google Scholar]
  4. Pepin, N.; Bradley, R.S.; Diaz, H.F.; Baraer, M.; Caceres, E.B.; Forsythe, N.; Fowler, H.; Greenwood, G.; Hashmi, M.Z.; Liu, X.D.; et al. Elevation-dependent warming in mountain regions of the world. Nat. Clim. Chang. 2015, 5, 424–430. [Google Scholar] [CrossRef] [Green Version]
  5. Gobiet, A.; Kotlarski, S.; Beniston, M.; Heinrich, G.; Rajczak, J.; Stoffel, M. 21st century climate change in the European Alps—A review. Sci. Total Environ. 2014, 493, 1138–1151. [Google Scholar] [CrossRef] [PubMed]
  6. Schär, C.; Vidale, P.L.; Lüthi, D.; Frei, C.; Häberli, C.; Liniger, M.A.; Appenzeller, C. The role of increasing temperature variability in European summer heatwaves. Nature 2004, 427, 332–336. [Google Scholar] [CrossRef]
  7. Huntingford, C.; Jones, P.D.; Livina, V.N.; Lenton, T.M.; Cox, P.M. No increase in global temperature variability despite changing regional patterns. Nature 2013, 500, 327–330. [Google Scholar] [CrossRef]
  8. Calanca, P. Climate change and drought occurrence in the Alpine region: How severe are becoming the extremes? Glob. Planet. Chang. 2007, 57, 151–160. [Google Scholar] [CrossRef]
  9. Grant, K.; Kreyling, J.; Dienstbach, L.F.H.H.; Beierkuhnlein, C.; Jentsch, A. Water stress due to increased intra-annual precipitation variability reduced forage yield but raised forage quality of a temperate grassland. Agric. Ecosyst. Environ. 2014, 186, 11–22. [Google Scholar] [CrossRef]
  10. Zwicke, M.; Alessio, G.A.; Thiery, L.; Falcimagne, R.; Baumont, R.; Rossignol, N.; Soussana, J.-F.; Picon-Cochard, C. Lasting effects of climate disturbance on perennial grassland above-ground biomass production under two cutting frequencies. Glob. Change Biol. 2013, 19. [Google Scholar] [CrossRef] [PubMed]
  11. Da Silveira Pontes, L.; Maire, V.; Schellberg, J.; Louault, F. Grass strategies and grassland community responses to environmental drivers: A review. Agron. Sustain. Dev. 2015, 35, 1297–1318. [Google Scholar] [CrossRef]
  12. Sardans, J.; Peñuelas, J.; Estiarte, M.; Prieto, P. Warming and drought alter C and N concentration, allocation and accumulation in a Mediterranean shrubland. Glob. Change Biol. 2008, 14, 2304–2316. [Google Scholar] [CrossRef] [Green Version]
  13. Chaves, M.M. Effects of water deficits on carbon assimilation. J. Exp. Bot. 1991, 42, 1–16. [Google Scholar] [CrossRef]
  14. Ernakovich, J.G.; Hopping, K.A.; Berdanier, A.B.; Simpson, R.T.; Kachergis, E.J.; Steltzer, H.; Wallenstein, M.D. Predicted responses of arctic and alpine ecosystems to altered seasonality under climate change. Glob. Change Biol. 2014, 20, 3256–3269. [Google Scholar] [CrossRef]
  15. Körner, C. Alpine Plant Life: Functional Plant Ecology of High Mountain Ecosystems; With 47 Tables; Springer: Berlin/Heidelberg, Germany, 2003. [Google Scholar]
  16. Asam, S.; Callegari, M.; De Gregorio, L.; Jacob, A.; Notarnicola, C.; Zebisch, M.; Matiu, M.; Menzel, A.; Fiore, G. Spatiotemporal variations of alpine climate, snow cover and phenology. In Proceedings of the 2017 9th International Workshop on the Analysis of Multitemporal Remote Sensing Images (MultiTemp), Brugge, Belgium, 27–29 June 2017; pp. 1–4. [Google Scholar]
  17. Ergon, Å.; Seddaiu, G.; Korhonen, P.; Virkajärvi, P.; Bellocchi, G.; Jørgensen, M.; Østrem, L.; Reheul, D.; Volaire, F. How can forage production in Nordic and Mediterranean Europe adapt to the challenges and opportunities arising from climate change? Eur. J. Agron. 2018, 92, 97–106. [Google Scholar] [CrossRef] [Green Version]
  18. Winkler, D.E.; Chapin, K.J.; Kueppers, L.M. Soil moisture mediates alpine life form and community productivity responses to warming. Ecology 2016, 97, 1553–1563. [Google Scholar] [CrossRef] [PubMed] [Green Version]
  19. Berauer, B.J.; Wilfahrt, P.A.; Arfin-Khan, M.A.S.S.; Eibes, P.; Von Heßberg, A.; Ingrisch, J.; Schloter, M.; Schuchardt, M.A.; Jentsch, A. Low resistance of montane and alpine grasslands to abrupt changes in temperature and precipitation regimes. Arct. Antarct. Alp. Res. 2019, 51, 215–231. [Google Scholar] [CrossRef]
  20. Von Lützow, M.; Kögel-Knabner, I. Temperature sensitivity of soil organic matter decomposition-what do we know? Biol. Fertil. Soils 2009, 46, 1–15. [Google Scholar] [CrossRef]
  21. Rustad, L.E.; Campbell, J.L.; Marion, G.M.; Norby, R.J.; Mitchell, M.J.; Hartley, A.E.; Cornelissen, J.H.C.; Gurevitch, J.; Alward, R.; Beier, C.; et al. A meta-analysis of the response of soil respiration, net nitrogen mineralization, and aboveground plant growth to experimental ecosystem warming. Oecologia 2001, 126, 543–562. [Google Scholar] [CrossRef]
  22. Wang, C.; Chen, Z.; Unteregelsbacher, S.; Lu, H.; Gschwendtner, S.; Gasche, R.; Kolar, A.; Schloter, M.; Kiese, R.; Butterbach-Bahl, K.; et al. Climate change amplifies gross nitrogen turnover in montane grasslands of Central Europe in both summer and winter seasons. Glob. Change Biol. 2016, 22, 2963–2978. [Google Scholar] [CrossRef]
  23. Li, Z.; Zeng, Z.; Tian, D.; Wang, J.; Fu, Z.; Zhang, F.; Zhang, R.; Chen, W.; Luo, Y.; Niu, S. Global patterns and controlling factors of soil nitrification rate. Glob. Chang. Biol. 2020, gcb.15119. [Google Scholar] [CrossRef]
  24. Yuan, Z.Y.; Chen, H.Y.H. Decoupling of nitrogen and phosphorus in terrestrial plants associated with global changes. Nat. Clim. Chang. 2015, 5, 465–469. [Google Scholar] [CrossRef]
  25. Wiesmeier, M.; Hübner, R.; Barthold, F.; Spörlein, P.; Geuß, U.; Hangen, E.; Reischl, A.; Schilling, B.; von Lützow, M.; Kögel-Knabner, I. Amount, distribution and driving factors of soil organic carbon and nitrogen in cropland and grassland soils of southeast Germany (Bavaria). Agric. Ecosyst. Environ. 2013. [Google Scholar] [CrossRef]
  26. Olde Venterink, H. Productivity increase upon supply of multiple nutrients in fertilization experiments; co-limitation or chemical facilitation? Plant Soil 2016, 408, 515–518. [Google Scholar] [CrossRef]
  27. Penn, C.J.; Camberato, J.J. A Critical Review on Soil Chemical Processes that Control How Soil pH Affects Phosphorus Availability to Plants. Agriculture 2019, 9, 120. [Google Scholar] [CrossRef] [Green Version]
  28. Lindsay, W.L. Chemical Equilibria in Soils; John Wiley and Sons Ltd.: Hoboken, NJ, USA, 1979. [Google Scholar]
  29. Lee, M.; Manning, P.; Rist, J.; Power, S.A.; Marsh, C. A global comparison of grassland biomass responses to CO2 and nitrogen enrichment. Philos. Trans. R. Soc. B Biol. Sci. 2010, 365, 2047–2056. [Google Scholar] [CrossRef] [PubMed] [Green Version]
  30. Fay, P.A.; Prober, S.M.; Harpole, W.S.; Knops, J.M.H.; Bakker, J.D.; Borer, E.T.; Lind, E.M.; MacDougall, A.S.; Seabloom, E.W.; Wragg, P.D.; et al. Grassland productivity limited by multiple nutrients. Nat. Plants 2015, 1, 15080. [Google Scholar] [CrossRef]
  31. Sardans, J.; Rivas-Ubach, A.; Peñuelas, J. The C:N:P stoichiometry of organisms and ecosystems in a changing world: A review and perspectives. Perspect. Plant Ecol. Evol. Syst. 2012, 14, 33–47. [Google Scholar] [CrossRef]
  32. Schirpke, U.; Kohler, M.; Leitinger, G.; Fontana, V.; Tasser, E.; Tappeiner, U. Future impacts of changing land-use and climate on ecosystem services of mountain grassland and their resilience. Ecosyst. Serv. 2017, 26, 79–94. [Google Scholar] [CrossRef]
  33. Vitousek, P. Nutrient cycling and nutrient use efficiency. Am. Nat. 1982, 119, 553–572. [Google Scholar] [CrossRef]
  34. Veen, G.F.; Sundqvist, M.K.; Metcalfe, D.; Wilson, S.D. Above-Ground and Below-Ground Plant Responses to Fertilization in Two Subarctic Ecosystems. Arct. Antarct. Alp. Res. 2015, 47, 693–702. [Google Scholar] [CrossRef]
  35. Balogianni, V.G.; Wilson, S.D.; Vaness, B.M.; Macdougall, A.S.; Pinno, B.D. Different root and shoot responses to mowing and fertility in native and invaded grassland. Rangel. Ecol. Manag. 2014, 67, 39–45. [Google Scholar] [CrossRef]
  36. Sterner, R.W.; Elser, J.J. Ecological Stoichiometry: The Biology of Elements from Molecules to the Biosphere; Princeton University Press: Princeton, NJ, USA, 2002. [Google Scholar]
  37. Sistla, S.A.; Schimel, J.P. Stoichiometric flexibility as a regulator of carbon and nutrient cycling in terrestrial ecosystems under change. New Phytol. 2012, 196, 68–78. [Google Scholar] [CrossRef]
  38. Ågren, G.I. The C:N:P stoichiometry of autotrophs—Theory and observations. Ecol. Lett. 2004, 7, 185–191. [Google Scholar] [CrossRef]
  39. Yuan, Z.Y.; Chen, H.Y.H. Negative effects of fertilization on plant nutrient resorption. Ecology 2015, 96, 373–380. [Google Scholar] [CrossRef]
  40. Lemaire, G.; Gastal, F. N uptake and distribution in plant canopies. In Diagnosis of the Nitrogen Status in Crops; Springer: Berlin/Heidelberg, Germany, 1997; pp. 3–43. [Google Scholar]
  41. Nevens, F.; Rehuel, D. Effects of cutting or grazing grass swards on herbage yield, nitrogen uptake and residual soil nitrate at different levels of N fertilization. Grass Forage Sci. 2003, 58, 431–449. [Google Scholar] [CrossRef] [Green Version]
  42. An, Y.; Wan, S.; Zhou, X.; Subedar, A.A.; Wallace, L.L.; Luo, Y. Plant nitrogen concentration, use efficiency, and contents in a tallgrass prairie ecosystem under experimental warming. Glob. Chang. Biol. 2005, 11, 1733–1744. [Google Scholar] [CrossRef]
  43. Aerts, R.; Callaghan, T.V.; Dorrepaal, E.; van Logtestijn, R.S.P.; Cornelissen, J.H.C. Seasonal climate manipulations result in species-specific changes in leaf nutrient levels and isotopic composition in a sub-arctic bog. Funct. Ecol. 2009, 23, 680–688. [Google Scholar] [CrossRef]
  44. Day, T.A.; Ruhland, C.T.; Xiong, F.S. Warming increases aboveground plant biomass and C stocks in vascular-plant-dominated Antarctic tundra. Glob. Chang. Biol. 2008, 14, 1827–1843. [Google Scholar] [CrossRef]
  45. Larsen, K.S.; Andresen, L.C.; Beier, C.; Jonasson, S.; Albert, K.R.; Ambus, P.; Arndal, M.F.; Carter, M.S.; Christensen, S.; Holmstrup, M.; et al. Reduced N cycling in response to elevated CO2, warming, and drought in a Danish heathland: Synthesizing results of the CLIMAITE project after two years of treatments. Glob. Chang. Biol. 2011, 17, 1884–1899. [Google Scholar] [CrossRef]
  46. Güsewell, S. N:P ratios in terrestrial plants: Variation and functional significance. New Phytol. 2004, 164, 243–266. [Google Scholar] [CrossRef]
  47. Peñuelas, J.; Poulter, B.; Sardans, J.; Ciais, P.; Van Der Velde, M.; Bopp, L.; Boucher, O.; Godderis, Y.; Hinsinger, P.; Llusia, J.; et al. Human-induced nitrogen-phosphorus imbalances alter natural and managed ecosystems across the globe. Nat. Commun. 2013, 4, 1–10. [Google Scholar] [CrossRef] [PubMed] [Green Version]
  48. Hall, S.R. Stoichiometrically Explicit Food Webs: Feedbacks between Resource Supply, Elemental Constraints, and Species Diversity. Annu. Rev. Ecol. Evol. Syst. 2009, 40, 503–528. [Google Scholar] [CrossRef] [Green Version]
  49. Finzi, A.C.; Austin, A.T.; Cleland, E.E.; Frey, S.D.; Houlton, B.Z.; Wallenstein, M.D. Responses and feedbacks of coupled biogeochemical cycles to climate change: Examples from terrestrial ecosystems. Front. Ecol. Environ. 2011, 9, 61–67. [Google Scholar] [CrossRef] [Green Version]
  50. Lee, M.A.; Davis, A.P.; Chagunda, M.G.G.; Manning, P. Forage quality declines with rising temperatures, with implications for livestock production and methane emissions. Biogeosciences 2017, 14, 1403–1417. [Google Scholar] [CrossRef] [Green Version]
  51. Berauer, B.J.; Wilfahrt, P.A.; Reu, B.; Schuchardt, M.A.; Garcia-franco, N.; Zistl-Schlingmann, M.; Dannenmann, M.; Kiese, R.; Kühnel, A.; Jentsch, A. Predicting forage quality of species-rich pasture grasslands using vis-NIRS to reveal effects of management intensity and climate change. Agric. Ecosyst. Environ. 2020, 296, 106929. [Google Scholar] [CrossRef]
  52. Li, C.; Peng, F.; Xue, X.; You, Q.; Lai, C.; Zhang, W.; Cheng, Y. Productivity and Quality of Alpine Grassland Vary with Soil Water Availability Under Experimental Warming. Front. Plant Sci. 2018, 9, 1790. [Google Scholar] [CrossRef] [Green Version]
  53. Xu, W.; Zhu, M.; Zhang, Z.; Ma, Z.; Liu, H.; Chen, L.; Cao, G.; Zhao, X.; Schmid, B.; He, J.-S. Experimentally simulating warmer and wetter climate additively improves rangeland quality on the Tibetan Plateau. J. Appl. Ecol. 2018, 55, 1486–1497. [Google Scholar] [CrossRef]
  54. Gottfried, M.; Pauli, H.; Futschik, A.; Akhalkatsi, M.; Barančok, P.; Benito Alonso, J.L.; Coldea, G.; Dick, J.; Erschbamer, B.; Fernández Calzado, M.R.; et al. Continent-wide response of mountain vegetation to climate change. Nat. Clim. Chang. 2012, 2, 111–115. [Google Scholar] [CrossRef]
  55. Steinbauer, M.J.; Grytnes, J.-A.; Jurasinski, G.; Kulonen, A.; Lenoir, J.; Pauli, H.; Rixen, C.; Winkler, M.; Bardy-Durchhalter, M.; Barni, E.; et al. Accelerated increase in plant species richness on mountain summits is linked to warming. Nature 2018, 556, 231–234. [Google Scholar] [CrossRef] [PubMed]
  56. Gossner, M.M.; Lewinsohn, T.M.; Kahl, T.; Grassein, F.; Boch, S.; Prati, D.; Birkhofer, K.; Renner, S.C.; Sikorski, J.; Wubet, T.; et al. Land-use intensification causes multitrophic homogenization of grassland communities. Nature 2016, 540, 266. [Google Scholar] [CrossRef]
  57. French, K.E. Species composition determines forage quality and medicinal value of high diversity grasslands in lowland England. Agric. Ecosyst. Environ. 2017. [Google Scholar] [CrossRef]
  58. Stearns, S.C. Life history evolution: Successes, limitations, and prospects. Naturwissenschaften 2000, 87, 476–486. [Google Scholar] [CrossRef]
  59. Reich, P.B. The world-wide “fast-slow” plant economics spectrum: A traits manifesto. J. Ecol. 2014, 102, 275–301. [Google Scholar] [CrossRef]
  60. Olsen, S.L.; Töpper, J.P.; Skarpaas, O.; Vandvik, V.; Klanderud, K. From facilitation to competition: Temperature-driven shift in dominant plant interactions affects population dynamics in seminatural grasslands. Glob. Chang. Biol. 2016, 22, 1915–1926. [Google Scholar] [CrossRef]
  61. Halbritter, A.H.; De Boeck, H.J.; Eycott, A.E.; Reinsch, S.; Robinson, D.A.; Vicca, S.; Berauer, B.; Christiansen, C.T.; Estiarte, M.; Grünzweig, J.M.; et al. The handbook for standardized field and laboratory measurements in terrestrial climate change experiments and observational studies (ClimEx). Methods Ecol. Evol. 2020, 11. [Google Scholar] [CrossRef] [Green Version]
  62. Zhang, X.; Alexander, L.; Hegerl, G.C.; Jones, P.; Tank, A.K.; Peterson, T.C.; Trewin, B.; Zwiers, F.W. Indices for monitoring changes in extremes based on daily temperature and precipitation data. Wiley Interdiscip. Rev. Clim. Chang. 2011, 2, 851–870. [Google Scholar] [CrossRef]
  63. Dirmeyer, P.A.; Zeng, F.J.; Ducharne, A.; Morrill, J.C.; Koster, R.D. The sensitivity of surface fluxes to soil water content in three land surface schemes. J. Hydrometeorol. 2000, 1, 121–134. [Google Scholar] [CrossRef]
  64. Saxton, K.E.; Rawls, W.J. Soil Water Characteristic Estimates by Texture and Organic Matter for Hydrologic Solutions. Soil Sci. Soc. Am. J. 2006, 70, 1569. [Google Scholar] [CrossRef] [Green Version]
  65. Elser, J.J.; Fagan, W.F.; Kerkhoff, A.J.; Swenson, N.G.; Enquist, B.J. Biological stoichiometry of plant production: Metabolism, scaling and ecological response to global change. New Phytol. 2010, 186, 593–608. [Google Scholar] [CrossRef] [Green Version]
  66. Zuur, A.; Ieno, E.N.; Walker, N.; Saveliev, A.A.; Smith, G.M. Mixed Effects Models and Extensions in Ecology with R; Springer: Berlin/Heidelberg, Germany, 2009. [Google Scholar]
  67. R Core Team. R: A Language and Environment for Statistical Computing; The R Foundation: Vienna, Austria, 2019. [Google Scholar]
  68. Pinheiro, J.; Bates, D.; DebRoy, S.; Sarkar, D.; R Core Team. nlme: Linear and Nonlinear Mixed Effects Models. R package Version 3.1-140; The R Foundation: Vienna, Austria, 2019. [Google Scholar]
  69. Lenth, R.V.; Herv, M. Least-Squares Means: The Package. J. Stat. Soft. 2016, 69. [Google Scholar] [CrossRef] [Green Version]
  70. Lin, D.; Xia, J.; Wan, S. Climate warming and biomass accumulation of terrestrial plants: A meta-analysis. New Phytol. 2010, 188, 187–198. [Google Scholar] [CrossRef] [PubMed]
  71. Wang, N.; Quesada, B.; Xia, L.; Butterbach-Bahl, K.; Goodale, C.L.; Kiese, R. Effects of climate warming on carbon fluxes in grasslands—A global meta-analysis. Glob. Chang. Biol. 2019, 25, 1839–1851. [Google Scholar] [CrossRef] [PubMed]
  72. Beckmann, M.; Gerstner, K.; Akin-Fajiye, M.; Ceaușu, S.; Kambach, S.; Kinlock, N.L.; Phillips, H.R.P.; Verhagen, W.; Gurevitch, J.; Klotz, S.; et al. Conventional land-use intensification reduces species richness and increases production: A global meta-analysis. Glob. Chang. Biol. 2019, 25, 1941–1956. [Google Scholar] [CrossRef]
  73. Socher, S.A.; Prati, D.; Boch, S.; Müller, J.; Baumbach, H.; Gockel, S.; Hemp, A.; Schöning, I.; Wells, K.; Buscot, F.; et al. Interacting effects of fertilization, mowing and grazing on plant species diversity of 1500 grasslands in Germany differ between regions. Basic Appl. Ecol. 2013, 14, 126–136. [Google Scholar] [CrossRef]
  74. Hautier, Y.; Tilman, D.; Isbell, F.; Seabloom, E.W.; Borer, E.T.; Reich, P.B. Anthropogenic environmental changes affect ecosystem stability via biodiversity. Science 2015, 348, 336–340. [Google Scholar] [CrossRef] [PubMed] [Green Version]
  75. Craven, D.; Isbell, F.; Manning, P.; Connolly, J.; Bruelheide, H.; Ebeling, A.; Roscher, C.; van Ruijven, J.; Weigelt, A.; Wilsey, B.; et al. Plant diversity effects on grassland productivity are robust to both nutrient enrichment and drought. Philos. Trans. R. Soc. Lond. B. Biol. Sci. 2016, 371, 20150277. [Google Scholar] [CrossRef] [PubMed]
  76. Ma, Z.; Liu, H.; Mi, Z.; Zhang, Z.; Wang, Y.; Xu, W.; Jiang, L.; He, J.-S. Climate warming reduces the temporal stability of plant community biomass production. Nat. Commun. 2017, 8, 15378. [Google Scholar] [CrossRef]
  77. Xu, Y.; Ramanathan, V.; Victor, D.G. Global warming will happen faster than we think. Nature 2018, 564, 30–32. [Google Scholar] [CrossRef] [PubMed] [Green Version]
  78. Hansen, J.; Sato, M.; Ruedy, R. Perception of climate change. Proc. Natl. Acad. Sci. USA 2012, 109, E2415–E2423. [Google Scholar] [CrossRef] [Green Version]
  79. Cardinale, B.J.; Duffy, J.E.; Gonzalez, A.; Hooper, D.U.; Perrings, C.; Venail, P.; Narwani, A.; Mace, G.M.; Tilman, D.; Wardle, D.A.; et al. Biodiversity loss and its impact on humanity. Nature 2012, 486, 59–67. [Google Scholar] [CrossRef] [Green Version]
  80. Sunday, J.M. The pace of biodiversity change in a warming climate. Nature 2020, 580, 460–461. [Google Scholar] [CrossRef] [Green Version]
  81. Fuchslueger, L.; Kastl, E.-M.; Bauer, F.; Kienzl, S.; Hasibeder, R.; Ladreiter-Knauss, T.; Schmitt, M.; Bahn, M.; Schloter, M.; Richter, A.; et al. Effects of drought on nitrogen turnover and abundances of ammonia-oxidizers in mountain grassland. Biogeosci. Discuss. 2014, 11, 9183–9214. [Google Scholar] [CrossRef]
  82. Koerselman, W.; Meuleman, A.F.M. The Vegetation N:P Ratio: A New Tool to Detect the Nature of Nutrient Limitation. J. Appl. Ecol. 1996, 33, 1441. [Google Scholar] [CrossRef]
  83. Zistl-Schlingmann, M.; Feng, J.; Kiese, R.; Stephan, R.; Zuazo, P.; Willibald, G.; Wang, C.; Butterbach-Bahl, K.; Dannenmann, M. Dinitrogen emissions: An overlooked key component of the N balance of montane grasslands. Biogeochemistry 2019, 143, 15–30. [Google Scholar] [CrossRef] [Green Version]
  84. Liebisch, F.; Bünemann, E.K.; Huguenin-Elie, O.; Jeangros, B.; Frossard, E.; Oberson, A. Plant phosphorus nutrition indicators evaluated in agricultural grasslands managed at different intensities. Eur. J. Agron. 2013, 44, 67–77. [Google Scholar] [CrossRef]
  85. Soussana, J.-F.; Tallec, T.; Blanfort, V. Mitigating the greenhouse gas balance of ruminant production systems through carbon sequestration in grasslands. Animal 2010, 4, 334–350. [Google Scholar] [CrossRef] [PubMed] [Green Version]
  86. Soussana, J.-F.F.; Lemaire, G. Coupling carbon and nitrogen cycles for environmentally sustainable intensification of grasslands and crop-livestock systems. Agric. Ecosyst. Environ. 2014, 190, 9–17. [Google Scholar] [CrossRef]
  87. Blüthgen, N.; Simons, N.K.; Jung, K.; Prati, D.; Renner, S.C.; Boch, S.; Fischer, M.; Hölzel, N.; Klaus, V.H.; Kleinebecker, T.; et al. Land use imperils plant and animal community stability through changes in asynchrony rather than diversity. Nat. Commun. 2016, 7, 1–7. [Google Scholar] [CrossRef] [Green Version]
  88. Allan, E.; Manning, P.; Alt, F.; Binkenstein, J.; Blaser, S.; Blüthgen, N.; Böhm, S.; Grassein, F.; Hölzel, N.; Klaus, V.H.; et al. Land use intensification alters ecosystem multifunctionality via loss of biodiversity and changes to functional composition. Ecol. Lett. 2015, 18, 834–843. [Google Scholar] [CrossRef]
Figure 1. Scheme of experimental set-up. Each coloured plant symbol represents six plant-soil communities (replicates), translocated along an elevational and climatic gradient. The two different plant symbols represent communities from two different sites of origin, and colours represent climatic conditions, from cold (blue) to warm (red). The two contrasting—extensive (EXT) and intensive (INT)—land-use intensities are given on top of each respective row.
Agronomy 11 00910 g001
Figure 2. Yearly ANPP (a,b) of extensively managed (left column of a, b, c, d) communities of both high-elevation (a,c) and mid-elevation (b,d) origin remains stable over the two years of study, contrasted with the significant decline in ANPP of intensive managed (right column of a, b. c, d) communities in 2018. The C:N ratio (c,d) is higher under extensive management, and increases in 2018, in contrast to a constant low C:N ratio of intensively managed communities. Shown are mean and standard deviation. Letters indicate significant (p < 0.05) differences within panel. Colours match recipient site colour code of Figure 1.
Agronomy 11 00910 g002
Figure 3. Relationship between C:N and N:P ratios of high-elevation (left column) and mid-elevation (right column) communities for 2017 (top row) and 2018 (bottom row).
Agronomy 11 00910 g003
Figure 4. Soil wetness index of communities originating from high-elevation site (Esterberg) under extensive (left column) and intensive (right column) land-use intensity, at their respective recipient site: control (top), +1 K (center), and +3 K (bottom). The growing season (grey shaded areas) of 2018 reveals more pronounced dry spells (area with wetness index < 0) than 2017, especially at mid- and low-elevation sites. Dashed lines indicate date of harvest.
Agronomy 11 00910 g004
Publisher’s Note: MDPI stays neutral with regard to jurisdictional claims in published maps and institutional affiliations.

