Article

Screening of Wheat Genotypes for Nitrogen Deficiency Tolerance Using Stress Screening Indices

1
Agricultural Institute Osijek, 31000 Osijek, Croatia
2
Faculty of Agrobiotechnical Sciences Osijek, Josip Juraj Strossmayer University of Osijek, 31000 Osijek, Croatia
3
Centre of Excellence for Biodiversity and Molecular Plant Breeding (CroP-BioDiv), 10000 Zagreb, Croatia
*
Author to whom correspondence should be addressed.
Agronomy 2021, 11(8), 1544; https://doi.org/10.3390/agronomy11081544
Submission received: 30 June 2021 / Revised: 27 July 2021 / Accepted: 29 July 2021 / Published: 31 July 2021
(This article belongs to the Special Issue Wheat Agronomic and Quality Responses to Environmental Impacts)

Abstract

:
An increased awareness of environmental protection and sustainable production raise the necessity of incorporating the selection of low nitrogen-tolerant winter wheat cultivars for high yield and quality in the breeding process. This selection can be assisted by using stress screening indices. Our study aimed to evaluate and compare a number of stress screening indices and to determine and select the most nitrogen deficiency-tolerant winter wheat cultivars for further breeding. The experiment included forty-eight winter wheat cultivars from eight different countries that were grown for two consecutive years at three different locations under low-nitrogen (LN) and high-nitrogen (HN) conditions. The results emphasized the importance of applying the appropriate stress screening indices in evaluating and selecting nitrogen deficiency-tolerant wheat cultivars. The promising stress screening indices were the mean productivity index (MP), geometric mean productivity index (GMP), harmonic mean index (HM), stress tolerance index (STI) and yield index (YI). They identified cultivars Sofru, BC Opsesija and MV-Nemere as the most tolerant cultivars to LN conditions for grain yield. The same indices classified U-1, OS-Olimpija, Forcali, Viktoria and BC Tena cultivars as the most tolerant to LN conditions for the grain protein content. Using the tolerance index (TOL), yield stability index (YSI) and relative stress index (RSI), the Katarina and Ficko cultivars were denoted as LN-tolerant cultivars in terms of the grain yield and Isengrain, Tosunbey, Vulkan and BC Darija in terms of the grain protein content.

1. Introduction

Nitrogen, as one of the essential nutrients for plant growth, development and productivity, is a substantial requirement for efficient and profitable crop production. Its deficiency may lead to changes in the gene expression, plant metabolism, growth rates and, finally, crop yield and quality reduction [1,2]. In order to avoid crop failure, N fertilizers are usually applied in large quantities. However, the excessive application of N fertilizers beyond nitrogen plant requirements has adversely affected the environment, and it has become obvious that, due to a number of various damaging effects on the environment and economic costs, the high-nitrogen fertilizer consumption has to be optimized [3].
An increased awareness of environmental protection and sustainable production raises the necessity to incorporate a selection of low-nitrogen-tolerant winter wheat cultivars for high yield and quality in the breeding process. Consequently, breeding for high-nitrogen use efficiency (NUE) has become of great importance. The most commonly used concept of breeding for NUE is to select superior germplasms for the grain yield per se by exploiting the existing genetic variations under environmental stress conditions [4]. This selection can be assisted by using stress screening indices.
A number of stress screening indices described by different mathematical expressions with two to four variables have been used for identifying tolerant cultivars under stress and stress-free environments [5]. For instance, the tolerance index (TOL) was defined as the difference between trait performances without and under stress conditions [6]. Rosielle and Hamblin [6] also proposed the mean productivity index (MP) as the average trait performance of a cultivar under stress and nonstress conditions. Fernandez [7] introduced the stress tolerance index (STI) and geometric mean productivity index (GMP), where STI was the ratio of the products’ yield performance under stress and nonstress conditions and squared mean yield performance under nonstress conditions, and GMP was the square root of the product of the cultivar performance under stress and nonstress conditions. The stress susceptibility index (SSI) was used for the evaluation of trait stability and for the determination of changes in traits under different environments by utilizing the yield performance of each cultivar and mean yield performance under both conditions [8]. The relative stress index (RSI) was introduced by Fisher and Wood [9] in research on drought stress on spring wheat cultivars. The harmonic mean (HM) is another index that relies on trait performances. It was used in research on wheat–rye disomic addition lines and calculated as the ratio of a doubled product of cultivar yield under stress and nonstress conditions and their sum [10]. The yield stability index (YSI) was defined as the ratio between the yield performance under and without stress [11], while the yield index (YI) was defined as the ratio between the trait performance of certain cultivar and mean performance of all the cultivars under stress conditions [12]. Nevertheless, simple criteria for the determination of tolerant and stabile cultivars are high values for the MP, STI, GMP, RSI, HM, YSI and YI, as well as low values for the TOL and SSI [13].
A number of research papers on wheat were focused on the evaluation of low-nitrogen stress on the yield [14,15]. Additionally, there have been studies on rice [16] and rapeseed [17] that evaluated low-nitrogen stress effects using stress screening indices. Our study focused on an analysis of nitrogen fertilization stress on grain yield and the grain protein content in winter wheat using stress screening indices. The specific objectives were: (1) to evaluate, compare and identify the most promising stress screening indices for the evaluation of cultivar nitrogen deficiency tolerance in wheat for grain yield and grain protein; (2) to evaluate the correlation between the stress screening indices and performance of the grain yield and grain protein content under high and low amounts of nitrogen and (3) to identify and select the most nitrogen deficiency-tolerant winter wheat cultivars for further breeding purposes.

2. Materials and Methods

2.1. Plant Materials and Field Experiment

The experimental material included forty-eight winter wheat cultivars released from 1936 to 2016, mostly by Croatian—HR breeding institutes (33 cultivars) and the rest by breeding programs from seven other countries (Austria—AU, France—FR, Hungary—HU, Italy—IT, Romania—RO, Russia—RUS and Turkey—TR).
Cultivars were evaluated in field trials under two N fertilization levels during two consecutive growth seasons (2016/17 and 2017/18) at Osijek (45°33′ N, 18°40′ E), Zagreb (45°48′ N, 15°58′ E) and Poreč (45°13′ N, 13°35′ E). These locations represent different climatic conditions and soil types in Croatia. In general, Osijek and Zagreb have continental climates, dry with an Eutric Cambisol soil type and humid with a carbonate alluvium soil type, respectively. Poreč has a Mediterranean climate and red soil.
The experiment was set up as a split-plot factorial design in three replications with two N fertilization levels as the main plots and 48 wheat cultivars as the subplots. The plot sizes were 7.56 m2 at Osijek and Poreč and 4.95 m2 at Zagreb. The sowing rate was 350 viable kernels m−2 in all trials and for all cultivars. In order to avoid edge effects on the experimental plots, buffer plots were sown at the beginning and at the end of the main N treatment plots. Basic and pre-sowing fertilizations of 74-kg N ha−1, 80-kg P2O5 ha−1 and 120-kg K2O ha−1 were applied by adding 100 kg ha−1 of urea (46% N) and 400 kg ha−1 of NPK (7:20:30) in order to achieve the experimental conditions as similar as possible to those conditions in wheat production in the region where nitrogen is applied before planting. The N treatment comprised two N fertilization levels, 0-kg N ha−1 (low N, LN) and 100-kg N ha−1 (high N, HN), in a form of calcium ammonium nitrate (27% N). HN-level plots were top-dressed by 50-kg N ha−1 in tillering (GS23-25 after [18]) and by 50-kg N ha−1 during the stem extension (GS33-35 [18]) growth stages.
Herbicides, insecticides and fungicides to control major weeds, insects and foliar diseases were applied in accordance with the commercial practices of wheat production in the Southeastern European region. All trials were harvested at harvest maturity (GS92 [18]) by plot combines and weighed. Grain yield values were recalculated to a 0% moisture content and kg ha−1. Grain protein content (%) was measured using an Infratec 1241 Grain Analyzer (Foss, Denmark) from the grain samples of 0.5 kg collected after the harvest across all experimental plots.

2.2. Statistical Analysis

Combined analysis of variance (ANOVA), best linear unbiased prediction (BLUP) for grain yield and grain protein content, principal component analysis (PCA) and 3D visualization of the results were performed by R software [19]. ANOVA was performed using linear model (aov function) with fixed effects for the year, location and cultivar effects, including their interactions. The screening indices were computed, and Pearson’s correlation coefficients, as well as Spearman’s rank order, were estimated using iPASTIC [13], which describes the stress indices as follows:
The tolerance index (TOL):
TOL = Yp Ys ,
where Yp is the yield of the cultivar under HN conditions (e.g., yield under normal conditions to achieve the full potential), and Ys is the yield of the cultivar under LN conditions (e.g., yield under stress conditions);
The stress susceptibility index (SSI):
SSI = 1 Ys Yp SI ,
where SI = 1 Yms Ymp (SI is the stress intensity, and Yms and Ymp are the yield means of all cultivars under stress and without it, respectively);
The yield stability index (YSI):
YSI = Ys Yp ;
the yield index (YI):
YI = Ys Yms ;
the mean productivity index (MP):
MP = Yp + Ys 2 ;
the geometric mean productivity index (GMP):
GMP = Ys × Yp ;
the stress tolerance index (STI):
STI = Yp × Ys Ymp 2 ;
the harmonic mean index (HM):
HM = 2 ( Ys × Yp ) ( Ys + Yp ) ;
the relative stress index (RSI):
RSI = Ys Yp Yms Ymp .

3. Results

3.1. Combined ANOVA for Grain Yield, Grain Protein Content and Stress Indices

The combined ANOVA revealed varying effects of the tested factors on the grain yield at the high-nitrogen level (Yp), low-nitrogen level (Ys) and nine indices (Table 1). The cultivar significantly affected the Yp, Ys, MP, GMP, HM, STI and YI values. The effect of location was significant for Yp; Ys and only three screening indices (MP, GMP and HM). Similarly, the year significantly affected the Yp; Ys and TOL, STI and YSI. The cultivar × location (G × L), cultivar × year (G × Y), location × year (L × Y) and cultivar × location × year (G × L × Y) interactions were significant for the Yp, MP, GMP, HM and STI. The G × L and L × Y interactions were significant for the TOL, while the G × L and G × Y interactions were significant for the YI. In addition, L × Y was significant for the YSI, and G × L was significant for the RSI. None of the factors significantly affected the SSI (stress screening index).
The combined ANOVA for the grain protein content and nine indices showed that the effects of the cultivar, location, year, G × L, G × Y, L × Y and G × L × Y were significant for the Yp, MP, GMP and HM and not significant for the SSI and RSI (Table 2). The cultivar significantly affected the Ys, STI and YI, while the location affected the Ys, TOL, STI and YSI. The effect of the year was significant for the Ys. The STI and YI were significantly affected by the G × L, G × Y and G × L × Y interactions. The Ys was affected by the G × Y and L × Y interactions, and the TOL was affected by the L × Y interaction.

3.2. BLUP Values for Grain Yield and Grain Protein Content and Stress Tolerance Indices

The BLUP values for the grain yield under high- (Yp) and low (Ys)-nitrogen conditions and nine stress tolerance indices across the cultivars are shown in Table 3. The cultivars Sofru and BC Opsesija had the highest values for grain yield under the LN (7013.8 kg ha−1 and 6782.22 kg ha−1, respectively) and HN conditions (7721.44 kg ha−1 and 7518.06 kg ha−1, respectively). These cultivars also had the highest value for the MP (7367.62 and 7150.14), GMP (7359.12 and 7140.67), HM (7350.63 and 7131.21), STI (1.51402 and 1.15037) and YI (1.15979 and 1.134). For the same indices and nitrogen conditions, cultivar U-1 had the lowest values of the Yp (4585.59 kg ha−1), Ys (4209.84 kg ha−1), MP (4397.72), GMP (4393.7), HM (4389.69), STI (0.43553) and YI (0.70389). Cultivars Katarina and Ficko had the highest values for the TOL (1117.97 and 1083.3) and SSI (1.50954 and 1.54922) and the lowest values for the YSI (0.84654 and 0.8425) and RSI (0.94234 and 0.93785), while, in contrast, Flamura 85 had the lowest value for the TOL (265.67) and SSI (0.42561) and the highest values for the YSI (0.95673) and RSI (1.065).
The BLUP values for the grain protein content under the high- and low-nitrogen conditions and nine stress tolerance indices are shown in Table 4. Cultivar U-1 had the highest value of grain protein content under the HN (17.3%) and LN (14.5%) conditions. It also had the highest values for the MP (15.815), GMP (15.7602), HM (15.7057), STI (1.472) and YI (1.29703). The lowest grain protein content value under the HN condition was obtained by Sofru (10.34%), while BC Certissa had the lowest grain protein content value under the LN condition (8.65%) and the lowest MP (9.705), GMP (9.64749) and HM (9.59031) values. Cultivar Isengrain had the highest YSI (0.92382) and RSI (1.07344) values and the lowest TOL (0.79) and SSI (0.54655) values. In contrast, cultivar Golubica had the highest TOL (3.67) and SSI (1.6675) and the lowest YSI (0.76757) and RSI (0.89189) values.

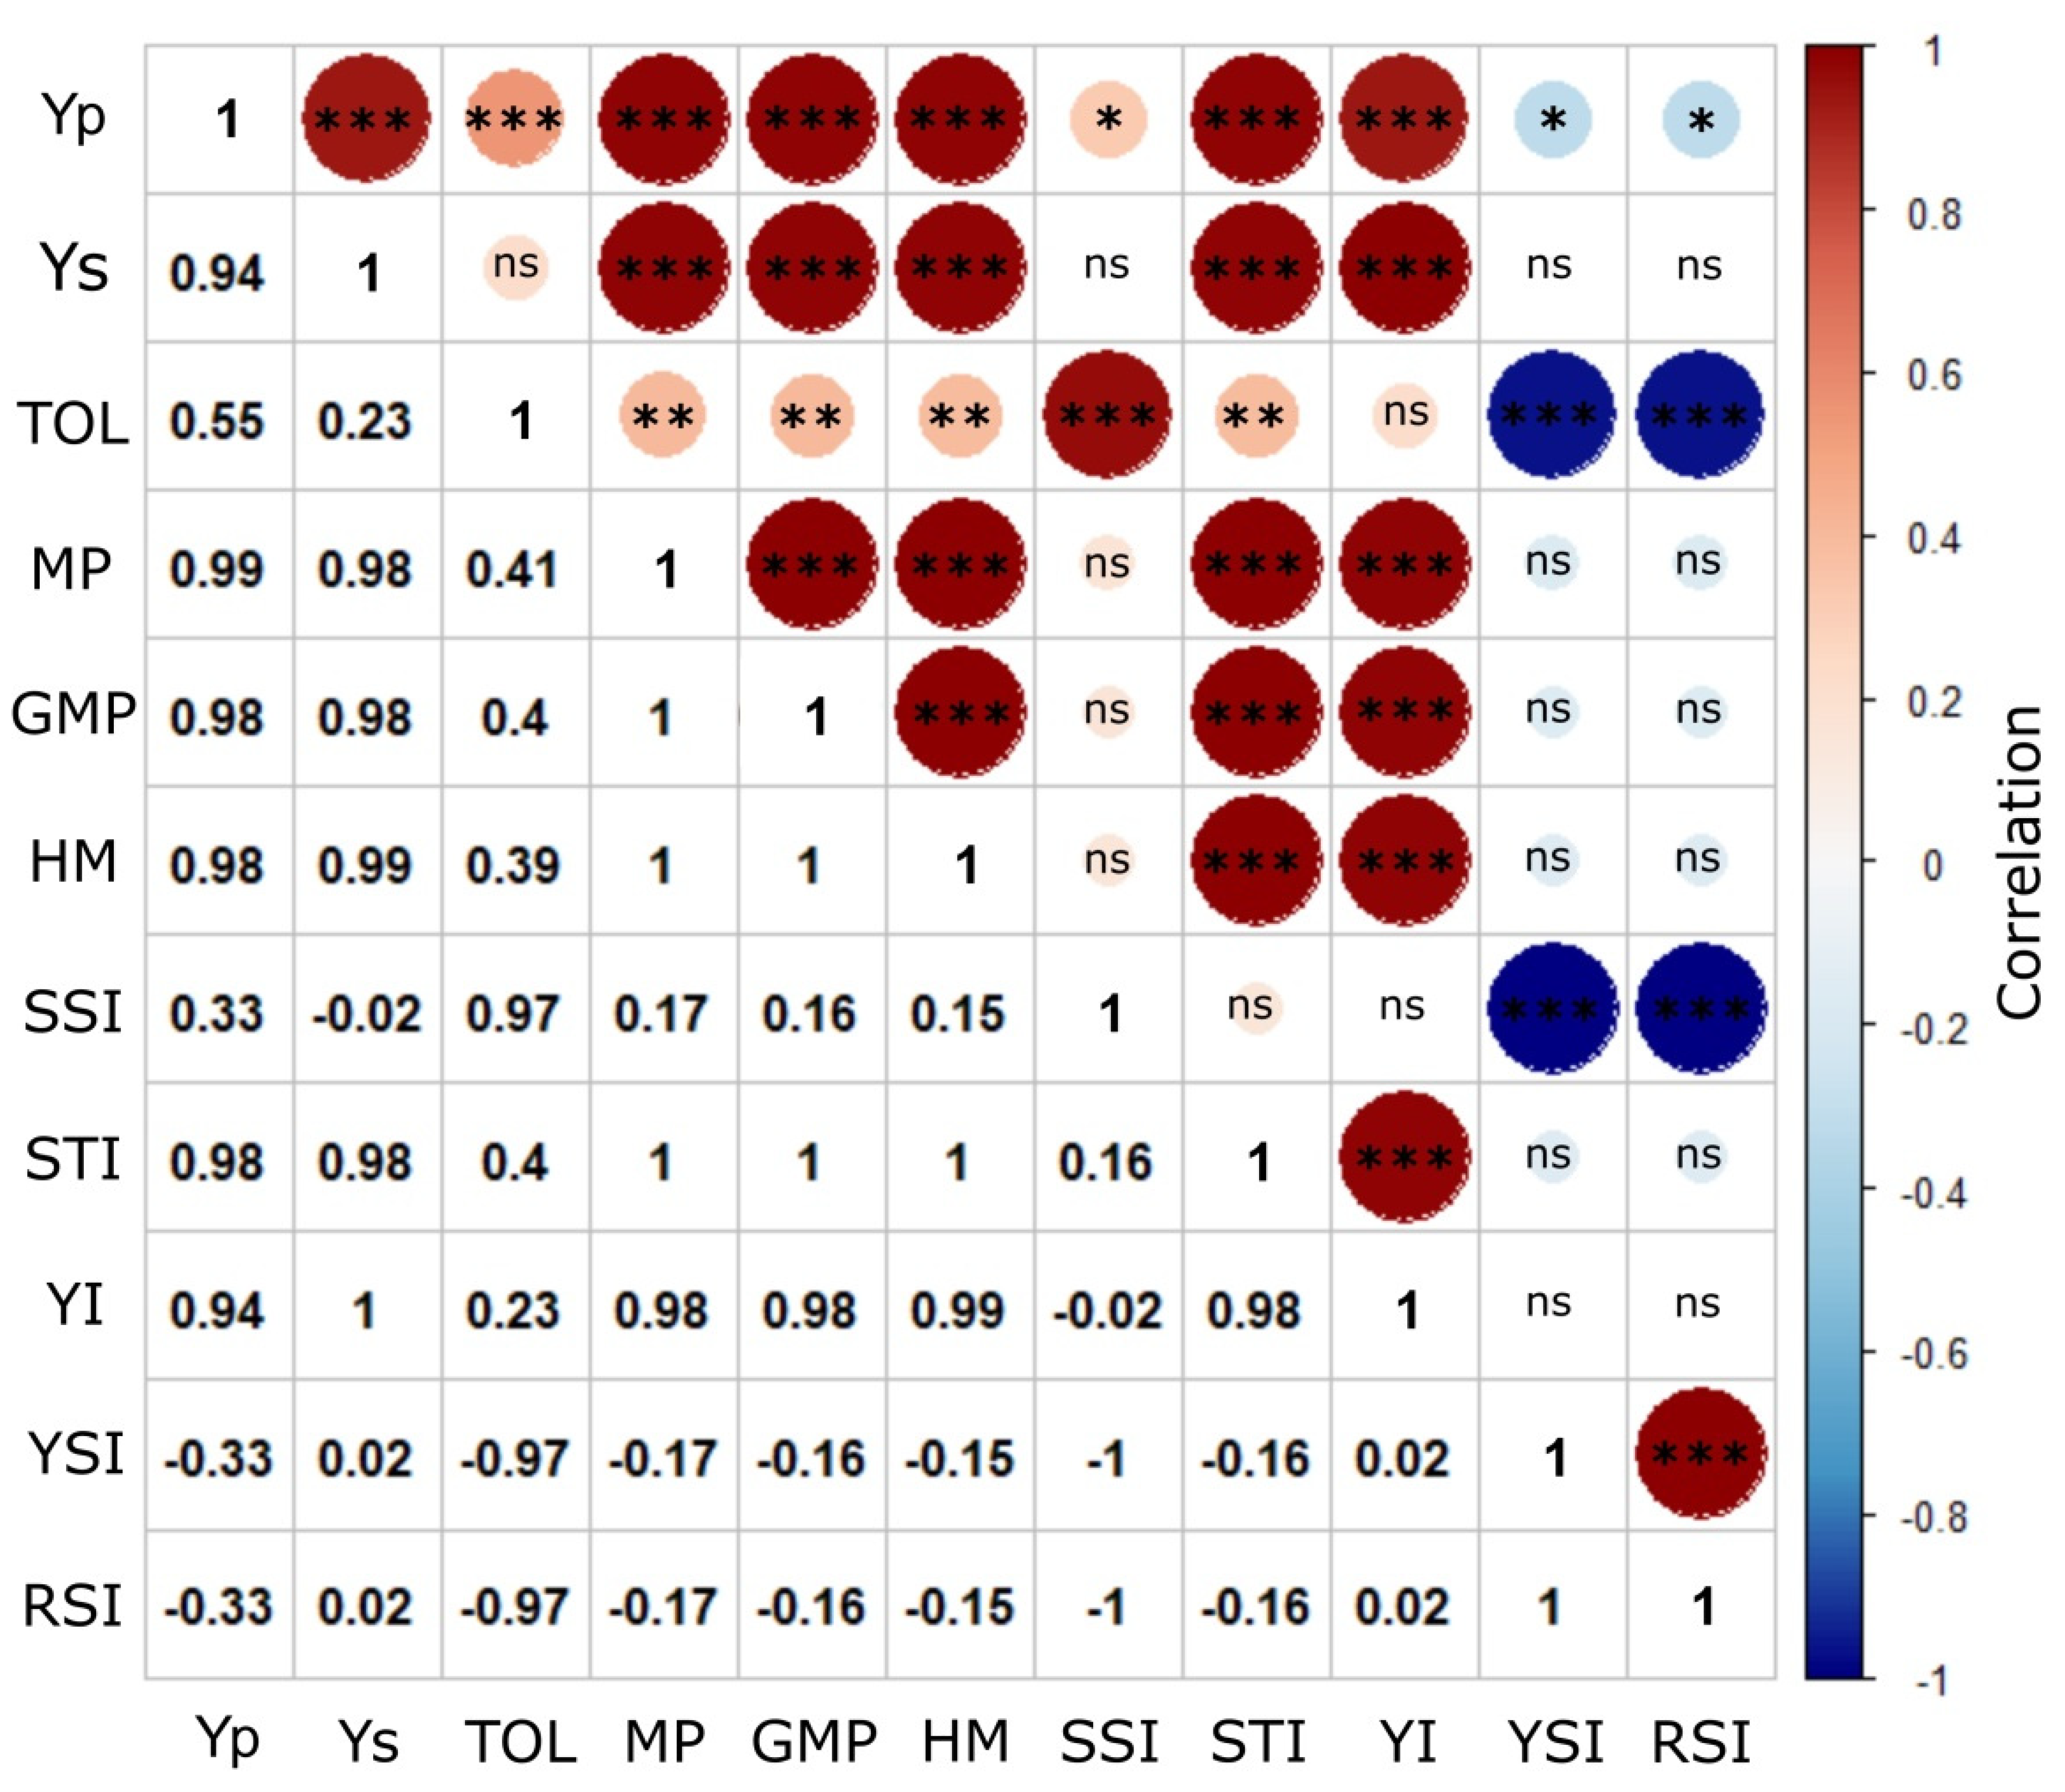
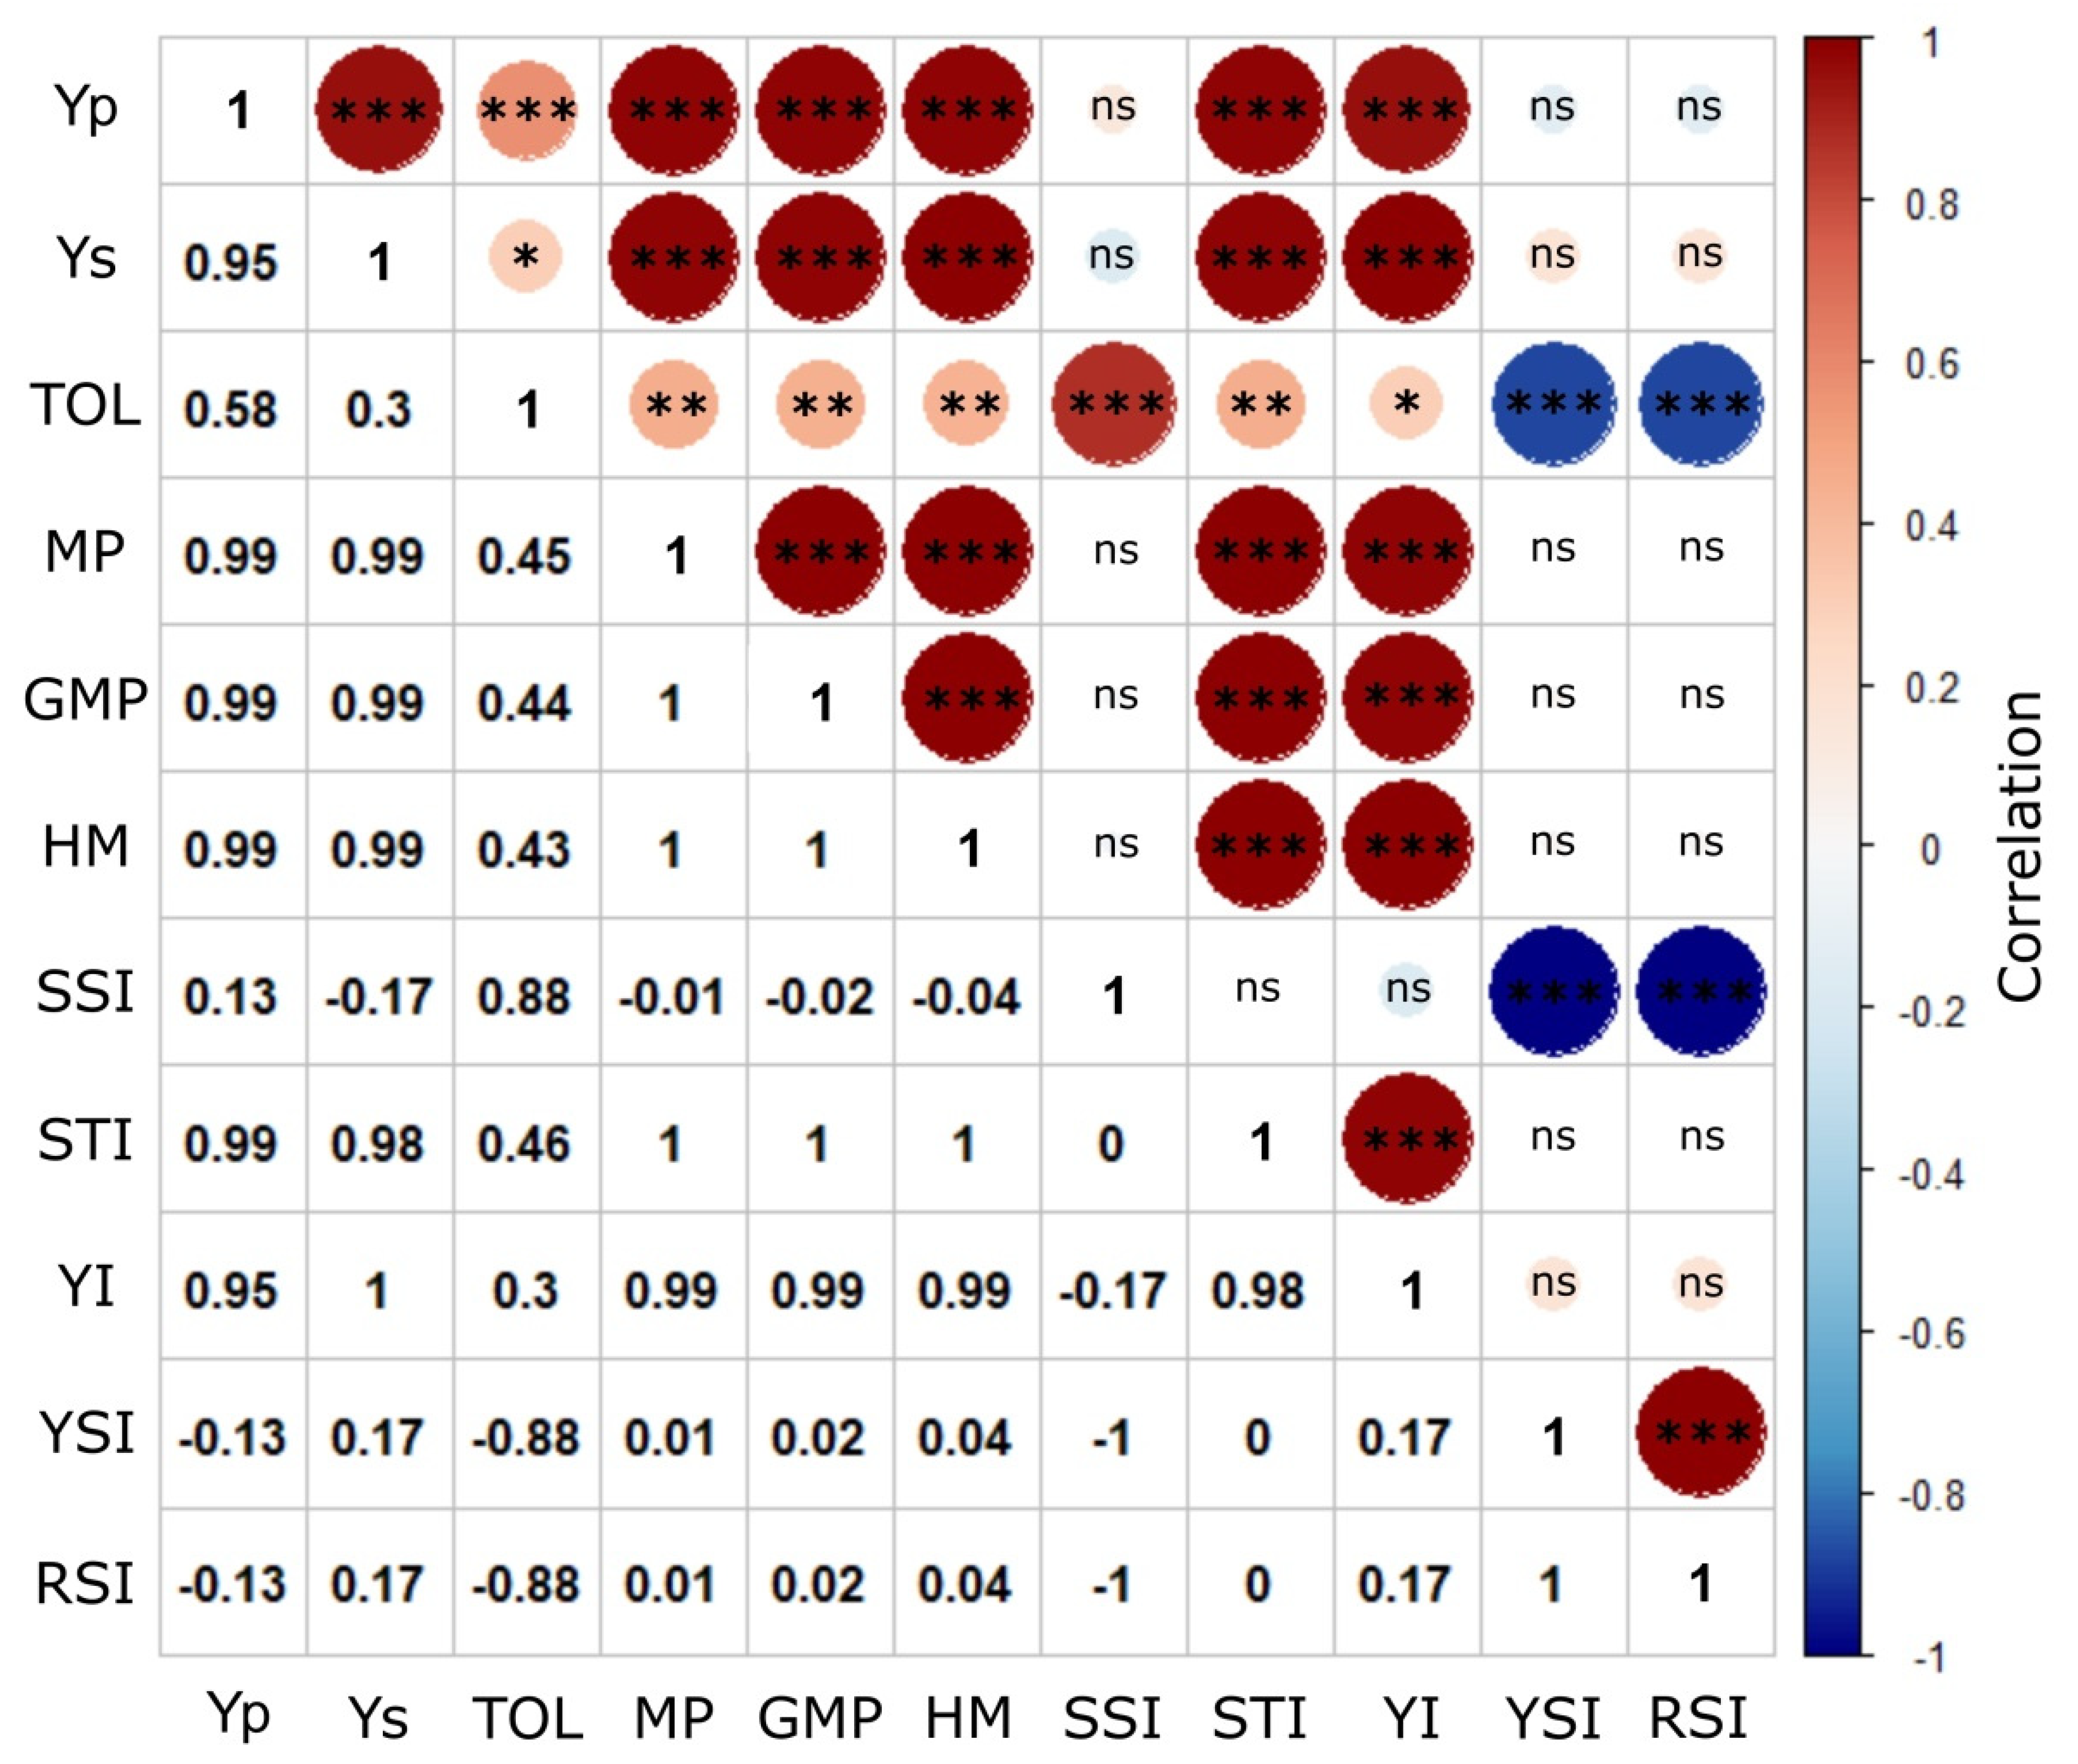
3.3. Correlation Analysis of Grain Yield, Grain Protein Content and Stress Screening Indices

The correlation analysis for the grain yield and grain protein content under the low and optimal nitrogen conditions is shown in Table 5. High negative correlations were found between the grain yield and grain protein content performance for both (stress and nonstress) conditions, with r values ranging from −0.67 ** to −0.74 **.
The results of the correlation analysis for the grain yield and different stress tolerance indices revealed the variegated strengths and directions of the relationships (Figure 1). The significance of the correlations also varied (Supplementary Table S1). Very high positive correlations were found between the Ys and MP (r = 0.98 **), GMP (r = 0.98 **), HM (r = 0.99 **), STI (r = 0.98 **) and YI (r = 1.00 **), while no correlation was found between the Ys and SSI, YSI and RSI. A low, insignificant positive correlation was found between the Ys and TOL (r = 0.23). In terms of the yield performance under the high-nitrogen treatment, a very high positive correlation was found between the Yp and MP (r = 0.99 **), GMP (r = 0.98 **), HM (r = 0.98 **), STI (r = 0.98 **) and YI (r = 0.94 **). Additionally, a moderate positive significant correlation between the Yp and TOL (r = 0.55 **) and low, significant positive correlation between the Yp and SSI (r = 0.33 *) were found. A low, significant negative correlation between the Yp and YSI (r = −0.33 *) and Yp and RSI (r = −0.33 *) was observed. The TOL screening index was moderately positively correlated with the MP (r = 0.41 **), GMP (r = 40 **), HM (r = 0.39 **) and STI (r = 0.40 **) and highly with the SSI (r = 0.97 **). High negative correlations were found for both the TOL and SSI with the YSI and RSI (r = −0.97 ** to −1.00 **). The MP had a perfectly positive correlation with the GMP (r = 1.00 **), HM (r = 1.00 **) and STI (r = 1.00 **) and an almost perfect correlation with the YI (r = 0.98 **). The GMP relationships with the HM, STI and YI were the same. The STI was highly positive correlated to the YI (r = 0.98 **).
A correlation analysis for the grain protein content and different stress tolerance indices is shown in Figure 2. The results were similar to the results of the correlation analysis for the grain yield. Very high positive correlations were found between the Yp and MP (r = 0.99 **), GMP (r = 0.99 **), HM (r = 0.99 **), STI (r = 0.95 **) and YI (r = 0.95 **), while a moderate positive correlation was found between the Yp and TOL (r = 0.58 **). No correlations were found between the Yp and the SSI, YSI and RSI. Almost identical values were calculated for the correlation coefficients between the Ys and the MP (r = 0.99 **), GMP (r = 0.99 **), HM (r = 0.99 **), STI (r = 0.98 **) and YI (r = 1.00 **). A low positive correlation was found between the Ys and TOL (r = 0.30 *) but no significant correlations between the Ys and SSI, YSI and RSI. The correlation coefficients, together with the level of significance for the grain protein content and stress screening indices, are shown in Supplementary Table S2. The TOL screening index was in a moderately positive correlation with the MP (r = 0.45 **), GMP (r = 0.44 **), HM (r = 0.43 **) and STI (r = 0.46 **) and in a high positive correlation with the SSI (r = 0.88 **). Additionally, high negative correlations were found for the TOL and SSI with the YSI and RSI (r = −0.88 ** to −1.00 **). In addition, the MP was in perfectly positive correlation with the GMP (r = 1.00 **), HM (r = 1.00 **) and STI (r = 1.00 **) and in almost perfect correlation with the YI (r = 0.99 **). The GMP relationships with the HM, STI and YI followed the trend found for the grain yield data. Additionally, the STI was also highly positive correlated to the YI (r = 0.98 **).

3.4. Identifying Nitrogen Deficiency-Tolerant Winter Wheat Cultivars

According to the MP, GMP, HM, STI and YI indices, cultivars Sofru (G40), BC Opsesija (G10) and MV-Nemere (G29) may be highlighted as the cultivars with the highest grain yield performances under stress (Ys) and nonstress (Yp) conditions (Supplementary Figure S1). Opposite to these cultivars, cultivars U-1 (G44), Bezostaja-1 (12) and BC Tena (11) had the lowest values for grain yield under both N treatments. The TOL, YSI and RSI indices indicated cultivars Katarina (G24) and Ficko (G17) as N deficiency-tolerant cultivars for the grain yield.
For the grain protein content, and according to the MP, GMP, HM, STI and YI values of the indices, U-1 (G44) had the highest value, along with the cultivar OS-Olimpija (G31), for both nitrogen conditions (Supplementary Figure S2). Cultivars Forcali (G19), Viktoria (G45) and BC Tena (G11) also revealed a high tolerance to the LN conditions for the grain protein content. The TOL, YSI and RSI indices highlighted Isengrain (G23), Tosunbey (G43), Vulkan (G46) and BC Darija (G5) as the LN-tolerant cultivars for the grain protein content.

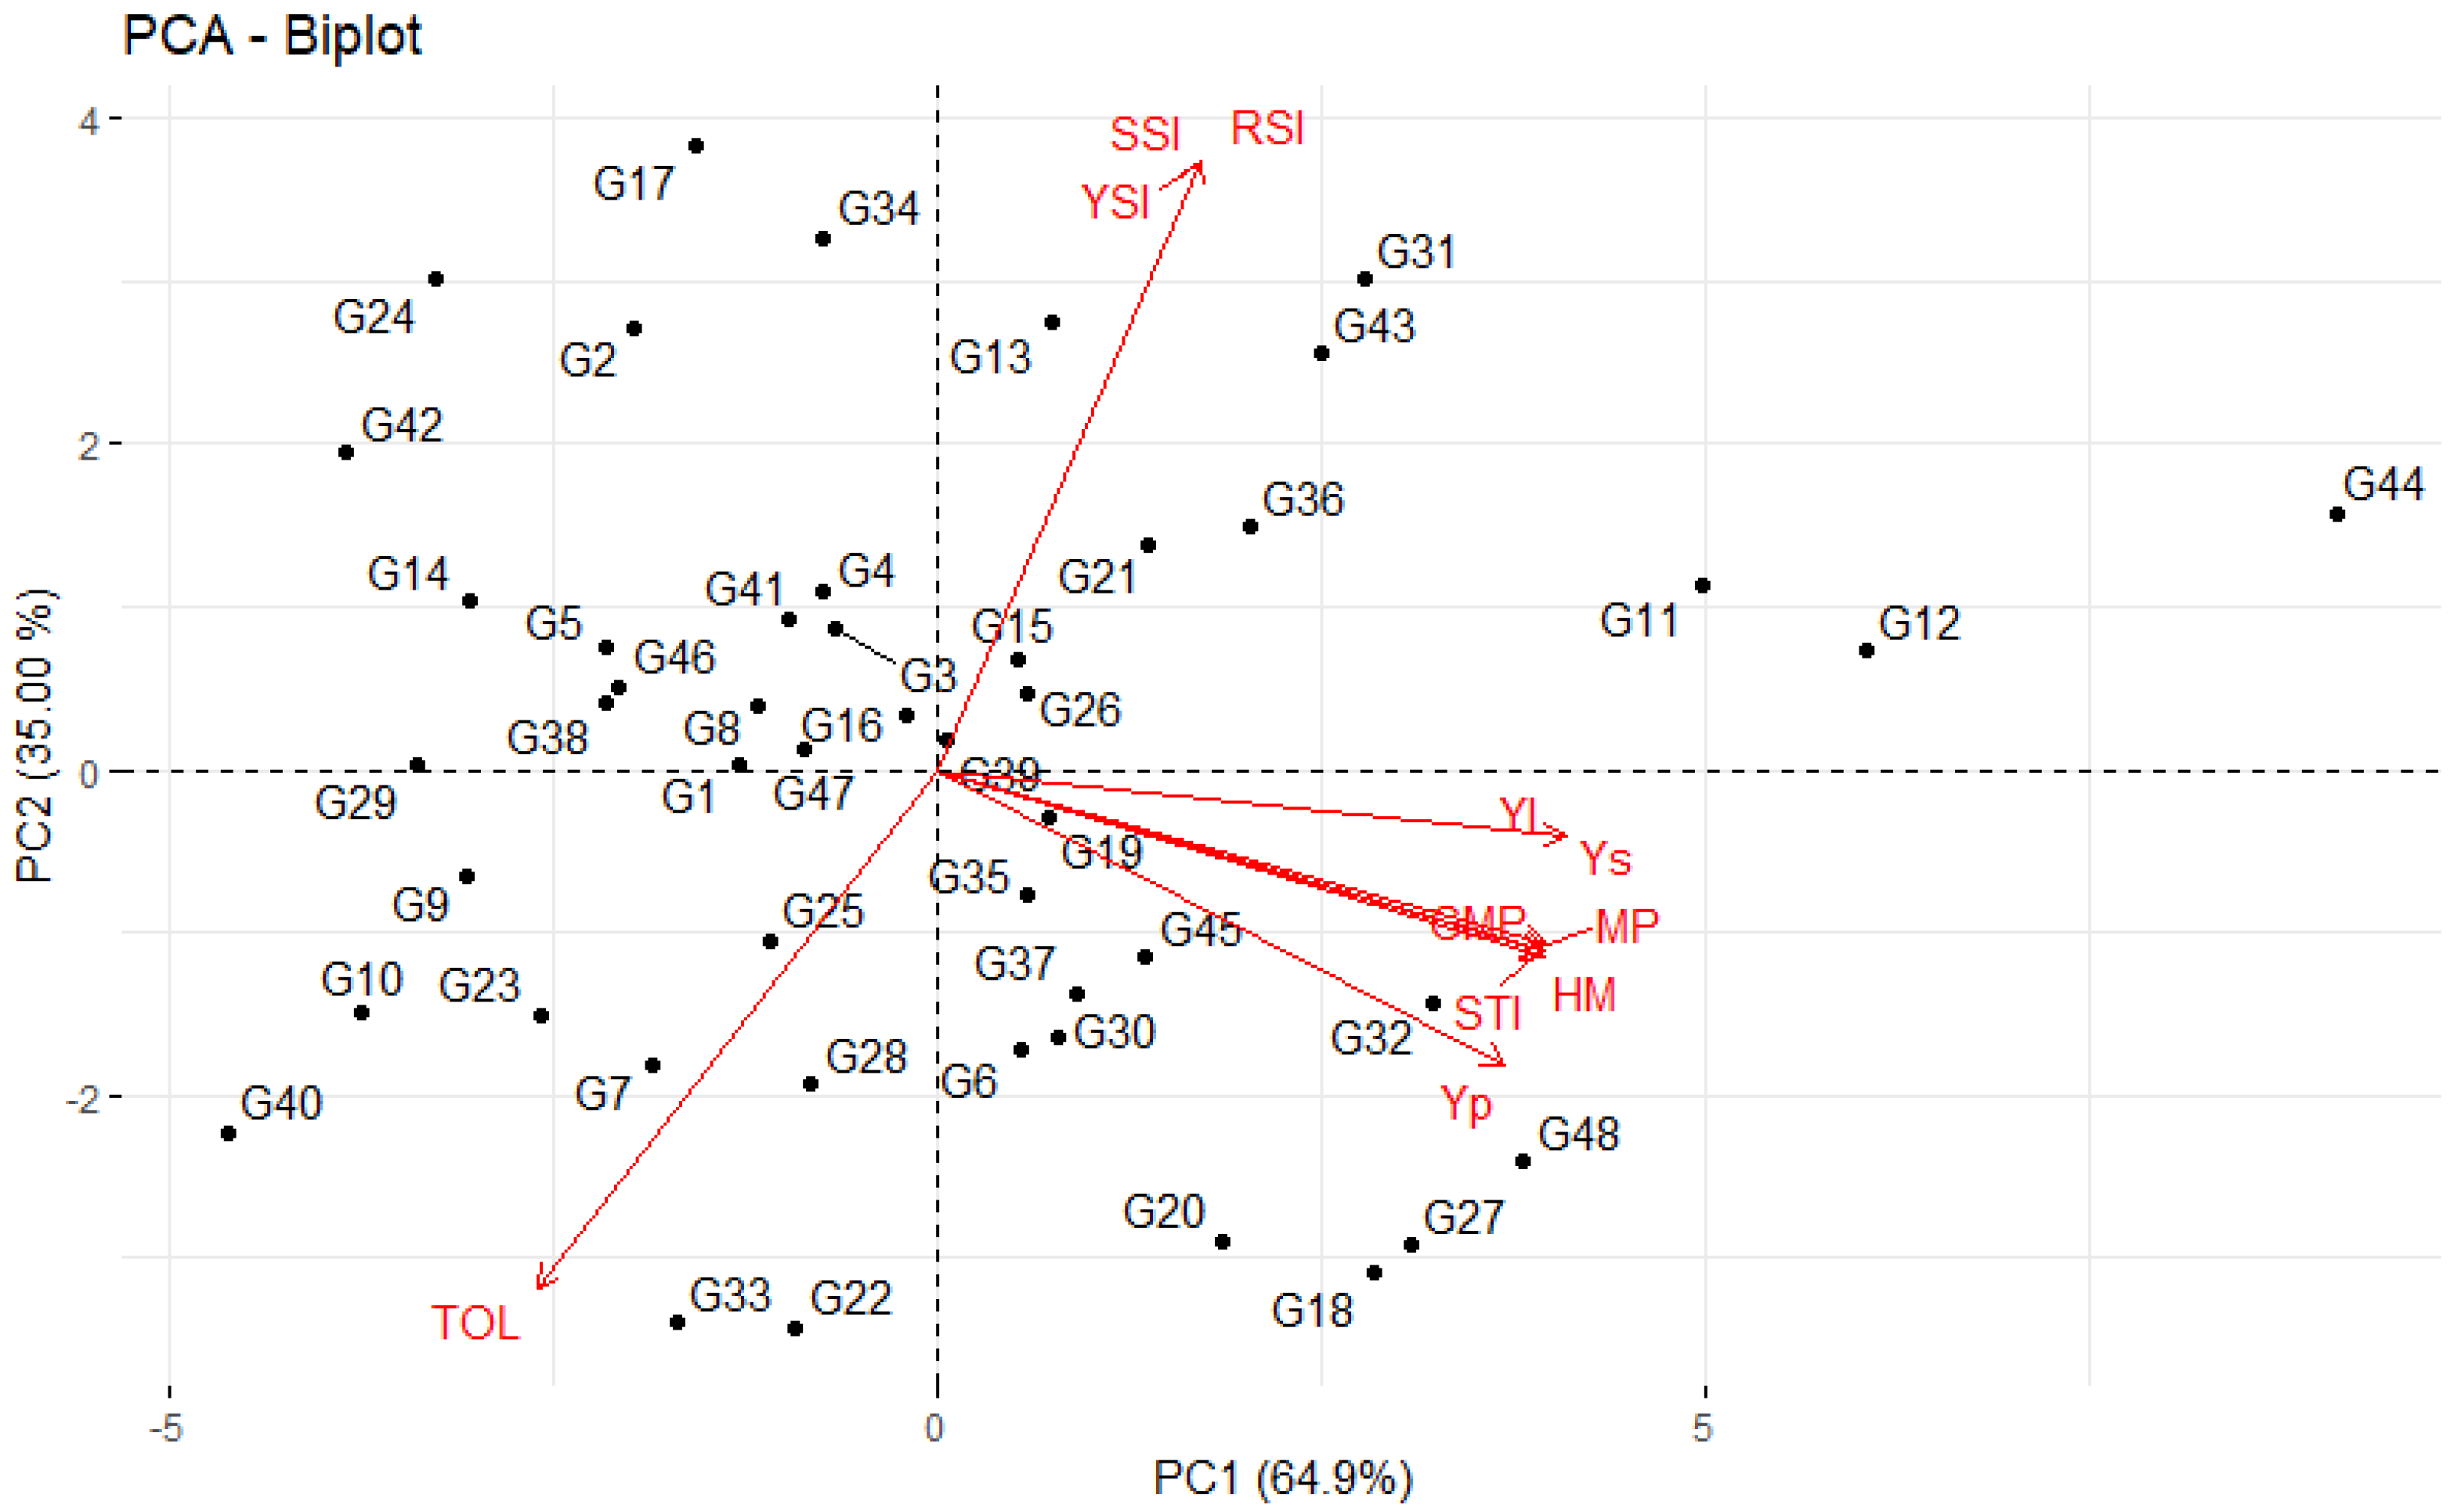
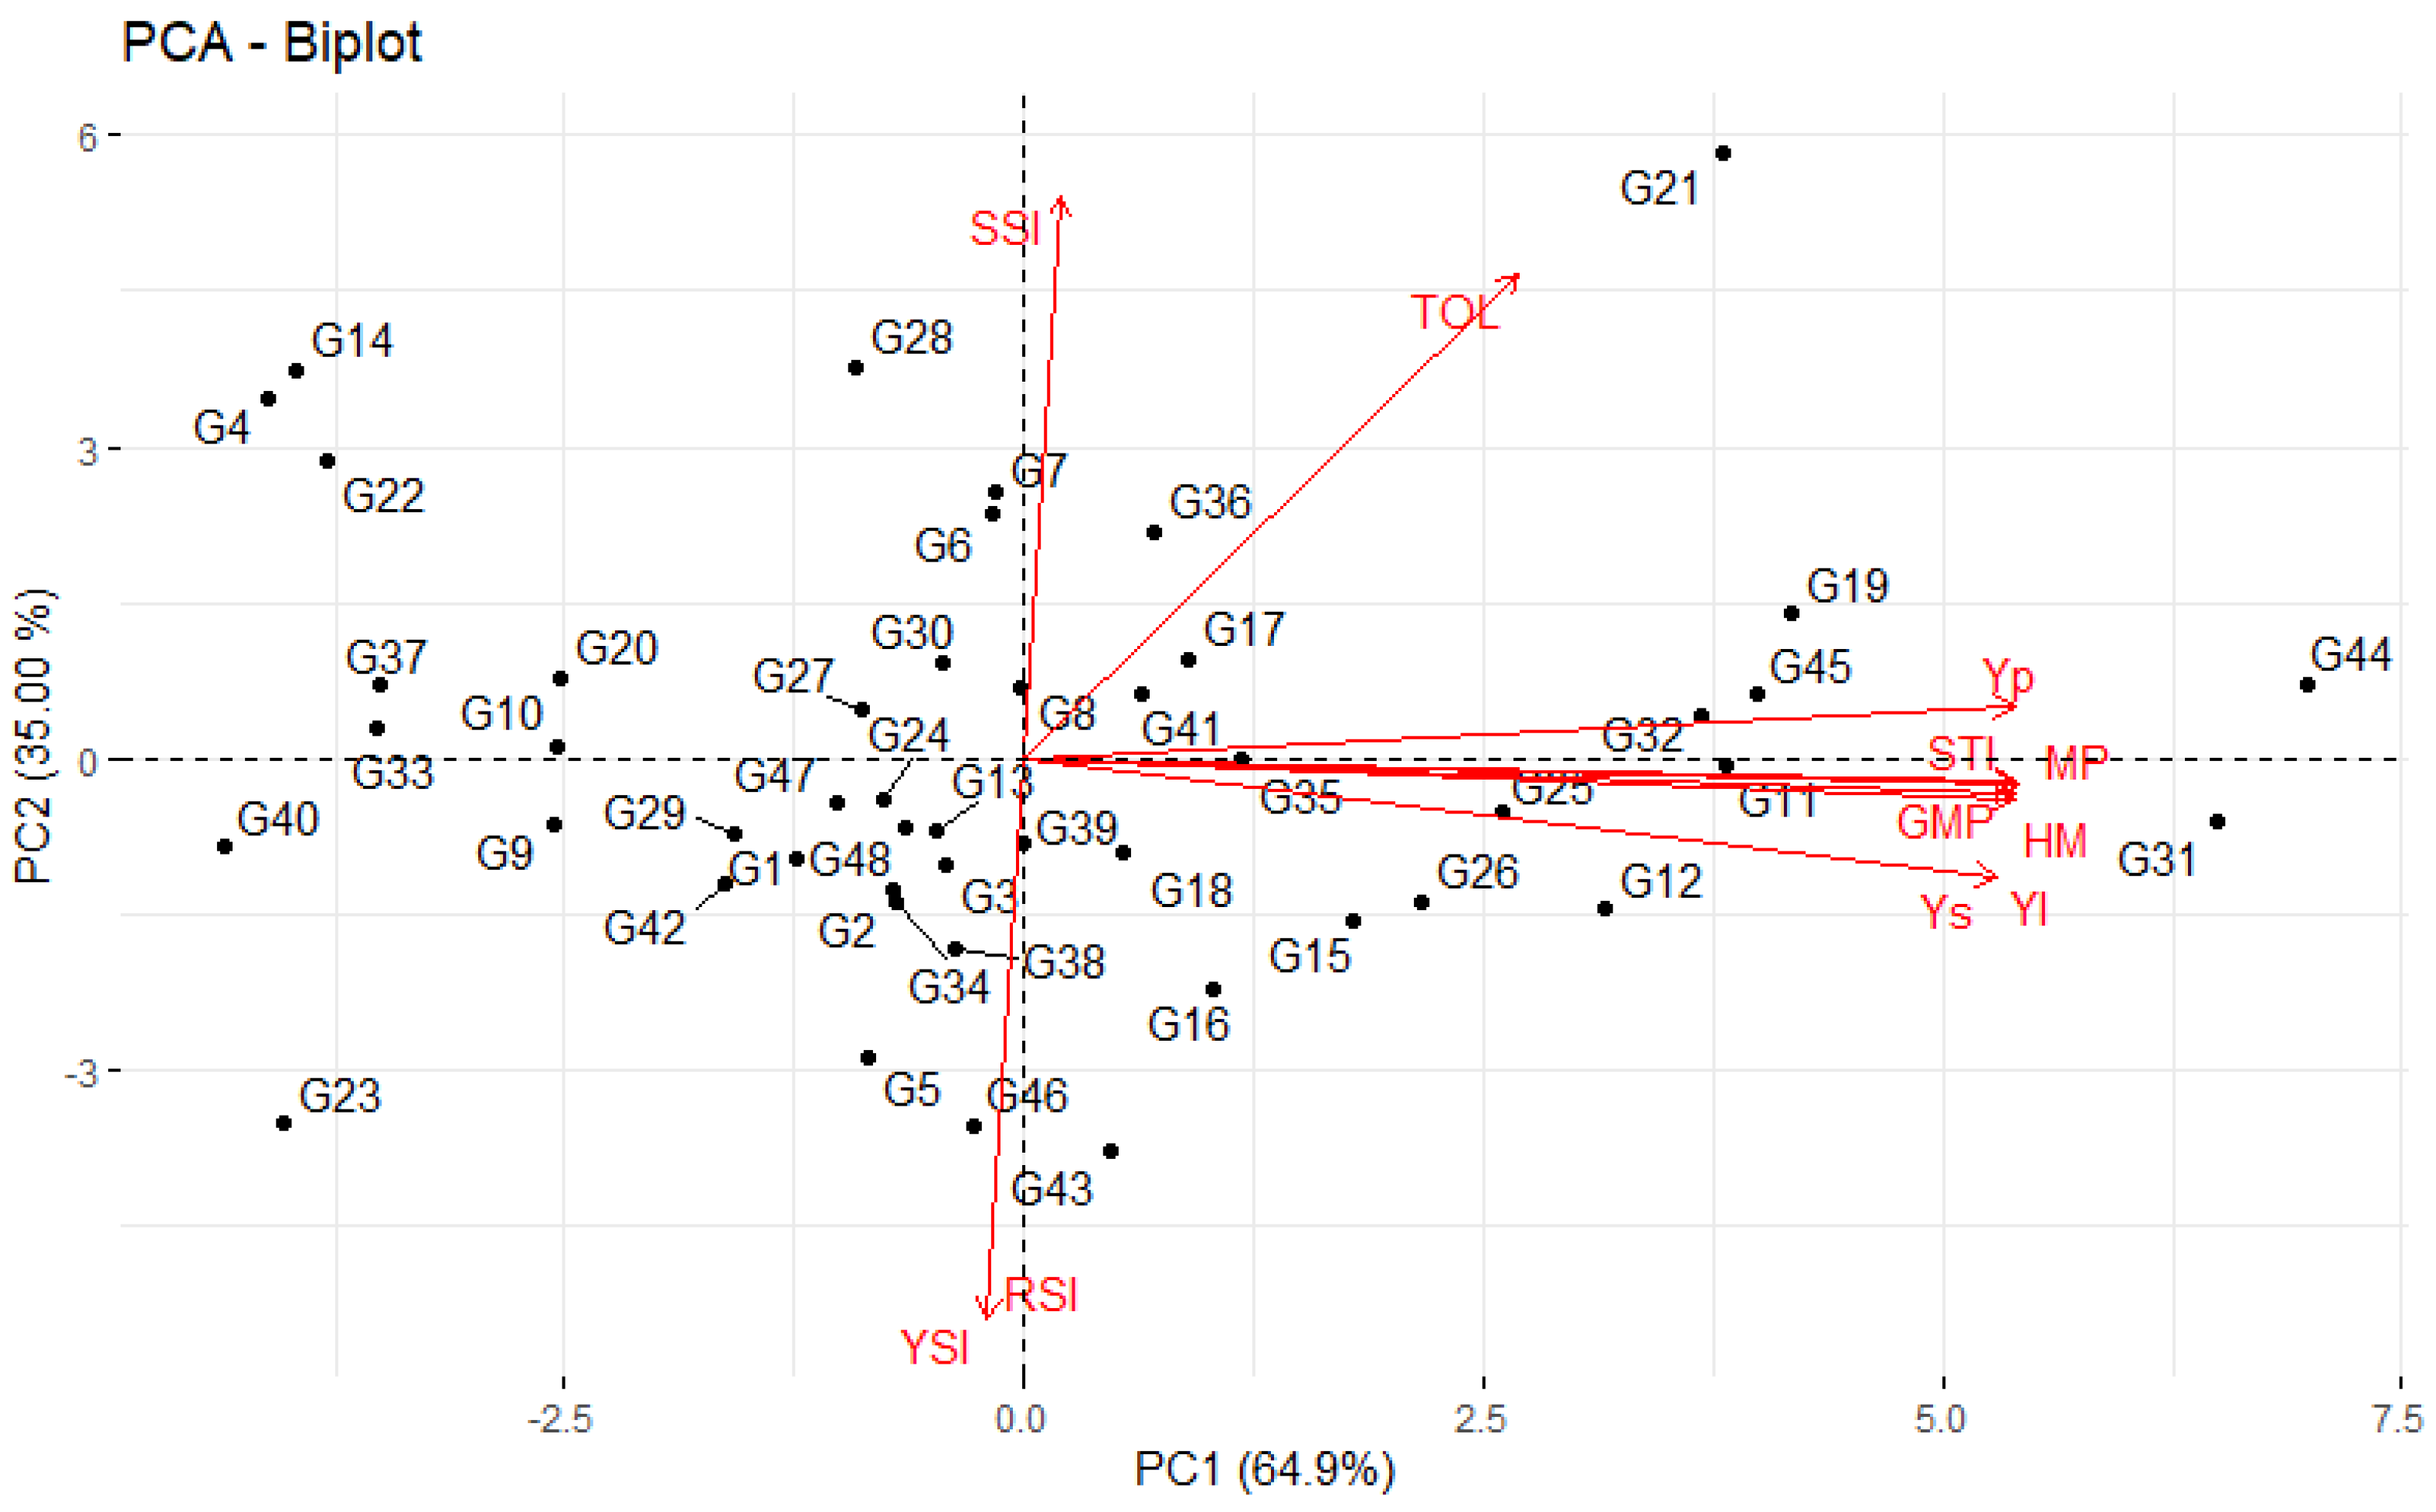
3.5. Principal Component Analysis for Indices, Grain Yield and Grain Protein Content

A PCA biplot for the grain yield and different stress tolerance indices is shown in Figure 3. The total contribution to the first two components of variation was 99.9%. The first principal component (PC1) contributed to the variations by 64.9% and indicated a strong correlation with the YI, Ys, GMP, MP, HM, STI and Yp. The second principal component (PC2) contributed to the variations by 35%, and it had a strong correlation with the YSI, SSI, RSI and TOL.
As in the case of the PCA for the grain yield, the total contribution of the first two principal components for the grain protein content was 99.9%, while the first principal component (PC1) also contributed to the variations by 64.9% and indicated a strong correlation with the YI, Ys, GMP, HM, MP, STI and Yp (Figure 4). The second principal component (PC2) contributed to the variations by 35%, and it had a strong correlation with the YSI, RSI, SSI and TOL.

4. Discussion

This study was focused on evaluation of stress screening indices and analysis of low nitrogen tolerance for grain yield and grain protein content of winter wheat cultivars originated from different breeding institutions based on stress screening indices. It was confirmed, as in other studies [2,20,21] that the low nitrogen soil conditions significantly reduce winter wheat grain yield and grain protein content performance.
Grain yield and grain protein content were in high negative correlation independently on N conditions. That negative correlation is in agreement with other studies on wheat [22,23,24]. The result fully support previous conclusions about difficulties for breeders to simultaneously increase protein content while maintain grain yield [25].
The revealed significance of cultivar, location and year effects, and most of their interactions in this study support previously reported data on wheat grain yield and grain protein variation. A study on Croatian winter wheat [21] reported significant effects of cultivar and environment on grain yield and grain protein content, while genotype by environment interaction effect was significant only on grain yield. Other study [26] showed significant effect of genotype by environment interaction on both, grain yield and grain protein content. Our data indicated significance of all main effects as well as almost all combinations of cultivar, location and year interactions for grain yield and grain protein content, with exception of G × L interaction for grain protein content and G × L × Y interaction for grain yield and grain protein content under low nitrogen conditions.
Significant variations were detected by ANOVA for investigated screening indices. In comparison to study from Zhao et al. [27], we have not observed significant location effect for STI and YSI and year effect for MP, GMP and HM. In contrast, we observed significant G × Y effect for MP. Also, we observed only significant year effect on YSI, while mentioned study observed significant effects of cultivar, location, year, G × Y and G × L. This discrepancy may be due to genetic divergence of cultivars investigated and differences in environmental conditions of experiments. TOL, YSI, MP, HM, GMP are stress screening indices that uses only grain yield and grain protein content performance of certain cultivar under stress and non-stress conditions, while SSI and RSI are using mean performance of all cultivars in both conditions besides performance of each cultivar in both conditions. YI uses only performance of cultivar under stress condition and mean performance of all cultivars under stress condition, while STI uses performance of single cultivar under stress and non-stress conditions and mean performance of all cultivars under optimal conditions. Correlation coefficient between YSI and other screening index always have same value but opposite sign from correlation coefficient between SSI and that same index. This is also confirmed in study on low nitrogen tolerance on rice [16].
This study compared several stress screening indices as tool for selection of low nitrogen tolerant winter wheat cultivars. Indices MP, GMP, HM, STI and YI showed very high positive correlation with grain yield and grain protein content under stress and non-stress conditions. Previous studies on wheat [28,29], and on other species like canola [30] and maize [31,32] confirm that trend for grain yield. According to number of studies STI, GMP and MP indices were reported as indices of choice for identification of stress tolerant wheat cultivars [33,34,35]. Interaction between TOL and grain yield under HN conditions from this study showed moderate positive correlation. Different studies on wheat [25,36,37,38] found similar results under HN conditions. However, these studies observed significant negative correlation between yield under stressful conditions and TOL, while in our case that correlation was insignificant.
The grain yield and grain protein content of the wheat cultivars under nonstress and stress N conditions were apparently associated with the genetic structure of the cultivars. Significant differences were found between and among the cultivars, irrespective of the N conditions. Three-dimensional diagrams for the grain yield (Supplementary Figure S1) and grain protein content (Supplementary Figure S2) highlighted the cultivars with the highest values of grain yield or grain protein content, along with the highest MP, GMP, HM, STI and YI values. As such, they can be denoted as LN-tolerant cultivars.
The classification of cultivars according to their performances under stress and nonstress conditions was described in the study by Fernandez et al. [7]. Cultivars expressing uniform and high performances in both stress and nonstress conditions belong to group A; cultivars that expresses high performances only in conditions with an optimal amount of nitrogen and not under stress conditions are in group B. Cultivars that performs better in stress conditions than in nonstress conditions are in group C, and cultivars whose performances in grain yield and quality parameters are low in the stress and optimal conditions belong to group D. Ideal stress selection indices should clearly distinguish these groups. According to the results from Table 3 and Table 4, none of the studied cultivars belonged to group C in terms of the yield and grain protein contents. In our study, cultivars with a STI higher than 1 were placed in group A for the grain yield and grain protein contents. These cultivars had higher performances under stress conditions than the average performances of all the cultivars under the optimal conditions. The cultivars that belonged to group D were easily identified by 3D diagram, as they had the lowest performances in both conditions and the lowest STI. The biggest challenge was to identify the cultivars in group B.
Fernandez [7] noted that SSI and TOL cannot differentiate groups A and C while MP cannot differentiate groups A and B. STI have same drawback as MP, but it is better in distinguishing A and B than GMP and MP. As it is described in study of Thiry et al. [39], SSI and TOL can distinguish stress tolerant and stress susceptible cultivars, while GMP, HM and MP relies on high performance, therefore these five indices have been divided into two groups PCI (production capacity indices STI, GMP, MP) and RCI (resilience capacity indices SSI, TOL). SSI and TOL classify cultivars only based on reduction of yield performance under stress conditions [9]. Zhao et al. [27] points out that cultivar selection based only on GMP and MP is partial and could lead to errors, because these cultivars show average performance of grain yield under different nitrogen levels. Combined use of STI with GMP and MP improves cultivar selection.
Based on results from our study we cannot unequivocally separate a unique index as superior for application in a breeding program. Thus, we suggest selection based on combination of several stress tolerance indices such as mean productivity index (MP), geometric mean productivity index (GMP), harmonic mean index (HM), stress tolerance index (STI), and yield index (YI) combination.
As suggested by Brancourt-Hulmel et al. [40] and Cormier et al. [26] breeding programs targeting to produce N-efficient cultivars for low-input environments should include testing and selection at low-input conditions to maximize selection gains for grain yield. Complementary approach pointed out by Przystalski et al. [41] suggests combining information from both organic (low input) and non-organic (high input) experiments to optimize the selection of wheat cultivars for organic farming systems and Hitz et al. [42] indicated that selection at low N is necessary to identify high NUE genotypes. Contrary, Annicchiarico et al. [43] found no clear advantage when targeting organic production of direct selection for grain yield in organic systems relative to indirect selection in conventional systems. This implies that there is no clear-cut recommendation which approach is superior and individual breeding strategies under low N environments should be adjusted according to the regional agro-ecological conditions.

5. Conclusions

In this study 48 winter wheat cultivars were evaluated under high-nitrogen (HN) and low-nitrogen (LN) conditions. We determined Sofru, BC Opsesija and MV-Nemere as the most tolerant cultivars for the grain yield in low-nitrogen conditions based on five selection indices (the MP, GMP, HM, STI and YI) and potentially useful as parental donors. For the same indices, in terms of the grain protein content, cultivars U-1, OS-Olimpija, Forcali, Viktoria and BC Tena were selected as the most tolerant under low-nitrogen conditions. In consideration of three other indices (the TOL, YSI and RSI), cultivars Katarina and Ficko were denoted as LN-tolerant cultivars in terms of the grain yield and cultivars Isengrain, Tosunbey, Vulkan and BC Darija in terms of the grain protein content. Our results showed that the MP, GMP, HM, STI and YI could be used in the identification of cultivars that give high yields and high-quality grain in conditions with and without a sufficient amount of nitrogen. The TOL, YSI and RSI showed weak or no correlations with the yield and grain protein content performance under stress and optimal conditions. Cultivar evaluation based on stress tolerance indices can be useful for wheat breeders, as they can track cultivar performances under stress conditions. Additionally, tolerant cultivars could be used for developing new high-yielding cultivars in stress conditions.

Supplementary Materials

The following are available online at https://www.mdpi.com/article/10.3390/agronomy11081544/s1, Figure S1. 3D diagrams for the stress screening indices and grain yield under HN (Yp) and LN (Ys) treatments of winter wheat cultivars, Figure S2. 3D diagrams for the stress screening indices and grain protein content under HN (Yp) and LN (Ys) treatments of winter wheat cultivars. Table S1. Correlation Coefficients with Significance Level for Grain Yield and Stress Screening Indices, Table S2. Correlation Coefficients with Significance Level for Grain Protein Content and Stress Screening Indices.

Author Contributions

Conceptualization, D.N., B.P. and K.D.; methodology, D.N., S.G., K.D., L.A., M.I. and I.P.; software, D.N.; validation, D.N. and S.G.; formal analysis, M.I., D.N. and I.P.; investigation, M.I., I.P., L.A. and K.D.; resources, D.N.; data curation, M.I. and I.P.; writing—original draft preparation, M.I.; writing—review and editing, S.G., D.N., B.P., L.A. and K.D.; visualization, D.N. and M.I.; supervision, D.N. and S.G.; project administration, D.N. and funding acquisition, D.N. All authors have read and agreed to the published version of the manuscript.

Funding

This research was funded by the Croatian Science Foundation, grant number IP-2016-06-2178, and partly by a grant of the EU project K.K. 01.1.1.01.0005 Biodiversity and Molecular Plant Breeding, Centre of Excellence for Biodiversity and Molecular Plant Breeding (CoE CroP-BioDiv), Zagreb, Croatia.

Institutional Review Board Statement

Not applicable.

Informed Consent Statement

Not applicable.

Data Availability Statement

The data presented in this study are available upon request from the corresponding author.

Conflicts of Interest

The authors declare no conflict of interest.

References

  1. Gull, A.; Lone, A.A.; Islam Wani, N.U. Biotic and abiotic stresses in plants. In Abiotic and Biotic Stress in Plants; de Oliveira, A.B., Ed.; IntechOpen: London, UK, 2019; pp. 1–6. [Google Scholar]
  2. Ma, G.; Liu, W.; Li, S.; Zhang, P.; Wang, C.; Lu, H.; Wang, L.; Xie, Y.; Ma, D.; Kang, G. Determining the optimal N input to improve grain yield and quality in winter wheat with reduced apparent N loss in the North China Plain. Front. Plant Sci. 2019, 10, 181. [Google Scholar] [CrossRef] [PubMed] [Green Version]
  3. Conley, D.J.; Paerl, H.W.; Howarth, R.W. Controlling eutrophication: Nitrogen and phosphorus. Science 2009, 323, 1014–1015. [Google Scholar] [CrossRef]
  4. Clarke, J.M.; Towenley-Smith, T.M.; McCaig, T.N.; Green, D.G. Growth analysis of spring wheat cultivars of varying drought resistance. Crop Sci. 1984, 24, 537–541. [Google Scholar] [CrossRef]
  5. Tyagi, B.S.; Foulkes, J.; Singh, G.; Sareen, S.; Kumar, P.; Broadley, M.R.; Gupta, V.; Krishnappa, G.; Ojha, A.; Khokhar, J.S.; et al. Identification of wheat cultivars for low nitrogen tolerance using multivariable screening approaches. Agronomy 2020, 10, 417. [Google Scholar] [CrossRef] [Green Version]
  6. Rosielle, A.A.; Hamblin, J. Theoretical aspects of selection for yield in stress and non-stress environment. Crop Sci. 1981, 21, 943–946. [Google Scholar] [CrossRef]
  7. Fernandez, G.C.J. Effective selection criteria for assessing stress tolerance. In Proceedings of the International Symposium on Adaptation of Food Crops to Temperature and Water Stress, Taipei, Taiwan, 13–18 August 1992; Asian Vegetable Research and Development Center: Taipei, Taiwan, 1993; Volume 410, pp. 257–270. [Google Scholar]
  8. Fischer, R.A.; Maurer, R. Drought resistance in spring wheat cultivars, I. Grain yield responses. Aust. J. Agric. Res. 1978, 29, 897–912. [Google Scholar] [CrossRef]
  9. Fischer, R.A.; Wood, T. Drought resistance in spring wheat cultivars, III. Yield association with morpho-physiological traits. Aust. J. Agric. Res. 1979, 30, 1001–1020. [Google Scholar] [CrossRef]
  10. Farshadfar, E.; Mohammadi, R.; Farshadfar, M.; Dabiri, S. Relationships and repeatability of drought tolerance indices in wheat-rye disomic addition lines. Aust. J. Crop Sci. 2013, 7, 130–138. [Google Scholar]
  11. Bouslama, M.; Schapaugh, W.T. Stress tolerance in soybean, Part 1: Evaluation of three screening techniques for heat and drought tolerance. Crop Sci. 1984, 24, 933–937. [Google Scholar] [CrossRef]
  12. Gavuzzi, P.; Rizza, F.; Palumbo, M.; Campaline, R.G.; Ricciardi, G.L.; Borghi, B. Evaluation of field and laboratory predictors of drought and heat tolerance in winter cereals. Can. J. Plant Sci. 1997, 77, 523–531. [Google Scholar] [CrossRef]
  13. Pour-Aboughadareh, A.; Yousefian, M.; Moradkhani, H.; Moghaddam Vahed, M.; Poczai, P.P.; Siddique, K.H.M. iPASTIC: An online toolkit to estimate plant abiotic stress indices. Appl. Plant Sci. 2019, 7, e11278. [Google Scholar] [CrossRef] [Green Version]
  14. Kharel, T.P.; Clay, D.E.; Clay, S.A.; Beck, D.; Reese, C.; Carlson, G.; Park, H. Nitrogen and water stress affect winter wheat yield and dough quality. Agron. J. 2011, 103, 1389–1396. [Google Scholar] [CrossRef] [Green Version]
  15. Aula, L.; Omara, P.; Eickhoff, E.; Oyebiyi, F.; Dhillon, J.S.; Raun, W.R. Effect of winter wheat cultivar on grain yield trend under different nitrogen management. Agrosyst. Geosci. Environ. 2020, 3, e20017. [Google Scholar] [CrossRef]
  16. Lestari, A.P.; Sopandie, D.; Aswidinnoor, H. Estimation for stress tolerance indices of rice genotypes in low nitrogen conditions. Thai J. Agric. Sci. 2019, 52, 180–190. [Google Scholar]
  17. Rameeh, V. Nitrogen deficiency stress indices of seed yield in rapeseed (Brassica napus L.) genotypes. Cercet. Agron. Mold. 2015, 48, 89–96. [Google Scholar] [CrossRef] [Green Version]
  18. Zadoks, J.C.; Chang, T.T.; Konzak, C.F. A decimal code for the growth stages of cereals. Weed Res. 1974, 14, 415–421. [Google Scholar] [CrossRef]
  19. R Core Team. R: A Language and Environment for Statistical Computing; R Foundation for Statistical Computing: Vienna, Austria, 2020. [Google Scholar]
  20. Abedi, T.; Alemzadeh, A.; Kazemeini, S.A. Wheat yield and grain protein response to nitrogen amount and timing. Aust. J. Crop Sci. 2011, 5, 330–336. [Google Scholar]
  21. Sarcevic, H.; Jukic, K.; Ikic, I.; Lovric, A. Estimation of quantitative genetic parameters for grain yield and quality in winter wheat under high and low nitrogen fertilization. Euphytica 2014, 199, 57–67. [Google Scholar] [CrossRef]
  22. Oury, F.X.; Godin, C. Yield and grain protein concentration in bread wheat: How to use the negative relationship between the two characters to identify favourable genotypes? Euphytica 2007, 157, 45–57. [Google Scholar] [CrossRef]
  23. Bogard, M.; Allard, V.; Brancourt-Hulmel, M.; Heumez, E.; Machet, J.-M.; Jeuffroy, M.-H.; Gate, P.; Martre, P.; Le Gouis, J. Deviation from the grain protein concentration–grain yield negative relationship is highly correlated to post-anthesis N uptake in winter wheat. J. Exp. Bot. 2010, 61, 4303–4312. [Google Scholar] [CrossRef] [Green Version]
  24. Taulemesse, F.; Le Gouis, J.; Gouache, D.; Gibon, Y.; Allard, V. Bread Wheat (Triticum aestivum L.) Grain protein concentration is related to early post-flowering nitrate uptake under putative control of plant satiety level. PLoS ONE 2016, 11, e0149668. [Google Scholar] [CrossRef] [Green Version]
  25. Blanco, A.; Mangini, G.; Giancaspro, A.; Give, S.; Colasuonno, P.; Simeone, R.; Signorile, A.; De Vita, P.; Mastrangelo, A.M.; Cattivelli, L.; et al. Relationships between grain protein content and grain yield components through quantitative trait locus analyses in a recombinant inbred line population derived from two elite durum wheat cultivars. Mol. Breed. 2012, 30, 79–92. [Google Scholar] [CrossRef]
  26. Cormier, F.; Faure, S.; Dubreuil, P.; Heumez, E.; Beauchene, K.; Lafarge, S.; Praud, S.; LeGouis, J. A multi-environmental study of recent breeding progress on nitrogen use efficiency in wheat (Triticum aestivum L.). Theor. Appl. Genet. 2013, 126, 3035–3048. [Google Scholar] [CrossRef]
  27. Zhao, Z.; He, K.; Feng, Z.; Li, Y.; Chang, L.; Zhang, X.; Xu, S.; Liu, J.; Xue, J. Evaluation of yield-based low nitrogen tolerance indices for screening maize (Zea mays L.) inbred lines. Agronomy 2019, 9, 240. [Google Scholar] [CrossRef] [Green Version]
  28. Khan, A.A.; Kabir, M.R. Evaluation of spring wheat genotypes (Triticum aestivum L.) for heat stress tolerance using different stress tolerance indices. Cercet. Agron. Mold. 2014, 47, 49–63. [Google Scholar] [CrossRef] [Green Version]
  29. Sio-Se Mardeh, A.; Rafeie, H.; Poustini, K.; Mohammadi, V. Evaluation of drought resistance indices under various environmental conditions. Field Crop. Res. 2006, 98, 222–229. [Google Scholar] [CrossRef]
  30. Dehghani, G.H.; Malekshhi, F.; Alizadeh, B. A study of drought tolerance indices in canola (Brassica napus L.) genotypes. J. Water Soil Sci. 2009, 13, 77–90. [Google Scholar]
  31. Jafari, B.; Paknejad, F.; Alahmadi, M.J. Evaluation of selection indices for drought tolerance of corn (Zea mays L.) hybrids. Int. J. Plant Prod. 2009, 3, 33–38. [Google Scholar]
  32. Lyra, D.H.; de Freitas Mendonça, L.; Galli, G.; Alves, F.C.; Granato, Í.S.C.; Fritsche-Neto, R. Multi-trait genomic prediction for nitrogen response indices in tropical maize hybrids. Mol. Breed. 2017, 37, 80. [Google Scholar] [CrossRef]
  33. Sareen, S.; Tyagi, B.S.; Tiwari, V.; Sharma, I. Response estimation of wheat synthetic lines to terminal heat stress using stress indices. J. Agric. Sci. 2012, 4, 97–104. [Google Scholar] [CrossRef] [Green Version]
  34. Mohammadi, M.; Karimizadeh, R.; Abdipour, M. Evaluation of drought tolerance in bread wheat genotypes under dryland and supplemental irrigation conditions. Aust. J. Crop Sci. 2011, 5, 487–493. [Google Scholar]
  35. Khan, F.U.; Mohammad, F. Application of stress selection indices for assessment of nitrogen tolerance in wheat (Triticum aestivum L.). J. Anim. Plant Sci. 2016, 26, 201–210. [Google Scholar]
  36. Singh, G.; Singh, M.K.; Tyagi, B.S.; Singh, J.B.; Kumar, P. Germplasm characterization and selection indices in bread wheat for waterlogged soils in India. Indian J. Agric. Sci. 2017, 87, 1139–1148. [Google Scholar]
  37. Clarke, J.M.; DePauw, R.M.; Townley-Smith, T.F. Evaluation of methods for quantification of drought tolerance in wheat. Crop Sci. 1992, 32, 723–728. [Google Scholar] [CrossRef]
  38. Mohammadi, R. Efficiency of yield-based drought tolerance indices to identify tolerant genotypes in durum wheat. Euphytica 2016, 211, 71–89. [Google Scholar] [CrossRef]
  39. Thiry, A.A.; Chavez-Dulanto, P.N.; Reynolds, M.P.; Davies, W.J. How can we improve crop genotypes to increase stress resilience and productivity in a future climate? A new crop screening method based on productivity and resistance to abiotic stress. J. Exp. Bot. 2016, 67, 5593–5603. [Google Scholar] [CrossRef] [PubMed]
  40. Brancourt-Hulmel, M.; Heumez, E.; Pluchard, P.; Beghin, D.; Depatureaux, C.; Giraud, A.; Le Gouis, J. Indirect versus direct selection of winter wheat for low-input or high-input levels. Crop Sci. 2005, 45, 1427–1431. [Google Scholar] [CrossRef]
  41. Przystalski, M.; Osman, A.; Thiemt, E.M.; Rolland, B.; Ericson, L.; Ostergard, H.; Levy, L.; Wolfe, M.; Buchse, A.; Piepho, H.-P.; et al. Comparing the performance of cereal varieties in organic and non-organic cropping systems in different European countries. Euphytica 2008, 163, 417–433. [Google Scholar] [CrossRef]
  42. Hitz, K.; Clark, A.J.; Van Sanford, D.A. Identifying nitrogen-use efficient soft red winter wheat lines in high and low nitrogen environments. Field Crop. Res. 2016, 200, 1–9. [Google Scholar] [CrossRef] [Green Version]
  43. Annicchiarico, P.; Chiapparino, E.; Perenzin, M. Response of common wheat varieties to organic and conventional production systems across Italian locations, and implications for selection. Field Crop. Res. 2010, 116, 230–238. [Google Scholar] [CrossRef]
Figure 1. Correlation coefficients (r) and correlogram for the grain yield and stress screening indices. Ns—not significant, *, ** and ***—significant at the level of probability p < 0.05, 0.01 and 0.001, respectively.
Agronomy 11 01544 g001
Figure 2. Correlation coefficients (r) and correlogram for the grain protein content and stress screening indices. ns—not significant, *, ** and ***—significant at the level of probability p < 0.05, 0.01 and 0.001, respectively.
Agronomy 11 01544 g002
Figure 3. PCA biplot for the yield based on the first (PC1) and the second (PC2) principal component for the wheat cultivars (G1–G48) and different screening indices.
Agronomy 11 01544 g003
Figure 4. PCA biplot for the grain protein content based on the first (PC1) and the second (PC2) principal components for the wheat cultivars (G1–G48) and different stress tolerance indices.
Agronomy 11 01544 g004
Table 1. Summary of the ANOVA (significance of the F-test) for the grain yield and stress screening indices.
Source of VariationdfF-Test
YpYsTOLMPGMPHMSSISTIYIYSIRSI
Cultivar (G)4716.10 ***10.97 ***1.02 ns25.09 ***21.42 ***18.98 ***0.90 ns18.17 ***12.29 ***0.89 ns0.99 ns
Location (L)2383.69 ***337.96 ***1.05 ns697.00 ***613.61 ***556.62 ***1.99 ns1.60 ns0.00 ns2.37 ns1.90 ns
Year (Y)121.64 ***17.07 ***39.70 ***0.06 ns0.19 ns0.27 ns2.96 ns36.17 ***0.00 ns47.34 ***2.61 ns
G × L942.34 ***1.98 ***1.55 **2.71 ***2.45 ***2.28 ***0.76 ns2.13 ***2.12 ***1.25 ns1.52 **
G × Y472.77 ***1.61 **1.06 ns3.21 ***2.89 ***2.68 ***0.88 ns2.93 ***1.77 **0.98 ns1.15 ns
L × Y2380.79 ***362.14 ***33.87 ***687.88 ***605.04 ***549.61 ***1.71 ns26.69 ***0.00 ns26.36 ***2.18 ns
G × L × Y941.71 ***1.05 ns1.08 ns1.63 ***1.53 **1.46 **0.76 ns1.55 **1.27 ns0.94 ns1.09 ns
df—degrees of freedom, ns—not significant, ** and ***—significant at the levels of probability of p < 0.01 and 0.001, respectively, Yp—grain yield under HN, Ys—grain yield under LN, TOL—tolerance index, MP—mean productivity index, GMP—geometric mean productivity index, HM—harmonic mean index, SSI—stress susceptibility index, STI—stress tolerance index, YI—yield index, YSI—yield stability index and RSI—relative stress index.
Table 2. Summary of the ANOVA (significance of the F-test) for the grain protein content and stress screening indices.
Source of VariationdfF-test
YpYsTOLMPGMPHMSSISTIYIYSIRSI
Cultivar (G)4723.58 ***14.03 ***1.04 ns35.74 ***34.44 ***32.81 ***0.81 ns33.68 ***21.65 ***0.77 ns1.02 ns
Location (L)278.64 ***423.63 ***109.02 ***435.63 ***450.80 ***459.82 ***0.73 ns139.71 ***0.00 ns139.43 ***0.38 ns
Year (Y)169.59 ***46.41 ***0.21 ns114.00 ***104.36 ***94.37 ***0.61 ns1.39 ns0.00 ns3.01 ns0.37 ns
G × L941.57 **1.15 ns0.90 ns1.77 ***1.74 ***1.70 ***0.85 ns1.75 ***1.67 ***0.84 ns1.12 ns
G × Y472.35 ***1.44 *0.66 ns3.05 ***3.008 ***2.94 ***0.90 ns3.11 ***2.24 ***0.64 ns0.83 ns
L × Y2323.52 ***167.95 ***5.66 **471.48 ***462.18 ***447.69 ***0.59 ns1.21 ns0.00 ns2.34 ns0.38 ns
G × L × Y941.46 **1.01 ns0.76 ns1.65 ***1.61 ***1.56 **0.90 ns1.62 ***1.52 ***0.74 ns0.97 ns
df—degrees of freedom; ns—not significant; *, ** and ***—significant at the level of probability of p < 0.05, 0.01 and 0.001, respectively; Yp—grain yield under HN; Ys—grain yield under LN; TOL—tolerance index; MP—mean productivity index; GMP—geometric mean productivity index; HM—harmonic mean index; SSI—stress susceptibility index; STI—stress tolerance index; YI—yield index; YSI—yield stability index and RSI—relative stress index.
Table 3. BLUP values for the grain yield (kg ha−1) and stress screening index values.
IDCultivar (Country)YpYsTOLMPGMPHMSSISTIYIYSIRSI
G1 Andjelka (HR)6941.116194.57746.546567.846557.226546.631.057950.970061.035740.892450.99344
G2 BC Anica (HR)7006.665990.881015.786498.776478.896459.081.426030.947021.001680.855030.95179
G3 BC Bernarda (HR)6778.285991.64786.646384.966372.836360.731.141560.916271.001810.883950.98398
G4 BC Certissa (HR)6790.605979.79810.816385.206372.316359.461.174500.916120.999830.880600.98025
G5 BC Darija (HR)7109.276251.02858.256680.156666.356652.581.187491.002621.045180.879280.97878
G6 BC Irena (HR)6594.866099.28495.586347.076342.236337.400.739180.907491.019810.924851.02952
G7 BC Irma (HR)7117.936512.12605.816815.036808.296801.560.837191.045771.088840.914891.01842
G8 BC Lorena (HR)6903.156131.43771.726517.296505.866494.441.099650.954921.025180.888210.98872
G9 BC Ljepotica (HR)7344.926567.44777.486956.186945.316934.461.041221.088281.098090.894150.99534
G10 BC Opsesija (HR)7518.066782.22735.847150.147140.677131.210.962761.150371.134000.902121.00421
G11 BC Tena (HR)5526.184998.67527.515262.435255.815249.210.938960.623220.835780.904541.00691
G12 Bezostaja-1 (RUS)5304.384856.67447.715080.535075.595070.660.830240.581210.812040.915601.01921
G13 Bologna (IT)6406.105538.63867.475972.375956.595940.871.331990.800490.926070.864590.96243
G14 Calisol (FR)7295.356362.49932.866828.926812.976797.061.257801.047211.063820.872130.97083
G15 Dropia (RO)6522.515815.02707.496168.776158.616148.481.066960.855710.972280.891530.99242
G16 Felix (HR)6694.465977.96716.506336.216326.076315.951.052790.902880.999520.892970.99403
G17 Ficko (HR)6881.405797.601083.806339.506316.306293.181.549220.900090.969370.842500.93785
G18 Flamura 85 (RO)6140.065874.39265.676007.236005.766004.290.425610.813760.982210.956731.06500
G19 Forcali (FR)6512.555897.41615.146204.986197.356189.730.929100.866510.986060.905551.00802
G20 Galloper (HR)6344.576017.77326.806181.176179.016176.850.506660.861381.006180.948491.05583
G21 Golubica (HR)6312.515589.15723.365950.835939.835928.851.127180.795990.934510.885410.98561
G22 Graindor (FR)6958.806557.02401.786757.916754.926751.940.567931.029441.096340.942261.04890
G23 Isengrain (FR)7265.386593.30672.086929.346921.196913.040.909921.080741.102410.907501.01019
G24 Katarina (HR)7284.976167.001117.976725.996702.726679.531.509541.013591.031130.846540.94234
G25 Kraljica (HR)6930.676292.02638.656611.356603.636595.920.906420.983841.052030.907851.01059
G26 Lukullus (AT)6519.305830.40688.906174.856165.246155.641.039430.857550.974850.894330.99554
G27 Mihelca (HR)6081.405810.19271.215945.805944.255942.700.438680.797170.971470.955401.06352
G28 MV-Nador (HU)6897.896355.60542.296626.756621.206615.650.773310.989081.062670.921381.02565
G29 MV-Nemere (HU)7396.956537.66859.296967.316954.056940.811.142691.091021.093110.883830.98385
G30 OS-Jelena (HR)6541.366050.08491.286295.726290.936286.140.738760.892871.011580.924901.02956
G31 OS-Olimpija (HR)5943.445166.09777.355554.775541.155527.571.286530.692720.863780.869210.96757
G32 OS-Crvenka (HR)6003.605605.16398.445804.385800.965797.540.652820.759210.937190.933631.03929
G33 Prima (HR)7124.686682.94441.746903.816900.286896.740.609881.074221.117400.938001.04415
G34 Rebeka (HR)6718.425726.74991.686222.586202.796183.071.451930.868030.957520.852390.94886
G35 Renan (FR)6555.065974.72580.346264.896258.176251.450.870860.883600.998980.911471.01461
G36 San Pastore (IT)6165.105466.55698.555815.835805.335794.851.114550.760350.914010.886690.98704
G37 Sana (HR)6507.095996.53510.566251.816246.606241.390.771790.880331.002630.921541.02583
G38 Silvija (HR)7118.636290.71827.926704.676691.886679.111.144021.010311.051820.883700.98370
G39 Slavonija (HR)6642.715952.17690.546297.446287.976278.511.022550.892030.995210.896050.99745
G40 Sofru (FR)7721.447013.80707.647367.627359.127350.630.901481.221831.172720.908351.01115
G41 Srpanjka (HR)6843.606035.53808.076439.576426.886414.211.161460.931881.009150.881920.98173
G42 Tika-Taka (HR)7442.886383.051059.836912.976892.626872.341.400671.071841.067260.857600.95466
G43 Tosunbey (TR)6023.585265.59757.995644.595631.855619.141.237800.715580.880410.874160.97309
G44 U-1 (HR)4585.594209.84375.754397.724393.704389.690.806020.435530.703890.918061.02195
G45 Viktoria (HR) 6400.475892.26508.216146.376141.116135.860.781040.850850.985190.920601.02478
G46 Vulkan (HR)7096.326265.05831.276680.696667.746654.831.152261.003041.047530.882860.98277
G47 Waldinger (HR)6847.276114.78732.496481.036470.676460.331.052270.944621.022400.893020.99409
G48 Zlatna dolina (HR)5905.205617.96287.245761.585759.795758.000.478470.748470.939330.951361.05902
Yp—grain yield under HN, Ys—grain yield under LN, TOL—tolerance index, MP—mean productivity index, GMP—geometric mean productivity index, HM—harmonic mean index, SSI—stress susceptibility index, STI—stress tolerance index, YI—yield index, YSI—yield stability index and RSI—relative stress index.
Table 4. BLUP values for the grain protein content (%) and stress screening index values.
IDCultivarYpYsTOLMPGMPHMSSISTIYIYSIRSI
G1Andjelka (HR)12.1910.71.4911.44511.420711.39650.876930.772980.957120.877771.01993
G2BC Anica (HR)12.4811.011.4711.74511.72211.6990.845050.81430.984850.882211.0251
G3BC Bernarda (HR)12.6711.131.5411.911.875111.85020.872020.835710.995580.878451.02073
G4BC Certissa (HR)10.768.652.119.7059.647499.590311.406860.551580.773750.80390.9341
G5BC Darija (HR)12.2811.171.1111.72511.711911.69870.648490.812890.999160.909611.05693
G6BC Irena (HR)13.0810.762.3211.9211.863411.80711.272510.834070.962490.822630.95586
G7BC Irma (HR)13.1110.742.3711.92511.86611.80721.296960.834430.96070.819220.9519
G8BC Lorena (HR)13.0411.081.9612.0612.020111.98041.078350.856250.991110.849690.98731
G9BC Ljepotica (HR)11.439.981.4510.70510.680410.65590.910130.676020.892720.873141.01456
G10BC Opsesija (HR)11.499.891.610.6910.6610.63010.999030.673440.884660.860751.00016
G11BC Tena (HR)15.2313.12.1314.16514.124914.08491.003371.182371.17180.860140.99945
G12Bezostaja-1 (RUS)14.73131.7313.86513.83813.8110.84261.134821.162860.882551.02549
G13Bologna (IT)12.6611.051.6111.85511.827611.80030.912370.829040.988430.872831.01419
G14Calisol (FR)10.878.692.189.789.719079.658521.438820.55980.777320.799450.92893
G15Dropia (RO)13.9312.331.613.1313.105613.08130.824041.017881.102920.885141.0285
G16Felix (HR)13.4312.041.3912.73512.71612.69710.742540.958261.076980.89651.0417
G17Ficko (HR)13.6111.52.1112.55512.510612.46631.112260.927551.028680.844970.98182
G18Flamura 85 (RO)13.2511.61.6512.42512.397612.37020.893410.910871.037630.875471.01726
G19Forcali (FR)15.5813.042.5414.3114.253514.19731.169631.2041.166430.836970.97253
G20Galloper (HR)11.559.811.7410.6810.644510.60911.080810.671480.877510.849350.98691
G21Golubica (HR)15.7912.123.6713.95513.833813.71371.66751.134141.084140.767570.89189
G22Graindor (FR)10.928.892.039.9059.852869.800991.333690.575320.795210.81410.94596
G23Isengrain (FR)10.379.580.799.9759.967189.959360.546550.588740.856940.923821.07344
G24Katarina (HR)12.5110.861.6511.68511.655811.62680.946250.805140.971430.868111.0087
G25Kraljica (HR)14.4812.571.9113.52513.491213.45760.946341.078661.124390.868091.00869
G26Lukullus (AT)14.1612.491.6713.32513.298813.27270.846121.048111.117240.882061.02492
G27Mihelca (HR)12.5110.681.8311.59511.558811.52281.049480.791790.955330.853720.99199
G28MV-Nador (HU)12.7510.192.5611.4711.398411.32721.440490.769960.91150.799220.92866
G29MV-Nemere (HU)12.0110.51.5111.25511.229611.20440.902020.747330.939230.874271.01587
G30OS-Jelena (HR)12.8110.841.9711.82511.783911.7431.103310.822920.969640.846210.98327
G31OS-Olimpija (HR)16.7214.52.2215.6115.570515.53110.952571.436771.297030.867221.00768
G32OS-Crvenka (HR)15.212.962.2414.0814.035413.99091.057271.167431.159280.852630.99072
G33Prima (HR)10.919.361.5510.13510.105310.07571.019270.605180.837260.857930.99688
G34Rebeka (HR)12.4811.041.4411.7611.737911.71590.827810.816520.987530.884621.02789
G35Renan (FR)13.711.791.9112.74512.709212.67341.000220.957231.054620.860580.99997
G36San Pastore (IT)13.611.222.3812.4112.352812.29591.255510.90431.003630.8250.95862
G37Sana (HR)10.959.321.6310.13510.102210.06951.067960.60480.833680.851140.98899
G38Silvija (HR)12.6411.271.3711.95511.935411.91580.77760.844211.008110.891611.03602
G39Slavonija (HR)12.9311.311.6212.1212.092912.06590.898870.866651.011680.874711.01638
G40Sofru (FR)10.349.081.269.719.689549.669120.874240.55640.812210.878141.02037
G41Srpanjka (HR)13.4311.422.0112.42512.384312.34371.073740.908921.021520.850340.98806
G42Tika-Taka (HR)11.9410.531.4111.23511.212911.19080.847220.74510.941910.881911.02474
G43Tosunbey (TR)12.9911.99112.4912.4812.470.55230.923021.072510.923021.07251
G44U-1 (HR)17.1314.52.6315.81515.760215.70571.101491.4721.297030.846470.98356
G45Viktoria (HR) 15.3913.072.3214.2314.182614.13541.081511.192051.169120.849250.9868
G46Vulkan (HR)12.5711.561.0112.06512.054412.04390.576460.861141.034050.919651.0686
G47Waldinger (HR)12.3610.741.6211.5511.521611.49320.940320.786690.96070.868931.00967
G48Zlatna dolina (HR)12.5610.961.611.7611.732811.70560.913930.81580.980380.872611.01394
Yp—grain yield under HN, Ys—grain yield under LN, TOL—tolerance index, MP—mean productivity index, GMP—geometric mean productivity index, HM—harmonic mean index, SSI—stress susceptibility index, STI—stress tolerance index, YI—yield index, YSI—yield stability index and RSI—relative stress index.
Table 5. Correlation coefficients (r) for the grain yield and grain protein content (GPC) in stress and nonstress conditions.
Yp(Grain Yield)Ys(Grain Yield)
Yp(GPC)−0.70 **−0.74 **
Ys(GPC)−0.67 **−0.74 **
** —significant at the level of probability of p < 0.01.
Publisher’s Note: MDPI stays neutral with regard to jurisdictional claims in published maps and institutional affiliations.

