Article

Reducing and Delaying Nitrogen Recommended by Leaf Critical SPAD Value Was More Suitable for Nitrogen Utilization of Spring Wheat under a New Type of Drip-Irrigated System

The Key Laboratory of Oasis Eco-Agriculture, Xinjiang Production and Construction Corps, Shihezi University, Shihezi 832003, China
*
Author to whom correspondence should be addressed.
These authors contributed equally to this work.
Agronomy 2022, 12(10), 2331; https://doi.org/10.3390/agronomy12102331
Submission received: 2 September 2022 / Revised: 23 September 2022 / Accepted: 25 September 2022 / Published: 28 September 2022
(This article belongs to the Special Issue Crop Yield Formation and Fertilization Management)

Abstract

:
Timely and accurate judgment of the nitrogen nutritional status of crops is the key to develop an optimal nitrogen application strategy. However, the evaluation criteria of nitrogen nutrition and nitrogen application strategies at each growth stage of wheat are not clear for the new type of drip-irrigated spring wheat system, TR6S (where one drip tube serves six rows of wheat, with a row spacing (RS) of 10 cm, inter-block space (IBS) of 25 cm and the lateral spacing (LS) of 80 cm, which achieved a lower drip-tube input and higher profit compared with the traditional planting system in Xinjiang). Therefore, we studied the recommendation mechanism of nitrogen fertilizer in different growth stages of wheat based on the critical SPAD values of leaves under TR6S. We set four nitrogen treatments (N1 (300 kg ha−1), N2 (270 kg ha−1), N3 (240 kg ha−1) and N4 (0 kg ha−1)) during two spring wheat growth seasons. The results revealed that the correlation coefficient (r2) between SPAD (soil plant analysis development) value and plant nitrogen content in the middle of first top leaf (L1-M) of wheat was higher than that in other leaf types and leaf positions under TR6S. A quadratic function relationship existed between a SPAD value of L1-M and grain yield. The critical SPAD values at the jointing, booting, anthesis, early milk, and late milk stages were 37.34, 39.40, 42.25, 45.57, and 35.91, respectively. In addition, through the establishment of the nitrogen application recommendation model for various wheat growth stages based on the critical SPAD value, the recommended optimal nitrogen application rates at jointing, booting, anthesis, early milk, and late milk stages were observed to be 69.4, 80.0, 90.8, 44.0, and 6.0 kg ha−1, respectively. This recommended nitrogen application strategy exhibited a better parallel relationship with the nitrogen nutrition index (NNI) of each growth period than the conventional nitrogen application strategy. Therefore, it was more in line with the actual absorption and utilization of nitrogen in wheat of TR6S. In conclusion, the SPAD values of L1-M could be relatively more accurate to evaluate the nitrogen nutrition status of wheat. Compared to traditional nitrogen application strategy, reducing and delaying nitrogen application, recommended based on the leaf SPAD model, was more suitable for nitrogen utilization under TR6S. The results can be applied in other arid and semiarid regions.

1. Introduction

Wheat (Triticum aestivum L.) is one of the three major grain crops in the world and is the main grain crop in arid and semiarid areas [1,2,3]. The Xinjiang Uygur Autonomous Region is a typical arid and semiarid area, exhibiting considerable evapotranspiration and scarce rainfall [4]. To cope with the shortage of water resources in wheat production, drip irrigation technology with high efficiency of water and fertilizer use has been widely applied for wheat cultivation [1,3,5,6]. However, with the continuous increase of wheat yield per unit area, the amount of nitrogen fertilizer is also increasing year by year [7]. The massive production of nitrogen fertilizers increases not only energy consumption and water pollution but also the production cost [8,9,10]. Therefore, it is of great significance to study the nitrogen nutritional status of wheat plants in real time and develop efficient and scientific monitoring and assessment methods for determining optimal nitrogen application rates and improving nitrogen use efficiency.
The traditional method of total nitrogen measurement (TNM) in plants is difficult to implement for assessing the real-time nitrogen nutrition status of crops because of its complex and prolonged duration of operation [11]. Similar to the most traditional methods for the assessment of nitrogen nutrition in crops, the TNM has been one of the most thoroughly studied methods [12,13,14]. By comparing the total nitrogen content of plants with the critical nitrogen concentration, we can determine whether the plants lack nitrogen [12,13,14,15,16,17]. However, the preparation of samples for the determination of total nitrogen content in plants requires destructive sampling, a long drying process, and rigorous indoor analysis [11,13,14]. Therefore, the TNM cannot provide the nitrogen nutritional status of crops in a timely manner; it is difficult to apply to assess the real-time nitrogen nutrition status of crops, and it is almost impossible to popularize and apply it in actual agricultural production. Previous studies have proposed that the response of nitrate-nitrogen content in plants to nitrogen fertilizer change was much earlier than that of the total nitrogen content in plants [18,19]; therefore, measuring the content of nitrate nitrogen can also reflect the current nitrogen nutritional status of crops [20,21]. However, the method of assessing nitrate-nitrogen content in plants is also time-consuming and laborious, and the timeliness is poor [18,19,20,21]. Therefore, it is not widely used in agricultural production.
Fortunately, because of the significant correlation between chlorophyll and nitrogen concentrations in plant leaf [22], the method of assessing nitrogen nutritional status of crops based on this correlation has been widely accepted and used by researchers [23,24,25]. The relative content of chlorophyll in leaves can be obtained by measuring the ratio of the bands of strong absorption of visible light at 660 nm and strong reflection of near-infrared light at 940 nm by chlorophyll [23,24,25]. Instruments estimating the chlorophyll concentration from plant leaf (SPAD-501 and SPAD-502, named the SPAD chlorophyll meter) have been successfully developed [23], and provide a solid foundation for the rapid and efficient assessment of nitrogen nutritional status of crops [11,24,25]. Some studies have reported the use of the SPAD chlorophyll meter to efficiently assess nitrogen nutrition status of crops [11,23]. However, the use of SPAD value for nitrogen nutrition evaluation in crops is affected by the different types of crop varieties and planting patterns [11,26]. Thus, the nitrogen nutritional status of drip-irrigated single varieties of wheat and planting patterns needs to be quantitatively analyzed. For drip-irrigated wheat in Xinjiang, the use of the SPAD chlorophyll meter in efficient assessment of nitrogen nutrition status of crops has been researched [27]; however, the assessments were conducted based on the traditional drip-irrigated planting patterns (whereby one drip tube serves four rows of wheat, with RS of 15 cm and lateral spacing (LS) of 60 cm), and the cost of drip tubes was high (the system was named TR4; Figure 1a) [1]. To reduce costs, we have successfully developed a new type of drip-irrigated planting system, TR6S (where one drip tube serves six rows of wheat, with RS of 10 cm, IBS of 25 cm, and LS of 80 cm, Figure 1b); it achieved a lower input of drip tubes and higher economic returns than TR4 in 2019 and 2020 [2]. Therefore, it is of great significance to explore the correlation between SPAD value and nitrogen nutritional status of wheat for the precise nitrogen application and sustainable wheat production under the new type of system: TR6S.
Based on TR6S, a two-year field experiment on drip-irrigated wheat was conducted in 2020–2021 and 2021–2022. The objectives of this study were (i) to establish a nitrogen fertilizer recommendation model as per wheat growth stages based on leaf SPAD value, (ii) to calculate the nitrogen application rate at each growth stage of wheat based on the critical SPAD value, and (iii) to evaluate the accuracy of the recommended nitrogen application strategy according to the nitrogen nutrition index (NNI). In view of the high accuracy of SPAD in evaluating nitrogen nutrition at various growth stages of wheat, the results of this study may be quite different from the traditional nitrogen application strategy (based on the planting experience of farmers). Therefore, the results could provide insights into the use of TR6S for nitrogen nutrition status assessment and scientific nitrogen management in various wheat growth seasons.

2. Materials and Methods

2.1. Experimental Conditions

A two-year field experiment was performed in 2021 and 2022 in the experimental farm of Shihezi University in Shihezi City, Xinjiang Uygur Autonomous Region, China (44°21′ N, 86°04′ E, altitude of 450 m). The experimental farm is located in the inland, far from the sea with high evapotranspiration and low rainfall, in a typical arid and semiarid region. Here, the annual rainfall is only one-tenth of evapotranspiration. The soil type is light loam, and its physicochemical properties are given in Table 1.

2.2. Experimental Design

Four nitrogen treatments N1, N2, N3, and N4 (300, 270, 240, and 0 kg ha−1, respectively), were set up. Each treatment was divided into three replicates, and a total of 12 experimental plots were set up. The area of a single experimental plot was 30 m2 (5 m × 6 m). Spring wheat variety XC 39 (Triticum aestivum L. Xinchun 39) was selected as the test material. The traditional planting pattern of TR4 with low income from grain versus the high consumption of drip tubes, since one drip tube usually could serve only four rows of wheat plants (TR4, drip tube to row number ratio of four, row space of 15 cm) [1]. In our previous studies, we suggested more profitable irrigation systems with enlarged lateral space (ELS) which gained a similar yield to TR4, one tube serving six wheat rows by shortening row space to 10 cm (TR6S) (one drip tube serves 6 rows of wheat, with a RS of 10 cm, IBS of 25 cm, and LS of 80 cm; Figure 1b) [2]. TR6S was used as the wheat planting pattern. Each plot was equipped with a precision water meter and small fertilizer pot for precise irrigation and fertilization (Figure S1). The irrigation amount during the whole growth period was 4500 m3 ha−1, and the irrigation and nitrogen application strategies in each growth period were followed as per previous studies [1,2]. The planting density was followed as per previous studies and locally recommended protocols [28,29]. A precision wheat seeder (JB/T 6274.1-2013, 2BFX-12, China) was used for simultaneous sowing and laying drip tubes. A dose of 105 kg ha−1 P2O5 and K2O was applied to the soil before sowing. Other field management measures were performed according to the requirements of local wheat high-grain yield cultivation techniques [1,28,29]. Weeds and pests in the field were cleared and controlled during the experiment.

2.3. Sampling and Measurements

2.3.1. The SPAD Values of Wheat Leaves

At the jointing, booting, anthesis, early milk, and late milk stages of spring wheat, nine wheat plants (three wheat plants were randomly selected in each row (R1, R2 and R3)) were selected as the test plants from the experimental plots with different treatments. The SPAD values of first top leaf (L1), second top leaf (L2), third top leaf (L3), and fourth top leaf (L4) were measured using SPAD-502 plus (SPAD-502PLUS, Konica Minolta Inc., Tokyo, Japan) (Figure S2A). In addition, we measured the SPAD values of the leaf base (LB, 30% distance from the leaf base), leaf middle (LM, 30–60% distance from the leaf base), and leaf tip (LT, more than 60% distance from the leaf base) for each leaf (Figure S2B). Then, according to Shi’s method, we established the assessment model of topdressing based on the critical SPAD value [27].
N F R = H Y N + a / b S P A D / b
NFR represents the amount of nitrogen topdressing (kg ha−1) at each growth stage; HYN represents the theoretical nitrogen application rate (kg ha−1) at the whole growth stage of wheat with the highest grain yield; b is the regression coefficient of the linear equation between SPAD value and nitrogen application at each growth stage; a is the equation intercept of the linear equation between SPAD value and nitrogen application at each growth stage.

2.3.2. N Accumulation and NNI

In synchronization with SPAD determination time, nine wheat plants were randomly selected from the experimental fields with different treatments at the jointing, booting, anthesis, early milk, and late milk stages of spring wheat. Various plant organs of spring wheat samples were separated, placed in an oven at 105 °C for 30 min, and further dried at 85 °C till a constant weight was obtained; this weight was measured. Dried plant samples were pulverized using a small pulverizer and sieved. Nitrogen content (%) in each plant organ of each sample was determined using a Buchi K-375 automatic Kjeldahl nitrogen analyzer (BUCHI Labortechnik AG, Flavell, Switzerland) at the Analysis and Testing Center of Shihezi University. Nitrogen content in each organ was calculated by multiplying the nitrogen concentration in each organ with the dry weight of each organ [30]. The nitrogen content in the plant was the summation of nitrogen content in each organ [30].
The NNI can accurately quantify the nitrogen nutritional status of crops [13]; therefore, it was used as an index for recommending nitrogen application fertilization strategy as per growth stages in this experience. When NNI is <1, it indicates that the absorbed nitrogen content in crops is insufficient, and the nitrogen application rate is too low. When NNI is 1, it indicates that the nitrogen absorption in the crop and nitrogen application rate are appropriate. When NNI is >1, it indicates that the nitrogen application rate is too high [13,14]. The NNI was calculated using Equation (2) [13,14].
N N I = N t / N c
where Nt is the measured value of nitrogen concentration in aboveground plant. Nc is the nitrogen concentration (%) of the aboveground plant according to the power function of critical nitrogen concentration of spring wheat under drip irrigation in Xinjiang. (Nc = 5.03 × W−0.38, R2 = 0.95). W is the dry weight of aboveground plants.

2.3.3. Grain Yield

In the mature period of spring wheat, three points with uniform growth were selected in each replicate of each treatment, and 1 m2 (1 m × 1 m) of wheat was harvested (using a small thresher for threshing) for grain yield measurement (kg ha−1).

2.4. Statistical Analysis

Excel 2018 was used for data statistics and collation. All data were analyzed using SPSS 16.0 for one-way analysis of variance (SPSS Inc., Chicago, IL, USA). All charts were generated using Origin 9 software (Systat Software, Inc., San Jose, CA, USA).

3. Results and Discussion

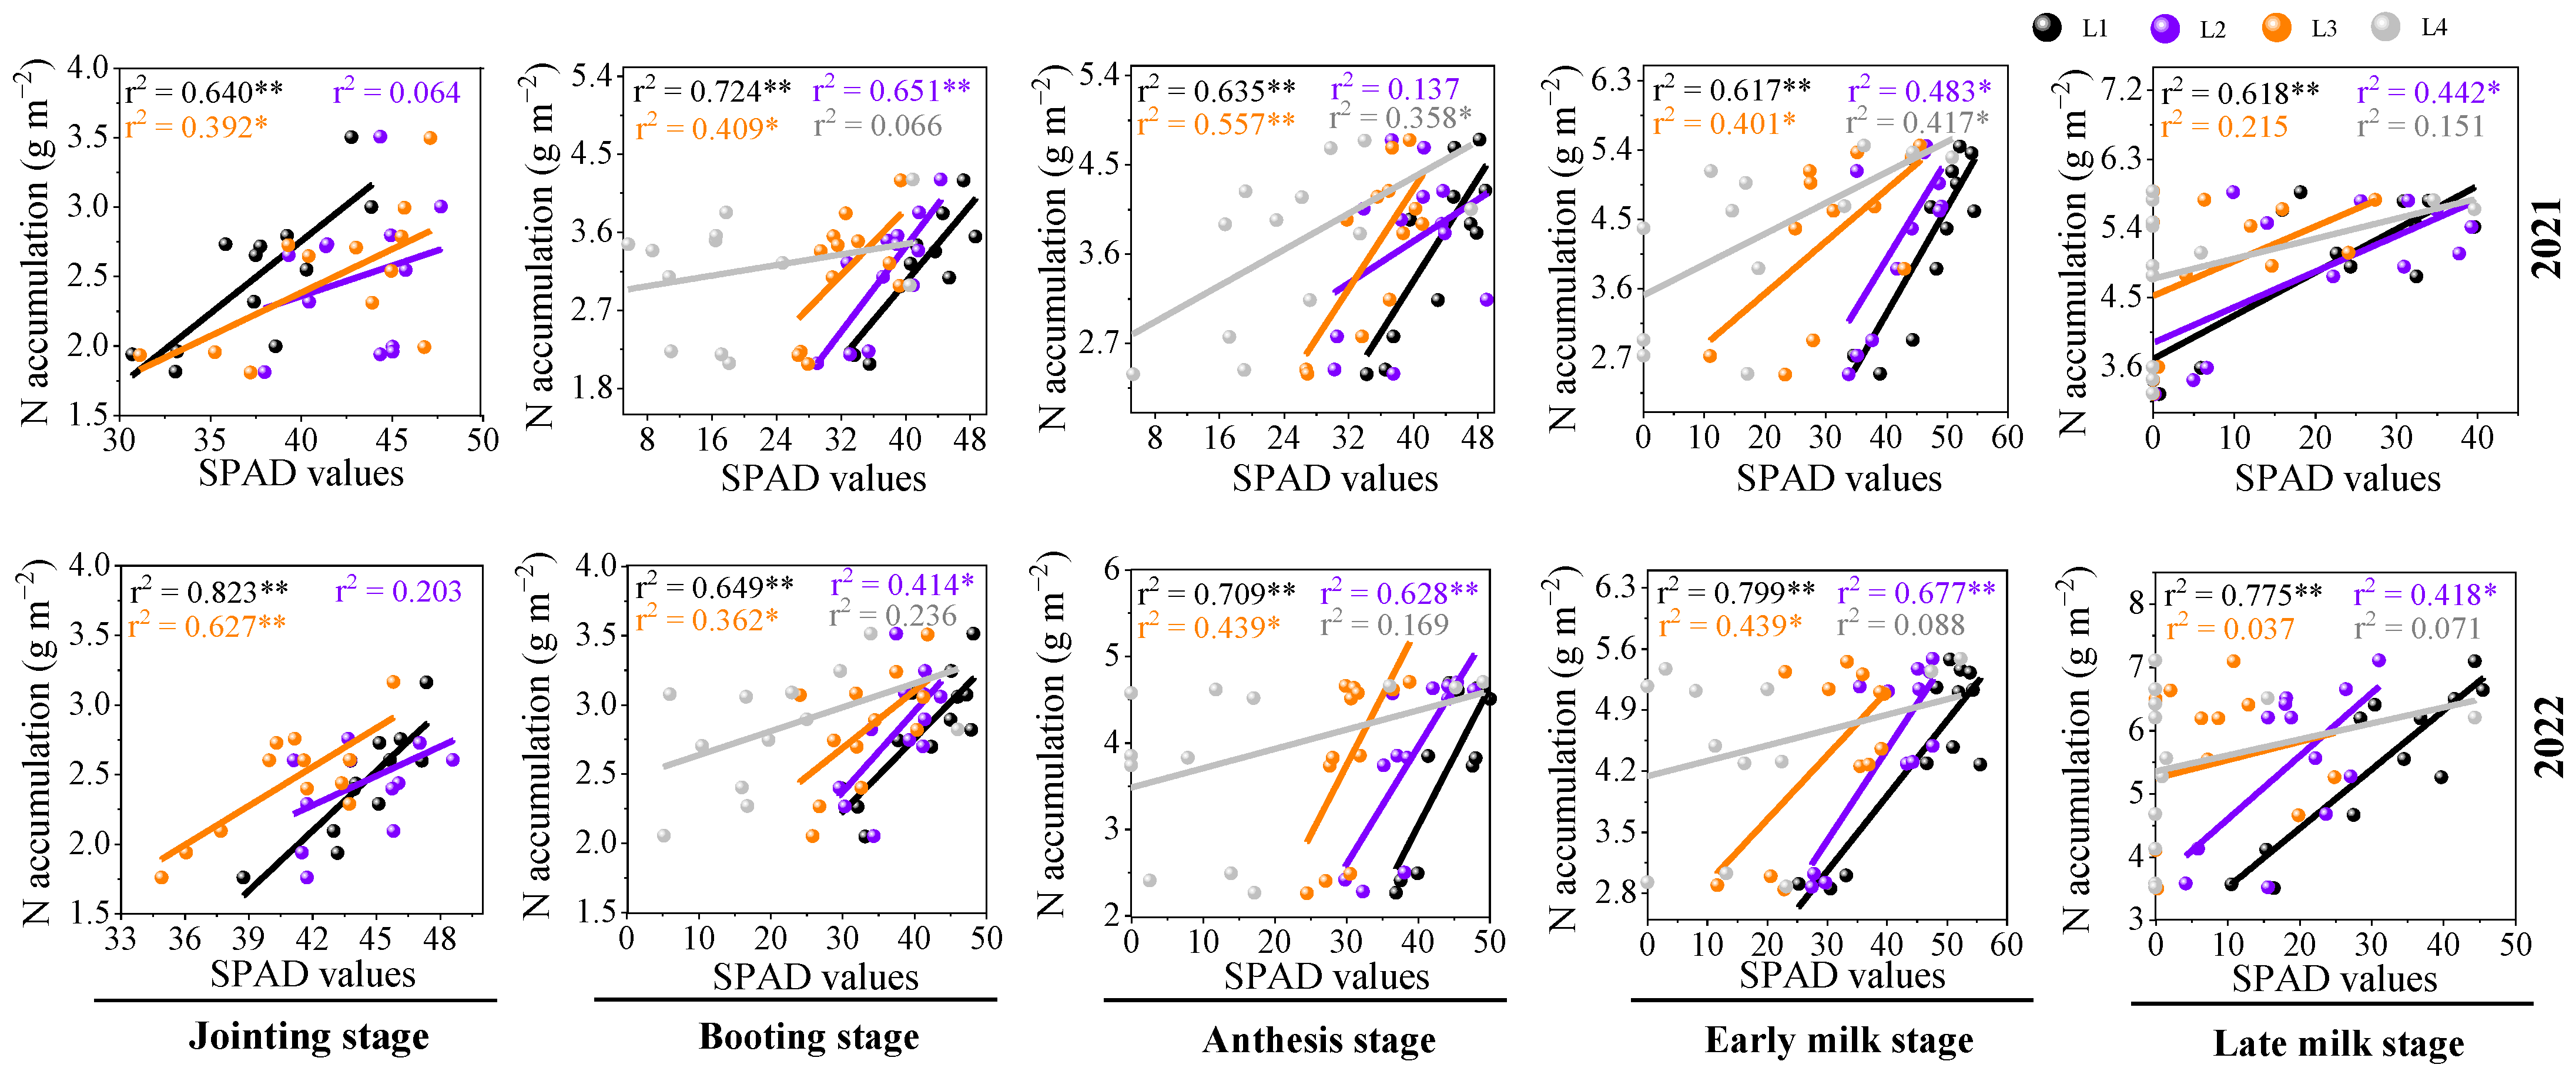
3.1. The SPAD Value of L1 Was More Accurate in Evaluating the Nitrogen Nutritional Status of Each Growth Stage under TR6S

The initial purpose of developing the SPAD chlorophyll meter was to estimate the nitrogen nutritional status of crops and provide guidance for more accurate nitrogen fertilizer management [22,23,31]. However, previous studies have reported that although SPAD values are significantly correlated with nitrogen uptake by crops, they are affected by plant species, growth environment, planting patterns, and sampling positions [11]. Since our planting patterns and varieties were single in this experiment, different sampling positions may have been the biggest factor affecting the difference in SPAD values in this experiment. Therefore, we first assessed the relationship between SPAD values and nitrogen content of plant in different growth stages to determine which type of leaf (L1, L2, L3 and L4) had the highest correlation with nitrogen absorption by wheat. The results show that L1 exhibited the highest correlation with the nitrogen content of wheat plants during the whole growth period, and the correlation coefficient (r2) was clearly higher than that of other leaf types (L2, L3, and L4; (Figure 2)). Among them, the r2 between SPAD values and nitrogen content of L1 reached 0.640–0.832, 0.649–0.724, 0.635–0.709, 0.617–0.799, and 0.618–0.775 at the jointing, booting, anthesis, early milk, and late milk stages, respectively. These results are consistent with the study by Ziadi et al. [32] but inconsistent with the study by Li et al. [33]. The latter considered that nitrogen uptake by crops had a higher correlation with L3 and L2. This difference may be due to the difference in test varieties or planting patterns. Moreover, this verifies the previous results that when the crop planting environment changes (varieties, planting patterns, etc.), the SPAD leaf space position needs to be redetermined [11]. In this experiment, the SPAD value of L1 was more accurate for the evaluation of nitrogen nutritional status of wheat during different growth stages under TR6S. In addition, this indicates that the results of this study may only be applicable to the planting patterns and varieties selected by our experiment, but the same research method can be referred to by other researchers.

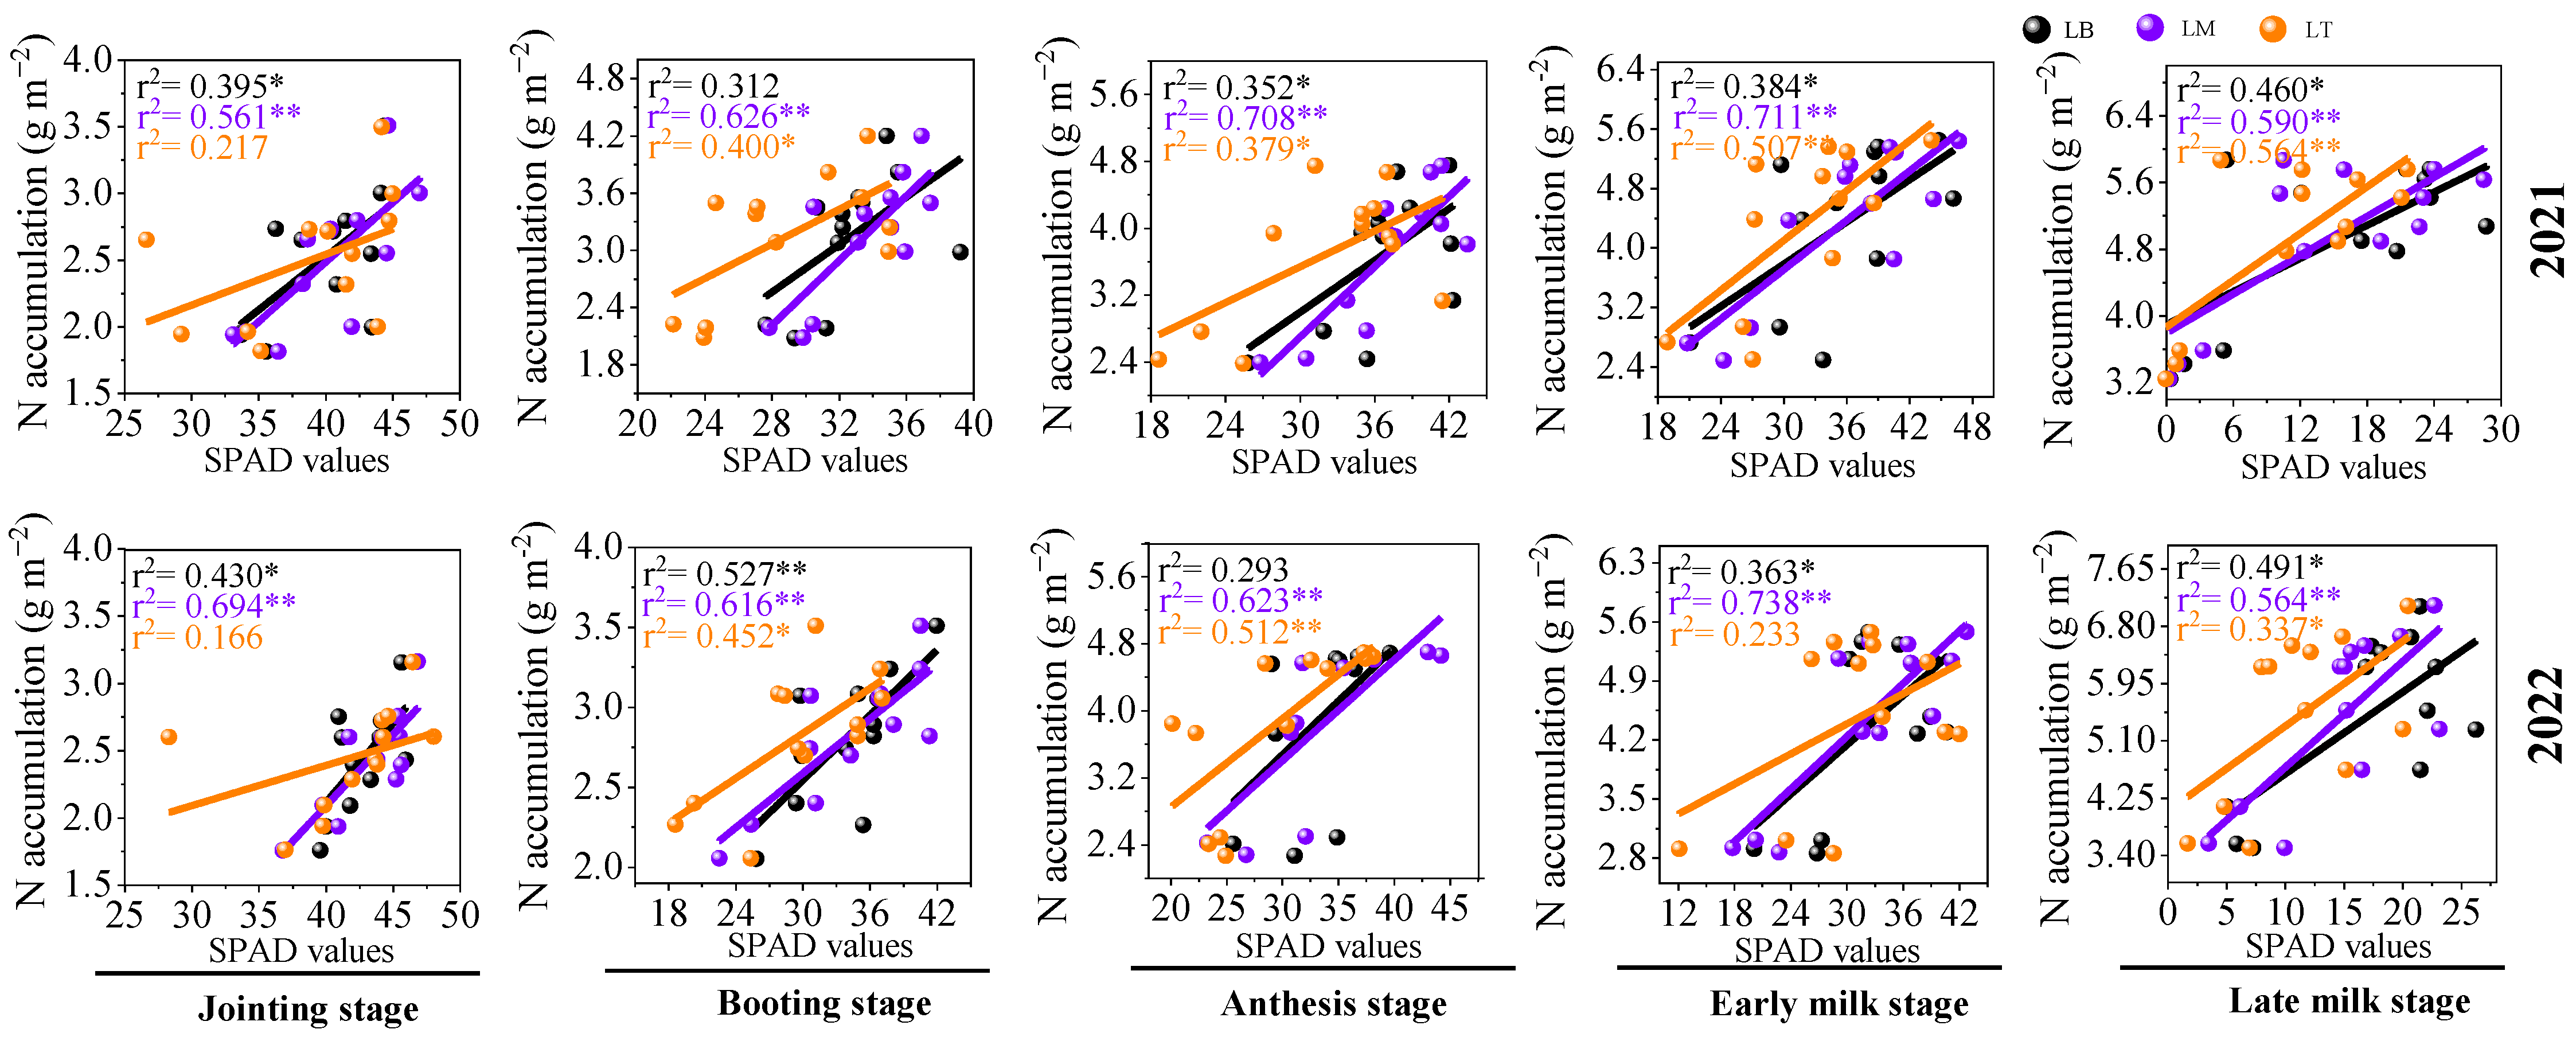
3.2. The SPAD Value in the LM Was More Accurate in Evaluating the Nitrogen Nutritional Status of Wheat under TR6S

In the actual SPAD measurement, even with the same leaf, the SPAD values of different positions on leaves (LT, LM, and LB) exhibit considerable differences [11,34]. Therefore, it is crucial to determine the position on the same leaf to measure the SPAD value to accurately evaluate the nitrogen nutritional status of crops. In this experiment, compared with the LT and LB, the r2 of SPAD value and plant nitrogen content in LM at each growth stage was the highest; the values of r2 were generally between 0.564 and 0.738 (Figure 3). This indicated that under TR6S, the SPAD value of LM may be more accurate for determining nitrogen absorption by wheat. In this experiment, the highest correlation between leaf SPAD value and nitrogen content was observed in LM, which was consistent with previous studies [27,34]. Therefore, the SPAD value of LM was the most accurate in determining plant nitrogen content, which can be used as a nitrogen evaluation index under TR6S.

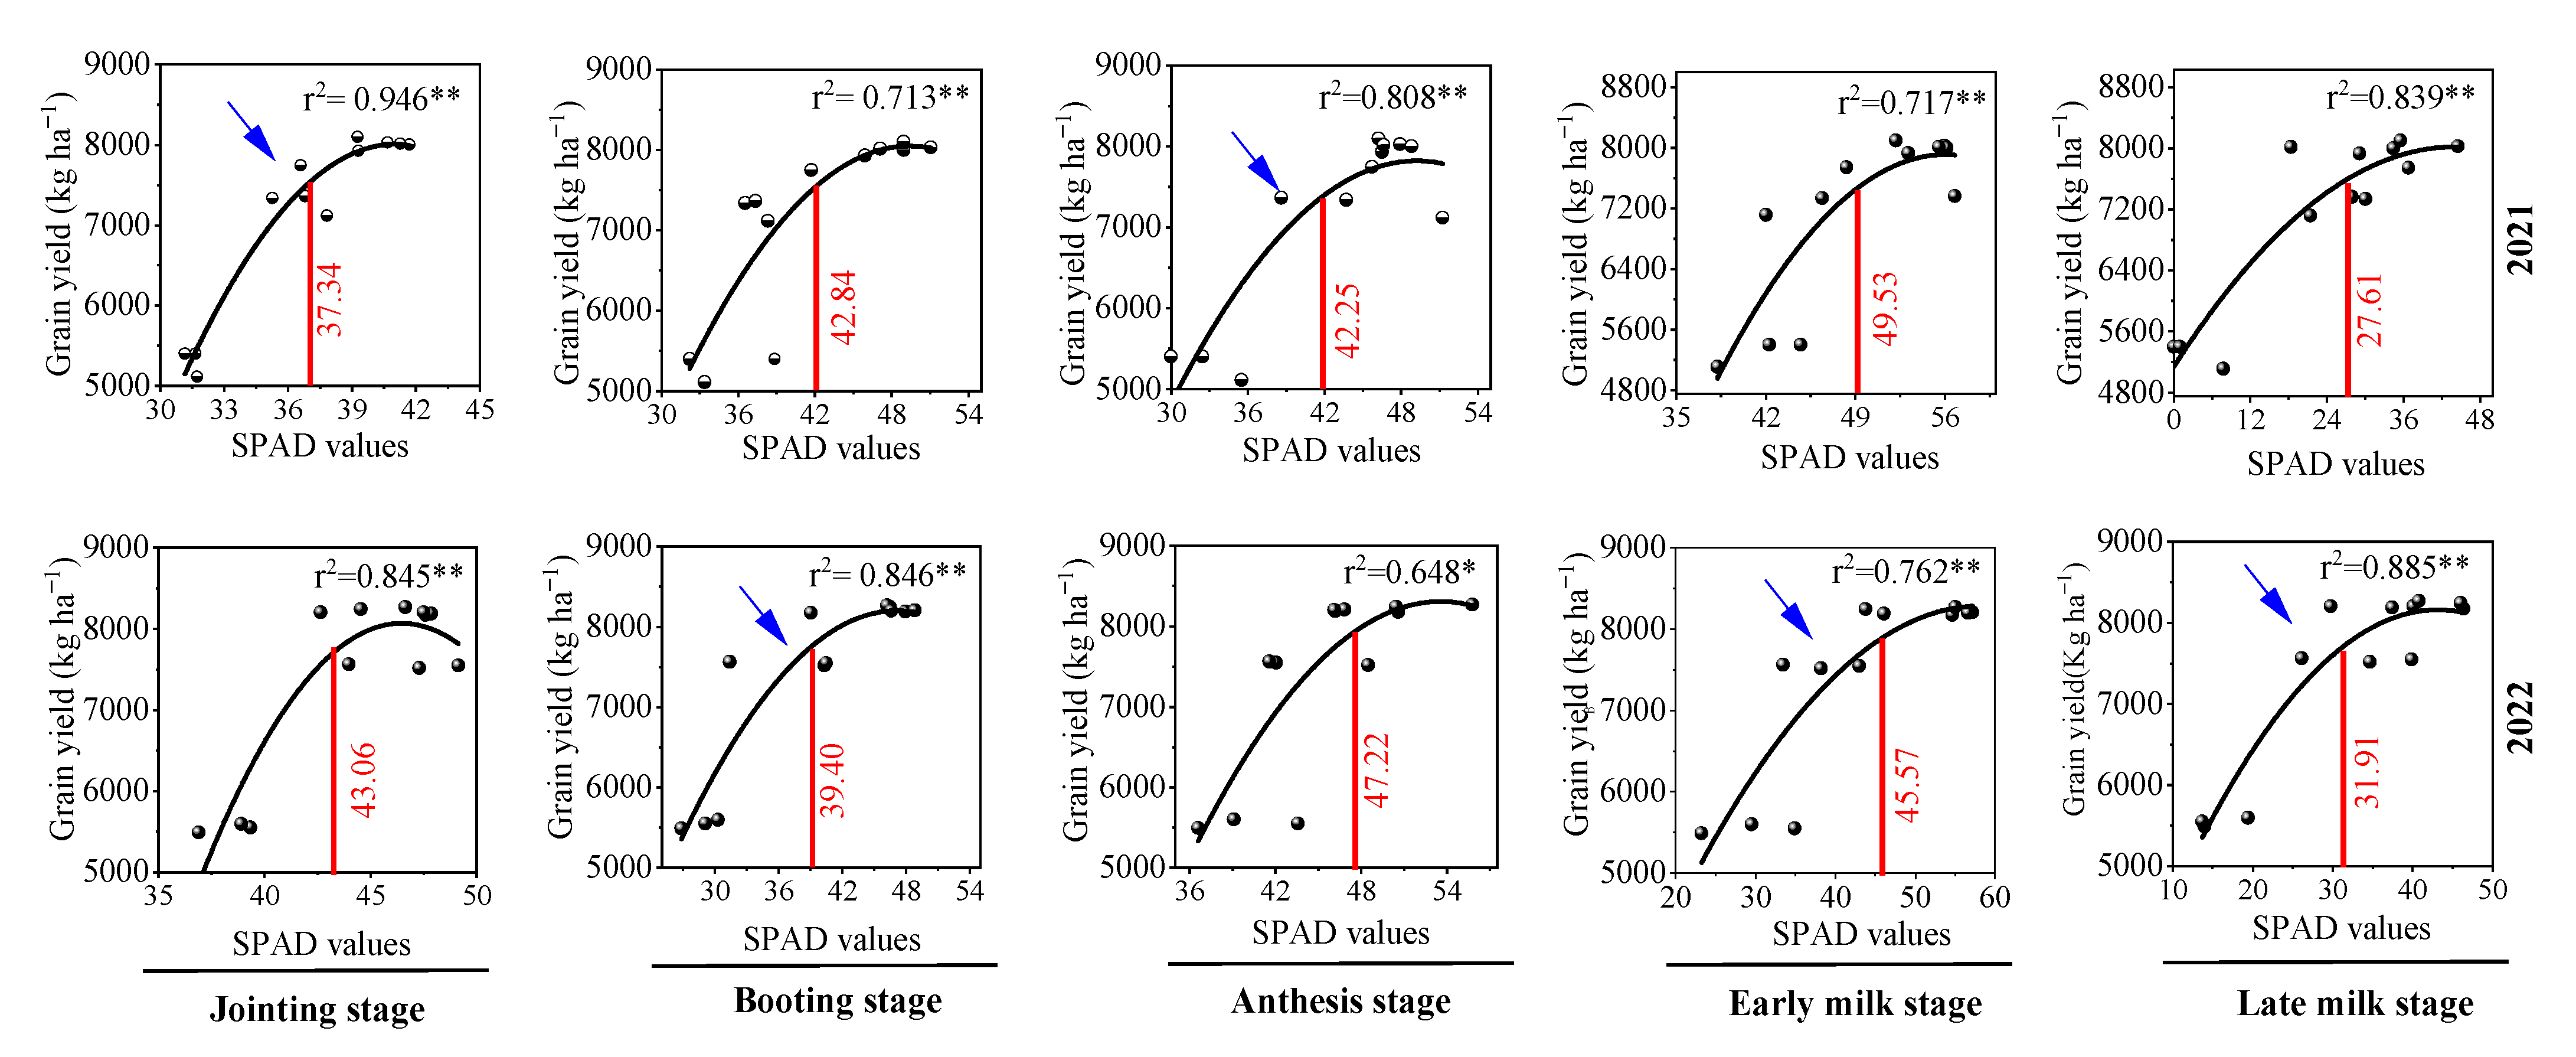
3.3. The Determination of Wheat Critical SPAD Value Based on the Middle of First Top Leaf (L1-M)

Based on the SPAD value of L1-M of the drip-irrigated system for spring wheat, we assessed the relation between SPAD values of leaves and grain yield of the drip-irrigated spring wheat at the jointing, booting, anthesis, early milk, and late milk stages. The relation was a quadratic function (Figure 4), indicating that in a certain range, the SPAD value of spring wheat leaves and grain yield increased. However, when the SPAD value of a leaf exceeded a certain value, the yield decreased. Since SPAD could reflect plant nitrogen content [22,23,31], this indicates that the increase of grain yield would be limited by nitrogen, and overapplication of nitrogen could not continuously increase grain yield, which was consistent with previous studies [13,35]. Generally, a SPAD value at 95% of the highest theoretical yield is used as the critical value [27]. Therefore, according to the functional relationship between SPAD value and grain yield at different growth stages, critical SPAD values at jointing, booting, anthesis, early milk, and late milk stages in 2021 and 2022 were 37.34, 42.84, 42.25, 49.53, and 27.61 and 43.06, 39.40, 47.22, 45.57, and 35.91, respectively. In addition, to determine critical SPAD value of TR6S more accurately, we used the higher r2 function relationship in different growth stages to determine critical SPAD values of wheat in that growth period. Since SPAD value is closely related to nitrogen uptake by crops [22], the determination of critical SPAD value is also of great significance for timely evaluation of nitrogen deficiency. Generally, a SPAD value less than, equal to, or greater than the critical SPAD value represents nitrogen deficiency, appropriate nitrogen content, and excess nitrogen, respectively [27]. Therefore, for TR6S, the critical SPAD values at the jointing, booting, anthesis, early milk, and late milk stages were 37.34, 39.40, 42.25, 45.57, and 35.91, respectively. As SPAD value determination is convenient and fast, it has as advantage in agricultural production [11,24,25]. Therefore, the determination of the SPAD critical value can be recommended for evaluating the nitrogen nutritional status of wheat under TR6S.

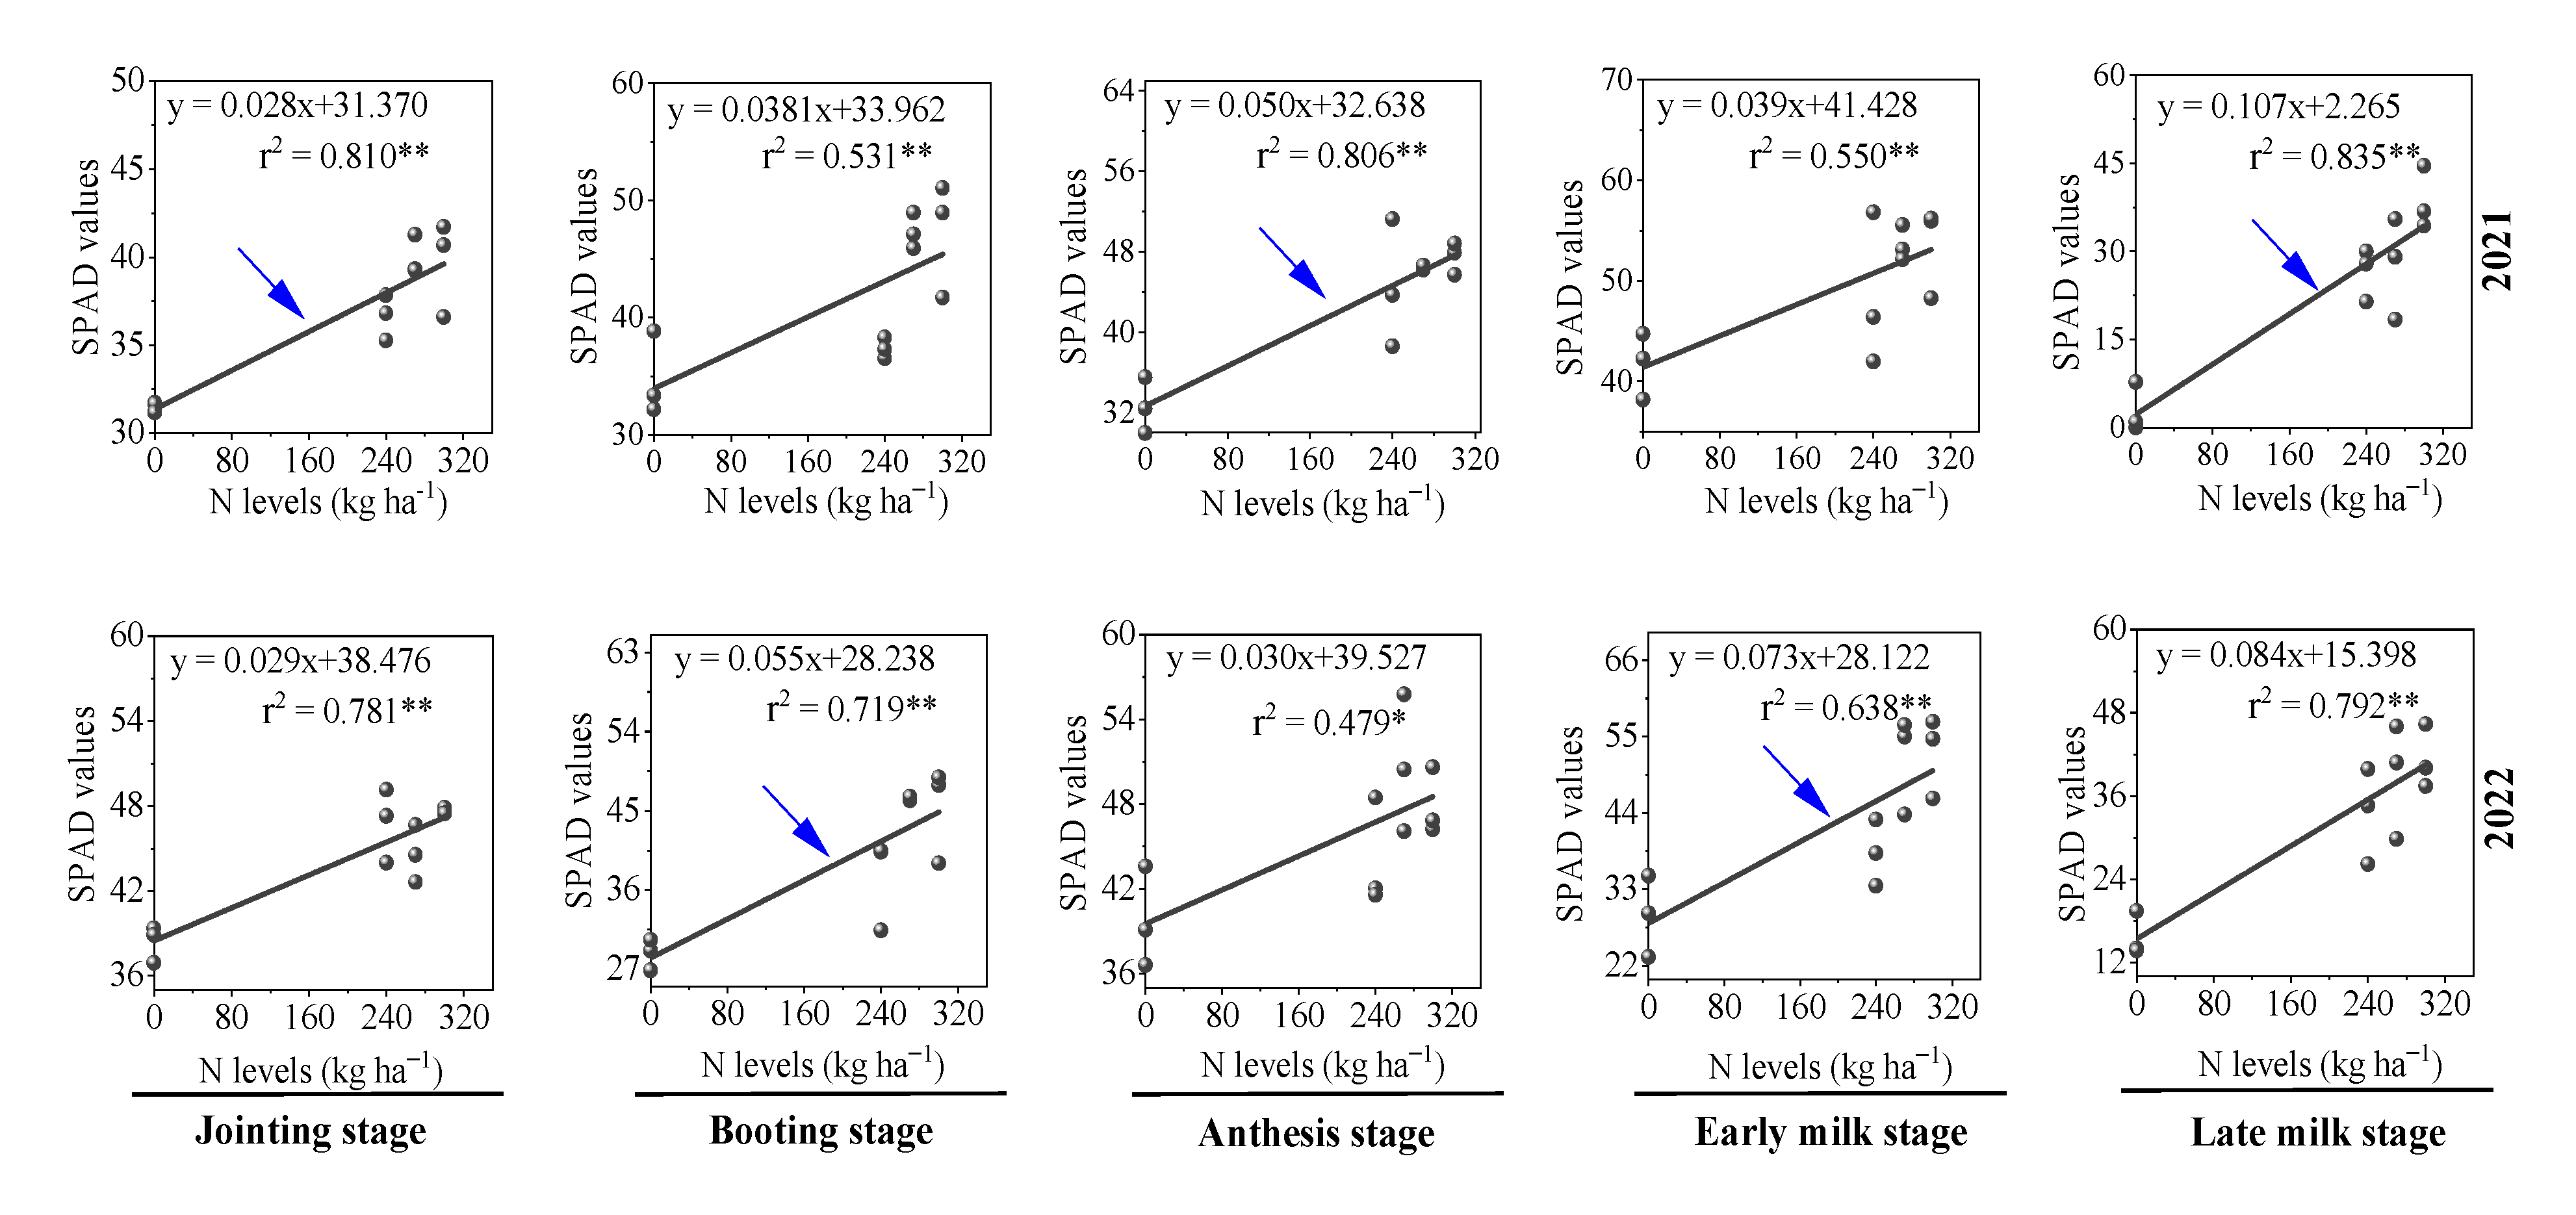
3.4. Nitrogen Fertilizer Recommendation as per Wheat Growth Stage Based on Critical SPAD Value

Nitrogen fertilizer stage recommendations based on critical SPAD value in drip irrigated spring wheat system first needs to establish a nitrogen fertilizer stage application model [11,27]. In previous studies on drip-irrigated wheat, the model of nitrogen fertilizer as per growth stages based on SPAD value has been determined [27]; however, the constants related to the model needed to be recalculated for this experiment. We first calculated the linear relationship between SPAD and nitrogen application rate at different growth stages of wheat (Figure 5). It was observed that leaf SPAD value increased with the increase of the nitrogen application rate, indicating that increasing nitrogen application rate was conducive to the formation of leaf chlorophyll. The corresponding SPAD value of the leaf was lower under the condition of reduced nitrogen application. Chlorophyll can promote the photosynthetic performance of crops, which is conducive to material accumulation and grain yield formation [36,37]. Therefore, appropriate nitrogen supply is essential for the normal growth and development of crops. The results of this study are consistent with those of previous studies [7,38,39,40,41]. Based on the linear relationship between SPAD value and nitrogen application rate during the two years of experiment, we selected the higher linear relationship of r2 to determine the constants “b” and “a” of the model. The lowercase “b” is the regression coefficient of the linear equation between SPAD value and nitrogen application rate at each growth stage [27], and “a” is the intercept [27]. Therefore, the values of “b” were 0.028, 0.055, 0.050, 0.073, and 0.107 and those of “a” were 31.370, 28.238, 32.638, 28.122, and 2.265 at the jointing, booting, anthesis, early milk, and late milk stages, respectively. In this experiment, the grain yields at four different nitrogen levels were 7925.2~8190.2 kg ha−1 (N1), 8014.1~8238.6 kg ha−1 (N2), 7272.8~7542.8 kg ha−1 (N3), and 5304.7~5546.9 kg ha−1 (N4), respectively. Further, we studied the relationship between nitrogen application rate and grain yield. They exhibited a binary function relationship (Figure 6). Grain yield first increased and then decreased with the increase of nitrogen application rate. This is consistent with the study by Shi et al. [27]. In this experiment, an increase in nitrogen application promoted the formation of chlorophyll; however, the increase in grain yield was limited. Previous studies have reported that excessive application of nitrogen fertilizer would lead to an increase in root soil solution concentration, thereby inhibiting the absorption of soil nutrients and water by the roots [27]. In addition, nitrogen application showed a threshold effect in the regulation of crop growth and yield, i.e., excessive nitrogen application was unfavorable to crop growth and yield [42,43]. This can well explain the decreasing trend of grain yield under high nitrogen application in this study. The theoretical maximum values of grain yield in 2021 and 2022 were 8083 and 8309 kg ha−1, respectively, and the corresponding nitrogen application levels were 282 and 283 kg ha−1, respectively. The correlation coefficient (r2) between grain yield and N levels in 2022 was higher than that of in 2021. Therefore, we chose the amount of nitrogen fertilizer in 2022 as Nt (283 kg ha−1) for modeling. After determining a, b, and Nt, we finally determined the SPAD-based N recommendation model as per wheat growth stages under TR6S (Table 2). The critical value of SPAD at each growth stage was introduced into the model, and the recommended nitrogen application rates at the jointing, booting, anthesis, early milk, and late milk stages were 69.4, 80.0, 90.8, 44.0, and 6.0 kg ha−1, respectively.

3.5. Comparison of Recommended Fertilization Strategy with Conventional Fertilization Strategy and the Evaluation of Recommended Fertilization Strategy Using NNI

Significant differences were observed between recommended nitrogen application rates calculated based on critical SPAD and conventional nitrogen application rates (Figure 7a). The nitrogen application rate as per conventional strategy was 300 kg ha−1 [1,2]; however, the total nitrogen application rate for wheat was 290.2 kg ha−1 based on the recommended fertilization strategy (Figure 7a). This suggests that the total nitrogen application under the recommended fertilization strategy was decreased by 3.3% compared to that under the conventional fertilization strategy. This is conducive to reducing fertilizer input costs in a certain sense. From the perspective of each growth stage, conventional nitrogen fertilizer strategy focuses on nitrogen application at the early growth stage. As shown in Figure 7a, the nitrogen application amount at and before the jointing stage accounted for almost 64% of the total nitrogen application amount; further, the nitrogen application amount gradually decreased, and no nitrogen application was applied at the end of the milk stage. However, the application rate as per the model exhibited a trend of increasing and then decreasing as per the growth stage; that is, less application at the early and late growth stages (jointing and milk stages) and more application at the middle growth stage (booting and anthesis stages). Based on the conventional nitrogen application strategy, our study recommended that nitrogen application rate should be reduced by 63.9% at the jointing stage, and increased by 66.7, 152.2%, and 83.3% at the booting stage, anthesis stage, and early milk stage, respectively. In addition, it is worth noting that the late milk stage of wheat should add approximately 6 kg ha−1 N. Under the TR4 planting system, previous studies found that the recommended nitrogen application amount based on leaf SPAD was lower than the traditional nitrogen application amount (the amount of nitrogen fertilizer applied was reduced by about 8%) [27], which is basically consistent with our result. Moreover, in terms of yield, the grain yield based on the SPAD recommendation strategy did not differ significantly compared with the conventional nitrogen application strategy. This further demonstrates that the recommended nitrogen application based on leaf SPAD can save nitrogen fertilizer without decreasing yield.
Finally, based on the NNI, we evaluated the recommended N fertilization as per wheat growth stage based on critical SPAD value under TR6S (Figure 7b). NNI is based on critical nitrogen concentration in crops, which has reasonable biological significance and can quantitatively reflect the nitrogen nutritional status in crops [13,14]. Here, we normalized the NNI data (NNI−1), so when NNI is >0, equal to 0, and <0, it indicates excess, optimal, and insufficient nitrogen application, respectively. It was observed that NNI normalization results were always >0 before 53 days (anthesis stage) after wheat seedling emergence. This indicated that under conventional fertilization strategy, excess nitrogen was provided to wheat before anthesis, and a large amount of nitrogen was not effectively absorbed and used. Thus, conventional nitrogen fertilizer strategy leads to considerable nitrogen wastage in the early stage of wheat growth. The early nitrogen reduction strategy based on the nitrogen application recommendation model is consistent with the evaluation results of NNI; therefore, it may be more in line with the law of wheat nitrogen demand. In addition, after 53 days of wheat seedling emergence, all NNI normalization results were <0. This indicated that after anthesis, the nitrogen supply under conventional nitrogen fertilizer strategy was clearly insufficient. However, the recommended model revealed that delayed nitrogen application may make up for nitrogen deficiency. Therefore, compared with conventional fertilization strategy, nitrogen application rate in each growth stage under TR6S recommended in this study was more optimal. As the drip-irrigated wheat system is a newly developed technology in Xinjiang, the traditional nitrogen application strategy mainly stems from the experience of farmers. It can be seen that the traditional nitrogen fertilizer strategy not only has the phenomenon of nitrogen waste, but also the proportion of nitrogen fertilizer allocation in each growth period is not scientific.
The disadvantage of this experiment is that there is no actual field production verification experiment based on the staged nitrogen application strategy recommended by critical SPAD value. Therefore, on the basis of staged nitrogen application strategy in this study, a verification test combined with the nitrogen application frequency will be the focus of our later research. Moreover, the N-Tester™ is a good meter for assessing nitrogen [44]. A comparison of accuracy between different nitrogen trophic trophic assmethods also deserves intensive investigation.

4. Conclusions

In a two-year field experiment, we developed a model for nitrogen application recommendation as per wheat growth stage based on leaf SPAD values under a new type of drip-irrigated system for spring wheat: TR6S. The results revealed that the SPAD value of L1-M exhibited the highest correlation with plant nitrogen content, which could most accurately reflect the nitrogen uptake by the plant. By quantitatively analyzing the functional relationship between SPAD in L1-M and grain yield, the critical SPAD values of TR6S at the jointing, booting, anthesis, early milk, and late milk stages were obtained as 37.34, 39.40, 42.25, 45.57, and 35.91, respectively. The results of this study provide important indicators for the timely and accurate judgment of nitrogen nutritional status in various wheat growth stages. In addition, through the nitrogen application model is based on the critical SPAD at each growth stage, the recommended optimal nitrogen application rates at the jointing, booting, anthesis, early milk, and late milk stages were 69.4, 80.0, 90.8, 44.0, and 6.0 kg ha−1, respectively. Compared with the conventional nitrogen application strategy, this nitrogen application strategy exhibited a better parallel relationship with the nitrogen nutrition index of each growth period. Therefore, it was more in-line with the actual absorption and utilization of nitrogen in wheat.

Supplementary Materials

The following supporting information can be downloaded at: https://www.mdpi.com/article/10.3390/agronomy12102331/s1, Figure S1: Each plot was equipped with precision water meter and small fertilizer pot for precise irrigation and fertilization; Figure S2: Schematic diagram of wheat leaf types and positions to measure SPAD values.

Author Contributions

Conceptualization, W.W. and Y.Z.; methodology, W.W., Y.Z. and M.D.; software, W.W. and Y.Z.; validation, W.W., Y.Z. and M.D.; formal analysis, W.W. and Y.Z.; investigation, W.W., Y.Z., J.X., K.L., S.G., Y.C., H.C. and P.W.; resources, M.D.; data curation, W.W. and Y.Z.; writing—original draft preparation, W.W. and Y.Z.; writing—review and editing, M.D.; visualization, W.W. and Y.Z.; supervision, W.W., Y.Z. and M.D.; project administration, M.D.; and funding acquisition, M.D. All authors have read and agreed to the published version of the manuscript.

Funding

This research was funded by Shihezi University Innovation and Development Special Project (No. CXFZ202014).

Data Availability Statement

Not applicable.

Acknowledgments

We would like to thank the reviewers for helping us in improving our original manuscript.

Conflicts of Interest

The authors declare no conflict of interest.

References

  1. Lv, Z.; Diao, M.; Li, W.; Cai, J.; Zhou, Q.; Wang, X.; Dai, T.; Cao, W.; Jiang, D. Impacts of lateral spacing on the spatial variations in water use and grain yield of spring wheat plants within different rows in the drip irrigation system. Agric. Water Manag. 2019, 212, 252–261. [Google Scholar] [CrossRef]
  2. Wan, W.; Li, L.; Jing, J.; Diao, M.; Lv, Z.; Li, W.; Wang, J.; Li, Z.; Wang, X.; Jiang, D. Narrowing row space improves productivity and profit of enlarged lateral space drip irrigated spring wheat system in Xinjiang, China. Field Crops Res. 2022, 280, 108474. [Google Scholar] [CrossRef]
  3. Chen, R.; Cheng, W.; Cui, J.; Liao, J.; Fan, H.; Zheng, Z.; Ma, F. Lateral spacing in drip-irrigated wheat: The effects on soil moisture, yield, and water use efficiency. Field Crops Res. 2015, 179, 52–62. [Google Scholar] [CrossRef]
  4. Deng, X.P.; Shan, L.; Zhang, H.; Turner, N.C. Improving agricultural water use efficiency in arid and semiarid areas of China. Agric. Water Manag. 2006, 80, 23–40. [Google Scholar] [CrossRef]
  5. Gan, Y.; Siddique, K.; Turner, N.; Li, X.; Niu, J.; Yang, C.; Liu, L.; Chai, Q. Ridge-furrow mulching systems-an innovative technique for boosting crop productivity in semiarid rain-fed environments. Adv. Agron. 2013, 118, 429–476. [Google Scholar] [CrossRef]
  6. Zhang, G.; Liu, C.; Xiao, C.; Xie, R.; Ming, B.; Hou, P.; Liu, G.; Wu, W.; Shen, D.; Wang, K.; et al. Optimizing water use efficiency and economic return of super high yield spring maize under drip tube and plastic mulching in arid areas of China. Field Crops Res. 2017, 211, 137–146. [Google Scholar] [CrossRef]
  7. Si, Z.; Zain, M.; Mehmood, F.; Wang, G.; Gao, Y.; Duan, A. Effects of nitrogen application rate and irrigation regime on growth, yield, and water-nitrogen use efficiency of drip-irrigated winter wheat in the North China Plain. Agric. Water Manag. 2020, 231, 106002. [Google Scholar] [CrossRef]
  8. Tan, Y.; Xu, C.; Liu, D.; Wu, W.; Lal, R.; Meng, F. Effects of optimized N fertilization on greenhouse gas emission and crop production in the North China Plain. Field Crops Res. 2017, 205, 135–146. [Google Scholar] [CrossRef]
  9. Liang, H.; Wang, S.; Wei, S. Nitrate distribution and accumulation in deep unsaturated zone soils in piedmont of North China Plain. Soils 2017, 49, 1179–1186. [Google Scholar] [CrossRef]
  10. Wang, S.; Tang, C.; Song, X.; Yuan, R.; Han, Z.; Pan, Y. Factors contributing to nitrate contamination in a groundwater recharge area of the North China Plain. Hydrol. Process. 2016, 30, 2271–2285. [Google Scholar] [CrossRef]
  11. Feng, W.; He, L.; Zhang, H.Y.; Guo, B.B.; Zhu, Y.J.; Wang, C.Y.; Guo, T.C. Assessment of plant nitrogen status using chlorophyll fluorescence parameters of the upper leaves in winter wheat. Eur. J. Agron. 2015, 64, 78–87. [Google Scholar] [CrossRef]
  12. Justes, E.; Mary, B.; Meynard, J.M.; Machet, J.M.; Thelier-Huché, L. Determination of a critical nitrogen dilution curve for winter wheat crops. Ann. Bot. 1994, 74, 397–407. [Google Scholar] [CrossRef]
  13. Peng, X.; Liu, Q.; Wang, J.; Diao, M. Nitrogen nutrition diagnosis based on the critical nitrogen concentration of drip irrigation spring wheat. J. Triticeae Crops 2015, 35, 1009–1015. [Google Scholar] [CrossRef]
  14. Wan, W.; Guo, P.; Hu, Y.; Zhang, X.; Zhang, K.; Diao, M. Distribution and yield of spring wheat under drip irrigation in Xinjiang. J. Soil Water Conserv. 2018, 32, 166–174. [Google Scholar] [CrossRef]
  15. Plénet, D.; Lemaire, G. Relationships between dynamics of nitrogen uptake and dry matter accumulation in maize crops. Determination of critical N concentration. Plant Soil 1999, 216, 65–82. [Google Scholar] [CrossRef]
  16. Sheehy, J.E.; Dionora, M.J.A.; Mitchell, P.L.; Peng, S.; Cassman, K.G.; Lemaire, G.; Williams, R.L. Critical nitrogen concentrations: Implications for high-yielding rice (Oryza sativa L.) cultivars in the tropics. Field Crops Res. 1998, 59, 31–41. [Google Scholar] [CrossRef]
  17. Colnenne, C.; Meynard, J.M.; Reau, R.; Justes, E.; Merrien, A. Determination of a critical nitrogen dilution curve for winter oilseed rape. Ann. Bot. 1998, 81, 311–317. [Google Scholar] [CrossRef]
  18. Wei, C.Z.; Zhang, F.S.; Zhu, H.M.; Hou, Z.A.; Guo, G.S.; Bao, B.Y. Study on cotton nitrogen diagnosis and topdressing recommendation in North Xinjiang, China. Agric. Sci. China 2002, 1, 1358–1364. [Google Scholar] [CrossRef]
  19. Li, Z.; Liu, H.; Zhang, F. Research of nitrogen nutrition status for winter wheat based on chlorophyll meter. Plant Nutr. Fertil. Sci. 2003, 9, 401–405. [Google Scholar] [CrossRef]
  20. Li, Z.; Wang, X.; Zhang, F. Diagnosis of nitrogen nutrition of several main crops in North China research on recommendation of topdressing IV. Study on nitrogen diagnosis and fertilization recommendation under winter wheat-summer maize rotation system. Plant Nutr. Fertil. Sci. 1997, 4, 357–362. [Google Scholar] [CrossRef]
  21. Li, Z.; Zhang, F.; Wang, X. Diagnosis of nitrogen nutrition of several main crops in North China research on recommendation of topdressing III. Study on nitrogen nutrition diagnosis and topdressing recommendation system of spring wheat. Plant Nutr. Fertil. Sci. 1997, 4, 349–356. [Google Scholar]
  22. Duru, M. Evaluation of chlorophyll meter to assess nitrogen status of cocksfoot sward. J. Plant Nutr. 2002, 25, 275–286. [Google Scholar] [CrossRef]
  23. Chapman, S.C.; Barreto, H.J. Using a chlorophyll meter to estimate specific leaf nitrogen of tropical maize during vegetative growth. Agron. J. 1997, 89, 557–562. [Google Scholar] [CrossRef]
  24. Debaeke, P.; Rouet, P.; Justes, E. Relationship between the normalized SPAD index and the nitrogen nutrition index: Application to durum wheat. J. Plant Nutr. 2006, 29, 75–92. [Google Scholar] [CrossRef]
  25. Ziadi, N.; Brassard, M.; Bélanger, G.; Claessens, A.; Tremblay, N.; Cambouris, A.N.; Nolin, M.C.; Parent, L.É. Chlorophyll measurements and nitrogen nutrition index for the evaluation of corn nitrogen status. Agron. J. 2008, 100, 1264–1273. [Google Scholar] [CrossRef]
  26. Monostori, I.; Árendás, T.; Hoffman, B.; Galiba, G.; Gierczik, K.; Szira, F. Relationship between spad value and grain yield can be affected by cultivar, environment and soil nitrogen content in wheat. Euphytica 2016, 211, 103–112. [Google Scholar] [CrossRef]
  27. Shi, L.; Zhai, Y.; Wang, X.; Hou, Z.; Ye, J. Recommendation model of nitrogen fertilizer based on SPAD of leaves for drip-irrigated spring wheat. Agric. Res. Arid Areas 2017, 35, 103–107. [Google Scholar] [CrossRef]
  28. Liu, Q.; Diao, M.; Wang, J.; Wang, X. Effect of nitrogen application on accumulation of dry matter and nitrogen, yield of spring wheat under drip irrigation. J. Triticeae Crops 2013, 33, 722–726. [Google Scholar] [CrossRef]
  29. Jin, X.L.; Diao, W.Y.; Xiao, C.H.; Wang, F.Y.; Chen, B.; Wang, K.R.; Li, S.K. Estimation of wheat nitrogen status under drip irrigation with canopy spectral indices. J. Agric. Sci. 2014, 153, 1281–1291. [Google Scholar] [CrossRef]
  30. Wang, H.; Guo, Z.; Shi, Y.; Zhang, Y.; Yu, Z. Impact of tillage practices on nitrogen accumulation and translocation in wheat and soil nitrate-nitrogen leaching in drylands. Soil Tillage Res. 2015, 153, 20–27. [Google Scholar] [CrossRef]
  31. Errecart, P.M.; Agnusdei, M.G.; Lattanzi, F.A.; Marino, M.A. Leaf nitrogen concentration and chlorophyll meter readings as predictors of tall fescue nitrogen nutrition status. Field Crops Res. 2012, 129, 46–58. [Google Scholar] [CrossRef]
  32. Ziadi, N.; Bélanger, G.; Claessens, A.; Lefebvre, L.; Tremblay, N.; Cambouris, A.N.; Nolin, M.C.; Parent, L.É. Plant-based diagnostic tools for evaluating wheat nitrogen status. Crop Sci. 2010, 50, 2580–2590. [Google Scholar] [CrossRef]
  33. Li, F.; Zhao, C.; Wang, J.; Zhang, X.; Liu, L.; Yang, T.; Shi, J.; Cao, W. Diagnosis of nitrogen nutrition of flue-cured tobacco with chlorophyll meter. J. Plant Nutr. Fertil. Sci. 2007, 13, 136–142. [Google Scholar]
  34. Wang, L.; Lu, Y.; Bai, Y. Research progress on nitrogen nutrition diagnosis method based on SPAD for main grain crops. Chin. J. Plant Nutr. Fertil. 2022, 28, 546–554. [Google Scholar] [CrossRef]
  35. Hu, Y.; Wan, W.; Wang, J.; Diao, M. Effects of different water and nitrogen application rates on the accumulation and translocation of nitrogen and yield of spring wheat under drip irrigation. Chin. J. Shihezi Univ. Nat. Sci. 2018, 36, 448–456. [Google Scholar] [CrossRef]
  36. Gaju, O.; Allard, V.; Martre, P.; Le Gouis, J.; Moreau, D.; Bogard, M.; Hubbart, S.; Foulkes, M.J. Nitrogen partitioning and remobilization in relation to leaf senescence, grain yield and grain nitrogen concentration in wheat cultivars. Field Crops Res. 2014, 155, 213–223. [Google Scholar] [CrossRef]
  37. Nehe, A.S.; Misra, S.; Murchie, E.H.; Chinnathambi, K.; Tyagi, B.S.; Foulkes, M.J. Nitrogen partitioning and remobilization in relation to leaf senescence, grain yield and protein concentration in Indian wheat cultivars. Field Crops Res. 2020, 251, 107778. [Google Scholar] [CrossRef]
  38. Zhang, Y.; Wang, J.; Gong, S.; Xu, D.; Sui, J. Nitrogen fertigation effect on photosynthesis, grain yield and water use efficiency of winter wheat. Agric. Water Manag. 2017, 179, 277–287. [Google Scholar] [CrossRef]
  39. Mon, J.; Bronson, K.F.; Hunsaker, D.J.; Thorp, K.R.; White, J.W.; French, A.N. Interactive effects of nitrogen fertilization and irrigation on grain yield, canopy temperature, and nitrogen use efficiency in overhead sprinkler-irrigated durum wheat. Field Crops Res. 2016, 191, 54–65. [Google Scholar] [CrossRef]
  40. Albrizio, R.; Todorovic, M.; Matic, T.; Stellacci, A.M. Comparing the interactive effects of water and nitrogen on durum wheat and barley grown in a Mediterranean environment. Field Crops Res. 2010, 115, 179–190. [Google Scholar] [CrossRef]
  41. Dar, E.A.; Brar, A.S.; Mishra, S.K.; Singh, K.B. Simulating response of wheat to timing and depth of irrigation water in drip irrigation system using CERES-Wheat model. Field Crops Res. 2017, 214, 149–163. [Google Scholar] [CrossRef]
  42. Wang, H.; Zhang, Y.; Chen, A.; Liu, H.; Zhai, L.; Lei, B.; Ren, T. An optimal regional nitrogen application threshold for wheat in the North China Plain considering yield and environmental effects. Field Crops Res. 2017, 207, 52–61. [Google Scholar] [CrossRef]
  43. Wang, J.; Zhang, Y.; Gong, S.; Xu, D.; Juan, S.; Zhao, Y. Evapotranspiration, crop coefficient and yield for drip-irrigated winter wheat with straw mulching in North China Plain. Field Crops Res. 2018, 217, 218–228. [Google Scholar] [CrossRef]
  44. Ortuzar-Iragorri, M.; Alonso, A.; Castellón, A.; Besga, G.; Estavillo, J.; Aizpurua, A. N-tester use in soft winter wheat. Agron. J. 2005, 97, 1380. [Google Scholar] [CrossRef]
Figure 1. Planting patterns and anthesis canopy picture of wheat under the traditional (TR4) and new (TR6S) drip-irrigated systems. (a) TR4: one tube serves four rows of wheat plants with a standard row spacing of 15 cm. (b) TR6S: one tube serves six rows of wheat plants with a row spacing of 10 cm and an inter-block spacing of 25 cm. LS: lateral spacing of different drip-irrigated patterns.
Agronomy 12 02331 g001
Figure 2. The relationship between SPAD values of different leaves and N accumulation of plant. * and ** indicate significant differences at 0.05 and 0.01 levels, respectively. L1, L2, L3, and L4 indicate the first top leaf, second top leaf, third top leaf, and fourth top leaf of the wheat, respectively.
Agronomy 12 02331 g002
Figure 3. The relationship between SPAD values and N accumulation in different leaf positions [leaf base (LB), leaf middle (LM), and leaf tip (LT)] in wheat. * and ** indicate significant differences at 0.05 and 0.01 levels, respectively. LB, LM, and LT indicate the leaf base (30% distance from the leaf base), leaf middle (30–60% distance from the leaf base), and leaf tip (more than 60% distance from the leaf base) of wheat, respectively.
Agronomy 12 02331 g003
Figure 4. The relationship between SPAD values and grain yield of wheat. The SPAD values were measured in the middle of first top leaf (L1-M) of wheat. Red lines represent the SPAD values of the maximum theoretical yield of 95%, and red numbers represent the critical SPAD values. * and ** indicate significant differences at 0.05 and 0.01 levels, respectively. Blue arrows represent the function that has higher correlation coefficient (r2) between SPAD values and grain yield at the same growth stage in different years.
Agronomy 12 02331 g004
Figure 5. The relationship between SPAD values and N application levels at different growth stages of wheat. The SPAD values were measured in the L1-M of wheat. * and ** indicate significant differences at 0.05 and 0.01 levels, respectively. Blue arrows represent the function that has the higher correlation coefficient (r2) between SPAD values and N application levels at the same growth stage in different years.
Agronomy 12 02331 g005
Figure 6. The relationship between nitrogen application levels and grain yield. Red numbers represent the theoretical maximum grain yield in 2021 and 2022, which were 8083 and 8309 kg ha−1, respectively. ** indicates significant difference at the 0.01 level. Black numbers represent the nitrogen application level corresponding to the theoretical maximum grain yield in 2021 and 2022, which were 282 and 283 kg ha−1, respectively. Blue arrow represents the function that has higher correlation coefficient (r2) between nitrogen application levels and grain yield in different years.
Agronomy 12 02331 g006
Figure 7. (a) Comparison of the recommended fertilization strategy and conventional fertilization strategy. (b) Evaluation of the recommended fertilization strategy using NNI. The normalized value of NNI (NNI−1) was calculated by NNI values subtracting 1. The black numbers represent the percent change between the recommended and conventional N applications in different growth stages of wheat.
Agronomy 12 02331 g007
Table 1. Physical and chemical properties of soil before sowing.
Depth (cm)Soil TexturepHWater Capacity (%)Total Porosity (%)Soil Organic Matter (g kg−1)Bulk Density (g kg−1)Available N (mg kg1)Olsen-P (mg kg−1)Available K (mg kg−1)
0–20loam7.6126.945.511.41.2342.113.8295
20–40loam7.5725.645.110.91.2741.513.2288
40–60loam7.6825.144.610.31.3140.712.5280
Note: This is the average value of our two-year experiments (2021 and 2022).
Table 2. Nitrogen application recommendation model as per wheat growth stage based on critical SPAD values under TR6S (a new drip-irrigated system for spring wheat).
Growth StagesABThe Modal of Recommended RateRecommended Nitrogen Rate (kg/ha−1)
Jointing stage31.370.028N = 1403.4 − SPAD/0.02869.4
Booting stage28.2380.055N = 796.4 − SPAD/0.05580.0
Anthesis stage32.6380.05N = 935.8 − SPAD/0.0590.8
Early milk stage28.1220.073N = 668.2 − SPAD/0.07344.0
Late milk stage2.2650.107N = 304.2 − SPAD/0.1076.0
Publisher’s Note: MDPI stays neutral with regard to jurisdictional claims in published maps and institutional affiliations.

