Article

Differences in the Concentration of Micronutrients in Young Shoots of Numerous Cultivars of Wheat, Maize and Oilseed Rape

by
Jolanta Korzeniowska
* and
Ewa Stanislawska-Glubiak
Department of Weed Science and Soil Tillage Systems in Wroclaw, Institute of Soil Science and Plant Cultivation-State Research Institute in Pulawy, ul. Orzechowa 61, 50-540 Wroclaw, Poland
*
Author to whom correspondence should be addressed.
Agronomy 2022, 12(11), 2639; https://doi.org/10.3390/agronomy12112639
Submission received: 3 October 2022 / Revised: 24 October 2022 / Accepted: 25 October 2022 / Published: 26 October 2022

Abstract

:
Individual species of cultivated plants differ in the content of microelements in the shoots. The aim of our research was to test the hypothesis that the variability of the micronutrient content between cultivars of the same species may be similar or even greater than the differences between species. The research material consisted of shoot samples of 12 wheat, 10 maize and 12 rape varieties collected from production fields in Poland. The smallest number of samples (replicates) within one cultivar was 10. A total of 481 wheat samples, 141 maize samples and 328 rapeseed samples were taken. Wheat samples were taken at the beginning of the stem elongation stage (BBCH 30/31); maize, when the plants reached a height of 25–30 cm (BBCH 14–15); and rape, in the period from the beginning of the main stem elongation stage to the appearance of the first internode (BBCH 30/31). All varieties of the tested crop species were grown in similar soil conditions in terms of pH, texture and TOC content. B, Cu, Fe, Mn and Zn were determined in all plant samples. Wheat showed a significantly lower average concentration of all micronutrients compared to rape and maize (e.g., 10 times less B than rape). On the other hand, among the species tested, rape had the highest concentration of B, Cu and Zn, and maize had the highest concentration of Fe and Mn. In all three tested crops, the differences in the content of B and Zn were greater between species than between cultivars. In the case of Cu, Mn and Fe concentration, the cultivar differences exceeded the species differences. The results suggest that there is no need to take cultivars into account when fertilizing with B and Zn. In contrast, fertilization with Cu, Mn and Fe needs to take into account different requirements of the cultivars for these micronutrients.

1. Introduction

In order to achieve a satisfactory yield, plants should be provided with the proper level of nutrients in the soil. In addition to macronutrients, micronutrients are needed. These elements are needed in small quantities but are absolutely essential for plant life and development. Micronutrients such as boron (B), copper (Cu), iron (Fe), manganese (Mn), molybdenum (Mo) and zinc (Zn) are involved in many metabolic processes in the plant, influencing the optimal use of macronutrients and the overall health and condition of the plant [1].
In addition to being essential for plants, micronutrients are needed by their consumers—humans and animals. Too low levels of these nutrients in food and feed can cause many human and animal diseases. It is estimated that more than two billion people worldwide suffer from a lack of micronutrients, known as “hidden hunger” [2,3]. Iron and zinc deficiencies are the most common [4,5]. These deficiencies occur in people whose daily diet is based on cereal grains, mainly wheat, rice and corn [6]. Such situation occurs in the absence of plant-available forms of micronutrients in the soil, and can be corrected by fertilization.
Different crop species differ in their micronutrient concentration and uptake from the soil. It is generally accepted that plants with higher uptake have higher fertilizer requirements. Many fertilization guides state that the decision to fertilize with micronutrients can be made on the basis of their content in young plants [7,8,9,10]. For this purpose, relevant plant parts (usually whole shoots or leaves) at a strictly defined growth stage are taken, micronutrients are determined, and nutrition of the plants is assessed using the respective critical limits/deficiency limits. If the nutritional status of the plants with micronutrients is insufficient, it should be supplemented by foliar fertilization.
Micronutrient deficiency limits in plants are usually set for individual crop species [11,12,13]. However, within each species there are many cultivars. Breeders, in the search for better yielding, more stress-tolerant or more desirable plants for consumers, create new cultivars every year that meet these expectations. These cultivars may also show significant differences in micronutrient concentration and, thus, require different fertilization.
The literature provides little information on the variation of micronutrient concentrations in staple crop cultivars. Studies performed worldwide have focused mainly on Fe and Zn content in grain. Maganati et al. [14] observed significant differences in the content of Fe and Zn in the grain of 153 rice genotypes. Fe concentrations ranged from 6.9 to 22.3 mg kg−1, while Zn concentrations ranged from 14.5 to 35.3 mg kg−1. Ray et al. [15] showed differences in micronutrient concentration in the grain of many pea, bean, lentil and chickpea cultivars, with significant differences mainly in zinc. Tran et al. [16] showed significant differences in the content of Zn and Fe in the grain of different wheat genotypes. The content of Zn was in the wide range of 86.5–209.0 mg kg−1, and Fe was in the range 51.7–91.8 mg kg−1. Significant differences in B and Cu concentrations in grain and young shoots of several winter wheat cultivars were also observed by Korzeniowska [17] and Korzeniowska and Stanislawska-Glubiak [18]. Genc et al. [19] reported a significant difference in Zn content in young shoots of two winter barley cultivars. According to the literature, the differences in the content of micronutrients in cultivars are genetically and environmentally determined [20]. The main agricultural crops in Poland, along with triticale and rye, are wheat, maize and rape. Wheat is cultivated on 2511 thousand hectares of arable land, maize on 1265 thousand hectares of arable land and rape on 875 thousand hectares of arable land [21]. These three species are the most important representatives of cereal, fodder and oilseed crops in Poland, which together cover more than 40% of the country’s sown area.
Based on our previous research and the literature cited, it was hypothesized that the variation in the micronutrient content in plants between cultivars of the same species may be similar or even greater than the differences between species. The aim of our study was to investigate the concentration of microelements in young plants of a dozen varieties of winter wheat (Triticum aestivum L.), maize (Zea mays L.) and winter rape (Brassica napus L.) and to verify our hypothesis on the basis of the data obtained in this way.

2. Materials and Methods

2.1. Sample Collection

In 2016–2018, samples of plants and soil were taken from the fields of winter wheat, winter rape and maize in order to compare the concentrations of micronutrients in species and cultivars. In total, 12 wheat, 10 maize and 12 rape cultivars were included in the study. Samples taken within one cultivar were treated as replications. The number of replications and the characteristics of the cultivars are shown in Table 1, Table 2 and Table 3. The smallest number of samples (replications) within one cultivar was 10 (Table 2). A total of 481 plant–soil pairs were collected from wheat fields, 141 from maize fields and 328 from rape fields. All the samples were collected by accredited sample takers from 16 Polish provinces, usually one plant–soil pair from each “gmina”, the smallest administrative unit. Sampling points were quite evenly distributed throughout Poland (Figure 1).
Wheat was sampled from an area of 1 m2, maize was sampled from an area of 8 m2 and rape was sampled from an area of 4 m2. Whole shoots of wheat were cut 2 cm above the ground at the beginning of stem elongation stage (BBCH 30/31). The shoots of the other two plants were cut 5 cm above the ground; maize, when the plants reached a height of 25–30 cm (BBCH 14–15); and rape, in the period from the beginning of the main stem elongation stage to the appearance of the first internode (BBCH 30/31) [22]. Each wheat sample consisted of a minimum 80 shoots, and maize and rape of a minimum of 20 shoots. At the same time as the plant samples, corresponding soil samples were taken. Each soil sample was created by mixing five sub-samples taken with a soil sampler to a depth of 20 cm.

2.2. Soil and Climate Characteristic

All plant–soil sample pairs were taken from fields where the pH was in the range 5–7 and the fraction content < 0.02 mm in the range 10–35%. Very acidic and alkaline soils and very light and very heavy soils were not sampled. Extreme conditions were avoided because pH and soil texture have such a strong influence on the uptake of micronutrients by plants that they could distort the picture of their content in the species and cultivars studied [23]. The characteristics of the soil samples taken are shown in Table 4.
Poland is located in a temperate transitional climate zone, with an average annual air temperature of 8.7 °C and a total rainfall of 609 mm (1991–2020) [24]. In 2016 and 2017, air temperature and rainfall during the growing season were higher than the climatological normal; in 2018 they were close to the climatological normal.

2.3. Chemical Analysis

B, Cu, Fe, Mn and Zn were determined in all plant and soil samples. Micronutrients in plants were determined by the FAAS method, having first dry ashed the material in a muffle furnace and digested it with 20% nitric acid [25]. The exception was B, which was determined by the ICP-AES technique.
Micronutrients in the soil were determined by Mehlich 3 method [26,27,28]. During extraction, the ratio of soil to solution was 1: 10, and shaking time on the rotary stirrer was 10 min at 35/40 rpm. The Cu, Fe, Mn and Zn content of the extract was determined using the FAAS technique and the B content using the ICP-AES technique. Moreover, in soil samples the pH was established potentiometrically in 1 mol KCl dm−3 [29], total organic carbon (TOC) was determined by Turin method using potassium dichromate [30] and the soil texture was determined by laser diffraction method.
All chemical analyses were performed in state agrochemical laboratories certified by the Polish Centre of Accreditation [31], which ensured high reliability of the analyses.

2.4. Statistical Analysis

Mean micronutrient concentrations for the species tested were calculated from all samples taken, where n = 481 for wheat, 141 for maize and 328 for rape. Mean micronutrient concentrations for the cultivars were calculated from replicates within each cultivar.
To test the significance of differences in micronutrient concentrations between species and cultivars, an ANOVA test was performed using Statgraphics v 5.0 software (StatPoint Technologies, Inc., Warrenton, VA, USA). Multiple comparisons among groups were made with Tukey’s significant difference test (p < 0.05).

3. Results

3.1. Average Soil Micronutrient Content

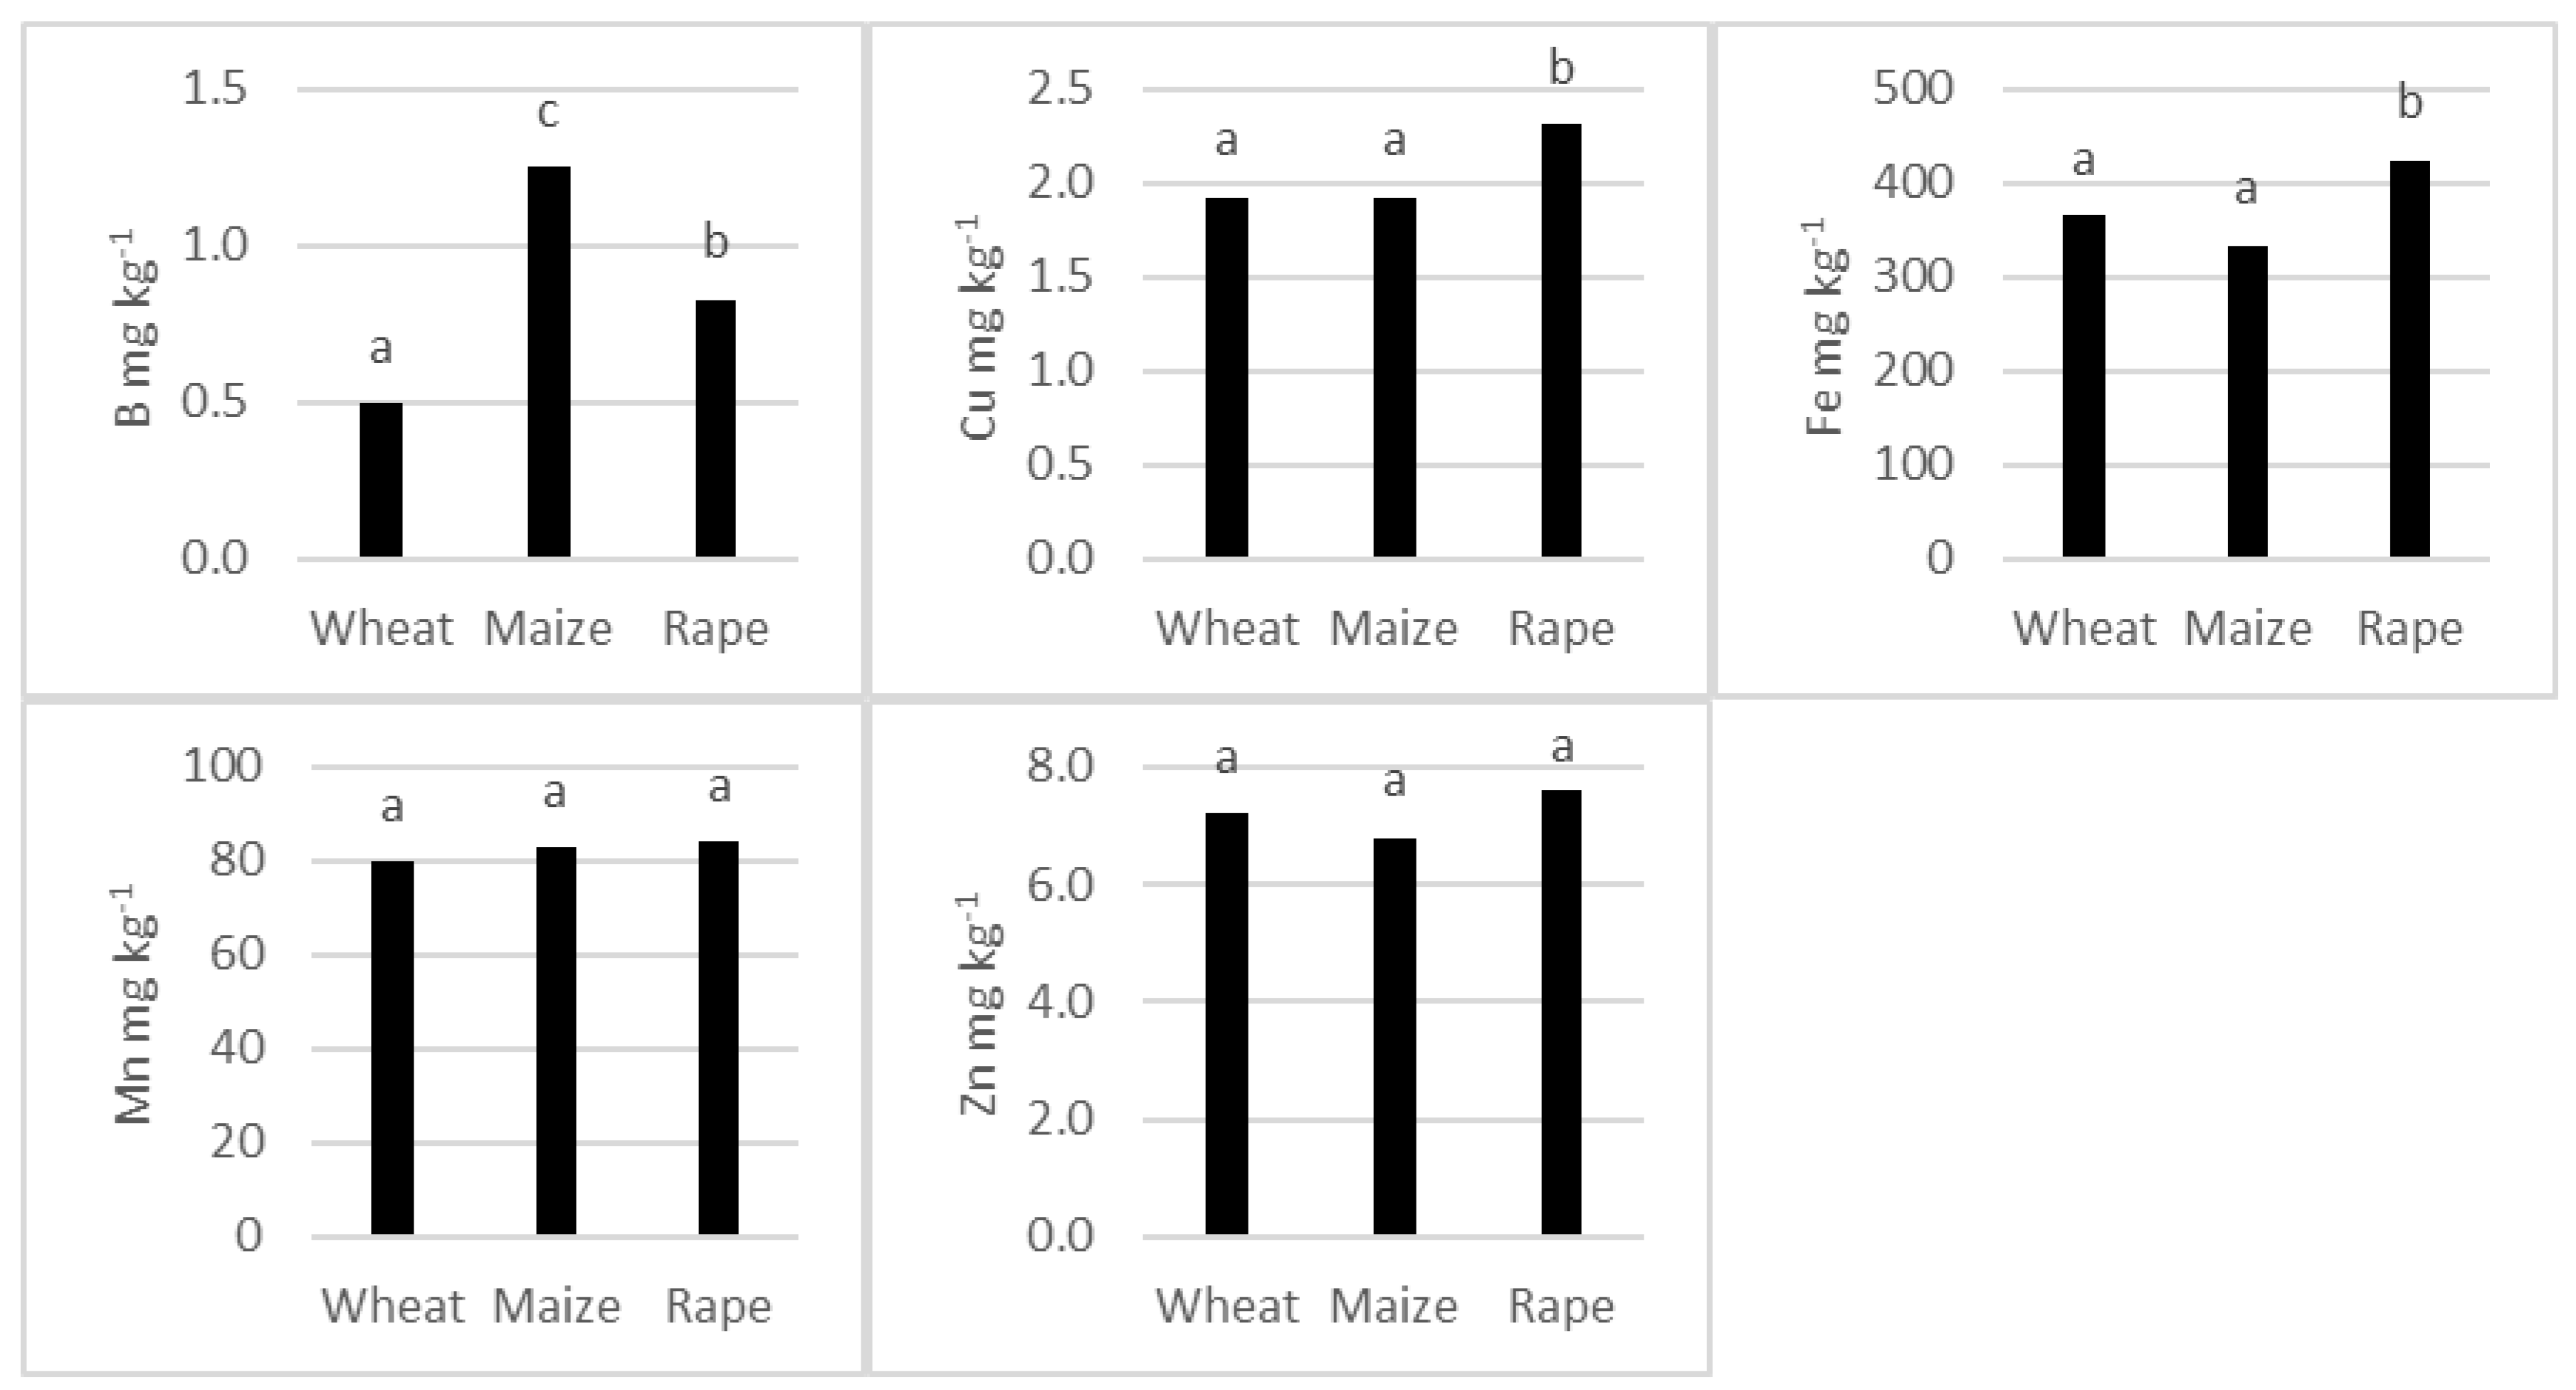
The soil taken from the fields where wheat, maize and rape were grown differed significantly in the mean concentration of B, Cu and Fe, while there were no differences in the content of Mn and Zn (Figure 2).
The concentration of B in soil from maize fields was more than twice as high as in soil from wheat fields and 50% higher than that from rape fields. Soil Cu levels were the same in wheat and maize fields, while rape fields had about 20% higher soil content of this micronutrient. Similarly to Cu, soil Fe concentration did not differ significantly between wheat and maize fields, and soil from rape fields was about 20% richer in Fe.
Despite differences in micronutrient content in the fields where the studied plants grew, no deficiency was found anywhere. The concentration of B, Cu, Fe, Mn and Zn in the soil was sufficient for all three species according to Polish standards [32].

3.2. Average Concentration of Micronutrients in the Shoots of the Studied Species

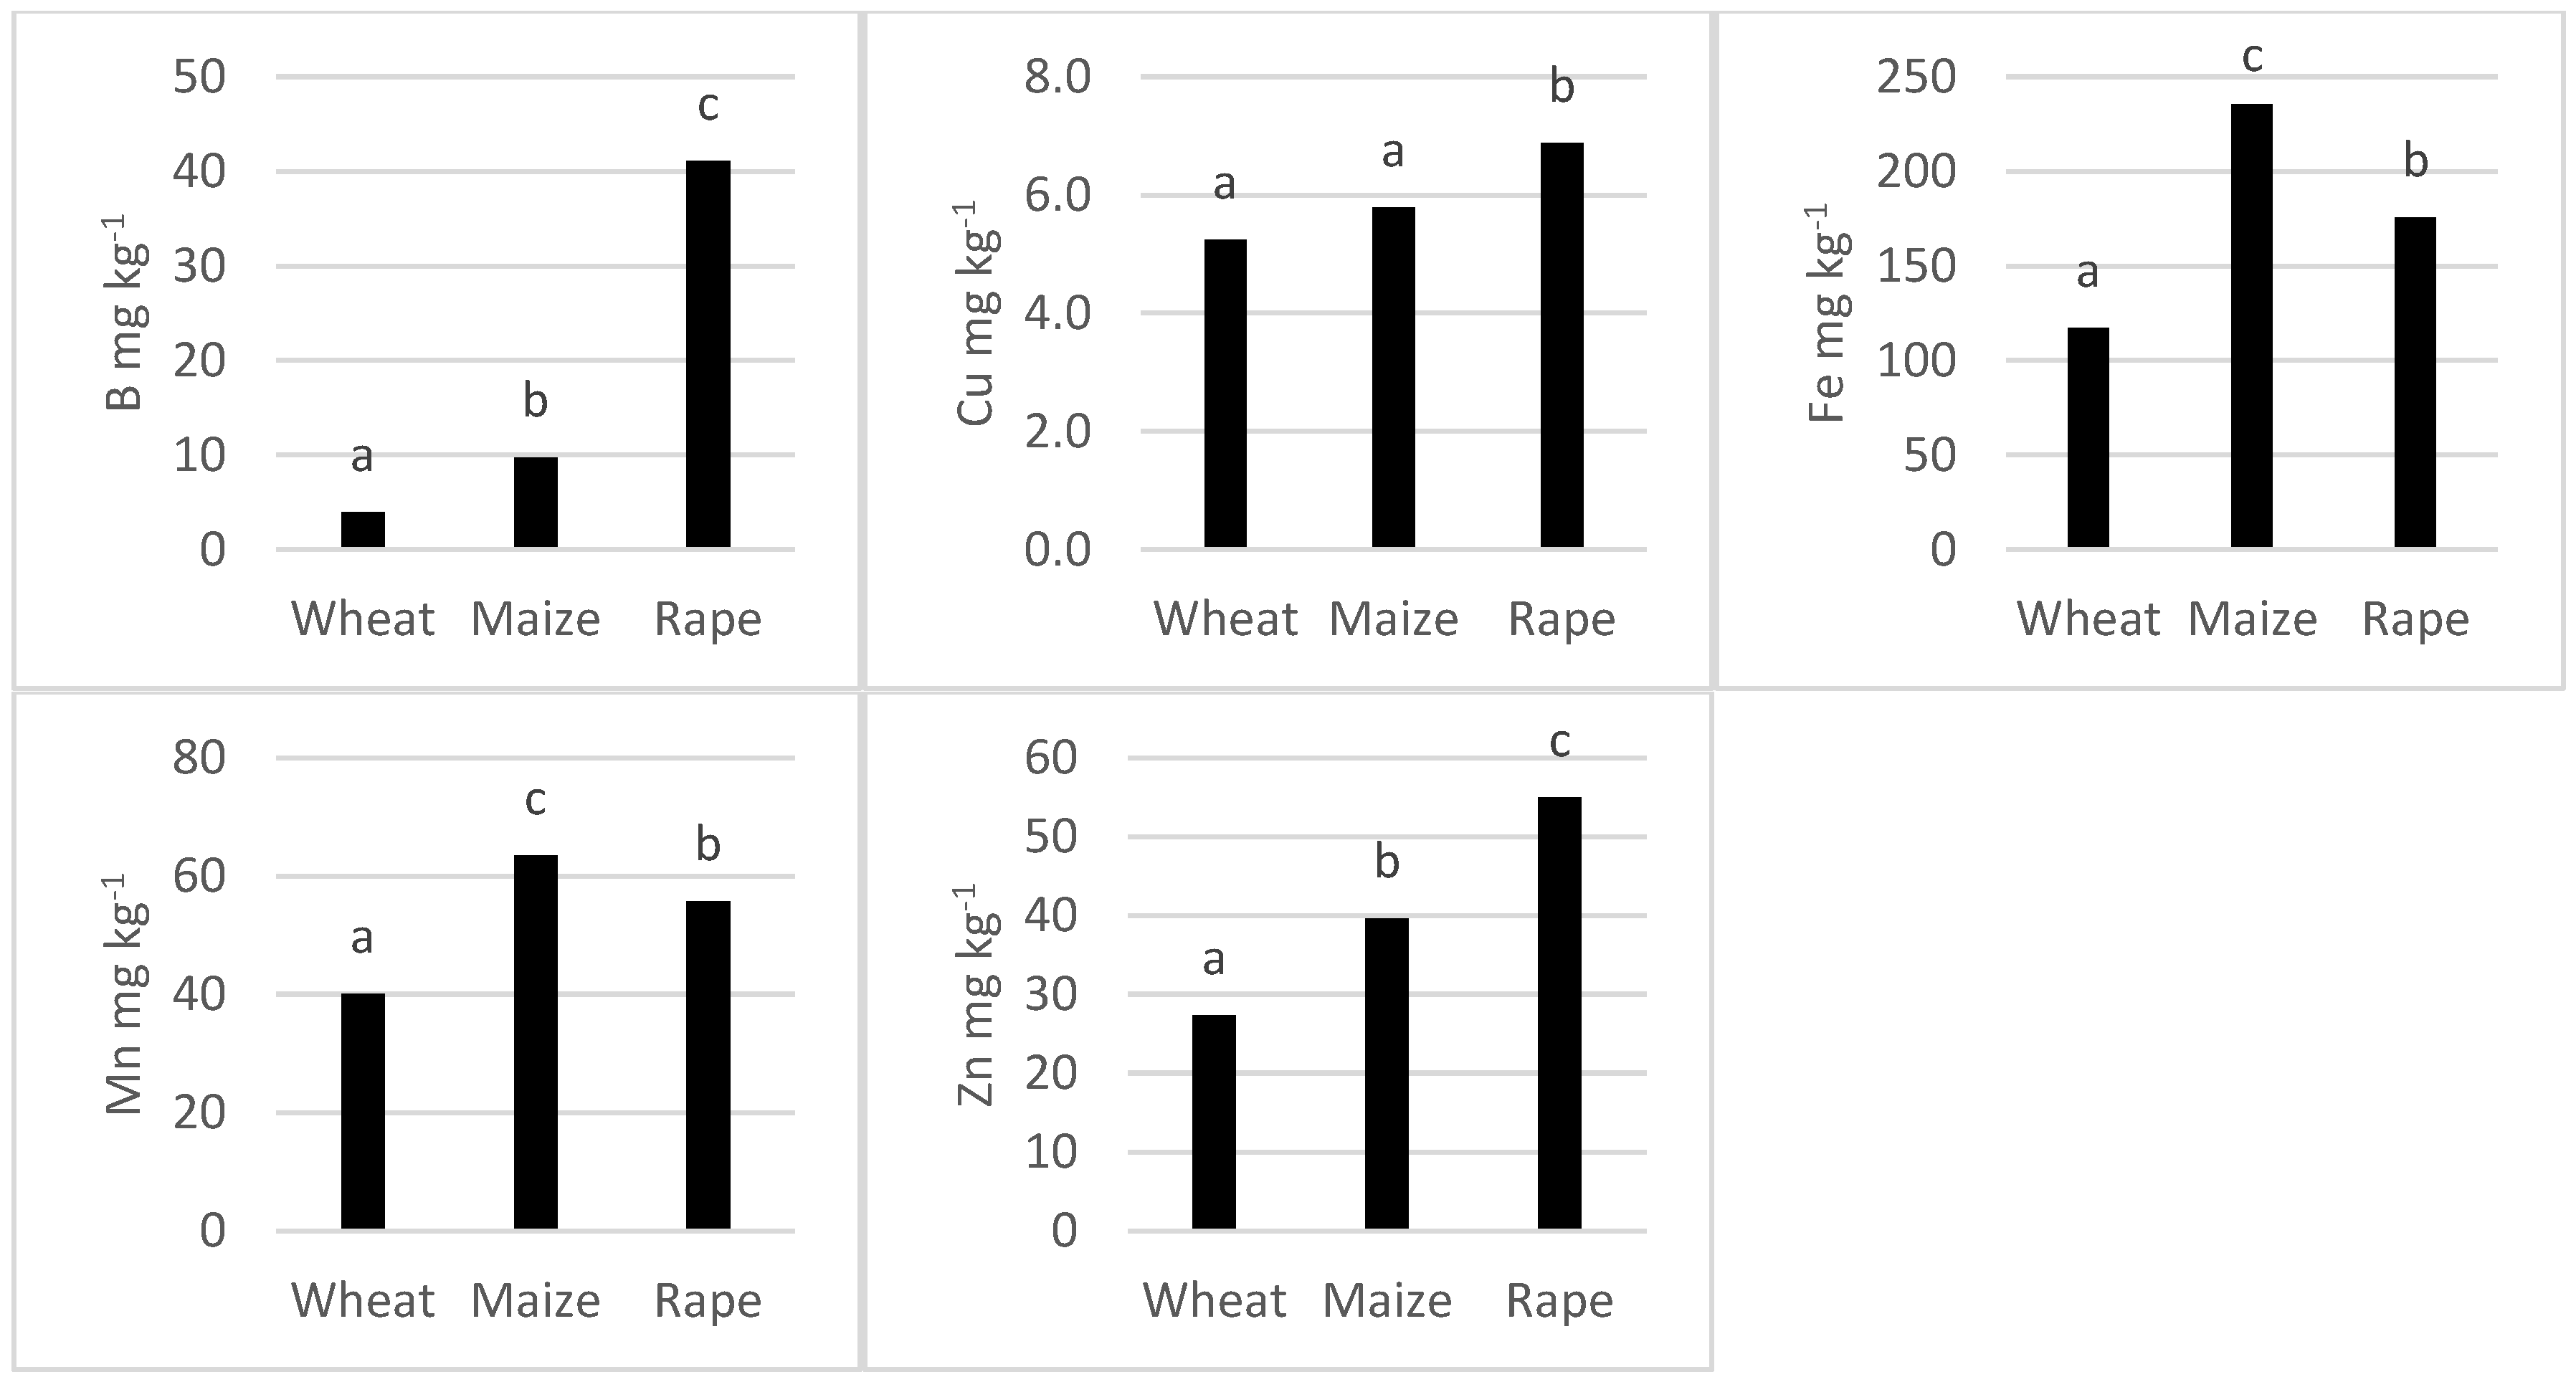
The average concentration of micronutrients in wheat, maize and rape shoots differed significantly, with wheat containing the least of each element tested (Figure 3). The greatest interspecies differences occurred in B and Zn contents. B concentration was ten times higher in oilseed rape and two times higher in maize than in wheat. In addition, Zn was twice as high in oilseed rape and 1.5 times higher in maize than in wheat.
The smallest differences between the plants were in the Cu content. There was no statistically significant difference between wheat and maize, and rape contained only 1/3 more of this element than wheat.
The concentration of Fe and Mn was the highest in maize, which contained twice as much Fe and 60% more Mn than wheat. On the other hand, rape contained 50% more Fe and 40% more Mn than wheat.

3.3. Average Concentration of Micronutrients in the Different Cultivars of the Species Tested

3.3.1. Wheat

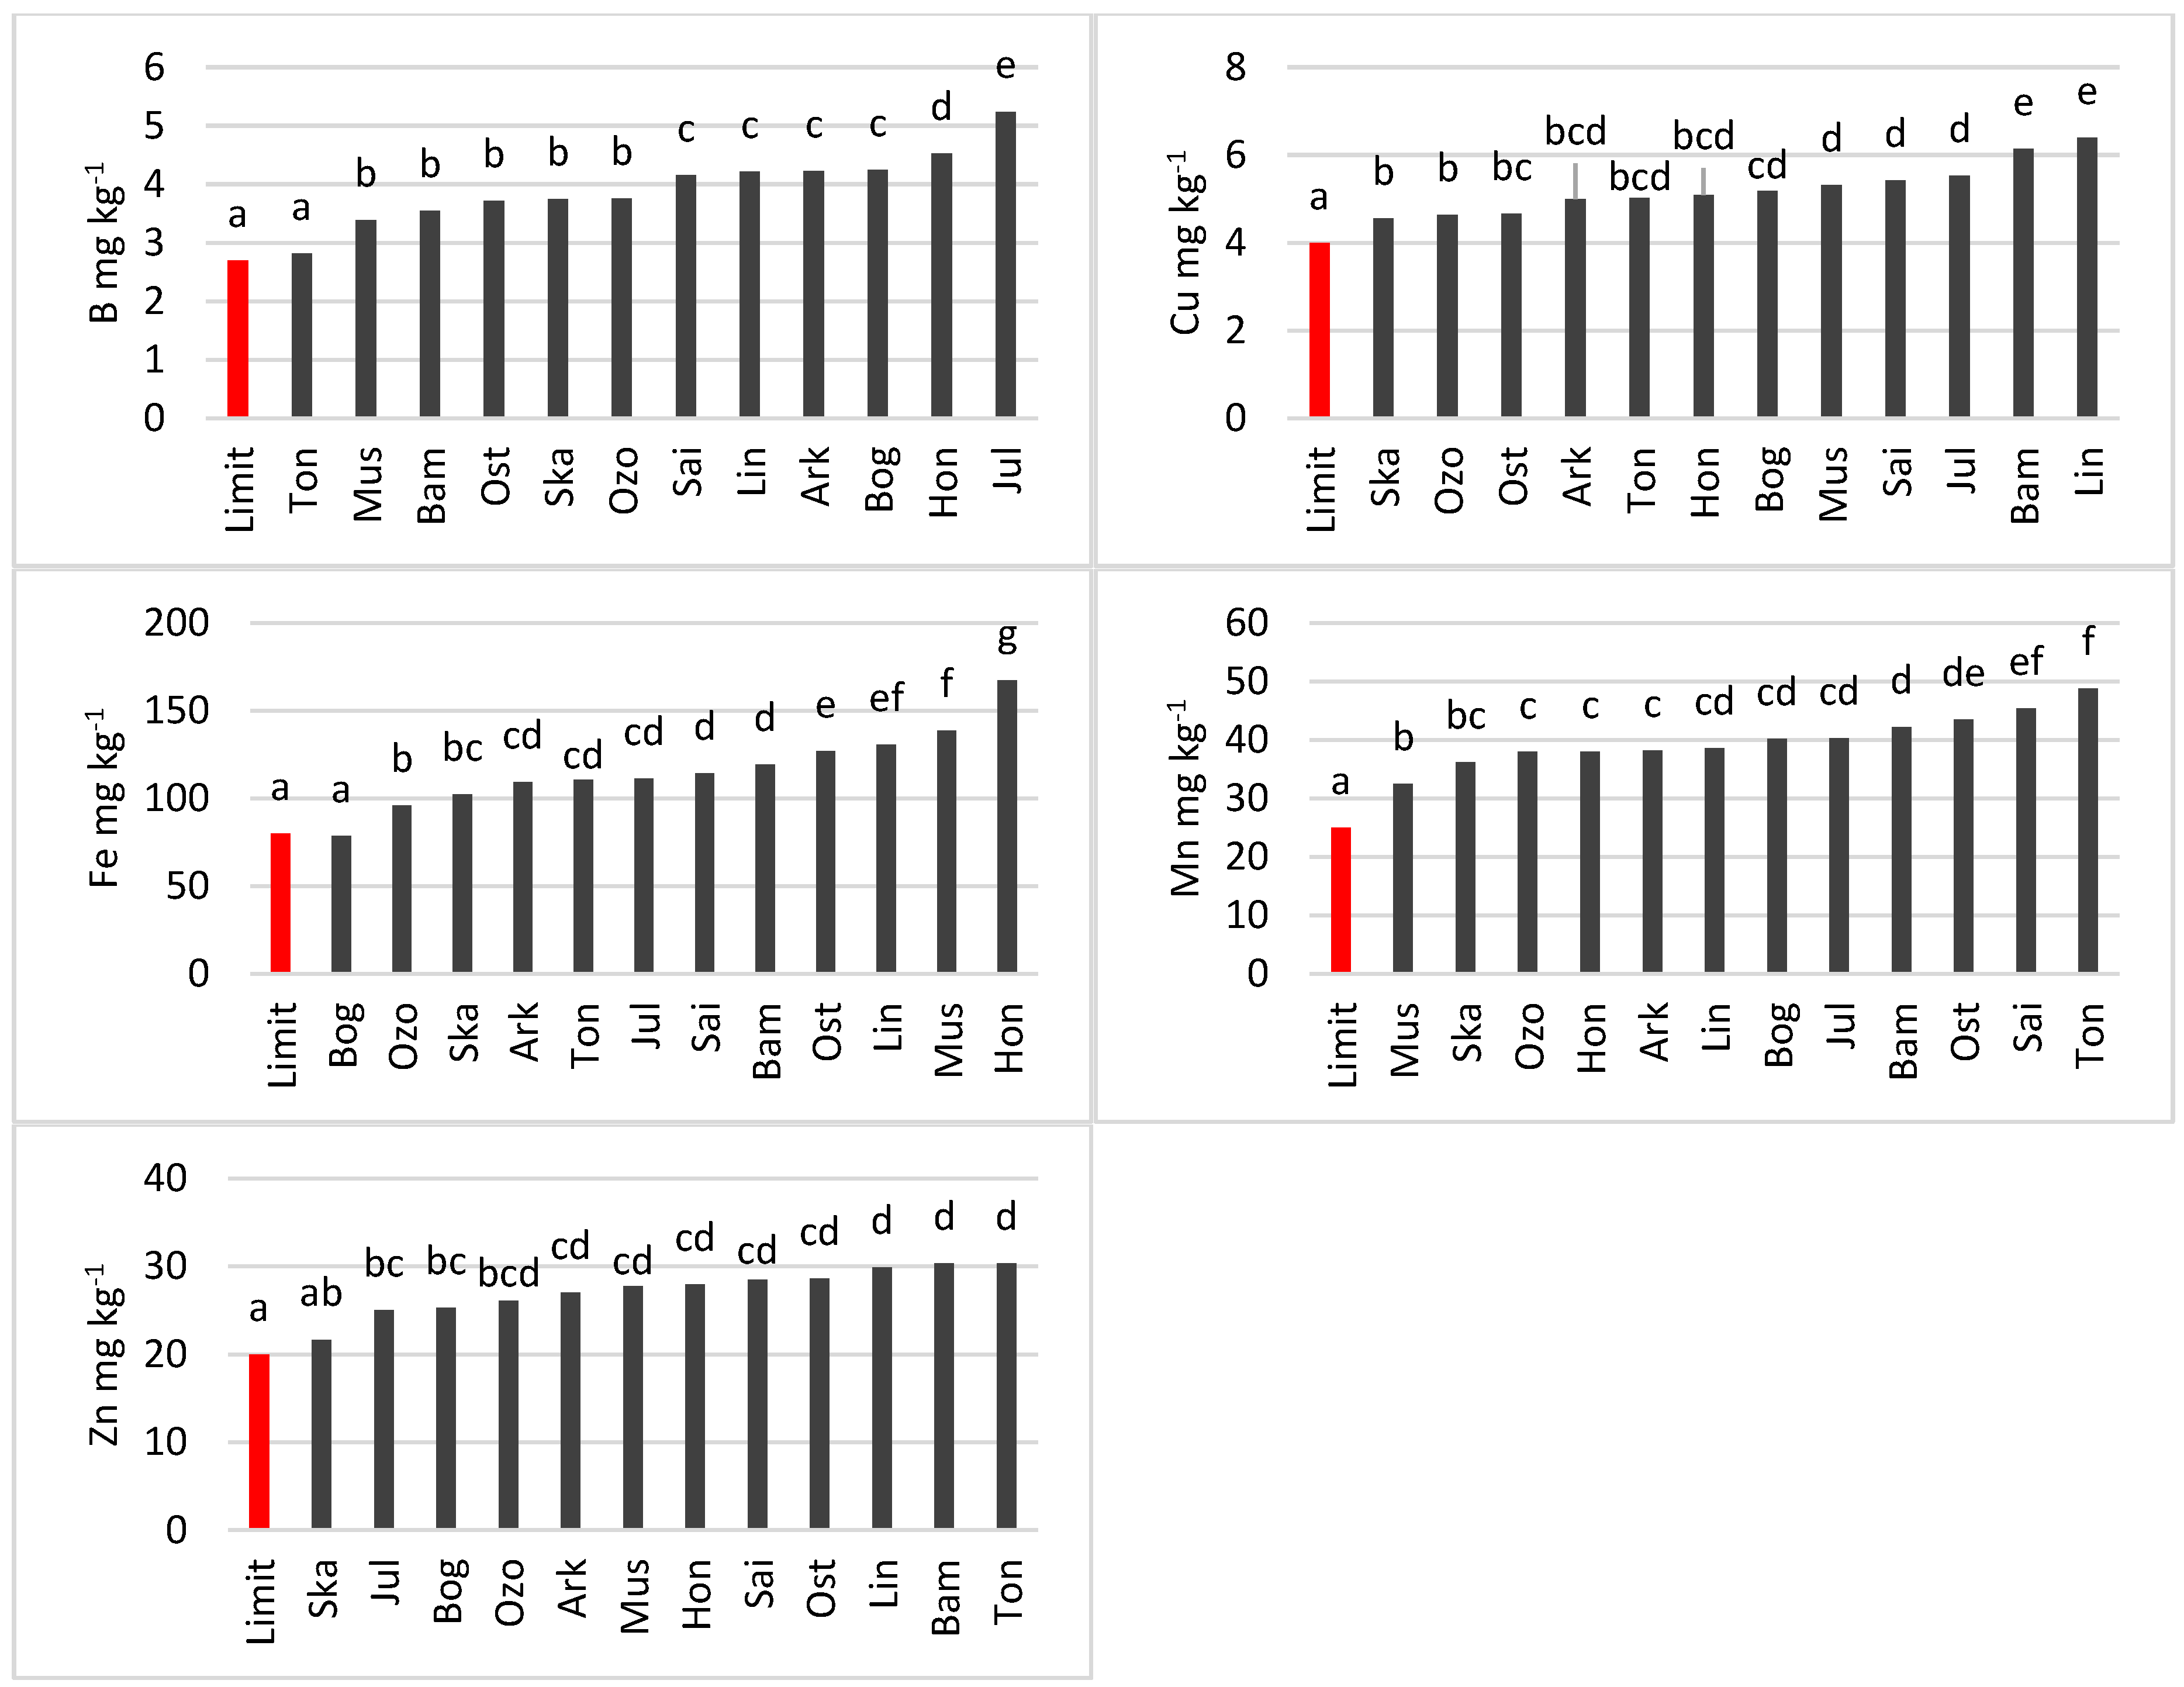
The wheat cultivars tested were sufficiently supplied with all micronutrients (Figure 4). No lower concentrations were found in the shoots than the deficiency limits set by Korzeniowska et al. (2020). However, the individual cultivars differed in their micronutrient levels. For each micronutrient, it was possible to distinguish groups of cultivars with similar contents of this element, i.e., cultivars between which there were no significant differences. In contrast, significant differences were observed among groups. In some cases, one cultivar was classified in two or even three groups (Figure 4).
The lowest concentration of B was recorded in the shoots of the cultivar Tonacja (2.8 mg kg−1), which alone formed the first group (a). The average concentration of B in the second group of cultivars (b), which included Muszelka, Bamberka, Ostka, Skagen and Ozon, was 3.6 mg kg−1. Sailor, Linus, Akcadia and Bogatka formed the third cultivar group (c) with an average B concentration in shoots of 4.2 mg kg−1. Hondia as an independent group (d) contained 4.5 mg kg−1, and Julius, with the highest B concentration (5.2 mg kg−1), belonged to the last group (e).
The group with the lowest Cu concentration included the cultivars Skagen and Ozon (average concentration of 4.6 mg kg−1), while Linus and Bamberka contained the highest amount of this element (6.2 mg kg−1).
The greatest significant difference in Fe concentration occurred between the first group (a), whose sole representative was Bogatka (78 mg kg−1) and the last group (g), represented by Hondia (167 mg kg−1). The remaining cultivars formed seven groups (b, bc, cd, d, e, ef and f), with Fe concentrations ranging from 96 to 139 mg kg−1.
In the case of Mn, the Muszelka cultivar alone formed the group with the lowest concentration of this nutrient (33 mg kg−1), while Tonacja formed the group with the highest concentration (49 mg kg−1). The other cultivars formed six groups in which Mn concentration ranged from 36 to 45 mg kg−1.
The lowest concentration of Zn in the shoots was presented by the cultivar Skagen (22 mg kg−1), while the group which included the cultivars Linus, Bamberka and Tonacja contained the highest amount of this nutrient (average 30 mg kg−1). The Zn concentration in the other cultivars ranged from 25–29 mg kg−1.

3.3.2. Maize

Evaluation of the supply of micronutrients to maize using the limits developed by Korzeniowska et al. (2020) showed that it was sufficient, except for one case concerning Cu in the cultivar Nimba (Figure 5).
The concentration of B in maize shoots ranged from 7.5 mg kg−1 for the first group of cultivars (a), represented by Glejt and Opoka, to 13.3 mg kg−1 in the cultivar Danubio, which alone formed the last group (e).
The Cu concentration in maize shoots was lowest in the aforementioned Nimba cultivar at 4.2 mg kg−1. Nimba’s Cu supply was too low, as the limit is 4.8 mg kg−1. The highest Cu concentration (average 7.6 mg kg−1) was in the group formed by Subito and Danubio (e).
The Fe concentration in plants of the first group (a), which was formed by one cultivar, Subito, was 139 mg kg−1 and was much lower compared to the other cultivar groups. The cultivars Ulan and P8400 belonged to the group with the highest concentration of this element, averaging 282 mg kg−1 (e).
The variability of Mn in the shoots of the maize cultivars tested was relatively low. As many as seven cultivars (Subito, Danubio, Reduta, Glejt, Rosomak, Legion and Ulan) did not differ significantly (groups b and bc). In contrast, the cultivar P8400 stood out as having the highest concentration of Mn (83 mg kg−1).
The concentration of Zn in maize shoots ranged on average from 34.5 mg kg−1 for Glejt and Legion (group b) to 47.5 mg kg−1 for Danubio and Nimba (group f).

3.3.3. Oilseed Rape

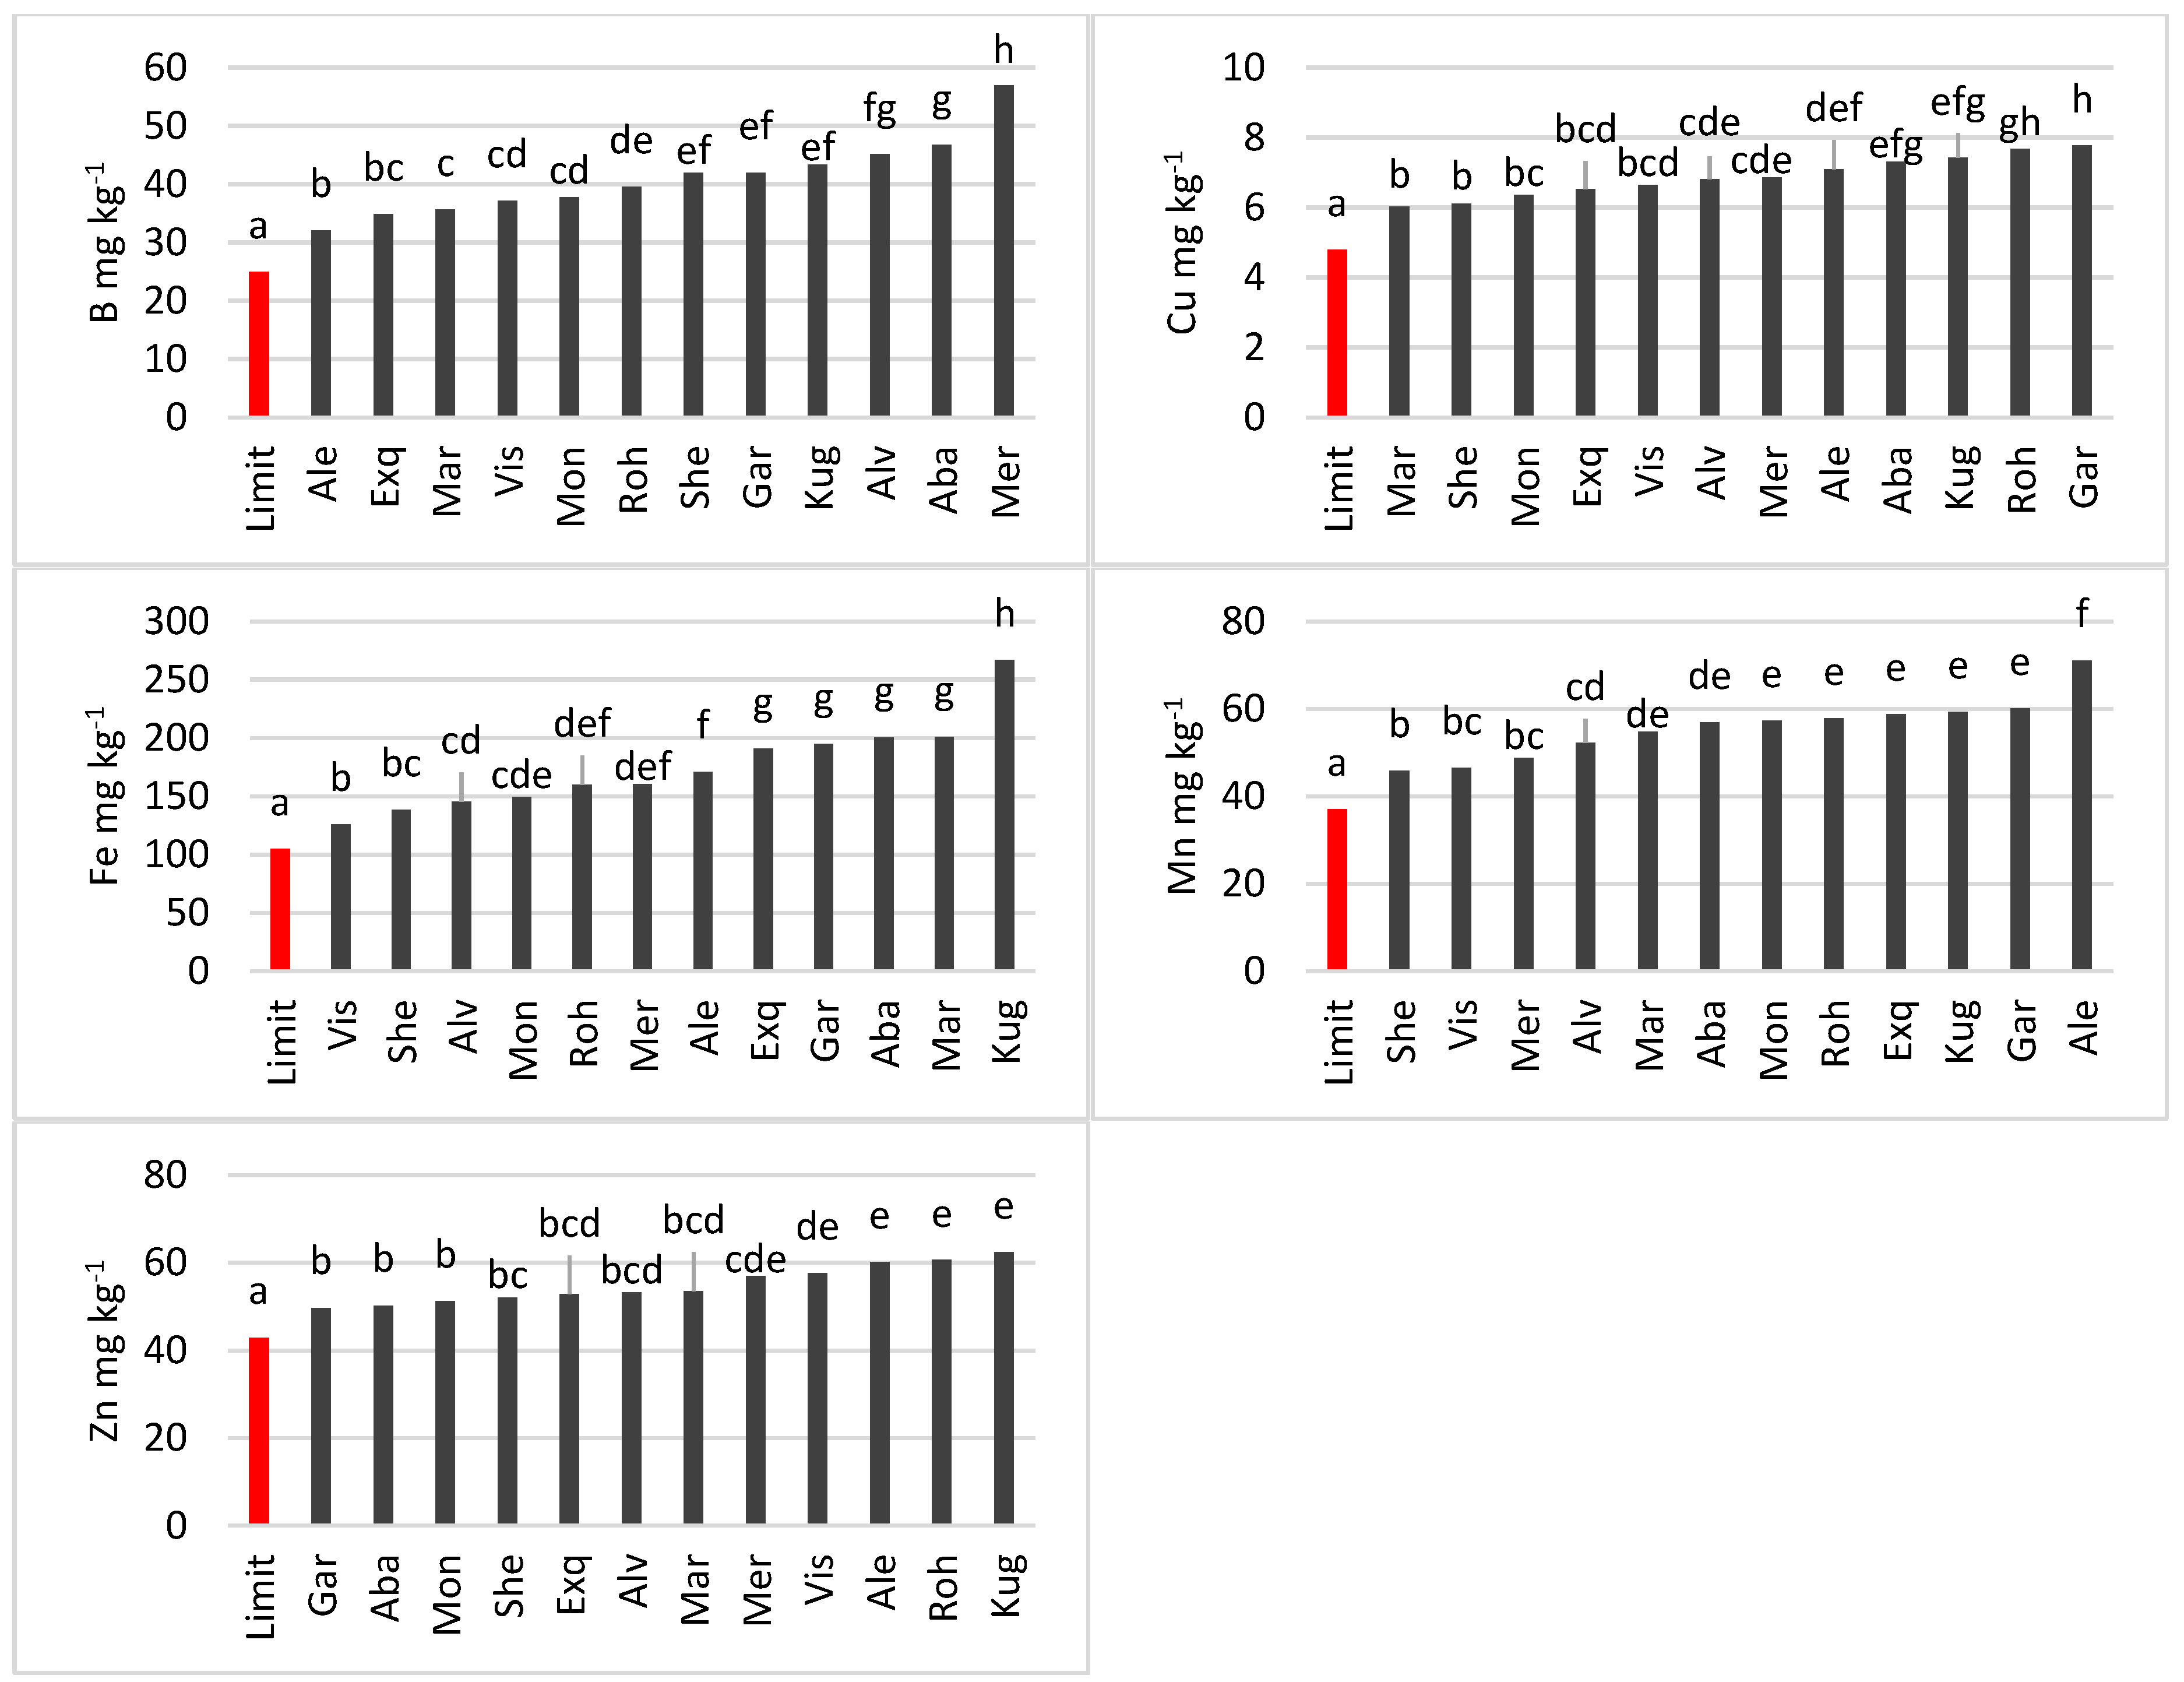
All rape cultivars were characterized by shoot micronutrient contents above the critical limits provided in Korzeniowska et al. (2020) (Figure 6).
The B concentration ranged from 32 mg kg−1 for the cultivar Alexander (b) to 57 mg kg−1 for the cultivar Mercedes, which formed the last group (h) on its own. The other cultivars belonged to as many as seven groups, indicating a wide variation of B in rape shoots.
Cu content varied less than B content. In the group of cultivars that included Marcopolos and Sherlock (b), an average Cu concentration was 6.1 mg kg−1. The highest concentration of this element (7.8 mg kg−1) was presented by Garou (h).
The Fe concentration ranged from 126 mg kg−1 for Visby (b) to 267 mg kg−1 for Kuga (h). The Fe concentration in the Kuga cultivar was as much as 35 % higher than in the cultivars of the previous group (g), which included Exquisite, Garou, Abakus and Marcopolos (average 197 mg kg−1).
The Sherlock cultivar (b) had the lowest concentration of Mn (46 mg kg−1), while the Alexander cultivar, which on its own formed a group that differed significantly from the other groups, contained the most of this micronutrient (71 mg kg−1).
Zn concentration ranged from 51 mg kg−1 for the Garou, Abacus and Monolith (b) cultivar group to 61 mg kg−1 for the Alexander, Rohan and Kuga (e) cultivars.

3.4. Comparison of Cultivar and Species Diversity

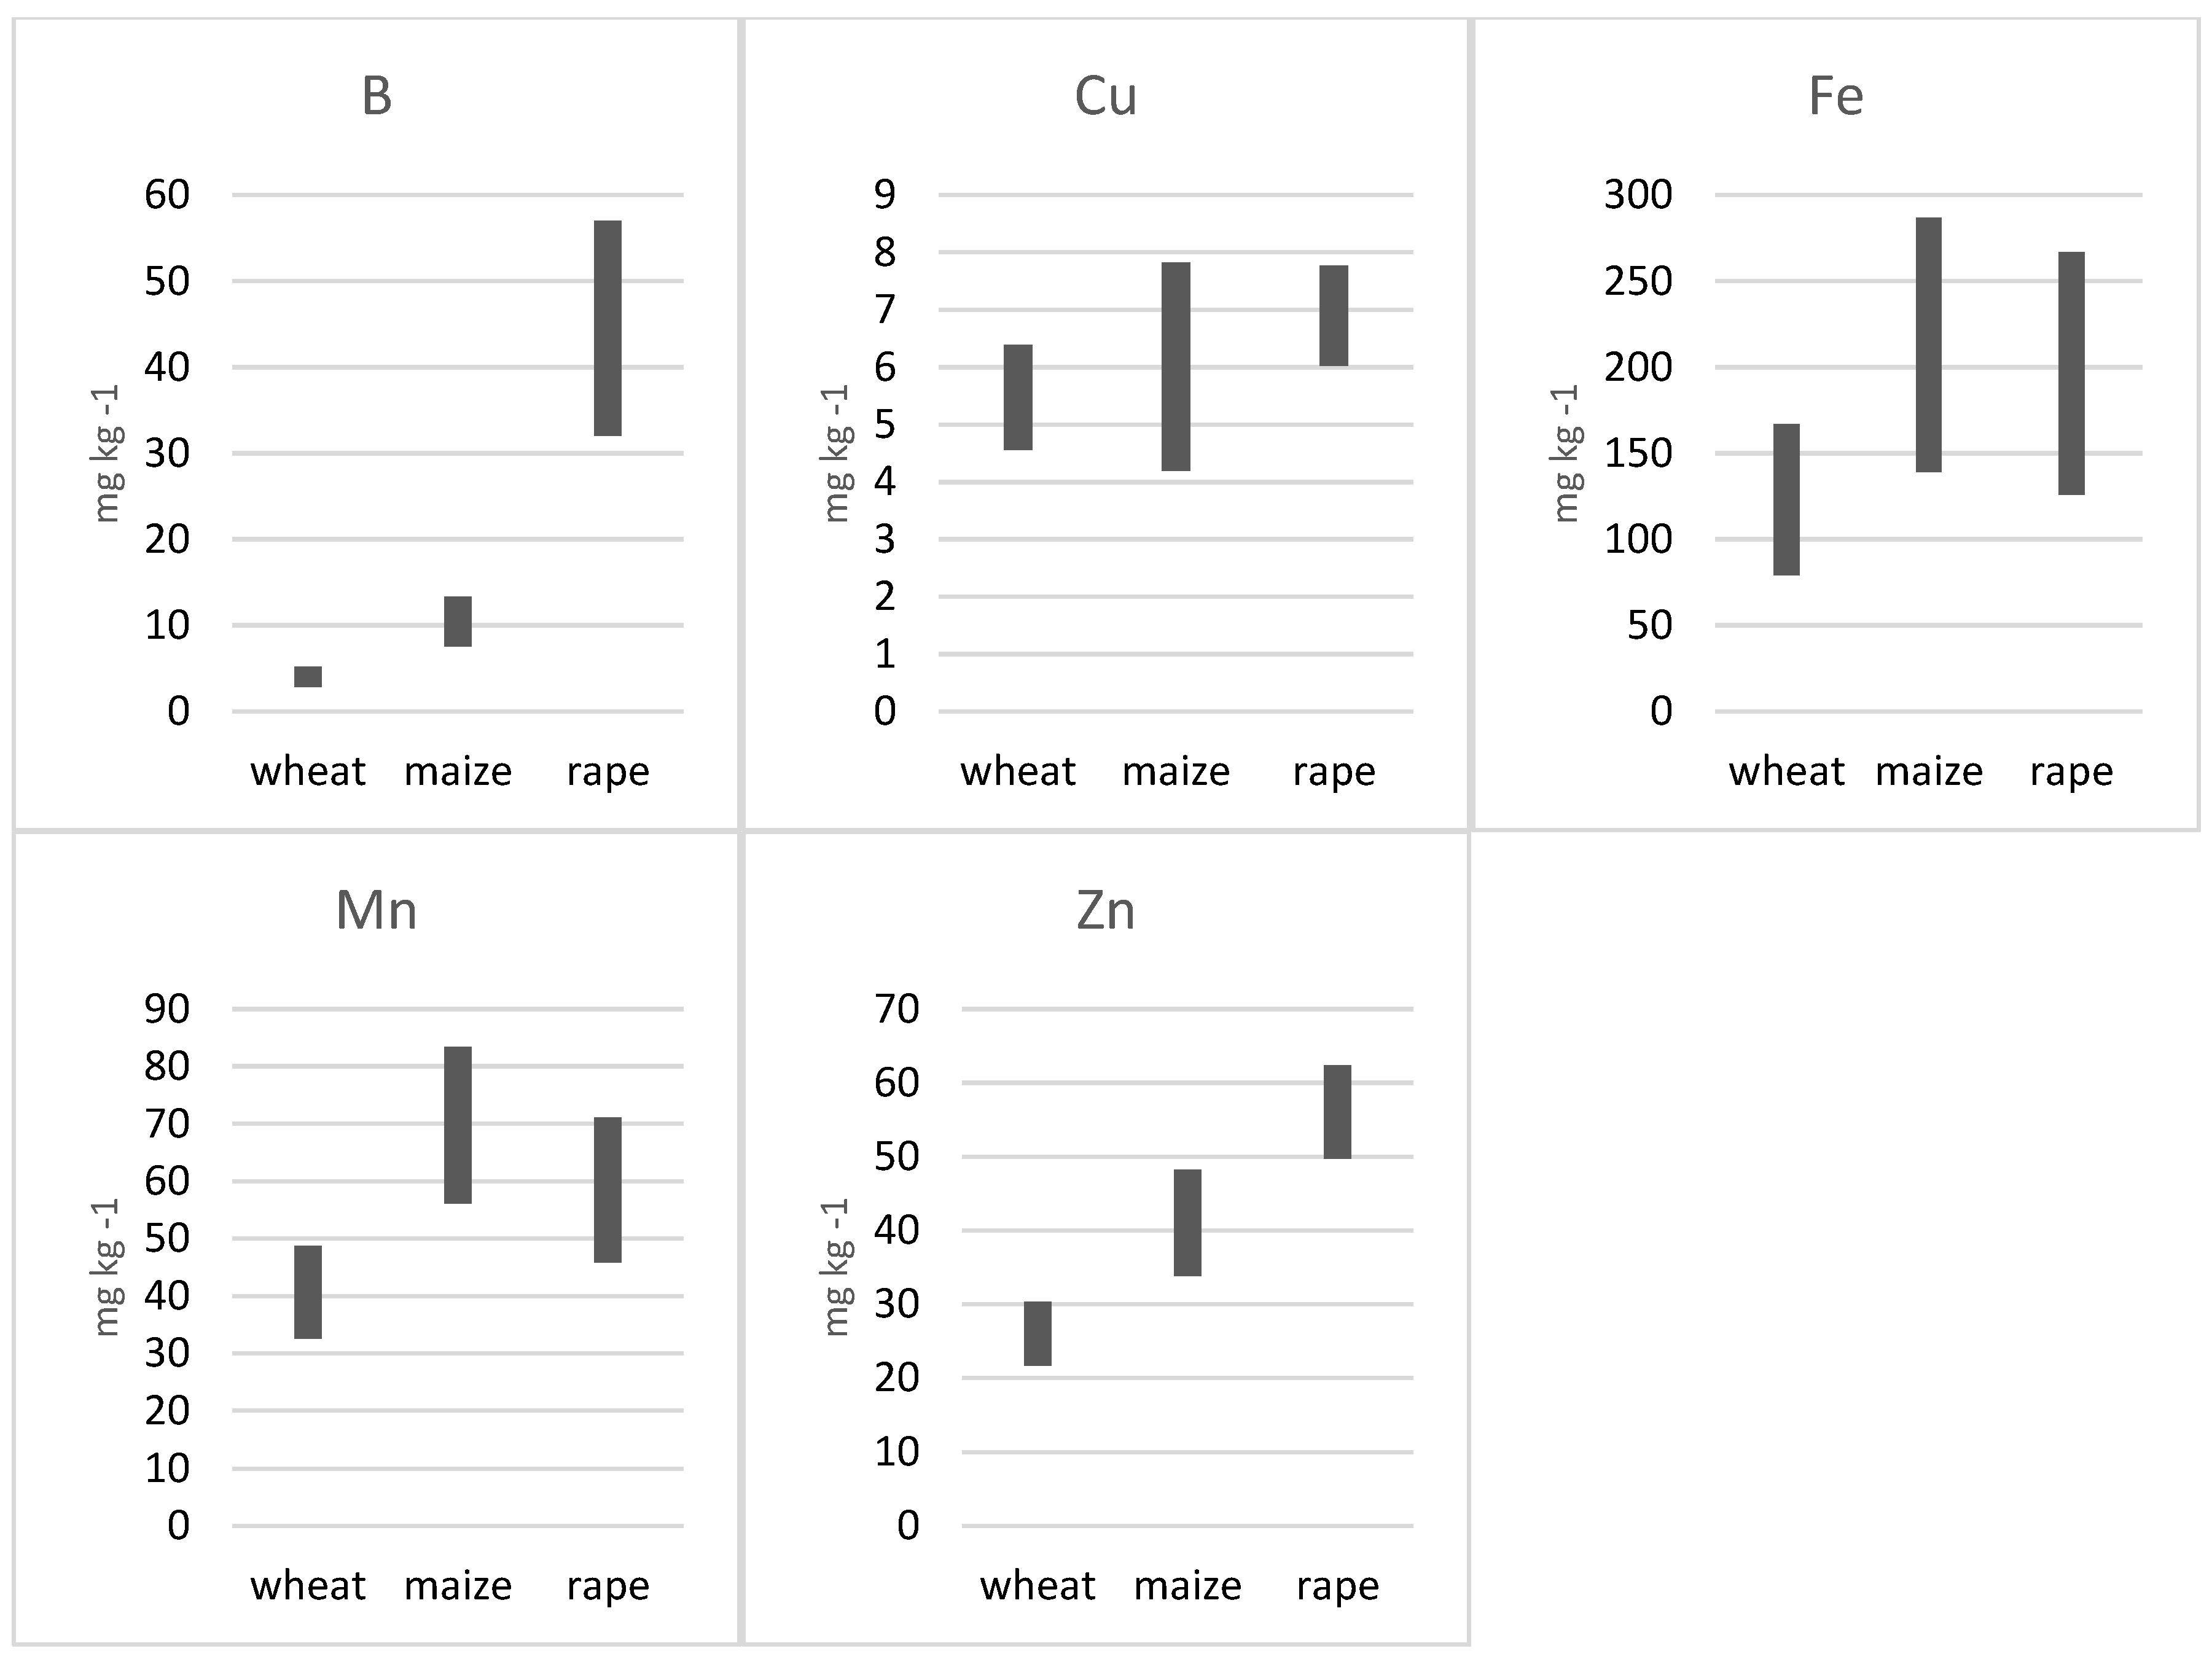
The ranges of microelements in the shoots of the studied species presented in Figure 7 were determined on the basis of the micronutrient concentrations in cultivars. It was observed that for some micronutrients, the ranges for wheat, maize and rape partially overlapped, and for other micronutrients were completely divergent. The greatest difference between species was found for B. The range of B in rape (32–57 mg kg−1) differed significantly from that found in wheat and maize. At the same time, the concentration of B in all maize cultivars (7.5–13.3 mg kg−1) was higher than in wheat cultivars (2.8–5.2 mg kg−1).
The species tested were much less variable in Cu concentration than B. The range of Cu in maize (4.2–7.8 mg kg−1) was broad enough to include the ranges found in wheat (4.6–6.4 mg kg−1) and rape (6.0–7.8 mg kg−1).
The ranges of Fe in maize (139–287 mg kg−1) and rape (126–267 mg kg−1) largely overlapped with each other, but only slightly with wheat (79–167 mg kg−1). The concentration of Mn found in wheat cultivars (33–49 mg kg−1) differed from the concentrations observed in maize (56–83 mg kg−1) and rape (46–81 mg kg−1), which were higher than in wheat and largely overlapped with each other.
The ranges of Zn concentration were separate for each species and did not overlap. The lowest range of Zn was found in wheat shoots (22–30 mg kg−1) and the highest range was found in canola shoots (50–62 mg kg−1).
Table 5 shows the differences between the cultivars with the lowest and the highest average concentrations of the five micronutrients tested. These differences depended on the plant species. Undoubtedly, the smallest differences in micronutrient concentration among cultivars were observed for wheat.
For rape and maize, the differences among cultivars were clearly greater than for wheat. For both of these species, the differences among cultivars for Fe, Mn and Zn were similar. Furthermore, it was observed that rape showed greater variation in B concentration and smaller Cu concentration compared to maize.
Table 6 shows the differences between the average micronutrient concentrations in the plants for each pair of species tested. The greatest differences in B, Cu and Zn concentrations were observed for the wheat–maize pair, while the greatest variation in Fe and Mn concentrations occurred between wheat and maize.
Using the data from Table 5 and Table 6, it can be confirmed whether greater differences in micronutrient concentrations occurred between species, or between cultivars within a species. For this purpose, the values of these differences for a given pair of species were compared with the values for the cultivars of each species in the pair. For example, the difference in average Cu concentration between species for the wheat–maize pair is 0.6 mg kg−1 (Table 6), while the difference among wheat cultivars is 1.8 mg kg−1, and among maize cultivars it is 3.6 mg kg−1 (Table 5). From this comparison, we conclude that there are greater differences among cultivars than between species of the wheat–maize pair.

4. Discussion

4.1. Soil and Weather Conditions

All cultivars of the three plant species tested grew under similar conditions of pH, texture and TOC content (Table 4), those soil features that have a strong influence on the bioavailability of micronutrients to plants [33,34]. The same was also true of the concentration of bioavailable forms of Mn and Zn in the soil from the fields of all three species. However, for B, Cu and Fe there were some differences between the growth sites of each species, with the greatest variation in B in soil (Figure 2). Wheat had the least available B forms in soil, followed by rape, and maize had the most. The concentrations of Cu and Fe in the soil were the same in the fields of wheat and maize, and significantly higher in fields of rape. It should be noted, however, that no soil micronutrient deficit was shown for any of the species tested. The concentrations of bioavailable B, Cu, Fe, Mn and Zn were sufficient for all three species according to Polish current standards for assessing soils in micronutrients [32].
The lack of micronutrient deficiency in the soil was also confirmed by their concentration in plant shoots. The concentration of micronutrients in plants, compared with the respective deficiency limits, showed a sufficient supply of these nutrients for wheat, maize and rape cultivars. (Figure 4, Figure 5 and Figure 6).
Of the three species studied, rape is the most sensitive to B deficiency and has the highest demand for this nutrient [35]. Although the soil B concentration in rape fields was significantly lower than in maize fields, no B deficiency was found in the shoots of any rape cultivar (Figure 5).
Similar pH, texture and TOC in the soils sampled and the absence of micronutrient deficits in both the soils and the shoots of the cultivars leads us to believe that soil conditions were not a factor that significantly influenced the differences between species and cultivars in the concentration of micronutrients in the shoots. This is confirmed by the correlation between the soil features and the concentration of microelements in shoots, which was insignificant or low (r ≤ 0.19) (Table 7). The exception was the content of Mn in wheat and maize shoots, which was dependent on the soil pH at the level of r = −0.30.
In addition to soil properties, precipitation and temperature during the growing season have an impact on the uptake and concentration of microelements in plants. Abundant rainfall and optimal temperature favor the production of large biomass, which may be associated with a reduction in the content of microelements due to the so-called dilution effect, especially in the case of a deficiency of micronutrients in the soil. The local weather conditions at the sampling sites were certainly a factor that also influenced the variability of the micronutrient concentration in plants. Nevertheless, it was not possible to eliminate this factor from the research. It was assumed that, despite some variation in weather conditions, the average micronutrient concentrations calculated from several hundred samples reliably reflect the real differences in micronutrient concentrations between species and cultivars.

4.2. Concentration of Micronutrients in the Plant Species Studied

In the present study, very extensive research material was used, which influenced the high reliability of the results. The average concentration of micronutrients in the shoots of the plant species studied was calculated on the basis of many samples taken for a dozen cultivars: for wheat 12 cultivars where used (481 samples); for maize 10 culivars (141 samples); and for rape 12 culitvars (328 samples) (Table 1, Table 2 and Table 3).
In general, rape and maize showed significantly higher concentrations of micronutrients in the shoots than wheat (Figure 2). The high concentrations of B and Zn in rape and Fe in maize are particularly noteworthy. This corresponds to some extent to the nutritional requirements of these species. The known high sensitivity of rape to B deficiency and the fairly high sensitivity of maize to Fe deficiency [36] translates into a frequent need to fertilize rape with boron and maize with iron. However, the high Zn concentration in rape is not related to its high sensitivity to deficiency of this micronutrient. Rape, unlike maize, is not considered a crop with high sensitivity to Zn deficiency [27].
There are not many opportunities to compare our results with studies by other authors because there are no publications that compare micronutrients in shoots at the same growth stages in the species we studied. Only Korzeniowska et al. [37] report the average concentration of micronutrients in winter wheat shoots calculated on the basis of 357 samples taken in 2010–2011 from fields located in Poland: B was 3.9, Cu was 5.3, Fe was 171, Mn was 45, Zn was 37 mg kg−1. The values of B, Cu and Mn reported by these authors are very similar to ours, while Fe and Zn are higher by 45 and 37%, respectively. In addition, Bergmann [11] gives optimum ranges for B, Cu, Mn and Zn concentrations in wheat and maize shoots and rape leaves taken at the same growth stages as ours. In general, all mean concentrations of microelements calculated from the optimal ranges of Bergmann were higher than the concentrations observed in our study. The greatest differences, up to twofold, were found for B and Cu in wheat shoots. It can be assumed that the differences between our results and Bergmann’s are due to the different cultivars used now and in the 1990s. This suggests that the B and Cu ranges provided by Bergman for wheat have become obsolete and should not be used to assess plant nutritional status.

4.3. Differences in Micronutrient Content among Cultivars and Species

Our research hypothesis was that differences in plant micronutrient content may be greater among cultivars within a species than between species. Previous findings indicated large differences in the content of microelements in cultivars and their different response to micronutrients fertilization. Korzeniowska [38] separated three distinct groups of wheat cultivars among the 10 studied, which showed high, medium and low demand for Cu fertilization. These groups differed significantly in both response to fertilization and Cu concentration in shoots. Stanislawska-Glubiak and Sienkiewicz [39] studied micronutrient concentrations in seven spring barley cultivars. These authors showed that the maximum difference in concentration among cultivars was 22% in Cu, 40% in Mn and 49% in Fe. In addition, Wrobel and Korzeniowska [40] observed significant differences in the concentration of B in the cob leaf in the seven maize cultivars studied.
Despite previous results, the present extensive research has shown that our thesis of greater differences in micronutrient content among cultivars than species is only true for Cu, Fe and Mn, and does not apply to B and Zn.
In the case of Cu, this difference for the wheat–maize pair was 0.6 mg kg−1, for the wheat–rape pair it was 1.7 mg kg−1 and for the maize–rape pair was 1.1 mg kg−1 (Table 6). At the same time, the difference in Cu concentration among cultivars was clearly greater than between species and was 1.8 mg kg−1 for wheat, 3.6 mg kg−1 for maize and 1.7 mg kg−1 for rape (Table 5).
Differences in Fe and Mn content were also often greater among cultivars within a species than between species. The difference in Fe and Mn concentration between maize cultivars was 148 and 27 mg kg−1, respectively, and between rape cultivars was 141 and 25 mg kg−1 (Table 5). At the same time, for the maize–rape pair the difference was 61 mg kg−1 Fe and 8 mg kg−1 Mn. Among wheat cultivars, the difference in Fe and Mn content was 88 and 16 mg kg−1, respectively, and for the wheat–rape pair it was 58 and 16 mg kg−1 (Table 6).
In contrast, differences in plant B and Zn content were greater between species than among cultivars within a single species (Table 5 and Table 6). The difference in B concentration between species was as high as 37.1 mg kg−1 for the wheat–rape pair, while it was only 2.4 mg kg−1 among wheat cultivars and 25 mg kg−1 between rape cultivars. Larger differences between species compared to cultivars were also found in Zn content, although not as large as for B. The largest difference was found for the wheat–rape pair (28 mg kg−1), while for the wheat cultivars the difference was only 9 mg kg−1 and for the rape cultivars it was 12 mg kg−1.
The results suggest that cultivar should be taken into account when assessing the need to fertilize wheat, maize and rape with Cu, Fe and Mn, while the assessment of the need for fertilization of these species with B and Zn can be carried out independently of the cultivar used.
When fertilizing certain crops with micronutrients, it would be advisable to take into account not only the nutritional needs of the individual species, but also to adapt micronutrient doses to the requirements of the cultivars within the species. Such a measure could contribute to a more efficient use of fertilizers, in line with sustainable agriculture.

5. Conclusions

The highest average concentrations of B, Cu and Zn were observed in rape shoots and the highest average concentrations of Fe and Mn were observed in maize shoots. Wheat showed significantly lower concentrations of all micronutrients than rape and maize.
All the wheat, rape and maize cultivars tested had sufficient average micronutrient concentrations in the shoots, equal to or above the deficiency limit. The exception was one maize cultivar (Nimba), in which a concentration below the limit was observed.
For B and Zn concentrations, greater differences were found between species than cultivars for all three plants tested. On the contrary, for Cu concentration, varietal differences always exceeded species differences. In contrast, for Mn and Fe, varietal differences exceeded species differences for wheat–maize and maize–maize pairs, excluding the wheat–maize pair.
The results suggest that the fertilization of wheat, maize and rape with Cu, as well as Mn and Fe, needs to take into account different requirements of the cultivars for these micronutrients. In contrast, there is no need to take cultivars into account when fertilizing with B and Zn. Nevertheless, further research should confirm to what extent the concentration of micronutrients in the early stage of growth affects the size of the final crop yield.

Author Contributions

Conceptualization, J.K. and E.S.-G.; investigation, J.K. and E.S.-G.; methodology, J.K. and E.S.-G.; writing—original draft, J.K. and E.S.-G.; writing—review & editing, J.K. All authors have read and agreed to the published version of the manuscript.

Funding

We acknowledge funding from the Polish Ministry of Agriculture and Rural Development under 2.33 Scientific Research Program of the Institute of Soil Science and Plant Cultivation in Pulawy.

Informed Consent Statement

Not applicable.

Data Availability Statement

Presented data in this study are available upon request from the corresponding author.

Acknowledgments

The authors would like to thank National Agrochemical Station in Warsaw for organizing field sampling and chemical analysis.

Conflicts of Interest

The authors declare no conflict of interest.

References

  1. Bell, R.W.; Dell, B. Micronutrients for Sustainable Food, Feed, Fibre and Bioenergy Production; International Fertilizer Industry Association: Paris, France, 2008; pp. 1–175. [Google Scholar]
  2. Lowe, N.M. The global challenge of hidden hunger: Perspectives from the field. Proc. Nutr. Soc. 2021, 80, 283–289. [Google Scholar] [CrossRef] [PubMed]
  3. Morgounov, A.; Gomez-Becerra, H.F.; Abugalieva, A.; Dzhunusova, M.; Yessimbekova, M.; Muminjanov, H.; Zelenskiy, Y.; Ozturk, L.; Cakmak, I. Iron and zinc grain density in common wheat grown in Central Asia. Euphytica 2007, 155, 193–203. [Google Scholar] [CrossRef] [Green Version]
  4. Lockyer, S.; White, A.; Buttriss, J.L. Biofortified crops for tackling micronutrient deficiencies–what impact are these having in developing countries and could they be of relevance within Europe? Nutr. Bull. 2018, 43, 319–357. [Google Scholar] [CrossRef] [Green Version]
  5. Ramzan, Y.; Hafeez, M.B.; Khan, S.; Nadeem, M.; Batool, S.; Ahmad, J. Biofortification with zinc and iron improves the grain quality and yield of wheat crop. Int. J. Plant Prod. 2020, 14, 501–510. [Google Scholar] [CrossRef]
  6. Kenzhebayeva, S.; Abekova, A.; Atabayeva, S.; Yernazarova, G.; Omirbekova, N.; Zhang, G.; Turasheva, S.; Asrandina, S.; Sarsu, F.; Wang, Y. Mutant lines of spring wheat with increased iron, zinc, and micronutrients in grains and enhanced bioavailability for human health. Biomed. Res. Int. 2019, 2019, 1–10. [Google Scholar] [CrossRef] [Green Version]
  7. Hochmuth, G.; Maynard, D.; Vavrina, C.; Hanlon, E.; Simonne, E. Plant tissue analysis and interpretation for vegetable crops in Florida. In Nutrient Management of Vegetable and Row Crops Handbook; University of Florida press: Gainesville, FL, USA, 2012; pp. 45–92. [Google Scholar]
  8. Meyer, R.D.; Marcum, D.B.; Orloff, S.B. Understanding micronutrient fertilization in alfalfa. In Proceedings of the Western Alfalfa and Forage Symposium, Sparks, NV, USA, 11–13 December 2002; Available online: https://alfalfa.ucdavis.edu/+symposium/proceedings/2002/02-087.pdf (accessed on 5 October 2022).
  9. Sarangthem, I.L.; Sharma, D.; Oinam, N.; Punilkumar, L. Evaluation Of Critical Limit Of Zinc In Soil And Plant. Int. J. Curr. Res. Life Sci. 2018, 7, 2584–2586. [Google Scholar]
  10. Schulte, E.E.; Kelling, K.A. Plant Analysis: A diagnostic Tool; Cooperative Extension Service; Purdue University: West Lafayette, IN, USA, 1991; Available online: https://www.extension.purdue.edu/extmedia/nch/nch-46.html (accessed on 5 October 2022).
  11. Bergmann, W. Nutritional Disorders of Plants-Development, Visual and Analytical Diagnosis; Gustav Fischer Verlag: Jena, Germany; Stuttgart, Germany; New York, NY, USA, 1992; pp. 343–361. [Google Scholar]
  12. Jones, J.B.; Wolf, B.; Mills, H.A. Plant Analysis Handbook; Micro-Macro Publishing Inc.: Athens, GA, USA, 1991; pp. 1–213. [Google Scholar]
  13. Korzeniowska, J.; Stanislawska-Glubiak, E.; Lipinski, W. New limit values of micronutrient deficiency in soil determined using 1 M HCl extractant for wheat and rapeseed. Soil Sci. Annu. 2020, 71, 205–214. [Google Scholar] [CrossRef]
  14. Maganti, S.; Swaminathan, R.; Parida, A. Variation in iron and zinc content in traditional rice genotypes. Agr. Res. 2020, 9, 316–328. [Google Scholar] [CrossRef]
  15. Ray, H.; Bett, K.; Tar’an, B.; Vandenberg, A.; Thavarajah, D.; Warkentin, T. Mineral micronutrient content of cultivars of field pea, chickpea, common bean, and lentil grown in Saskatchewan, Canada. Crop. Sci. 2014, 54, 1698–1708. [Google Scholar] [CrossRef]
  16. Tran, B.T.T.; Cavagnaro, T.R.; Able, J.A.; Watts-Williams, S.J. Bioavailability of zinc and iron in durum wheat: A trade-Off between grain weight and nutrition? Plants People Planet 2021, 3, 627–639. [Google Scholar] [CrossRef]
  17. Korzeniowska, J. Response of ten winter wheat cultivars to boron foliar application in a temperate climate (South-West Poland). Agron. Res. 2008, 6, 471–476. [Google Scholar]
  18. Korzeniowska, J.; Stanislawska-Glubiak, E. The effect of foliar application of copper on content of this element in winter wheat grain. Pol. J. Agron. 2011, 4, 3–6. [Google Scholar]
  19. Genc, Y.; McDonald, G.K.; Graham, R.D. Critical deficiency concentration of zinc in barley genotypes differing in zinc efficiency and its relation to growth responses. J. Plant Nutr. 2002, 25, 545–560. [Google Scholar] [CrossRef]
  20. Becerra, H.F.G.; Yazici, A.; Ozturk, L.; Budak, H.; Peleg, Z.; Morgounov, A.; Fahima, T.; Saranga, Y.; Cakmak, I. Genetic variation and environmental stability of grain mineral nutrient concentrations in Triticum dicoccoides under five environments. Euphytica 2010, 171, 39–52. [Google Scholar] [CrossRef]
  21. Statistics Poland (GUS). Land Use and Sown Area in 2019. 2020. Available online: https://stat.gov.pl/obszary-tematyczne/rolnictwo-lesnictwo/rolnictwo/uzytkowanie-gruntow-i-powierzchnia-zasiewow-w-2019-roku,8,15.html (accessed on 5 October 2020).
  22. Meier, U. Growth Stages of Mono- and Dicotyledonous Plants, BBCH Monograph, 2nd ed.; Blackwell Science: Berlin, Germany, 2001; pp. 1–158. [Google Scholar]
  23. Kabata-Pendias, A.; Pendias, H. Trace Elements in Soils and Plants; CRC Press: Boca Raton, FL, USA, 2001; pp. 1–413. [Google Scholar]
  24. Climate of Poland 2020; Institute of Meteorology and Water Management-National Research Institute: Warsaw, Poland, 2021; pp. 1–43. Available online: https://www.imgw.pl/sites/default/files/2021-04/imgw-pib-klimat-polski-2020-opracowanie-final-rozkladowki-min.pdf (accessed on 5 October 2020).
  25. PN-R 04014:1991; Agrochemical Plant Analyse. Methods of Mineralization of Plant Material for Determination Macro- and Microelements. Polish Committee for Standardization: Warsaw, Poland, 1991. (In Polish)
  26. Korzeniowska, J.; Stanislawska-Glubiak, E. Comparison of 1 M HCl and Mehlich 3 for assessment of the micronutrient status of polish soils in the context of winter wheat nutritional demands. Commun. Soil Sci. Plan. 2015, 46, 1263–1277. [Google Scholar] [CrossRef]
  27. Korzeniowska, J.; Stanislawska-Glubiak, E.; Lipinski, W. Development of the limit values of micronutrient deficiency in soil determined using Mehlich 3 extractant for Polish soil conditions. Part, I. Wheat. Soil Sci. Annu. 2019, 70, 314–323. (In Polish) [Google Scholar] [CrossRef]
  28. Mehlich, A. Mehlich 3 soil test extractant: A modification of Mehlich 2 extractant. Commun. Soil Sci. Plan. 1984, 15, 1409–1416. [Google Scholar] [CrossRef]
  29. ISO 10390:2005; Soil quality: Determination of pH. International Standardization Organization: Geneva, Switzerland, 2005.
  30. PN-ISO 14235:2003; Soil quality: Determination of Organic Carbon in Soil by Sulfochromic Oxidation. Polish Committee for Standardization: Warsaw, Poland, 2003. (In Polish)
  31. PN-EN ISO/IEC 17025:2018-02; General Requirements for the Competence of Testing and Calibration Laboratories. Polish Committee for Standardization: Warsaw, Poland, 2018. (In Polish)
  32. Korzeniowska, J.; Stanislawska-Glubiak, E.; Jadczyszyn, J.; Lipinski, W. Fertilization of Agricultural Crops with Microelements. New Limit Values for the Assessment of Micronutrients in Soil; IUNG-PIB: Pulawy, Poland, 2021; pp. 1–26, (In Polish). Available online: https://schr.gov.pl/download/NAWOZENIE-MIKROELEMENTY.pdf (accessed on 5 October 2022).
  33. Kabata-Pendias, A.; Mukherjee, A.B. Trace Elements from Soil to Human; Springer: Berlin, Heidelberg, 2007; pp. 1–550. [Google Scholar]
  34. Wall, D.P.; O’Sullivan, L.; Creamer, R.; McLaughlin, M.J. Soil Fertility and Nutrient Cycling. In The Soils of Ireland; Creamer, R., O’Sullivan, L., Eds.; World Soils Book Series; Springer: Cham, Switzerland, 2018; pp. 223–234. [Google Scholar]
  35. Alexander, A.; Gondolf, N.; Orlovius, K.; Paeffgen, S.; Trott, H.; Wissemeier, A.H. Mikronährstoffe in der Landwirtschaft Und Im Gartenbau Bedeutung-Mangelsymptome-Düngung; Bundesarbeitskreis Düngung (BAD): Frankfurt am Main, Germany, 2013; pp. 1–64. [Google Scholar]
  36. Katyal, J.C.; Randhawa, N.S. Micronutrient. FAO Fertil. Plant Nutr. Bull 1983, 7, 1–82. [Google Scholar]
  37. Korzeniowska, J.; Stanislawska-Glubiak, E.; Kantek, K.; Lipinski, W.; Gaj, R. Micronutrient status of winter wheat in Poland. J. Cent. Eur. Agric. 2015, 16, 54–64. [Google Scholar] [CrossRef]
  38. Korzeniowska, J. Comparison of different winter wheat cultivars in respect to their copper fertilization requirements. Zesz. Probl. Postępów Nauk. Rol. 2009, 541, 255–263. (In Polish). Available online: https://www.researchgate.net/profile/Jolanta-Korzeniowska-2/publication/259100834_Comparison_of_different_winter_wheat_cultivars_with_respect_to_their_copper_fertilization_demand/links/0c960529f737f2537c000000/Comparison-of-different-winter-wheat-cultivars-with-respect-to-their-copper-fertilization-demand.pdf (accessed on 5 October 2022).
  39. Stanislawska-Glubiak, E.; Sienkiewicz, U. Response of spring barley cultivars to soil acidity, liming and molybdenum fertilization. Zesz. Probl. Postępów Nauk. Rol. 2004, 502, 349–356. (In Polish). Available online: https://agro.icm.edu.pl/agro/element/bwmeta1.element.agro-article-a9b5dc8b-975f-430c-a2b2-bb9a7c5ce240/c/Zeszyt_Probl_Poste_Nau_Rol_r.2004_t.502_s.349-356.PDF (accessed on 5 October 2022).
  40. Wróbel, S.; Korzeniowska, J. Assessment of the need to fertilize maize with boron. Stud. I. Rap. IUNG-PIB 2007, 8, 127–142. (In Polish). Available online: http://iung.pulawy.pl/sir/zeszyt08_11.pdf (accessed on 5 October 2022).
Figure 1. Number of pairs of soil-plant samples taken in Polish provinces: wheat/maize/rape.
Agronomy 12 02639 g001
Figure 2. Concentration of micronutrients in the soil determined with the Mehlich 3 extractant—average of all collected samples. Bars marked with the same letters indicate no significant difference according to Tukey’s test (p < 0.05).
Agronomy 12 02639 g002
Figure 3. Concentration of micronutrients in shoots of the tested species—average of all collected samples. Bars marked with the same letters indicate no significant difference according to Tukey’s test (p < 0.05).
Agronomy 12 02639 g003
Figure 4. Concentration of microelements in shoots of wheat cultivars. Bars marked with the same letters indicate no significant difference according to Tukey’s test (p < 0.05).
Agronomy 12 02639 g004
Figure 5. Concentration of microelements in shoots of maize cultivars. Bars marked with the same letters indicate no significant difference according to Tukey’s test (p < 0.05).
Agronomy 12 02639 g005
Figure 6. Concentration of microelements in shoots of oilseed rape cultivars. Bars marked with the same letters indicate no significant difference according to Tukey’s test (p < 0.05).
Agronomy 12 02639 g006
Figure 7. The range of micronutrient concentration in shoots of the tested species.
Agronomy 12 02639 g007
Table 1. Characteristics of wheat cultivars and the number of samples taken.
No.CultivarUsage 1Year 2BreederNo. of
Samples
1ArkadiaArkA2011DANKO Hodowla Roślin sp. z o.o., Poland100
2BamberkaBamA2009Hodowla Roślin Strzelce sp. z o.o., Poland46
3BogatkaBogB2004DANKO Hodowla Roślin sp. z o.o., Poland14
4HondiaHonA2014DANKO Hodowla Roślin sp. z o.o., Poland11
5JuliusJulA-KWS Lochow GmbH, Germany88
6LinusLinA2011RAGT 2 n, France30
7MuszelkaMusB2008DANKO Hodowla Roślin sp. z o.o., Poland11
8OstrogaOstA2008DANKO Hodowla Roślin sp. z o.o., Poland48
9OzonOzoB2010KWS Lochow GmbH, Germany26
10SailorSaiA2011DANKO Hodowla Roślin sp. z o.o., Poland30
11SkagenSkaA2009W. von Borries-Eckendorf GmbH & Co. KG, Germany44
12TonacjaTonA2001Hodowla Roślin Strzelce sp. z o.o., Poland33
Total 481
1 A: quality, B: bread;2 year of registration.
Table 2. Characteristics of maize cultivars and the number of samples taken.
No.CultivarFAOUsage 1Year 2BreederNo. of
Samples
1DanubioDan240–250S2013Saatbau Linz eGen, Austria10
2GlejtGle230G2001HR Smolice, Poland16
3LegionLeg260–270S2014HR Smolice, Poland11
4NimbaNim260S1996HR Smolice, Poland10
5OpokaOpo240S2006HR Smolice, Poland11
6P8400P8400240G2013Pionner, USA14
7RedutaRed230G2000HR Smolice, Poland14
8RosomakRos250–260G2013HR Smolice, Poland22
9SubitoSub260G2008HR Smolice, Poland10
10UlanUla270G2011HR Smolice, Poland23
Total141
1 S: silage, G: grain; 2 year of registration.
Table 3. Characteristics of oilseed rape cultivars and the number of samples taken.
No.CultivarYear 1BreederNo. of
Samples
1Abacus (HY)Aba2009Norddeutsche Pflanzenzucht Hans-Georg Lembke KG, Germany22
2Alexander (HY)But-Limagrain Europe, France21
3Alvaro (HY)Alv2015KWS Saat SE & Co. KGaA, Germany20
4Exquisite (HY)Exq2011Monsanto Technology LLC, USA14
5Garou (HY)Gar2013Norddeutsche Pflanzenzucht Hans-Georg Lembke KG, Germany16
6Kuga (HY)Kug2015Norddeutsche Pflanzenzucht Hans-Georg Lembke KG, Germany19
7Marcopolos (HY)Mar2012KWS Saat SE & Co. KGaA, Germany23
8Mercedes (HY)Mer2013Norddeutsche Pflanzenzucht Hans-Georg Lembke KG, Germany16
9Monolith (OP)Mon2008Hodowla Roślin Strzelce sp. z o.o. IHAR Group, Poland71
10Rohan (HY)Roh2008Norddeutsche Pflanzenzucht Hans-Georg Lembke KG, Germany30
11Sherlock (OP)She2010KWS Saat SE & Co. KGaA, Germany46
12Visby (HY)Vis2008Norddeutsche Pflanzenzucht Hans-Georg Lembke KG, Germany30
Total328
HY: hybrid cultivar, OP: open-pollinated cultivar,1 year of registration.
Table 4. Characteristic of soil samples.
Soil FeatureWheat (n = 481)Maize (n = 141)Rape (n = 328)
MeanSERangeMeanSERangeMeanSERange
pH in KCl6.10.035–76.00.065–76.10.035–7
Sand 2.00–0.05 mm, %.610.792.5–84.8641.2213.5–83.6640.7322.7–83.4
Silt 0.05–0.002 mm, %.360.7713.8–94.6331.1414.7–84.0330.6815.2–72.2
Clay <0.002 mm, %30.050.0–6.430.101.3–8.630.061.0–9.8
Fraction <0.02 mm, %20.50.2910–3519.50.5510–3520.00.3510–35
TOC %1.30.030.5–9.81.20.050.3–4.11.20.030.3–3.6
SE: standard error.
Table 5. Differences among cultivars in the concentration of micronutrients in shoots—based on cultivars with the lowest and highest mean concentration.
ElementWheatMaizeOilseed Rape
CultivarnMeanDifferenceCultivarnMeanDifferenceCultivarnMeanDifference
mg kg−1mg kg−1mg kg−1
BTon332.8 Gle167.5 Alex2132
Jul885.22.4Dan1013.35.8Mer165725
CuSka444.6 Nim104.2 Mar236
Lin306.41.8Dan107.83.6Gar167.81.7
FeBog1479 Sub10139 Vis30126
Hon1116788P840014287148Kug19267141
MnMus1133 Sub1056 She4646
Ton334916P8400148327Alex217125
ZnSka4422 Gle1634 Gor1650
Ton33309Nim104814Kug196212
n number of observations.
Table 6. Differences among species in the concentration of micronutrients in shoots—based on the mean of all cultivars *.
ElementSpeciesMeanDifferenceSpeciesMeanDifferenceSpeciesMeanDifference
mg kg−1 mg kg−1 mg kg−1
BWheat4.05.7Wheat4.037.1Maize9.731.4
Maize9.7 Rape41.1 Rape41.1
CuWheat5.20.6Wheat5.21.7Maize5.81.1
Maize5.8 Rape6.9 Rape6.9
FeWheat117119Wheat11758Maize23661
Maize236 Rape175 Rape175
MnWheat4024Wheat4016Maize648
Maize64 Rape56 Rape56
ZnWheat2713Wheat2728Maize4015
Maize40 Rape55 Rape55
* number of observations: wheat, 481; maize, 141; rape, 328.
Table 7. Pearson correlation coefficient (r) between micronutrient concentration in shoots and soil features.
CropMicronutrientpHFraction <0.02 mmCorg
Wheat
n = 481
Bns−0.16 ***−0.11 *
Cunsnsns
Fensnsns
Mn−0.30 ***nsns
Znnsnsns
Maize
n = 141
Bnsnsns
Cu0.19 **0.18 *ns
Fensns−0.18 *
Mn−0.31 **nsns
Zn−0.18 *0.17 *ns
Rape
n = 328
Bns0.19 ***ns
Cunsnsns
Fensnsns
Mnns−0.16 **−0.14 *
Znnsnsns
*, **, *** significant level p < 0.05; 0.01; 0.001, respectively; ns: nonsignificant; n: number of samples; Corg: organic carbon.
Publisher’s Note: MDPI stays neutral with regard to jurisdictional claims in published maps and institutional affiliations.