Article

Design and Optimization of Rice Grain Screening System Based on DEM–CFD Coupled Rice Seed Testing Platform

1
School of Mechanical Engineering, Yangzhou University, Yangzhou 225127, China
2
Jiangsu Engineering Center for Modern Agricultural Machinery and Agronomy Technology, Yangzhou 225127, China
*
Author to whom correspondence should be addressed.
These authors contributed equally to this work.
Agronomy 2022, 12(12), 3069; https://doi.org/10.3390/agronomy12123069
Submission received: 14 November 2022 / Revised: 30 November 2022 / Accepted: 2 December 2022 / Published: 4 December 2022

Abstract

:
Targeting the problems of low precision and heavy workload in conventional screening of filled and unfilled grain in single-plant rice testing, a screening system for filled and unfilled grain was designed based on the coupling of the wind and gravity fields. In this study, the motion state of filled and unfilled grain in the flow field and the results of screening were analyzed and combined with aerodynamics. In order to reveal the influence law of the structural and working parameters of the screening system on the screening performance and determine the optimal parameter combination, this study conducted a quadratic regression orthogonal rotating center combination test with four factors and three levels based on the DEM–CFD coupling method. The relationship between air inlet wind speed, air cross-section shape, horizontal distance, vertical distance, and removal rate was studied. The results showed that, in a certain range, the removal rate was positively correlated with the section width of the outlet, positively correlated with the wind speed, and negatively correlated with the vertical distance and horizontal distance of the seed-drop outlet. The optimization results showed that, when the section width of the outlet was 75.44 mm, the wind speed was 8.90 m·s−1, the transverse distance was 198.78 mm, and, when the vertical distance was 34.87 mm, the screening rate of the screening system could reach 99.6%.

1. Introduction

China is one of the largest rice producers in the world. In order to improve the quality and yield of rice, rice cultivation and breeding experts carry out heavy breeding work every year [1]. By measuring panicle weight, panicle length, and the number of full and unfilled grains, we can evaluate rice varieties and cultivation agronomy, which is of great significance for rice production. Usually, individual rice plants are threshed during seed testing, then the researchers screen and count the filled and unfilled grains. However, manual threshing is characterized by high labor intensity and low working efficiency, easily leading to statistical errors due to laborers’ fatigue. If ordinary threshing machines are used, the grain breakage rate and entrainment loss rate cannot meet the requirements of seed test accuracy, and internal screening is difficult, easily causing mechanical mixing and resulting in inaccurate seed test data [2,3]. Therefore, an efficient screening system that can accurately screen filled and unfilled grain after individual-plant threshing is needed for rice seed testing.
As an important process in agricultural production for improving harvest quality and reducing the rice-doping rate, rice screening is an operation to separate filled and unfilled grain from the rice panicle by taking advantage of the differences in physical properties between the types of rice [4,5,6]. Common screening methods for agricultural materials include the specific gravity method [7], magnetic separation method [8], wind separation method [9], etc. The wind separation method for rice is based on the different stress characteristics of filled and unfilled grain in the compound field of wind and gravity. Many scholars have performed a lot of research on the aerodynamic characteristics of materials. In order to study the influence of temperature and vibration frequency in the air screen cleaning device on the dispersion characteristics of the wet rice threshing mixture, Zhang et al. [10] quantified the degree of dispersion by measuring the accumulated mass, showing that an increase in vibration frequency has little effect on the dispersion of the wet threshing mixture. Chen [11] modeled the screening chamber and stripping mixture of an actual wheat harvester, analyzed the screening principle of the vibrating screen and the flow field rule in the screening chamber by using CFD [12], DEM [13], and CFD–DEM methods [14], and optimized the main parameters that affected the air flow in the screening chamber and the grain impurity content and loss rate. Targeting the phenomena of breakage and adhesion in the threshing process of frozen corn, Zhang et al. [15] adopted the parameter-adjustable air curtain screening system made by themselves to reduce the impurity ratio and loss ratio in the screening process and determined the optimal process parameters of the screening with the response surface method. Liu et al. [16] optimized the operating parameters of a soybean screening device through experiments so that the screening loss rate and impurity rate were decreased by 0.05% and 2.09%, respectively, under optimized working parameters. For the problems of high screening loss rate and impurity rate in grain wind screen cleaning, Zhu [17] conducted simulation research and analyzed the characteristics of the indoor air flow field distribution of the vibrating sieve point and tubular grain wind screen cleaning and the gas–solid two-phase flow process of the grain wind screen cleaning mechanism under the conditions of a windless field. On this basis, an optimized design method of the key parameters of grain air screen cleaning was proposed based on the GA-SVR proxy model and NSGA-II multi-objective optimization algorithm, and the screening loss rate and impurity content were greatly reduced after the design optimization. Geng et al. [18] developed a test bed for the determination of the suspension velocity of agricultural materials in order to study the aerodynamic characteristics of Chinese cabbage seed explants and conducted suspension velocity tests. In order to study the floating velocity of rapeseed and its influence on the screening performance of rapeseed, Ma et al. [19] adopted the floating velocity test device and other devices to measure and analyze the floating velocity and multi-frequency reciprocating friction characteristics of the main components of rapeseed.
In order to explore the optimal combination of parameters, researchers usually use experimental means to conduct research. Although the experimental study of physical models has good objectivity, the test workload is usually larger. In recent years, as the application of the discrete-element method (DEM) in agricultural engineering has become more and more mature, its simulation has gained strong objectivity and reference value [20]. In order to explore the soil disturbance mechanism of a chisel plow, Zhang et al. [21], combining EDEM simulation analysis and a soil trough test, built a simulation model suitable for simulating the interaction between sticky black soil and tillage components in Northeast China, compared its effects with the effect of a deep, loose shovel operation, and studied the micro-disturbance mechanism and macro-disturbance state of soil caused by the chisel shovel. Ding [22] simulated the separation process of the mixed grain and stalk particle system in a vertical air separation device with the DEM–CFD coupling method and simulated the air field environment and the movement behavior of particles. Wang et al. [23] established a particle model and contact model with EDEM software, analyzed the contact between billets, related mechanical parts, and the movement rules of billets in the seed platter, and compared the physical experiment results and simulation results of the repose angle. In order to improve the single-seeding rate of a pneumatic single-seeding device, He et al. [24] theoretically analyzed the influence of the position of the seed screening mechanism on the seed screening effect and simulated the flow field of different nozzle structures by using Fluent software. The results showed that the seed screening mechanism proposed by them improves seeding accuracy. Due to the large amount of kinetic energy exchange in the screening process of filled and unfilled grains, coupled effects caused by fluid changes, collisions between particles, and interactions between fluid and particles [25,26,27], the physical properties of the whole system are very complicated. In the simulation study of solid particle screening, if only DEM or CFD is used for simulation, the interaction between the air flow and solid particle cannot be described, or the solid particle can only be regarded as a porous medium model, and the influence of the solid particle model on air flow cannot be accurately calculated [28,29]. The DEM–CFD coupled method, which can not only characterize the particle geometry and collision motion, but also calculate the fluid distribution based on the multiphase flow model, is more comprehensive than other methods in the simulation of fluid–particle systems. Zhao et al. [30,31] simulated the screening process of grains under different wind speeds and air inclination angles with the DEM–CFD coupled method and analyzed the motion state and separation mechanism of grains and impurities in the flow field combined with aerodynamics. Wang et al. [32] used the DEM–CFD coupling simulation, targeting the direction of the pressure gradient change in the mixed seed component and the direction of seed transport in the seed row process with the air feeding concentrate for both rape and wheat, and a mixed seed component based on the Venturi principle was designed. The impact of conveying air velocity, seed rate, and the structure of the hybrid components on total pressure loss were analyzed; Wang et al. [33] developed a self-priming wheat jet device by using the DEM–CFD coupling method to improve the seed filling performance. Therefore, it is feasible to use the DEM–CFD coupling method for research.
In conclusion, compared with the research on air screen separation devices, the research on fine screening devices for rice grains is relatively less. Therefore, in order to solve the problem of the precise separation of solid and unfilled grains after per-plant threshing on a seed testing platform [34,35], taking the rice grain screening system as the research object and combining it with the aerodynamic simulation of grain screening process in rice panicles, this study adopts the DEM–CFD method to analyze the motion state and flat screening results of filled grains and unfilled grains in the flow field. The conclusion of this study provides an important theoretical basis for the accuracy and feasibility of rice screening simulation based on the DEM–CFD coupling method.

2. Materials and Methods

2.1. Structure and Working Principle of Seed Test Platform Screening System

The system structure of the threshing and screening process on the seed testing platform is shown in Figure 1 and is composed of the threshing mechanism, conveyor belt, grain-retaining cover (not shown in the figure), screening device, and collection device [36]. The rice panicle is fed above the threshing drum, and the individual rice panicle is threshed by the threshing device. A single grain falls into the conveyor belt and is transported to the top of the screening device. The fan of the screening device carries out air supply screening and, finally, realizes the precise separation of filled and unfilled grain.

2.2. Discrete Element Simulation Analysis

2.2.1. Establishment of CFD–DEM Coupling Model

When using the CFD–DEM coupling method for simulation, the main coupling models include the Lagrange model and Euler model [37,38,39]. The Lagrange model adopts a unidirectional flow framework and does not consider the volume fraction of the particle phase, while the Euler model uses a multiphase flow framework to solve the volume fraction equation and considers the influence of the particle flow field. The Lagrange coupling model is used to simulate the screening process.
In the Lagrange model, the fluid volume fraction term and the differential equation of motion can be expressed as Equations (1) and (2), respectively:
ε f ρ f t + · ε f ρ f V f = 0
ε f ρ f V f t + · ε f ρ f v f 2 = P + μ f ε f v f + ε f ρ f g
where ρf is the fluid density, kg·m−3; t is time, s; vf is the flow rate of fluid, m·s−1; εf is the volume fraction of the fluid; P is the pressure on the gas element, Pa; g is the acceleration of gravity, m·s−2; μf is the viscosity coefficient; and ∇ is a Hamiltonian differential operator.

2.2.2. Particle Contact Impact Model

Computational particle mechanics models describe the interaction between particles and contact mechanics. Considering that the contact between particles and particle velocity change based on the contact force, the soft ball dry contact model and Hertz–Mindlin (no-slip) contact theory are used here [40,41,42,43]. According to Newton’s second law, the equation of motion of the i-th particle is:
m i = d V i d t = m i g + P + j = 1 n i F n , i j + F t , i j
I i = d ω i d t = j = 1 n i T t , i j + T r , i j
where Vi is the velocity of the particle i, m·s−1; ωi is the angular velocity of the particle i, rad·s−1; Ii is the moment of inertia of the particle i, kg·m2; mi is the mass of the particle i, kg; g is the acceleration of gravity, m·s−2; P is the force on the particle moving with respect to the flow, N; Fn,ij is the normal component, N; Ft,ij are tangential components, N; Tt,ij is tangential torque, N·m−1; and Tr,ij is the rolling friction torque, N·m−1.
According to Hertz contact theory, the tangential and normal components are mathematically described as Equations (5) and (6):
F n , i j = 4 3 E * R * δ n 3 2 n c 5 6 K n m * 2 ln ε ln 2 ε + π 2 v n , i j · n c n c
F t , i j = 8 G * R * δ n δ t 5 6 K n m * 2 ln ε ln 2 ε + π 2 v t , i j · n c n c
where E* is the equivalent modulus of elasticity, Pa; R* is equivalent radius, m; M* is equivalent quality, kg; G* is equivalent shear modulus, Pa; δn is the normal overlap; δt is tangential overlap; Kn is the normal stiffness; Kt is tangential stiffness; nc is the unit vector connecting the centers of two particles; ε is the elastic recovery coefficient; vn,ij is the relative normal velocity of particle j, m·s−1; and vt,ij is the relative tangential velocity of particle i to particle j, m·s−1.
Tangential torque and rolling friction torque are mathematically described in Equations (7) and (8) [44]:
T t , i j = R i F n , i j
T r , i j = μ F t , i j R i ω i
where μ is the rolling friction coefficient; and Ri is the unit direction vector from particle i centroid of mass to the contact point. ωi is the angular velocity unit vector at the contact point of particle i.
The force P on the particle moving relative to the air flow is shown in Equation (9):
P = k ρ A v 2 = k ρ A v q v x 2
where k is the drag coefficient, which is related to the shape, surface characteristics, and Reynolds number of the object; ρ is the air density, kg·m−3; A is the area of material affected by air flow, m2; v is the relative velocity of material and air flow, m·s−1; vq is the front wind speed, m·s−1; and vx is the material velocity, m·s−1.

2.2.3. Calculation Model

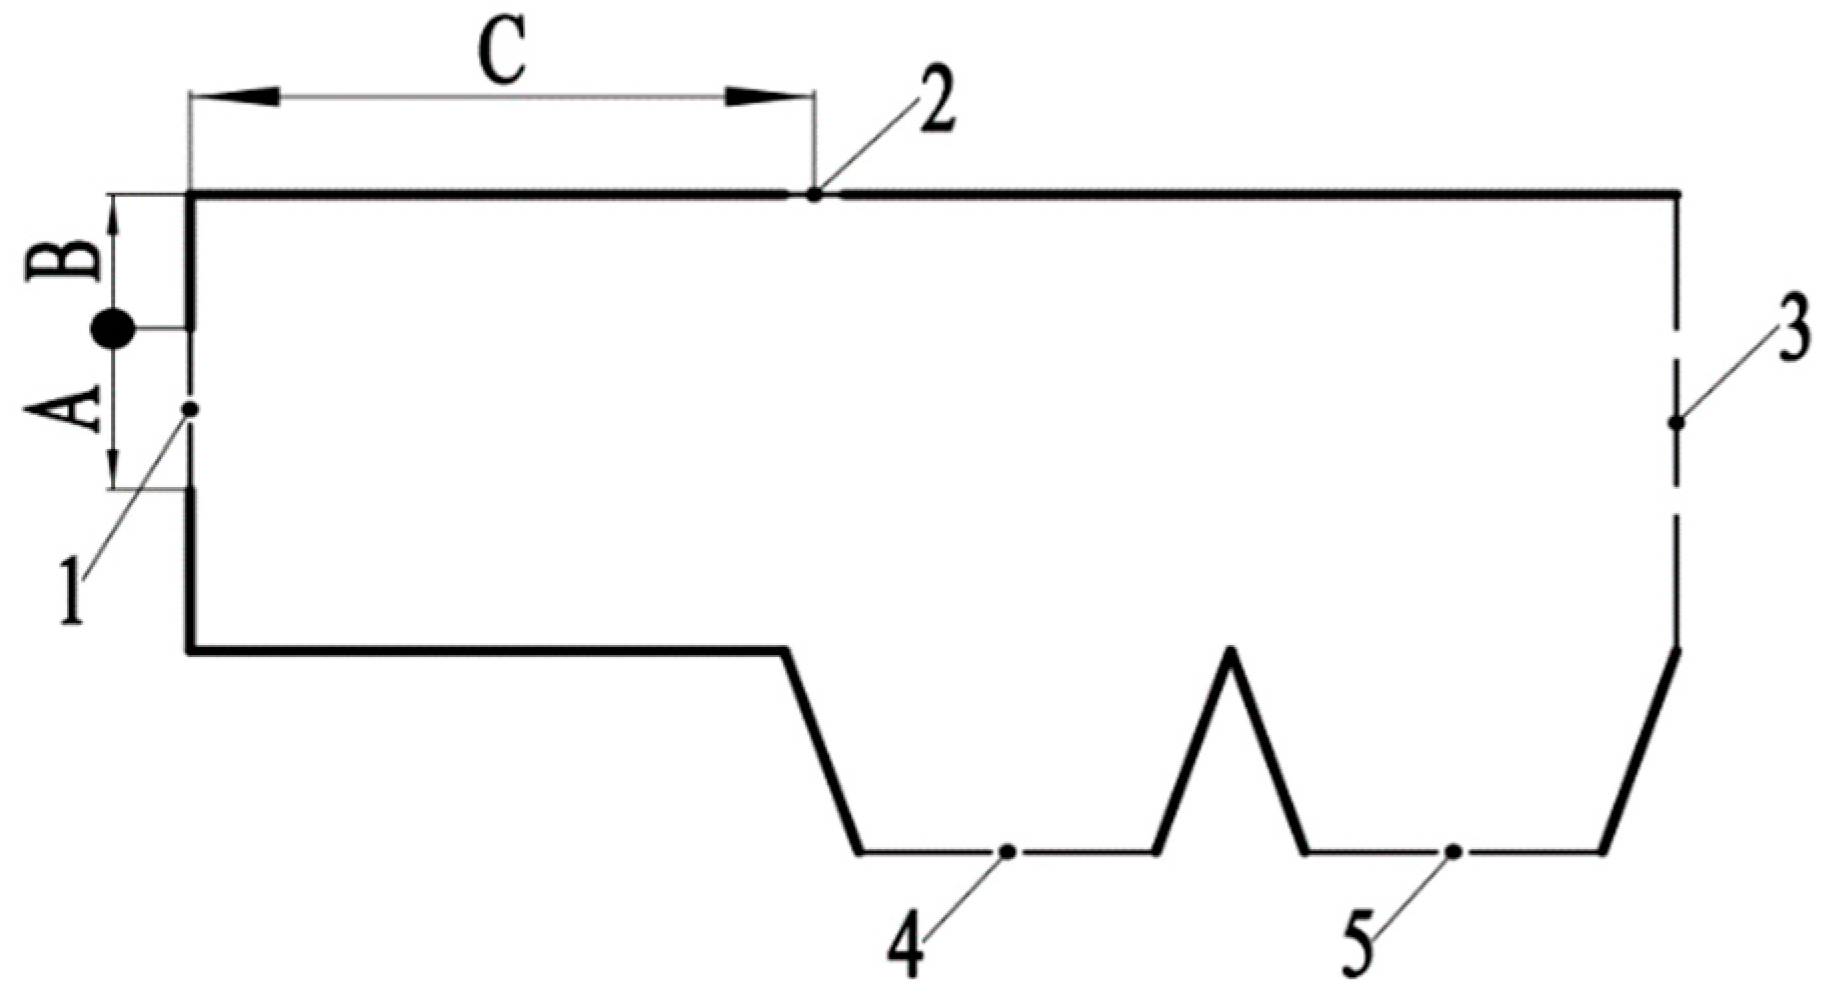
After the threshing work is completed, the rice grains must be screened in the rice grain sorting device. SolidWorks software was used to create models of rice grain sorters. The model size of the rice grain sorting device is shown in Figure 2. The device adopts a single inlet air structure. Import the model into the ANSYS Workbench to divide the grid [45].
In this study, EDEM and Fluent software were used for the coupling simulation. Filled grain and unfilled grain were selected as the research object, and unfilled grain was defined as the impurity in rice. In this study, the overlapping multi-pellet method (OMCM) was used to simplify, overlap, and fill the two kinds of rice grains. Figure 3 is a schematic diagram of the filled sizes of the two kinds of particles, in which 13 spheres of different particle sizes are filled. The particle model in EDEM software is shown in Figure 4, and the real rice particle model is shown in Figure 5.

2.3. Setting of Simulation Parameters

The mechanical properties and contact coefficients of the material particles in the EDEM software are shown in Table 1 and Table 2 [46,47,48,49]. The screening device is made of steel, and the rice variety is Nangeng 46. A grain factory is arranged at the entrance of the rice grain sorting device. The quantity ratio of filled and unfilled grain is set as 9:1, the yield of filled grain is 135 pieces/s, and the yield of unfilled grain is 15 pieces/s. The diameter and size of filled and unfilled grains are distributed by normal distribution, and the particle radius is RN~N (μ,σ2), where mean = 1, std dev (standard deviation) = 0.05, and scale by radius is selected. Solid and deflated particles are produced by the particle factory at the entrance and fall freely. The front wind speed of the inlet is set at 5 m·s−1, 7 m·s−1, and 9 m·s−1. The simulation time step is set as 19.9865% Rayleigh time step, which is 4 × 10⁻⁶ s, and the total simulation time is 3 s. The simulation in Fluent 17.0 uses the standard k–ε turbulence model, and the time step is set to 100 times the time step in EDEM, which is 4 × 10⁻⁴ s.

2.4. Particle Motion Analysis

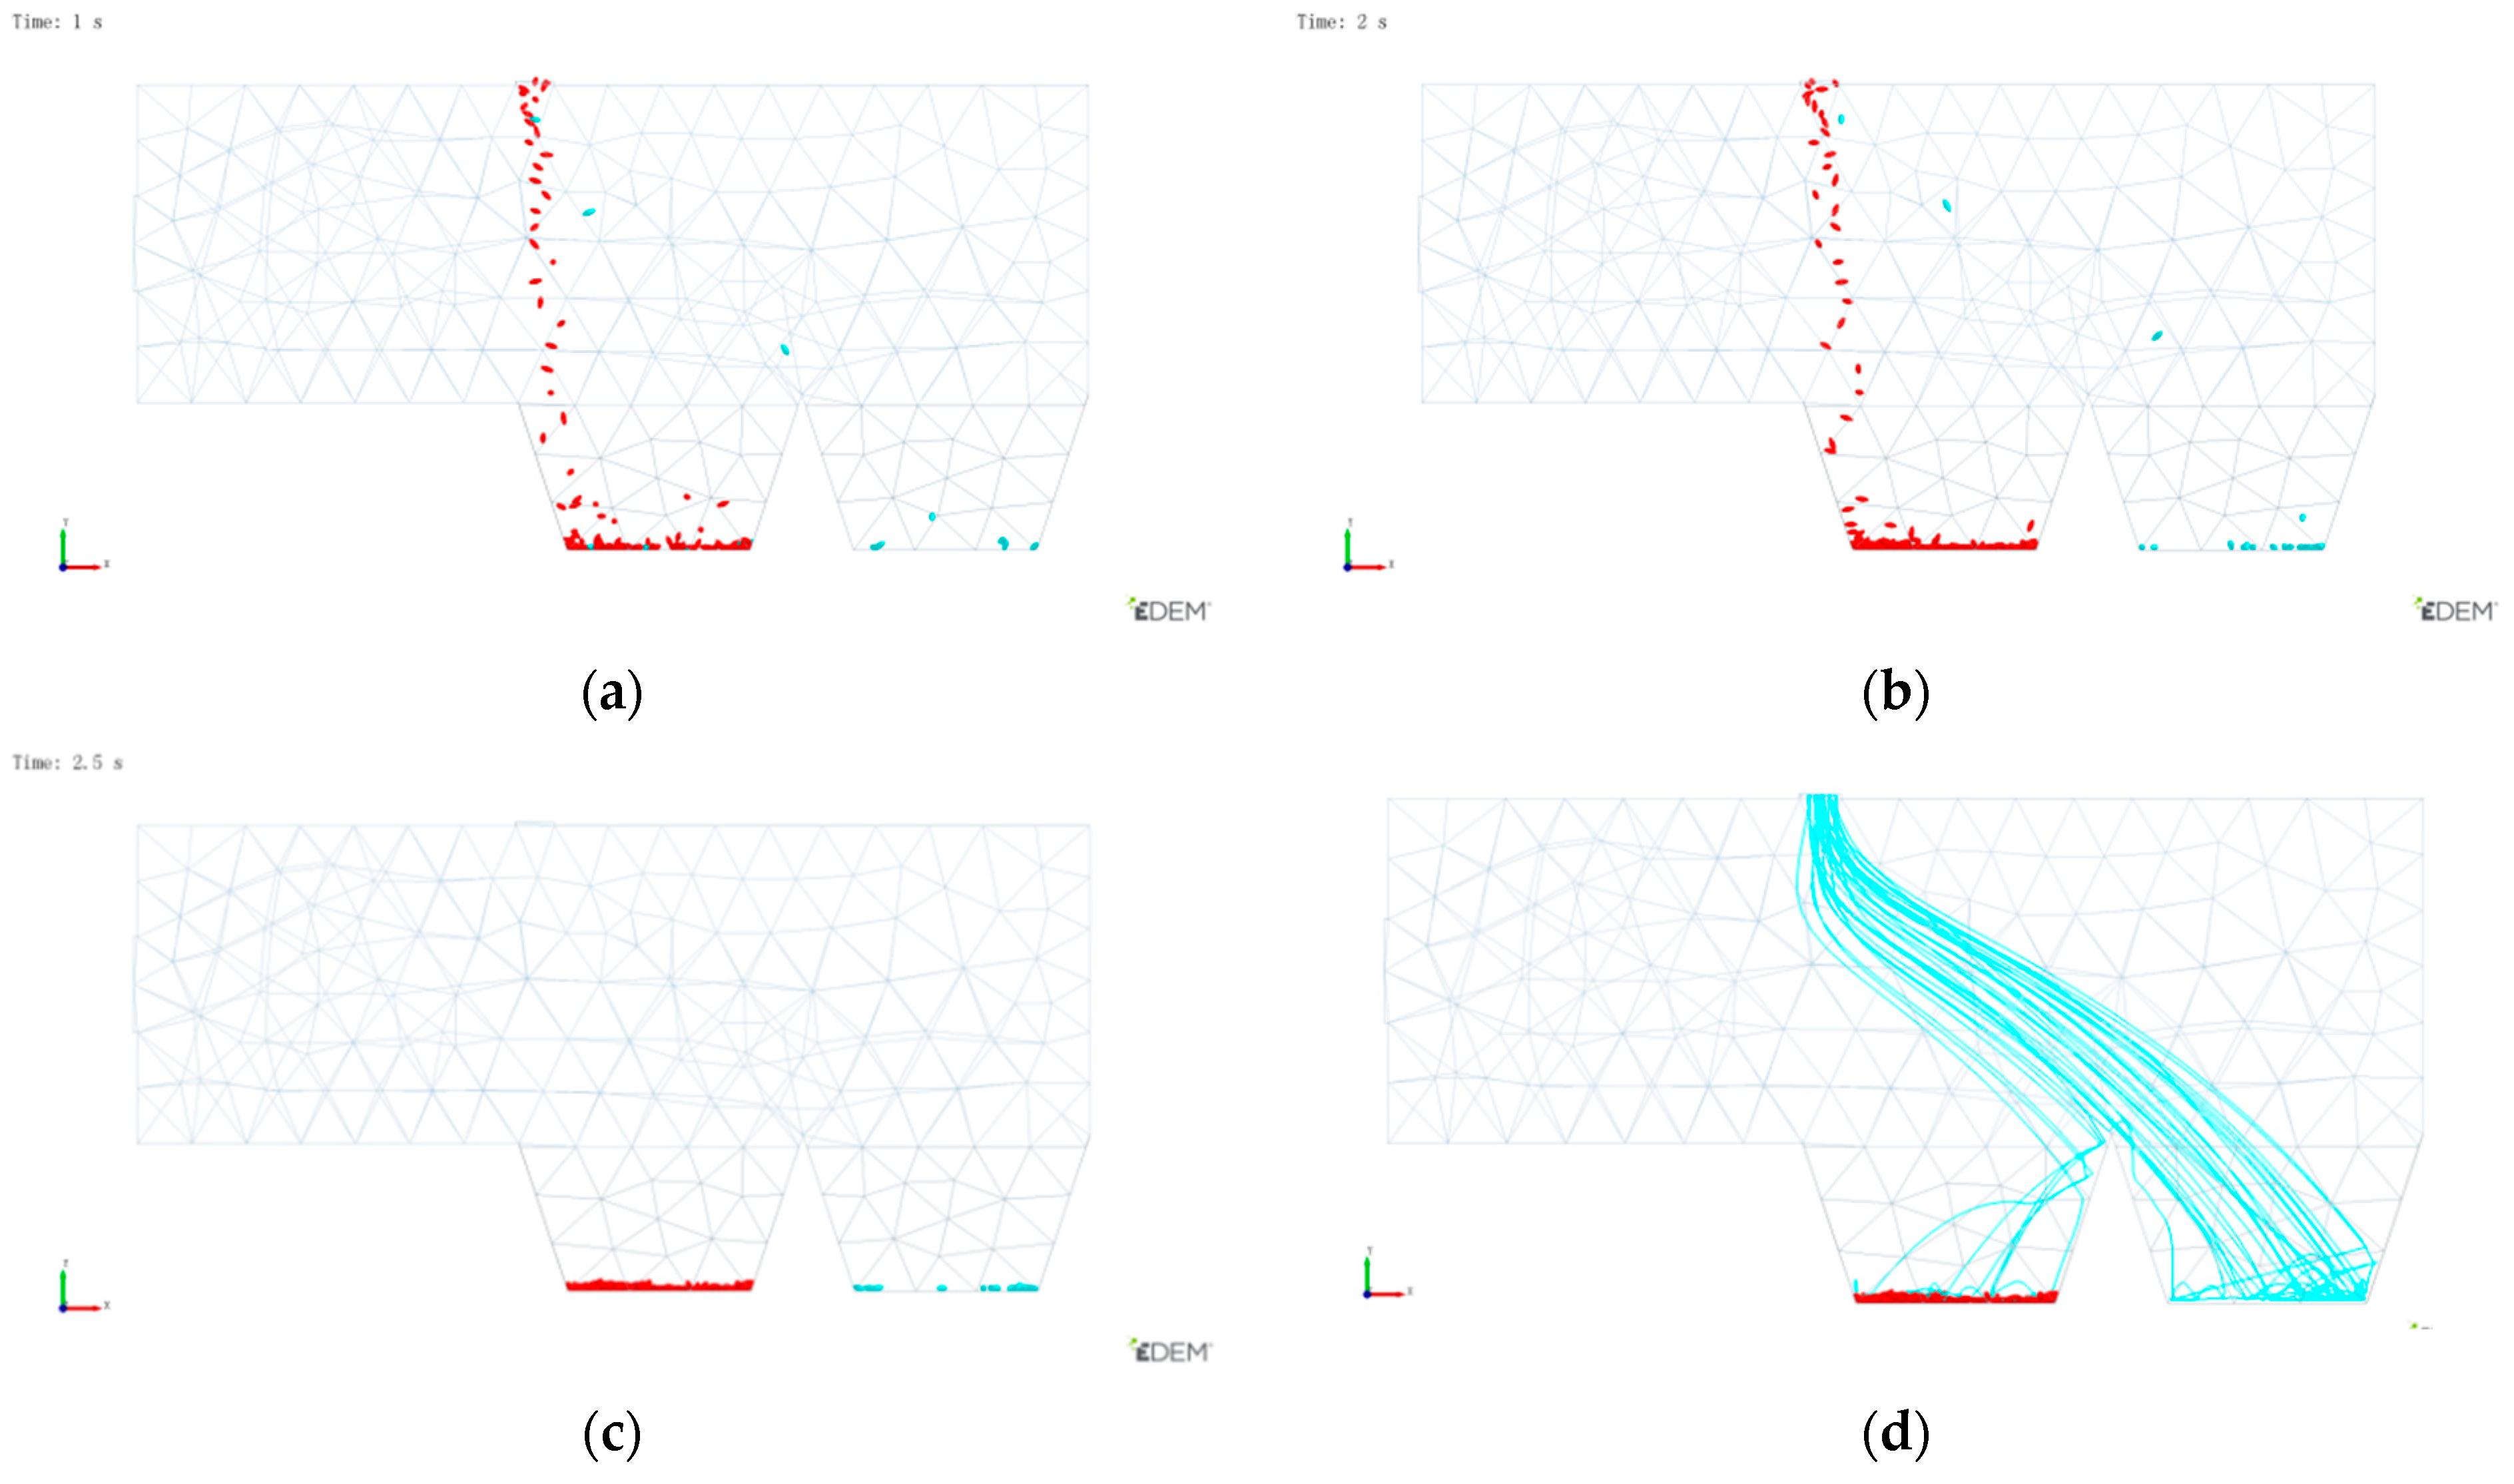
Figure 4 shows the transient diagram of the material position in the screening device at 1 s. As can be seen from Figure 4, after the material falls into the action zone of the air flow, the particles of the two materials show different movement paths under the action of the horizontal air flow. All the solid particles fall into outlet 1, and some of the deflated particles are doped into outlet 1.
In order to quantitatively describe the screening effect, this study used the removal rate as the measuring standard, that is, the ratio of the number of unfilled grains in outlet 2 to the total number of unfilled grains as the measuring standard. The greater the removal rate, the better the separation effect of filled grains and unfilled grains. The definition of removal rate RL can be calculated by Equation (10):
R L = N 1 N 2 × 100
where N1 is the number of unfilled grains collected at outlet 2, and N2 is the total number of unfilled grains collected.
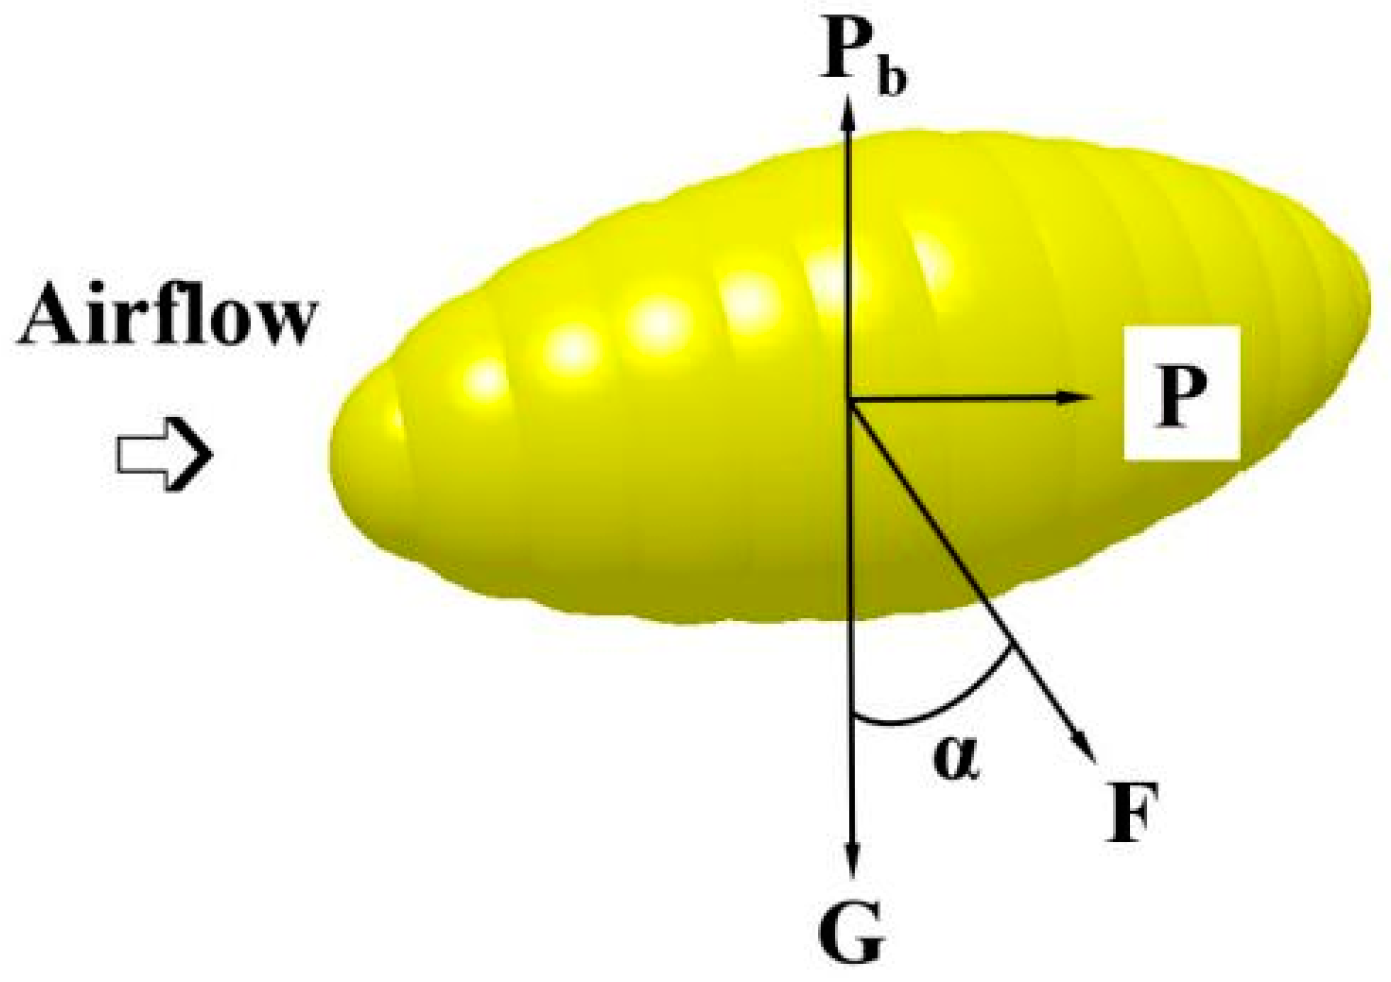
Due to the different aerodynamic characteristics of filled and unfilled grains, the vertically falling materials show different tracks under the action of horizontal air flow. The materials are affected by gravity G, air buoyancy Pb, and horizontal air flow force P. P is in the rice grain sorting device.
The resultant force of the three forces is F, as shown in Figure 5. The material moves in the direction of F, the motion trajectory is a parabola, and the direction angle of the material movement is α.
If air buoyancy Pb is ignored, then:
tan α = P G = k ρ A v q v w 2 m g
where the horizontal flow force P is constant, and, the smaller the gravity is, the larger the motion direction angle α of the particles. In aerodynamics, tanα is the flight coefficient of the material in a flow field. Due to different physical properties, such as particle size and density, the flight coefficient in the same air flow is also different. When the current wind speed is fixed, the larger the flight coefficient and the larger the horizontal displacement of particles driven by the air flow. According to Equation (11), when α (0, π/2), the flight coefficient of the material is inversely proportional to its mass. Therefore, as shown in Figure 6, the solid particles with larger mass sink obviously and first fall into outlet 1, while the deflated particles with relatively lighter mass carry out horizontal projectile motion under the push of horizontal air flow and fall into outlet 2.

2.5. Seed Test Platform

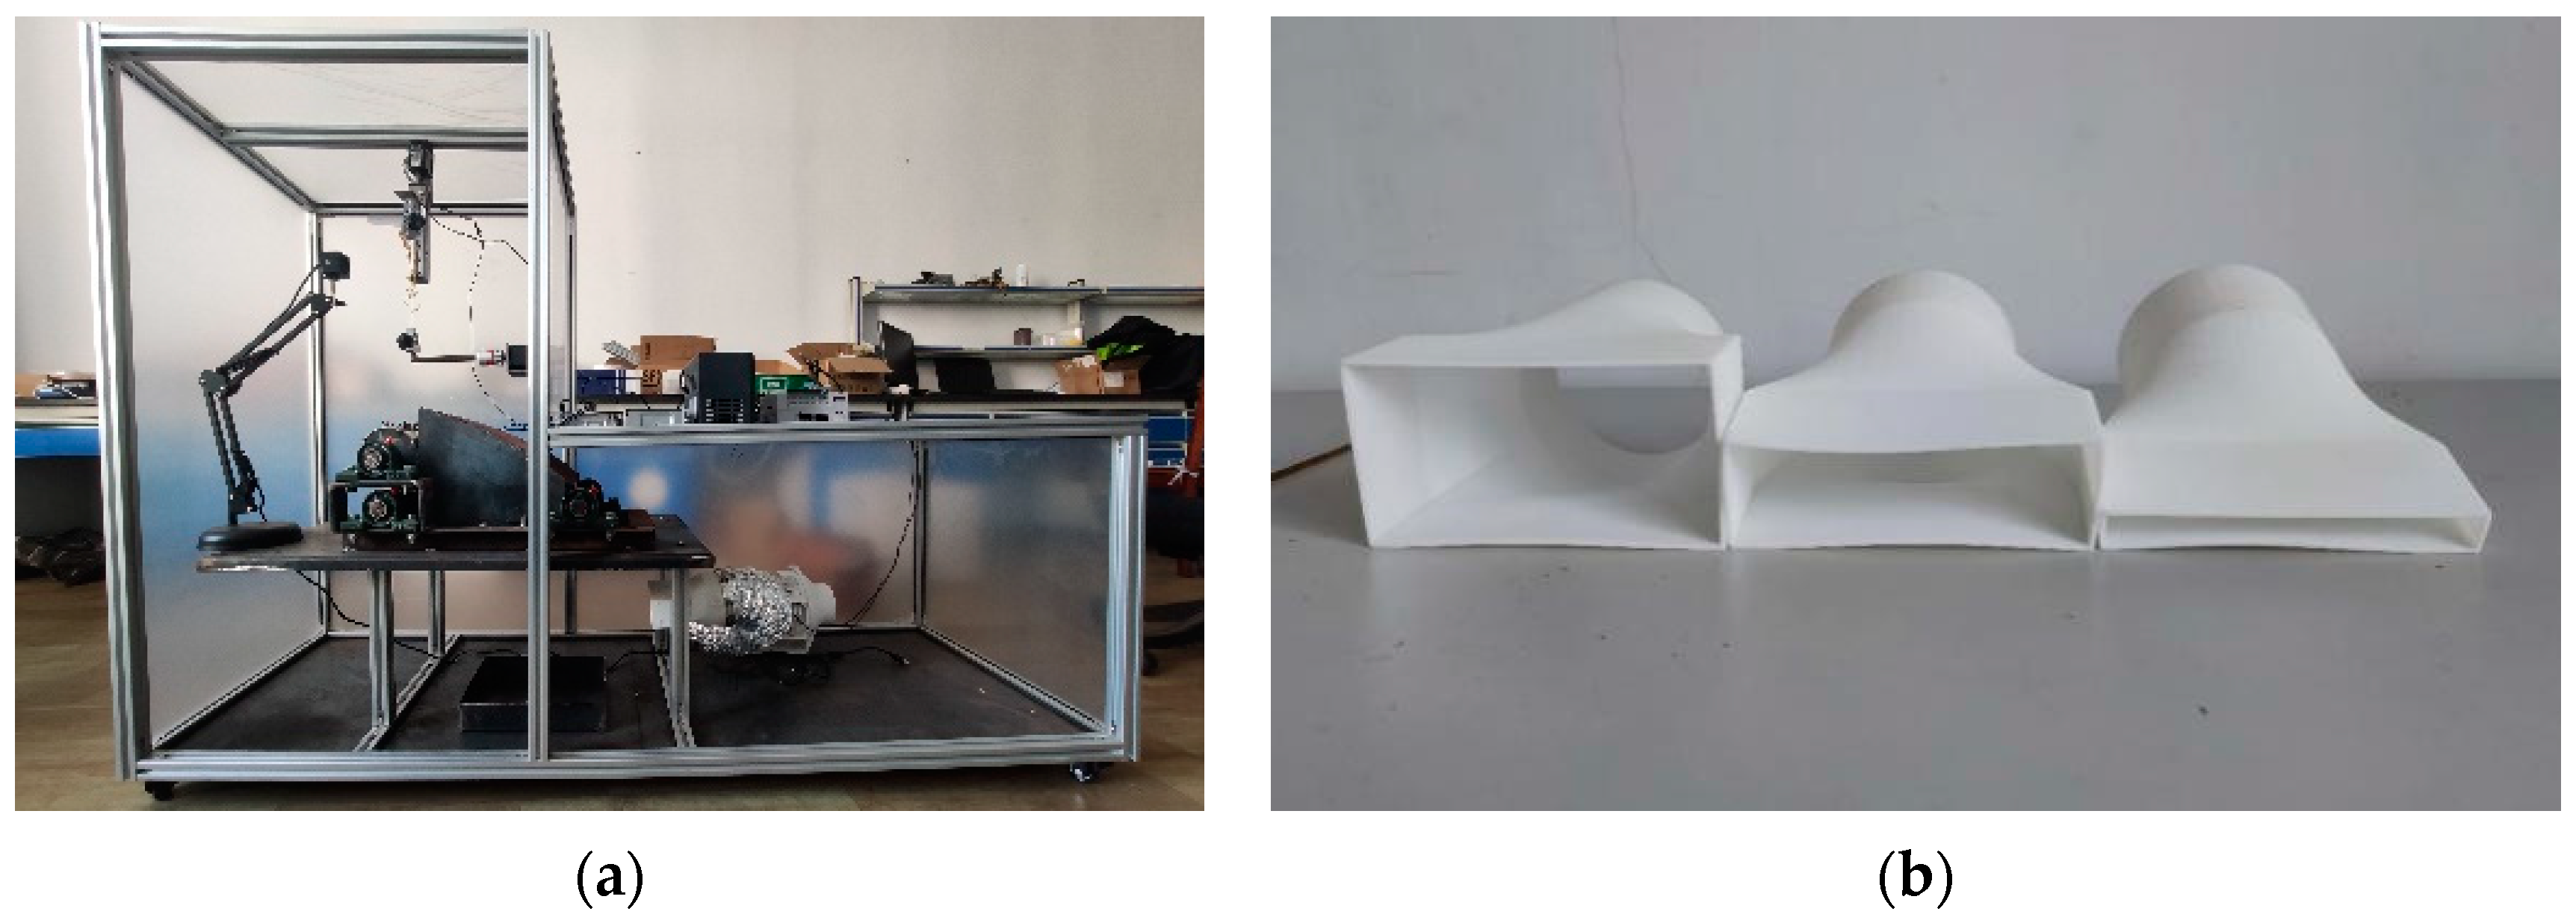
In order to verify the reliability of the DEM–CFD coupled method in the simulation study of rice clearing, a rice threshing and clearing test platform (Figure 7a) was built for a single plant of rice, and screening tests were conducted on rice grains. The rated voltage of the fan was 220 V, the power was 28 W, the air volume was 220 m3·h−1, the air pressure was 150 Pa, and the tuyere specification was 100 mm. The working voltage of the speed control switch was AC180–250 V; an aluminum foil air duct was selected for the ventilation pipe. The high-precision anemometer model was the Xima split anemometer AS-836, with a measuring range of 0–45 m·s−1, resolution of 0.001, starting value of 0.3, and accuracy of ±3% rdg ± 0.1. The forward wind speed was adjusted to the speed required by the experiment through the frequency converter. The model of the air outlet in Figure 7b was formed by 3D printing. The material was made of a photosensitive resin with high mechanical strength and versatility. According to the test requirements, the air outlet was set up in three specifications: 150 mm × 20 mm, 150 mm × 50 mm, and 150 mm × 80 mm.

3. Results and Analysis

3.1. Orthogonal Test

3.1.1. Test Design and Method

A combined test method of quadratic regression orthogonal rotating center with four factors and three levels was adopted. With section width (x1), air speed of inlet (x2), horizontal distance (x3), and vertical distance (x4) as influencing factors and removal rate (Y) as evaluation index, a total of 27 groups of tests were carried out. The data were processed and analyzed with Design-Expert 12 software, and the tests were carried out in accordance with the standard GB/T 5982-2017 Thresher-Testing method [50], taking the mean value of three repetitions as the test results. The level of each factor was determined by the pre-test. The coding table of factor level and the test plan are shown in Table 3 and Table 4. In the table, x1, x2, x3, and x4 are factor coding values.

3.1.2. Test Design and Method

The test results are shown in Table 4.

3.2. Regression Model and Variance Analysis

3.2.1. Regression Equation

The test results were analyzed, and the quadratic regression model excluding impurity rate Y was meaningful (p < 0.0001). Under confidence α = 0.05, an F test was conducted, and the non-significant terms were eliminated to obtain a simplified regression (Equation (12) [51]:
Y = 57.33 + 15.51A + 15.87B − 15.68C − 14.74D + 4.8AB + 4.5AC − 2.38AD − 6.6BC − 9.05BD − 1.72CD − 12.61A2 − 7.25B2 + 2.34C2 − 4.12D2

3.2.2. Regression Model Analysis of Variance

The results of Equation (12) were analyzed by variance, and the results are shown in Table 5.
As can be seen from the table, the model had a good fitting effect, and the regression equation p < 0.0001 indicates that the regression equation was extremely significant.

3.3. Response Surface Analysis

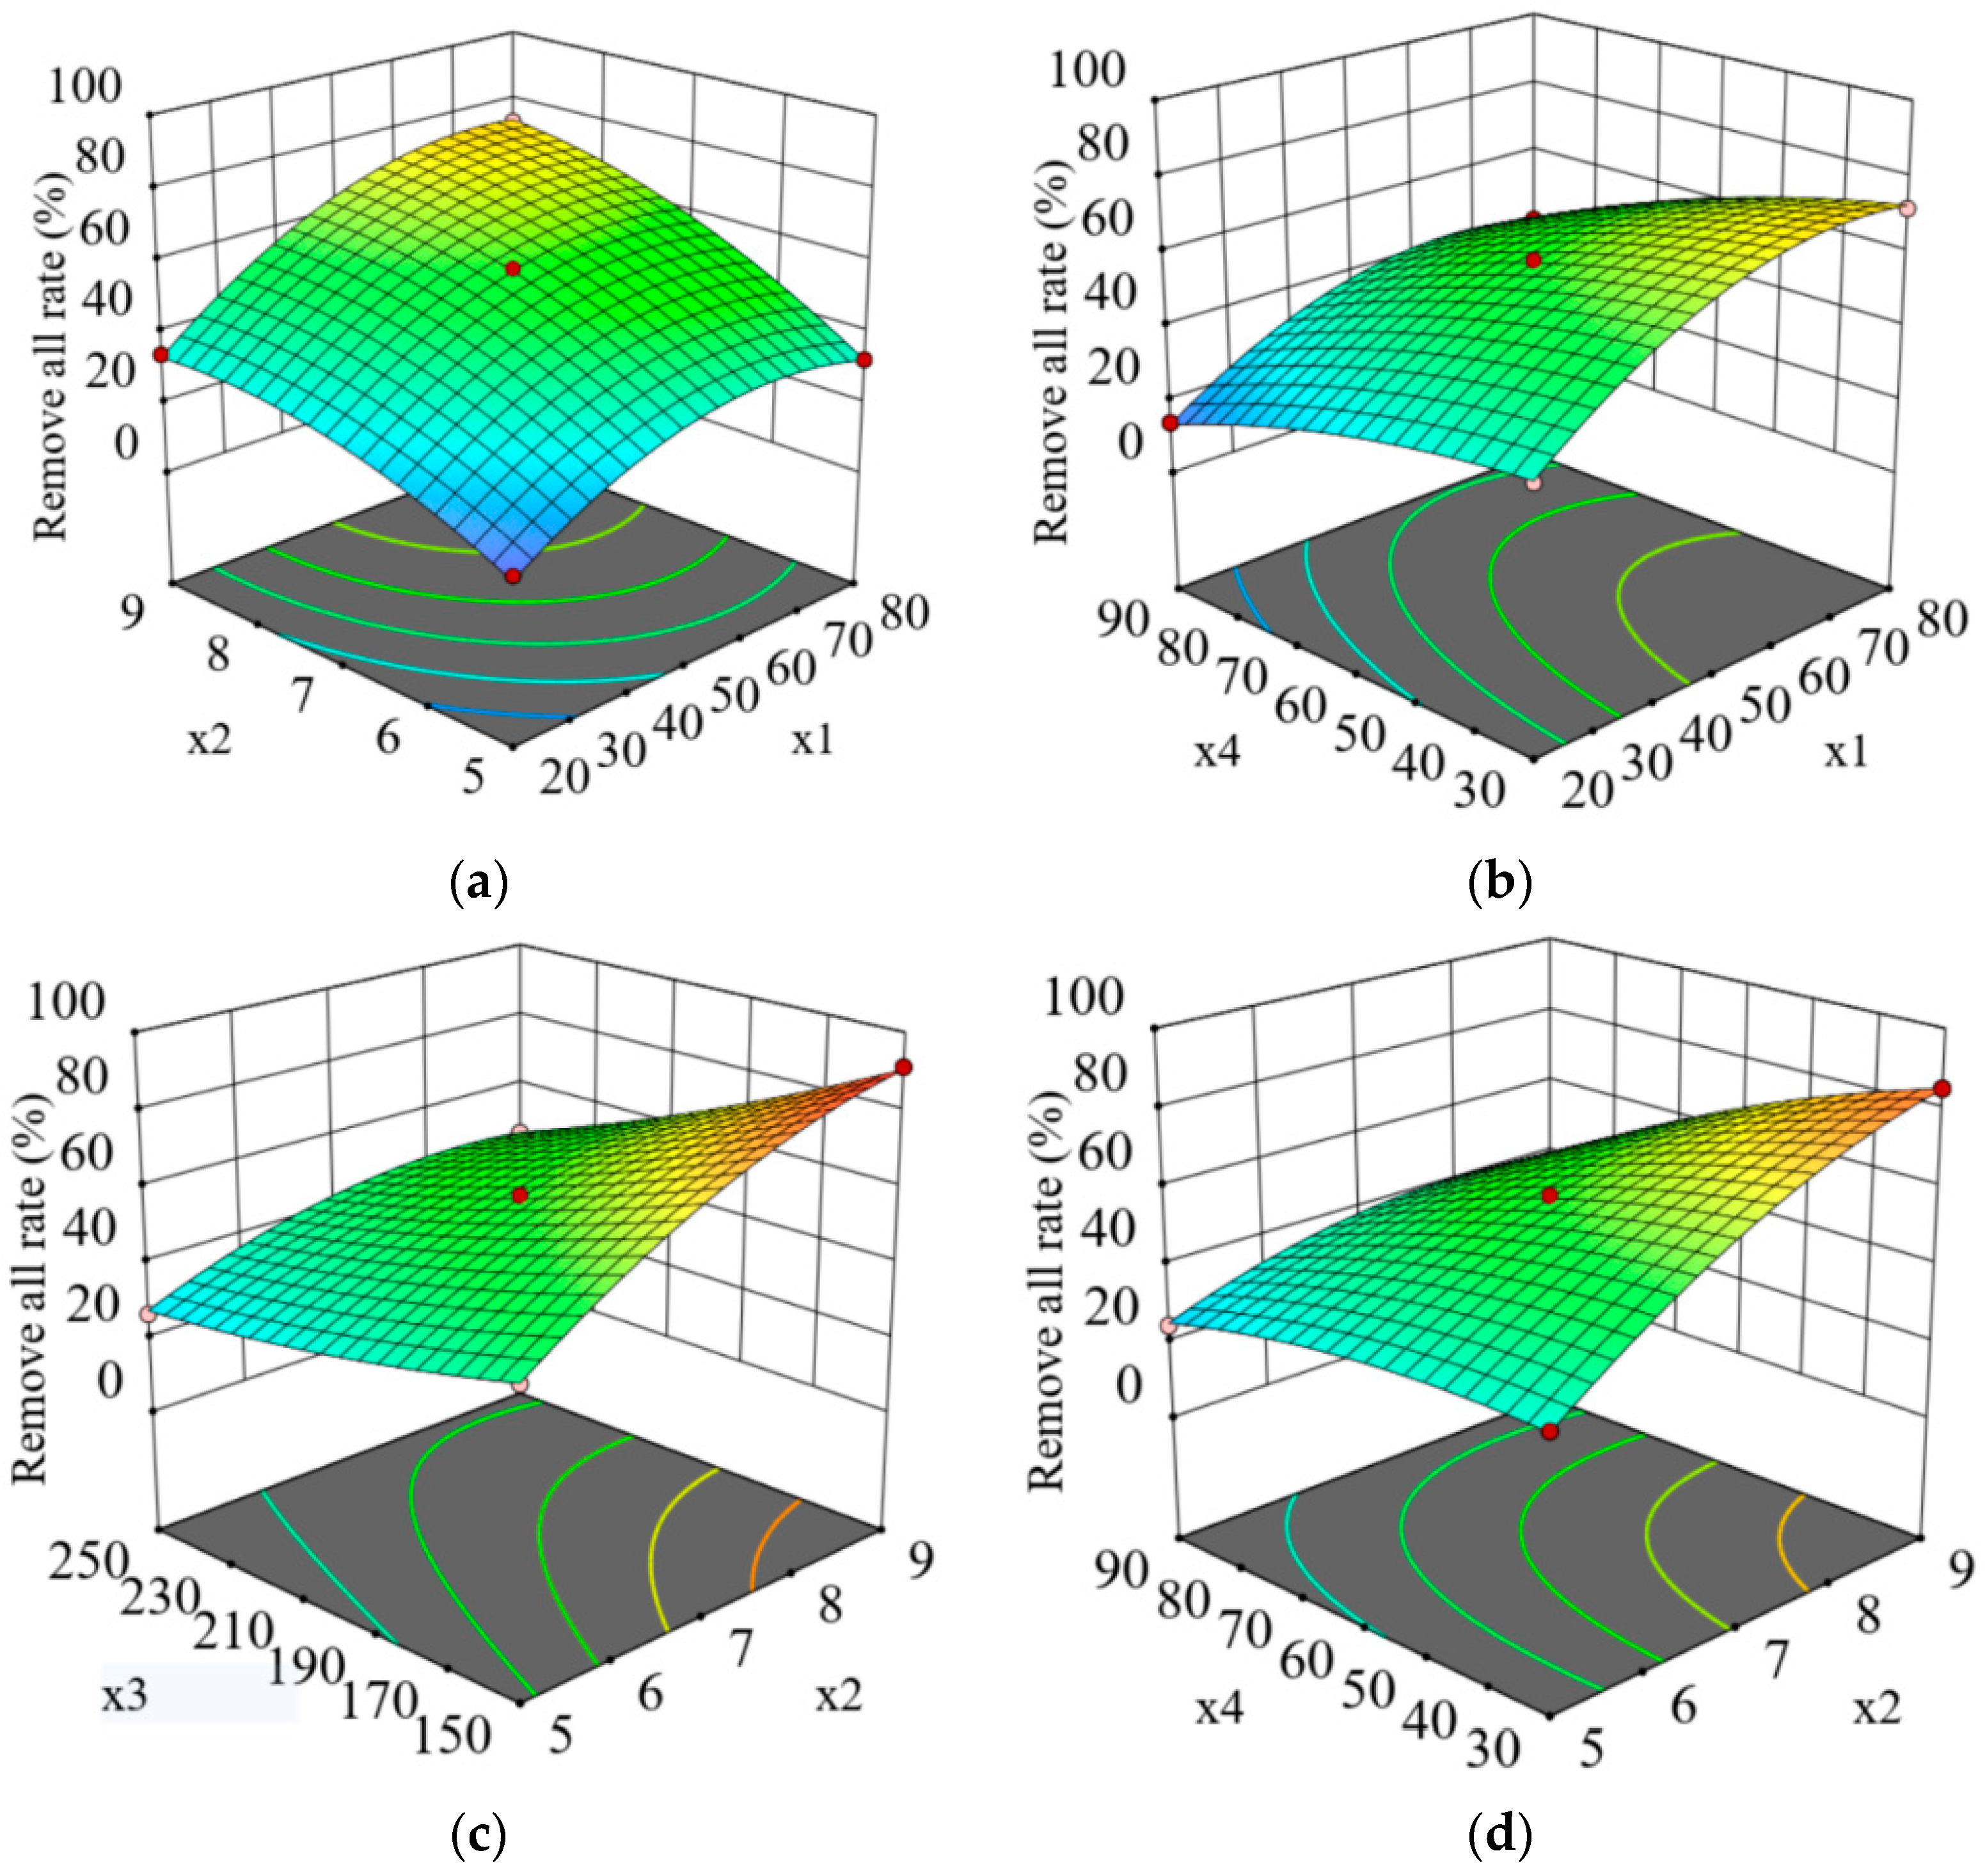
The relation surface between each test factor and the removal rate is shown in Figure 8.
The relation surface between each test factor and the removal rate is shown in Figure 8. As can be seen from Figure 8a, with the increase in cross-section width, the removal rate showed a gradual increasing trend. This was due to the increase in rice grains in the windward region of clear selection, and the increase in the transverse velocity difference between filled and unfilled grain, which made it easier to separate the strength and unfilled grain, which increased the removal rate. When the section width was fixed at a certain value, the removal rate gradually increased with the increase in the wind speed in the inlet. This was because the larger the wind speed was, the greater the horizontal force it exerted on the rice grains, and the unfilled grains with smaller mass were subjected to greater acceleration, and, therefore, the removal rate increased.
As can be seen from Figure 8b, with the increase in vertical distance, the removal rate showed a slow downward trend. This is because, with the increase in vertical distance, the transverse stress area of rice was small, the acceleration was not obvious, and the work performed on the unfilled grain was small, so the unfilled grain could not be completely separated, and the removal rate decreased.
As can be seen from Figure 8c, with the increase in horizontal distance, the removal rate tended to decrease gradually. This was because, when the air inlet speed was constant, the horizontal force and torque were constant, while the wind energy decreased in the transmission process, which weakened the separation effect.
Figure 8d shows that, with the increase in wind speed, the removal rate showed a gradually rising trend. This was because, when the vertical distance was fixed, the greater the wind speed and the bigger the horizontal stress. Additionally, because of quality differences between the filled and unfilled grain, there were obvious differences in the flat acceleration; the flat acceleration of the solid particle was low, while that of the unfilled grain was higher, which led to an obvious flat separation effect, and, with a higher wind speed, the greater the flat speed difference between filled and unfilled grain and the higher the removal rate.
In summary, the removal rate was positively correlated with the section width, the air inlet wind speed, the vertical distance, and the horizontal distance. According to the optimization principle of the removal rate, the horizontal interval of each factor was taken as the constraint condition, and the optimal structure and working parameter range were selected. The optimization results showed that the section width was 75.44 mm, the air inlet speed was 8.90 m·s−1, the horizontal distance was 198.78 mm, the vertical distance was 34.87 mm, and the removal rate could reach 99.6%.

3.4. Rice Grain Screening Experiment

The distribution of filled and unfilled grains after screening is shown in Figure 9a. The screening condition was as follows: the horizontal and vertical distances between the center height of the fan section and the center of the seed-dropping port were 200 mm and 60 mm, respectively. When the distance between the air outlet and the seed-drop point was fixed, the removal rate improved with the increase in wind speed, but the increasing trend decreased gradually.
As shown in Figure 9b, the size of the outlet was 150 mm × 20 mm. When the wind speed of the outlet was 9 m·s−1, there was a maximum difference between the simulated test and the platform test. The removal rate of the platform test was 33.9%, while that of the simulated test was 34.5%.
As shown in Figure 9c, the size of the outlet was 150 mm × 50 mm. When the wind speed of the outlet was 5 m·s−1, there was a maximum difference between the simulated test and the platform test. The removal rate of the platform test was 32.4%, while that of the simulated test was 33.4%.
As shown in Figure 9d, the size of the outlet was 150 mm × 80 mm. When the wind speed of the outlet was 9 m·s−1, there was a maximum difference between the simulated test and the platform test. The removal rate of the platform test was 73.2%, while that of the simulated test was 75.2%.
Given all this, the test data showed that the change trends of the experimental results and simulation results were basically identical; when the cross-section width and inlet velocity increased, the horizontal distance and vertical distance between seeds decreased, the level of the rice grain stress P increased, the material trajectory angle α increased with the force of gravity, and the horizontal displacement of material became bigger. Therefore, the purge-out rice grain rate was increased. However, there were some deviations between the experimental results and the simulation which were caused by the randomness of the volume and mass of filled and unfilled grains in the experiment compared with the simulation. The removal rates of rice grains in the experiment were all higher than the simulated data, but the differences between these two results were not significant. Therefore, the simulation research of rice screening based on the DEM–CFD coupling method had good accuracy and feasibility.

4. Conclusions

The DEM–CFD coupled method was used to simulate the rice screening process under different wind speeds [52]. The stress state and motion tendency of filled and unfilled grain of rice panicles in the flow field were analyzed in the fluid domain. Through statistical calculation, the rice grain removal rate under different parameters was obtained, and the following conclusions were drawn:
(1) A grain-clearing mechanism of an intelligent rice seed testing platform using a “Wind–Gravity” composite field was designed. The key parameters of the device were studied and optimized, the factors which influence the internal wind field distribution were studied, the rice particles in composite mechanics characteristics and movement in the field were analyzed, the fan outlet size, wind speed, distance, and the rice grain setting point geometry parameters were optimized, and a mathematical model related to the screening rate and screening parameters was established;
(2) A quadratic regression test was used to analyze the influencing factors of the removal rate. Through variance analysis and response surface analysis, the optimal combination of the four influencing factors was obtained as follows: when the section width was 75.44 mm, the air inlet speed was 8.90 m·s−1, the horizontal distance was 198.78 mm, and the vertical distance was 34.87 mm, the removal rate was 99.6%, achieving the best effect, which is in line with the requirements of the seed testing;
(3) Through comparative analysis, the grain screening system was shown to have a good function for filled grain and unfilled grain screening, and the test results were close to the simulation results without significant difference. The DEM–CFD coupling method can be effectively used in the simulation analysis of the rice threshing and screening process, and the parameters obtained can provide a reference for the design of the screening device.

Author Contributions

Conceptualization, H.D., B.Z., T.J., Y.Z., J.Q., C.C., Y.X., Y.D. and X.X.; methodology, B.Z. and X.X.; software, H.D. and T.J.; experiment, H.D., T.J. and Y.D.; data curation, H.D. and T.J.; writing—original draft preparation, H.D. and B.Z.; writing—review and editing, H.D. and B.Z.; visualization, H.D. and B.Z.; supervision, B.Z. and X.X.; project administration, B.Z. and X.X.; funding acquisition, H.D., B.Z. and X.X. All authors have read and agreed to the published version of the manuscript.

Funding

This research was funded by the Jiangsu Graduate Scientific Research Innovation Program (JSCX21-1623), Jiangsu Modern Agricultural Machinery Equipment and Technology Demonstration and Promotion Project (NJ2022-10), High-End Talent Support Program of Yangzhou University, Jiangsu Agricultural Science and Technology Innovation Fund (No. CX(22)3098), and the Jiangsu Agricultural Science and Technology Innovation Fund (No. CX(21)3150).

Institutional Review Board Statement

Not applicable.

Informed Consent Statement

Not applicable.

Data Availability Statement

Not applicable.

Acknowledgments

The authors would like to thank the teachers and supervisors for their technical support. We would also like to acknowledge the assistance provided by brothers and sisters during the tests. Finally, we are grateful to the editor and anonymous reviewers for providing helpful suggestions to improve the quality of this paper.

Conflicts of Interest

The authors declare no conflict of interest.

References

  1. Zhou, H. The Design and Implementation of Rice Seed Counting System Based on Image Processing. Master’s Thesis, University of Electronic Science and Technology of China, Chengdu, China, 2019. (In Chinese with English abstract). [Google Scholar]
  2. Zhang, J. Performance Test of 5TR-20 Type Rice Thresher for Single Plant and Single Ear. Agric. Sci. Technol. Equip. 2020, 1, 19–20, (In Chinese with English abstract). [Google Scholar]
  3. Tang, H.; Xu, C.; Wang, Z.; Wang, Q.; Wang, J. Optimized Design, Monitoring System Development and Experiment for a Long-Belt Finger-Clip Precision Corn Seed Metering Device. Front. Plant Sci. 2022, 13, 814747. [Google Scholar] [CrossRef] [PubMed]
  4. Fu, J.; Chen, Z.; Han, L.; Ren, L. Review of grain threshing theory and technology. Int. J. Agric. Biol. Eng. 2018, 11, 12–20. [Google Scholar] [CrossRef]
  5. Du, X.; Ni, K.; Chen, J.; Wu, C.; Zhao, Y. Numerical simulation and experiment of gas-solid two-phase flow in a cross-flow grain cleaning device. In American Society of Agricultural and Biological Engineers; American Society of Agricultural and Biological Engineers: Kansas City, MI, USA, 2013; p. 1. [Google Scholar]
  6. Binelo, M.O.; de Lima, R.F.; Khatchatourian, O.A.; Stransky, J. Modelling of the drag force of agricultural seeds applied to the discrete element method. Biosyst. Eng. 2019, 178, 168–175. [Google Scholar] [CrossRef]
  7. Lin, J. Study on Design and Experiment of winnowing Machine by specific gravity for Apricot stone Shell and Kernel. Master’s Thesis, Xinjiang Agricultural University, Urumchi, China, 2013. (In Chinese with English abstract). [Google Scholar]
  8. Krishnan, P.; Berlage, A. Separation of shells from walnut meats using magnetic methods. Trans. ASAE 1984, 27, 1990–1992. [Google Scholar] [CrossRef]
  9. Li, H.; Li, Y.; Gao, F.; Zhao, Z.; Xu, L. CFD–DEM simulation of material motion in air-and-screen cleaning device. Comput. Electron. Agric. 2012, 88, 111–119. [Google Scholar] [CrossRef]
  10. Zhang, T.; Li, Y.; Xu, L.; Liu, Y.; Ji, K.; Jiang, S. Experimental Study on Fluidization Behaviors of Wet Rice Threshed Materials with Hot Airflow. Agriculture 2022, 12, 601. [Google Scholar] [CrossRef]
  11. Chen, S. Simulation and Key Parameter Optimization of Wheat Harvester Cleaning based on CFD-DEM. Master’s Thesis, University of Jinan, Jinan, China, 2021. (In Chinese with English abstract). [Google Scholar]
  12. Wang, C.-N.; Yang, F.-C.; Nguyen, V.T.T.; Vo, N.T.M. CFD Analysis and Optimum Design for a Centrifugal Pump Using an Effectively Artificial Intelligent Algorithm. Micromachines 2022, 13, 1208. [Google Scholar] [CrossRef]
  13. Ren, J.; Wu, T.; Mo, W.; Li, K.; Hu, P.; Xu, F.; Liu, Q. Discrete Element Simulation Modeling Method and Parameters Calibration of Sugarcane Leaves. Agronomy 2022, 12, 1796. [Google Scholar] [CrossRef]
  14. Xu, J.; Hou, J.; Wu, W.; Han, C.; Wang, X.; Tang, T.; Sun, S. Key Structure Design and Experiment of Air-Suction Vegetable Seed-Metering Device. Agronomy 2022, 12, 675. [Google Scholar] [CrossRef]
  15. Zhang, N.; Fu, J.; Chen, Z.; Chen, X.; Ren, L. Optimization of the Process Parameters of an Air-Screen Cleaning System for Frozen Corn Based on the Response Surface Method. Agriculture 2021, 11, 794. [Google Scholar] [CrossRef]
  16. Liu, P.; Jin, C.; Liu, Z.; Zhang, G.; Cai, Z.; Kang, Y.; Yin, X. Optimization of field cleaning parameters of soybean combine harvester. Trans. Chin. Soc. Agric. Eng. 2020, 36, 35–45, (In Chinese with English abstract). [Google Scholar]
  17. Zhu, P. Simulation Research on Grain Air-and-Screen Cleaning Process and Optimization of Key Parameters. Master’s Thesis, Zhejiang University, Hangzhou, China, 2019. (In Chinese with English abstract). [Google Scholar]
  18. Geng, L.; Yang, F.; Wang, S.; Han, R.; Hu, J. Experimental Study on Aerodynamic Characteristics of Chinese Cabbage Seed Extraction Components. J. Agric. Mech. Res. 2020, 42, 161–165. [Google Scholar] [CrossRef]
  19. Ma, Z.; Li, Y.; Xu, L. Testing and analysis on rape excursion components characteristics in floating, friction and wettability. Trans. Chin. Soc. Agric. Eng. 2011, 27, 13–17, (In Chinese with English abstract). [Google Scholar]
  20. Tang, H.; Xu, C.; Qi, X.; Wang, Z.; Wang, J.; Zhou, W.; Wang, Q.; Wang, J. Study on Periodic Pulsation Characteristics of Corn Grain in a Grain Cylinder during the Unloading Stage. Foods 2021, 10, 2314. [Google Scholar] [CrossRef]
  21. Zhang, C.; Fan, X.; Li, M.; Li, G.; Zhao, C.; Sun, W. Simulation Analysis and Experiment of Soil Disturbance by Chisel Plow Base on EDEM. Trans. Chin. Soc. Agric. Mach. 2022, 53, 52–59, (In Chinese with English abstract). [Google Scholar]
  22. Ding, H. Study of grain vertical air separation based on DEM-CFD coupling. Master’s Thesis, University of Science and Technology Liaoning, Anshan, China, 2020. (In Chinese with English abstract). [Google Scholar]
  23. Wang, M.; Liu, Q.; Ou, Y.; Zou, X. Numerical Simulation and Verification of Seed-Filling Performance of Single-Bud Billet Sugarcane Seed-Metering Device Based on EDEM. Agriculture 2022, 12, 983. [Google Scholar] [CrossRef]
  24. He, S.; Zang, Y.; Huang, Z.; Tao, W.; Xing, H.; Qin, W.; Jiang, Y.; Wang, Z. Design of and Experiment on a Cleaning Mechanism of the Pneumatic Single Seed Metering Device for Coated Hybrid Rice. Agriculture 2022, 12, 1239. [Google Scholar] [CrossRef]
  25. Tang, H.; Xu, C.; Xu, W.; Xu, Y.; Xiang, Y.; Wang, J. Method of straw ditch buried returning, development of supporting machine and analysis of influencing factors. Front. Plant Sci. 2022, 13, 967838. [Google Scholar] [CrossRef]
  26. Gao, X.; Shi, W.; Shi, Y.; Chang, H.; Zhao, T. DEM-CFD Simulation and Experiments on the Flow Characteristics of Particles in Vortex Pumps. Water 2020, 12, 2444. [Google Scholar] [CrossRef]
  27. Han, D.; Zhang, D.; Jing, H.; Yang, L.; Cui, T.; Ding, Y.; Wang, Z.; Wang, Y.; Zhang, T. DEM-CFD coupling simulation and optimization of an inside-filling air-blowing maize precision seed-metering device. Comput. Electron. Agric. 2018, 150, 426–438. [Google Scholar] [CrossRef]
  28. Napolitano, E.S.; di Renzo, A.; di Maio, F.P. Coarse-grain DEM-CFD modelling of dense particle flow in Gas–Solid cyclone. Sep. Purif. Technol. 2022, 287, 120591. [Google Scholar] [CrossRef]
  29. Sharma, A.; Thakur, A.; Saha, S.K.; Sharma, A.; Sharma, D.; Chaudhuri, P. Thermal-hydraulic characteristics of purge gas in a rectangular packed pebble bed of a fusion reactor using DEM-CFD and porous medium analyses. Fusion Eng. Des. 2020, 160, 111848. [Google Scholar] [CrossRef]
  30. Zhao, L.; Chen, L.; Yuan, F.; Wang, L. Simulation Study of Rice Cleaning Based on DEM-CFD Coupling Method. Processes 2022, 10, 218. [Google Scholar] [CrossRef]
  31. Ma, X.; Zhao, L.; Guo, B.; Dang, H. Simulation and experiment of rice cleaning in air-separation device based on DEM-CFD coupling method. Int. J. Agric. Biol. Eng. 2020, 13, 226–233. [Google Scholar] [CrossRef]
  32. Wang, L.; Liao, Y.; Wan, X.; Wang, B.; Hu, Q.; Liao, Q. Design and Test on Mixing Component of Air-assisted Centralized Metering Device for Rapeseed and Wheat. Trans. Chin. Soc. Agric. Mach. 2022, 53, 68–79+97, (In Chinese with English abstract). [Google Scholar]
  33. Wang, Y.; Li, H.; Hu, H.; He, J.; Wang, Q.; Lu, C.; Liu, P.; He, D.; Lin, X. DEM—CFD coupling simulation and optimization of a self-suction wheat shooting device. Powder Technol. 2021, 393, 494–509. [Google Scholar] [CrossRef]
  34. Nguyen, V.; Tran, T.; Nguyen, T.; Huynh, H.; To, V.; Doan, D.; Nguyen, T.; Van Thanh, D. An investigation of designing and manufacturing the hard-shell peanut peeling machine with a small scale-size. Int. J. Sci. Technol. Res 2019, 8, 9. [Google Scholar]
  35. Bekkering, C.S.; Huang, J.; Tian, L. Image-Based, Organ-Level Plant Phenotyping for Wheat Improvement. Agronomy 2020, 10, 1287. [Google Scholar] [CrossRef]
  36. Tien, N.V.T.; Van, A.D.; Ngoc, T.T.; Cong, H.N.; Dai, H.V.; Dang, K.N.; Ngoc, L.N.; Quang, L.N.; Thien, L.T.; Tan, N.B.; et al. An investigation on design innovation, fabrication and experiment of a soy bean peeling machine-scale. Int. J. Eng. Technol. 2018, 7, 2704–2709. [Google Scholar]
  37. Lu, Y.R.; Nikrityuk, P.A. Steam methane reforming driven by the Joule heating. Chem. Eng. Sci. 2022, 251, 117446. [Google Scholar] [CrossRef]
  38. Tian, L.; Jin, E.; Wang, J.; Wang, X.; Bing, W.; Jin, H.; Zhao, J.; Ren, L. Exploring the antifouling effect of elastic deformation by DEM-CFD coupling simulation. Rsc Adv. 2019, 9, 40855–40862. [Google Scholar] [CrossRef] [PubMed] [Green Version]
  39. Takabatake, K.; Sakai, M. Flexible discretization technique for DEM-CFD simulations including thin walls. Adv. Powder Technol. 2020, 31, 1825–1837. [Google Scholar] [CrossRef]
  40. Wang, C.; Hausberger, A.; Nothdurft, P.; Lackner, J.M.; Schwarz, T. The Potential of Tribological Application of DLC/MoS2 Coated Sealing Materials. Coatings 2018, 8, 267. [Google Scholar] [CrossRef] [Green Version]
  41. Tan, Z.; Liang, C.; Chen, X.; Li, J. Comparisons of TFM and DEM-CFD simulation analyses on the influence mechanism of electrostatics on single bubble in gas-solid fluidized bed. Powder Technol. 2019, 351, 238–258. [Google Scholar] [CrossRef]
  42. Zhao, Y.; Jin, Y.; Pan, C.; Wu, C.; Yuan, X.; Zhou, G.; Han, W. Characterization of Bond Fracture in Discrete Groove Wear of Cageless Ball Bearings. Materials 2022, 15, 6711. [Google Scholar] [CrossRef]
  43. Mindlin, R.D. Compliance of Elastic Bodies in Contact. J. Appl. Mech 1949, 16, 259–268. [Google Scholar]
  44. Rossander, M.; Dyachuk, E.; Apelfröjd, S.; Trolin, K.; Goude, A.; Bernhoff, H.; Eriksson, S. Evaluation of a Blade Force Measurement System for a Vertical Axis Wind Turbine Using Load Cells. Energies 2015, 8, 5973–5996. [Google Scholar] [CrossRef]
  45. Yuan, H.; Liu, Y.; Song, M.; Zhu, Y.; Cao, W.; Jiang, X.; Ni, J. Design of the Mechanical Structure of a Field-Based Crop Phenotyping Platform and Tests of the Platform. Agronomy 2022, 12, 2162. [Google Scholar] [CrossRef]
  46. Boac, J.M.; Casada, M.E.; Maghirang, R.G.; Harner, J.P. MATERIAL AND INTERACTION PROPERTIES OF SELECTED GRAINS AND OILSEEDS FOR MODELING DISCRETE PARTICLES. Trans. ASABE 2010, 53, 1201–1216. [Google Scholar] [CrossRef] [Green Version]
  47. Cleary, P.W. Particulate mixing in a plough share mixer using DEM with realistic shaped particles. Powder Technol. 2013, 248, 103–120. [Google Scholar] [CrossRef]
  48. Correa, P.C.; da Silva, F.S.; Jaren, C.; Afonso, P.C.; Arana, I. Physical and mechanical properties in rice processing. J. Food Eng. 2007, 79, 137–142. [Google Scholar] [CrossRef]
  49. Jia, H.L.; Deng, J.Y.; Deng, Y.L.; Chen, T.Y.; Wang, G.; Sun, Z.J.; Guo, H. Contact parameter analysis and calibration in discrete element simulation of rice straw. Int. J. Agric. Biol. Eng. 2021, 14, 72–81. [Google Scholar] [CrossRef]
  50. GB/T 5982-2017; Thresher-Testing Method. General Administration of Quality Supervision, Inspection and Quarantine of the People ‘s Republic of China: Beijing, China, 2017.
  51. Liu, B.F.; Li, J.; He, J. Study on hyperspectral remote sensing monitoring and diagnosis model of total phosphorus content in maize leaves. J. Agric. Mach. 2015, 46, 252–258+280. [Google Scholar]
  52. Ren, J.; Wu, T.; Liu, Q.; Zou, X.; Li, K. Design and Test of the Structure of Extractor Negative Pressure Zone of Sugarcane Chopper Harvester. Agronomy 2022, 12, 2336. [Google Scholar] [CrossRef]
Figure 1. The structure diagram of the threshing and clearing process on the seed testing platform: 1—frame; 2—cylinder; 3—conveyer belt; 4—grain collection device; 5—air outlet; 6—duct blower.
Agronomy 12 03069 g001
Figure 2. Calculation model: A—depth of section; B—vertical distance; C—horizontal distance; 1—inlet (air flow); 2—inlet (materials); 3—outlet (air flow); 4—outlet 1; 5—outlet 2.
Agronomy 12 03069 g002
Figure 3. Rice particle simulation: (a) particle size; (b) particle model; (c) rice grain.
Agronomy 12 03069 g003
Figure 4. Wind field with different outlet wind speed: (a) v = 5 m·s−1; (b) v = 7 m·s−1; (c) v = 9 m·s−1.
Agronomy 12 03069 g004
Figure 5. Force analysis diagram of rice grains.
Agronomy 12 03069 g005
Figure 6. Distribution state and track of grain at different time cut-off points: (a) t = 1 s; (b) t = 2 s; (c) t = 2.5 s; (d) motion trajectories of unfilled grains.
Agronomy 12 03069 g006
Figure 7. Diagram of experimental installation: (a) threshing screening system; (b) three different air vents.
Agronomy 12 03069 g007
Figure 8. The interaction of factors affected the response surface of the removal rate: (a) x3 and x4 were 200 mm and 60 mm, respectively, the relationship between the removal rate and x1 x2; (b) x2 and x3 were 7 m·s−1 and 200 mm, respectively, the relationship between the removal rate and x1 x4; (c) x1 and x4 were 50 mm and 60 mm, respectively, the relationship between the removal rate and x2 x3; (d) x1 and x3 were 50 mm and 200 mm, respectively, the relationship between the removal rate and x2 x4.
Agronomy 12 03069 g008
Figure 9. Verification diagram of solid and unfilled grain test after screening: (a) the distribution of solid and unfilled grains after screening; (b) x1, x3, and x4 were 20 mm, 200 mm, and 60 mm, respectively, the relationship between the removal rate of predicted and actual; (c) x1, x3, and x4 were 50 mm, 200 mm, and 60 mm, respectively, the relationship between the removal rate of predicted and actual; (d) x1, x3, and x4 were 80 mm, 200 mm, and 60 mm, respectively, the relationship between the remove all rate of predicted and actual.
Agronomy 12 03069 g009
Table 1. Physical parameters of materials.
Poisson’s RatioShear Modulus/PaDensity/kg·m−3
Filled grain0.302 × 1061380
Unfilled grain0.401 × 106100
Steel0.297.992 × 10107800
Table 2. Contact coefficient of materials.
Coefficient of
Restitution
Coefficient of
Static Friction
Coefficient of
Rolling Friction
filled grain–filled grain0.21.00.01
filled grain–unfilled grain0.20.80.01
filled grain–steel0.50.70.01
unfilled grain–unfilled grain0.20.70.01
unfilled grain–steel0.20.80.01
Table 3. Factors coding.
CodingFactors
Section Width
(mm)
Air Speed of Inlet
(m·s−1)
Horizontal Distance
(mm)
Vertical Distance
(mm)
−120515030
050720060
180925090
Table 4. Experimental design scheme and results.
Serial NumberSection Width
(mm)
x1
Air Speed of Inlet
(m·s−1)
x2
Horizontal Distance
(mm)
x3
Vertical Distance
(mm)
x4
Removal Rate
(%)
Y
15052009024.3
25092506045.9
35072006056.7
48072003071.8
55052003035.6
65091506091.2
72052006012.3
82072009013.8
95051506045.4
108072506051.6
118092006073.2
125072503056.9
135071503083.4
142072003036.4
155072509025.2
16207250609.9
175071509058.6
188052006032.4
198071506074.6
205072006057.2
212092006033.9
225092003085.1
232071506050.9
248072009039.7
255052506026.5
265072006058.1
275092009037.6
Table 5. Analysis of variance.
ProjectRemoval Rate (%)
SquaresFP
Model13,221.36768.70<0.0001
A2886.102349.21<0.0001
B3021.012459.02<0.0001
C2948.472399.97<0.0001
D2408.331960.32<0.0001
AB81.0075.02<0.0001
AC92.1665.93<0.0001
AD22.5618.370.0011
BC174.24141.83<0.0001
BD327.61266.67<0.0001
CD11.909.690.0090
A2848.40690.58<0.0001
B2280.33228.18<0.0001
C229.1423.720.0004
D290.7573.87<0.0001
Residual14.74
Lack of Fit13.742.730.2979
Pure Error1.01
Publisher’s Note: MDPI stays neutral with regard to jurisdictional claims in published maps and institutional affiliations.