Article

Soil Sustainability: Analysis of the Soil Compaction under Heavy Agricultural Machinery Traffic in Extensive Crops

by
Guido Fernando Botta
1,*,
Gustavo Fabian Nardon
2 and
Rafael Guirado Clavijo
3
1
Departamento de Tecnología, Universidad Nacional de Luján, Av. Constitución y Ruta Nacional 5, Lujan 6700, Argentina
2
Facultad de Ciencias Exactas, Ingeniería y Agrimensura, Universidad Nacional de Rosario, Rosario 2000, Argentina
3
CIMEDES, Facultad de Ciencias Económicas y Empresariales, Universidad de Almería, 04120 Almería, Spain
*
Author to whom correspondence should be addressed.
Agronomy 2022, 12(2), 282; https://doi.org/10.3390/agronomy12020282
Submission received: 17 December 2021 / Revised: 16 January 2022 / Accepted: 19 January 2022 / Published: 22 January 2022

Abstract

:
Crop establishment depends mostly on the soil preparation and sowing methods used. Our main goal was to evaluate soil compaction and its effects on wheat (Triticum aestivum L.) and soybean (Glycine max L.) yields and seedling emergence with two different tillage methods: no-tillage (NT) and conventional tillage (CT). The study was done in the Western Pampas Region during three cropping seasons. The soil of the study site is a Mollisol. The variables measured were: (1) cone index (CI), (2) dry bulk density (DBD), (3) seedling emergence (SE), and (4) crops yield (CY). For both crops, seedling emergence was slower in NT than in CT, but results were similar 22 days after sowing. After 3 years, the results show that in NT the DBD and CI reached values of 1653 kg m−3 and 3210 kPa, respectively (between 275 and 300 mm). While in CT the values of DBD and CI reached were 1540 kg m−3 and 2300 kPa respectively at the same depth. The highest yields were found in CT (3.31 and 4.10 tons/ha−1, for soybean and wheat, respectively) compared to NT (2.91 and 3.53 tons/ha−1). Topsoil horizon has to be tilled to improve crop yields. In spite of the high number of equipment passes in CT, both tillage systems caused subsoil compaction.

1. Introduction

In addition to water and wind erosion, one of the main causes of soil degradation is soil compaction, being addressed in the European Soil Framework to an extent [1]. Currently, as an example of the problem, it can be deduced that more than half of the soil surface erosion worldwide is caused by soil degradation due to compaction and deformation caused by improper soil management.
The effects of soil compaction, which is often persistent, can be aggravated when compaction extends in depth (e.g., 0.4 m) into the subsoil [2,3].
In the last decade, much knowledge has been generated about conservation practices in farmland management. However, contradictory reports on the effects of tillage system on soil compaction continue to appear today. Results are variable and depend on crop, climate, soil type and management [4]. Apart from this, other reports have found overcompaction in soils with no-till or reduced tillage (e.g., [5,6]). Finally, significant increases in compaction have been reported, which ended up limiting crop development, mainly in production crops, e.g., corn (Zea mays L.) [4,6], sunflower [7], and soy (Glycine max L.) [8]. On the other hand, agricultural traffic with tractors and high axle weight machinery leads to subsoil compaction problems, regardless of whether the tire size is large enough or the high-flotation driving mechanism allows low-pressure surface traffic in the wheel/soil contact area [9,10].
In Argentina, 30 Mha of crops are sown using the continuous no-tillage system [8]. The remaining crop area is cultivated by conventional tillage. Periods of very intense rainfall characterize the climate of the area, especially when summer crops have not completely covered the soil or have not yet been planted. Clay-to-clay loam soils are predominant soils in this area. Erosion is reduced by at least 50% compared to bare soil through the use of conservation tillage. It is emphasized that wind erosion is an important soil degradation process in the semi-arid Argentine Pampas and has a detrimental effect on the ecosystems of this region [11].
Conservation tillage implies any tillage or seeding system that maintains a minimum of 30% residue cover on the soil surface after sowing [12]. This definition implies not turning the soil like the chisel plowing, and seeding without tilling first, but also direct seeding, also called no-tillage (NT). The difficulty of sowing in these soils is an obstacle to the wide use of conservation tillage (CT). Due to the greater accessibility and lower price of agrochemicals and the decrement in the number of operations and machinery required, no-tillage has been used in Argentina since the 1980s [7].
No-tillage, unlike conventional tillage methods, generally involves less intense traffic. However, after several years of continuous NT, the yields tend to decline [13]. This decline could lead to a combination of heightened weed control problems, root diseases, soil densification, and plentiful crop residues on the ground surface.
According to [14] work, they did not find much influence of the pre-tillage treatment (no-till, mold board plough, and chisel plow) on the vertical distribution of compaction. The experiment was conducted on a Mollic Orchraqualf, fine, illitic, mesic, colic soil with good contraction-expansion capacity, which led it to show cracks from 20 to 40 mm up to 500 to 800 mm wide during dry periods. However, they did find a response to different intensities of traffic (Mg km ha−1) in passes made carried out on the base with loads of 10 Mg and 20 Mg per axle and in control with no traffic.
The studies of [10,15] state, with concern, that reduced root growth and yield in many crops have long been the consequence of soil compaction. Both soybean (Glycine max L.) and perennial crops are vulnerable to this problem, as is the Western Pampas. In the same vein, [14] suggested that root growth is hindered in extremely dense or compacted soils. This limits the water consumption of the plant, thus affecting the final crop yield. The response of crop roots to compaction can be complicated by the many ways in which compaction can alter soil physical properties. There have been many attempts to find critical values of the cone index related to plant root growth restraining factors. In the Western Pampa (on an Entic Haplustoll soil), [7] stated that the dry weight of sunflower (Helianthus annus L.) roots was utterly reduced at a cone index of 1.6 MPa, and at more than 1.8 MPa, root growth became practically impossible. According to [16], they found that in the West Pampas, a cone index over 1158 kPa reduced reduction in dry root weight of cabbage crop (Brassica oleracea L.) in approximately 32%.
Currently, two of the most important crops in Argentina share the area described in the previous paragraphs: soybean (Glycine max L.) as a summer crop and wheat (Triticum aestivum L.) as a winter crop. These crops are grown under two different forms of soil tillage: (a) under NT and (b) under CT.
In this situation, soybean is an important crop in South America, with the largest producers being Brazil and Argentina, with about 114 and 46 million Mg, respectively, as registered in the 2020/2021 season [17]. In Argentina, soybean is grown in the Pampas region, which has more than 70% of the area cultivated with permanent no-tillage (≈16.6 M ha, [17]). Regarding the wheat crop, according to [17], wheat production for the 2021/22 marketing had a record 20.0 million Mg, 2% lower than last month but 13% higher than the previous year. The harvested area is estimated at 6.5 million hectares, the same as last month but 2% more than the previous year.
In this regard, the need emerges to know the rheology of the soil under contrasting intensities, derived from at least two conduction operations, CT versus NT. Thus, the real impact of traffic on the physical–mechanical properties under a basic hypothesis of system sustainability needs to be studied. Therefore, the objective of the work reported in this paper was to quantify the effect of soil densification on wheat and soybean yields in the soil representative of the Western Pampean Region of Argentina, during three growing seasons, employing two contrasting tillage methods, NT and CT.

2. Materials and Methods

2.1. Experimental Site

The experiment was conducted in the Western Pampean region at 36°04′33.18″ south and 62°29′14.57″ west in the Trenque Lauquen County during three cropping seasons (between 2012 and 2015). The site is located at an altitude of 27 m a.s.l. on a soil classified as Mollisol [18]. The soil management history preceding the experiment includes 18 years of crop rotation following a very standard pattern in the region of winter wheat (Triticum aestivum L.), followed by soybean (Glycine max L.) in summer. The textural composition of the soil is loam (like most soils in the Western Pampean region). Table 1 shows the typical soil profile. Table 2 shows total rainfall and mean air temperatures between July 1 and April 30 for each growing season. The meteorological station was located 1 km from the farm where the experimental tests were carried out.

2.2. Experimental Treatments and Agricultural Machinery Used

Two tillage regimes (treatments) were compared during three growing seasons. These are T1: no tillage (for 18 successive years) and T2: conventional primary tillage with chisel plowing with 13 curved 25 × 20 mm shanks rigidly mounted and spaced 280 mm apart. It was operating at a depth of 210 mm, pulling at 7 km h−1, followed immediately by two passes with a tandem disc harrow (625 N/disc, 40 discs) to a depth of 170 mm. This was then followed by an eight-section spike-tooth harrow and two passes of a basket roller. The description and characteristics of the treatments can be found in Table 3.
The timing (dates) of treatments and soil measurements were adapted to that proposed by [7], taking into account that the study area was in the southern hemisphere.
For more than 35 years, the site utilized for CT treatments has been in CT. Eight plots of 100 × 7 m with four replications for each tillage treatment were randomly assigned, separated by 20-m buffer zones, thus avoiding interaction. Regarding the two crops: In the four CT plots, the annual wheat/soybean rotation was developed. The same situation was carried out in the four NT plots.
Planting and harvesting were carried out on the usual dates in the experimental area (Table 4). The standard seeding rate for soybean was 65 kg ha−1 and for wheat 133 kg ha−1. For both crops, the seeding rate was verified according to Nardon’s electronic device [19].
At the beginning of this study, the machinery used in this experiment (tractor, seeder, sprayer, harvester, and grain chaser) was renewed. This equipment is commonly used on commercial farms in the study area, despite being heavier than the previous one. Two different planters were used. First, for the no-tillage treatment, planter 1 was used. Second, for the conventional tillage treatment, planter 2 was used. Table 5 shows the specifications.
In order to determine the weight of the equipment, an electronic weighbridge was utilized. The average tire ground contact pressures were measured with a Tekscan® pressure sensor (https://www.tekscan.com/) (accessed on 2 December 2021). The tire inflation pressures were afterwards adjusted according to the manufacturer’s recommendations for the dynamic load and speed of the corresponding operation [20].
Harvesting operations were the same for the two treatments. Harvest traffic in the plot, which consisted only of the combine harvester, was controlled along predetermined tracks (the same track year after year). The harvester filled the grain chaser at the headlands according to the methodology detailed in [8]
It should be acquainted that, in order to combat weeds and pathogens, the same agrochemical control was applied in both treatments. This was done for two reasons. First, to keep the crop “clean”. Secondly, to establish with certainty that the mechanical condition of the soil and the characteristics of the equipment used were the primary reasons for possible differences in crop yield.

2.3. Experimental Variables Measured

The cone index (CI) was established with a Scout 900 FieldScout™ penetrometer with data logger (Spectrum Technologies Inc., Aurora, IL, USA, https://www.Specmeters.com/) (accessed on 2 December 2021). The cone fits the measurements according to [21]. Measurements were taken at the same sampling points used to establish soil water content (SWC), and at a depth of 0.45 m in regular 50 mm increments. Both CI and SWC data represent an average of 30 samples (n = 30) taken in each plot.
After the traffic events (at the sowing date), SWC and CI were measured at random locations in the plots. In this moment the SWC is near to field capacity. Soil water content measurements were made at three depth intervals: 0–150, 150–300, and 300–450 mm, respectively.
Using the cylinder method, dry bulk density (DBD) was measured at random locations in the plots after the traffic events in the depth ranges 0–150, 150–300, and 300–450 mm taken at 50-mm intervals. Each value quoted for dry bulk density is the mean of ten measurements (n = 10).
For both crops, the seedling emergence (SE) per linear meter was noticed in all the tractor rows and tracks. The sample comprised 320 observations in each case (track and row) (40 observations/row × 8 lines (replicate)). The counting was done at 11, 15, and 22 days after planting. Furthermore, for the two crops, whole plant quadrats (n = 20) were collected at random locations within the experimental plots, and the samples were used to determine grain yield (GY), expressed in kg ha−1 at 14% moisture content (w/w) [20].

2.4. Statistical Analyses

The CI, DBD, GY, and SE data were subjected to analysis of variance (ANOVA), and the means were separated by Duncan’s multiple range test using Statgraf 7.1 software. Soil water content (expressed gravimetrically) was simultaneously established and utilized as a covariate of the soil penetration resistance data owing to its effects on soil strength [21].

3. Results and Discussion

Soil Water Content, Climate, and Soil Conditions at the Beginning of the Experiment
The soil water content (w/w), averaged for the three growing seasons of the experiment at the planting date, was 18.5% of dry weight from 0 to 150 mm depth, 20.8% from 150 to 300 mm depth, and 20.5% for 300 to 450 mm. Overall, when measuring cone index and seedling emergence, the SWC did not differ remarkably among treatments. Consequently, the differences noted in cone index and seedling emergence were due to the treatments. The CI can also be considered an efficient indicator of soil densification during treatment.
The temperature was normal for the season in October, November, December, February, and March, but exceeded 32 °C in January. The rainfall in December was suitable for the soybean seedling emergence. The soil water content was high as there was copious rainfall before the harvest (the last ten days of March). The temperature was normal for the summer in accordance with our study of the complete soybean growing cycle, ergo the plants were of proper size.
The weather conditions were very alike in all three years of the study during the wheat production season. The total precipitation and the mean air temperatures in July were adequate for seedling emergence. Likewise, the total precipitation and the air temperature during the critical wheat growth period (20 days before to 7 days after flowering) in October were sufficient. Thus, any variation in these crops would be the outcome of the soil tillage treatments.
Wheat and soybean seedling emergence was established by counting individual plants per linear meter at 24-h intervals starting 11 days after planting (Table 6 and Table 7).
For both crops, seedling emergence was more sluggish in no-tillage than in conventional tillage. However, the results were alike 22 days after planting. This is noteworthy since the differences between CI and DBD values are significant and much higher in the NT treatment than in the CT treatment (see Figure 1).
Seedling emergence was slower in the NT than in the CT. One plausible reason for this is that, prior to sowing, non-selective pre-emergence herbicides are sprayed on farms, and toxicity problems occur due to trampling of herbicide-laden soil. These problems hinder seedling emergence and early crop development [22,23]. Crop residues from the row surface are cleared due to excess lateral soil throw produced by turbo coulter blades. This defeats the purpose of no-tillage farming [24].
Figure 1 shows the cone index and dry bulk density of the soil before planting (before the traffic of agricultural equipment) for the two tillage treatments and gives a clear indication of the initial state of the soil in each treatment. This figure indicates that the CI and DBD values in the NT treatment were over 1700 kPa and 1300 kg m−3, respectively, in the depth range of 0 to 450 mm.
For the three growing seasons, Figure 2, Figure 3 and Figure 4 demonstrate that the CI and DBD in the NT treatment were over 2000 kPa and 1400 kg m3, respectively, in the depth range of 0 to 450 mm. The effects of CT in contrast to the NT treatment are evident.
The analysis of variance of cone index and dry bulk density at depths from 0 to 250 mm revealed a relevant difference (p < 0.01) between the CT and NT treatment plots. The CI and DBD values were greater for the NT treatment than for the CT.
Figure 2, Figure 3 and Figure 4 present these outcomes for the cone index and dry bulk density. For the NT treatment in the 0–150 depth range layer, the bulk density values generated by agricultural equipment traffic in the topsoil layer were higher than the limit of 1050 kg m−3 recommended by [25] to avert yield declines. Similarly, all CI values in the surface soil (1200 kPa at 125 mm) surpassed a similar limit for yield declines in soybean [26]. Correspondingly, the CI between 300- and 450-mm depth in all 3 years was greater than the 1500 kPa limit reported by [27] to avert limited root growth.
The greatest CI and BD values for CT and NT were measured in the 0–300 mm depth range in all years (Figure 2, Figure 3 and Figure 4). The maximum values of CI and BD occurred at gradually greater depths year after year. All values surpassed those cited as critical for root growth hindrance [16,25,26,27].
In all three growing seasons, the increment in CI and DBD resulting from farm machinery traffic was especially marked in the 0–300 mm depth range. Nonetheless, the increment in resistance in the CT treatment was less than in the NT treatment. Analysis of the soil response to traffic in deeper layers demonstrated that soil densification, as indicated by CI and DBD, increased in the 300–450 mm depth range. Nevertheless, no remarkable differences were found between the NT and CT treatments.
This study indicated that densification caused by heavy equipment (NT equipment = total load 360 kN) caused stronger changes in the physical properties of the surface soil and under soil than the conventional equipment (CT equipment = total load 121 kN). These results are in agreement with those of [20,28], who showed that the effects of compaction produced by a heavy axle were related to the soil type, the number of passes and the number of years elapsed since the onset of compaction.
This was possibly because of the combination of the high axle load (Table 5), the total displacement of the machinery (NT = 14.2 and CT = 6.22 km ha_1) and the high tire ground pressure of the sprayer (228 and 249 kPa in the front and rear tires, respectively). Finally, this trial demonstrated that crop yield decreases and soil densification problems increase when the traffic intensity increments on soils with great bearing capacity and freshly tilled soils. Soybean and wheat yields showed a downward trend with increasing traffic intensity and soil densification (Table 8 and Table 9). Nonetheless, the difference between TN and TC was remarkable (p < 0.01) in all 3 years. Lower soil compaction was related to greater soybean and wheat yields.
These results confirm that crop yields were affected by the high axle load and the high traffic intensity applied to the soil for its preparation. Sustainable soil management is necessary to avoid reaching high CI and DBD values that impair crop development. In addition, based on the textural composition (loam), growth-limiting dry bulk densities for this soil are between 1600 and 1650 kg m−3 [29].
In the three cropping seasons, the results showed that soil densification in NT resulted in lower yields in two crops (decreased, on average, by 13.25% (wheat) and 12.65% (soybean)) compared to CT. The greatest yields were found in CT (3.31 and 4.10 tons/ha−1, for soybean and wheat, respectively) compared to NT (2.91 and 3.53 tons/ha−1) for soybean and wheat respectively.
Differences in grain yields were moderate although soil densification was higher in the first 200 mm in the NT than in the CT treatment. The most important factor may have been that, during the three growing seasons, the rainfall patterns were particularly propitious for both crops at critical times. This beneficial rainfall must have “canceled out,” so to speak, the higher level of densified soil under NT.

4. Conclusions

  • For sustainable soil management, it is necessary to try to reduce the wheel load and the number of passes made by agricultural machinery during the cropping seasons;
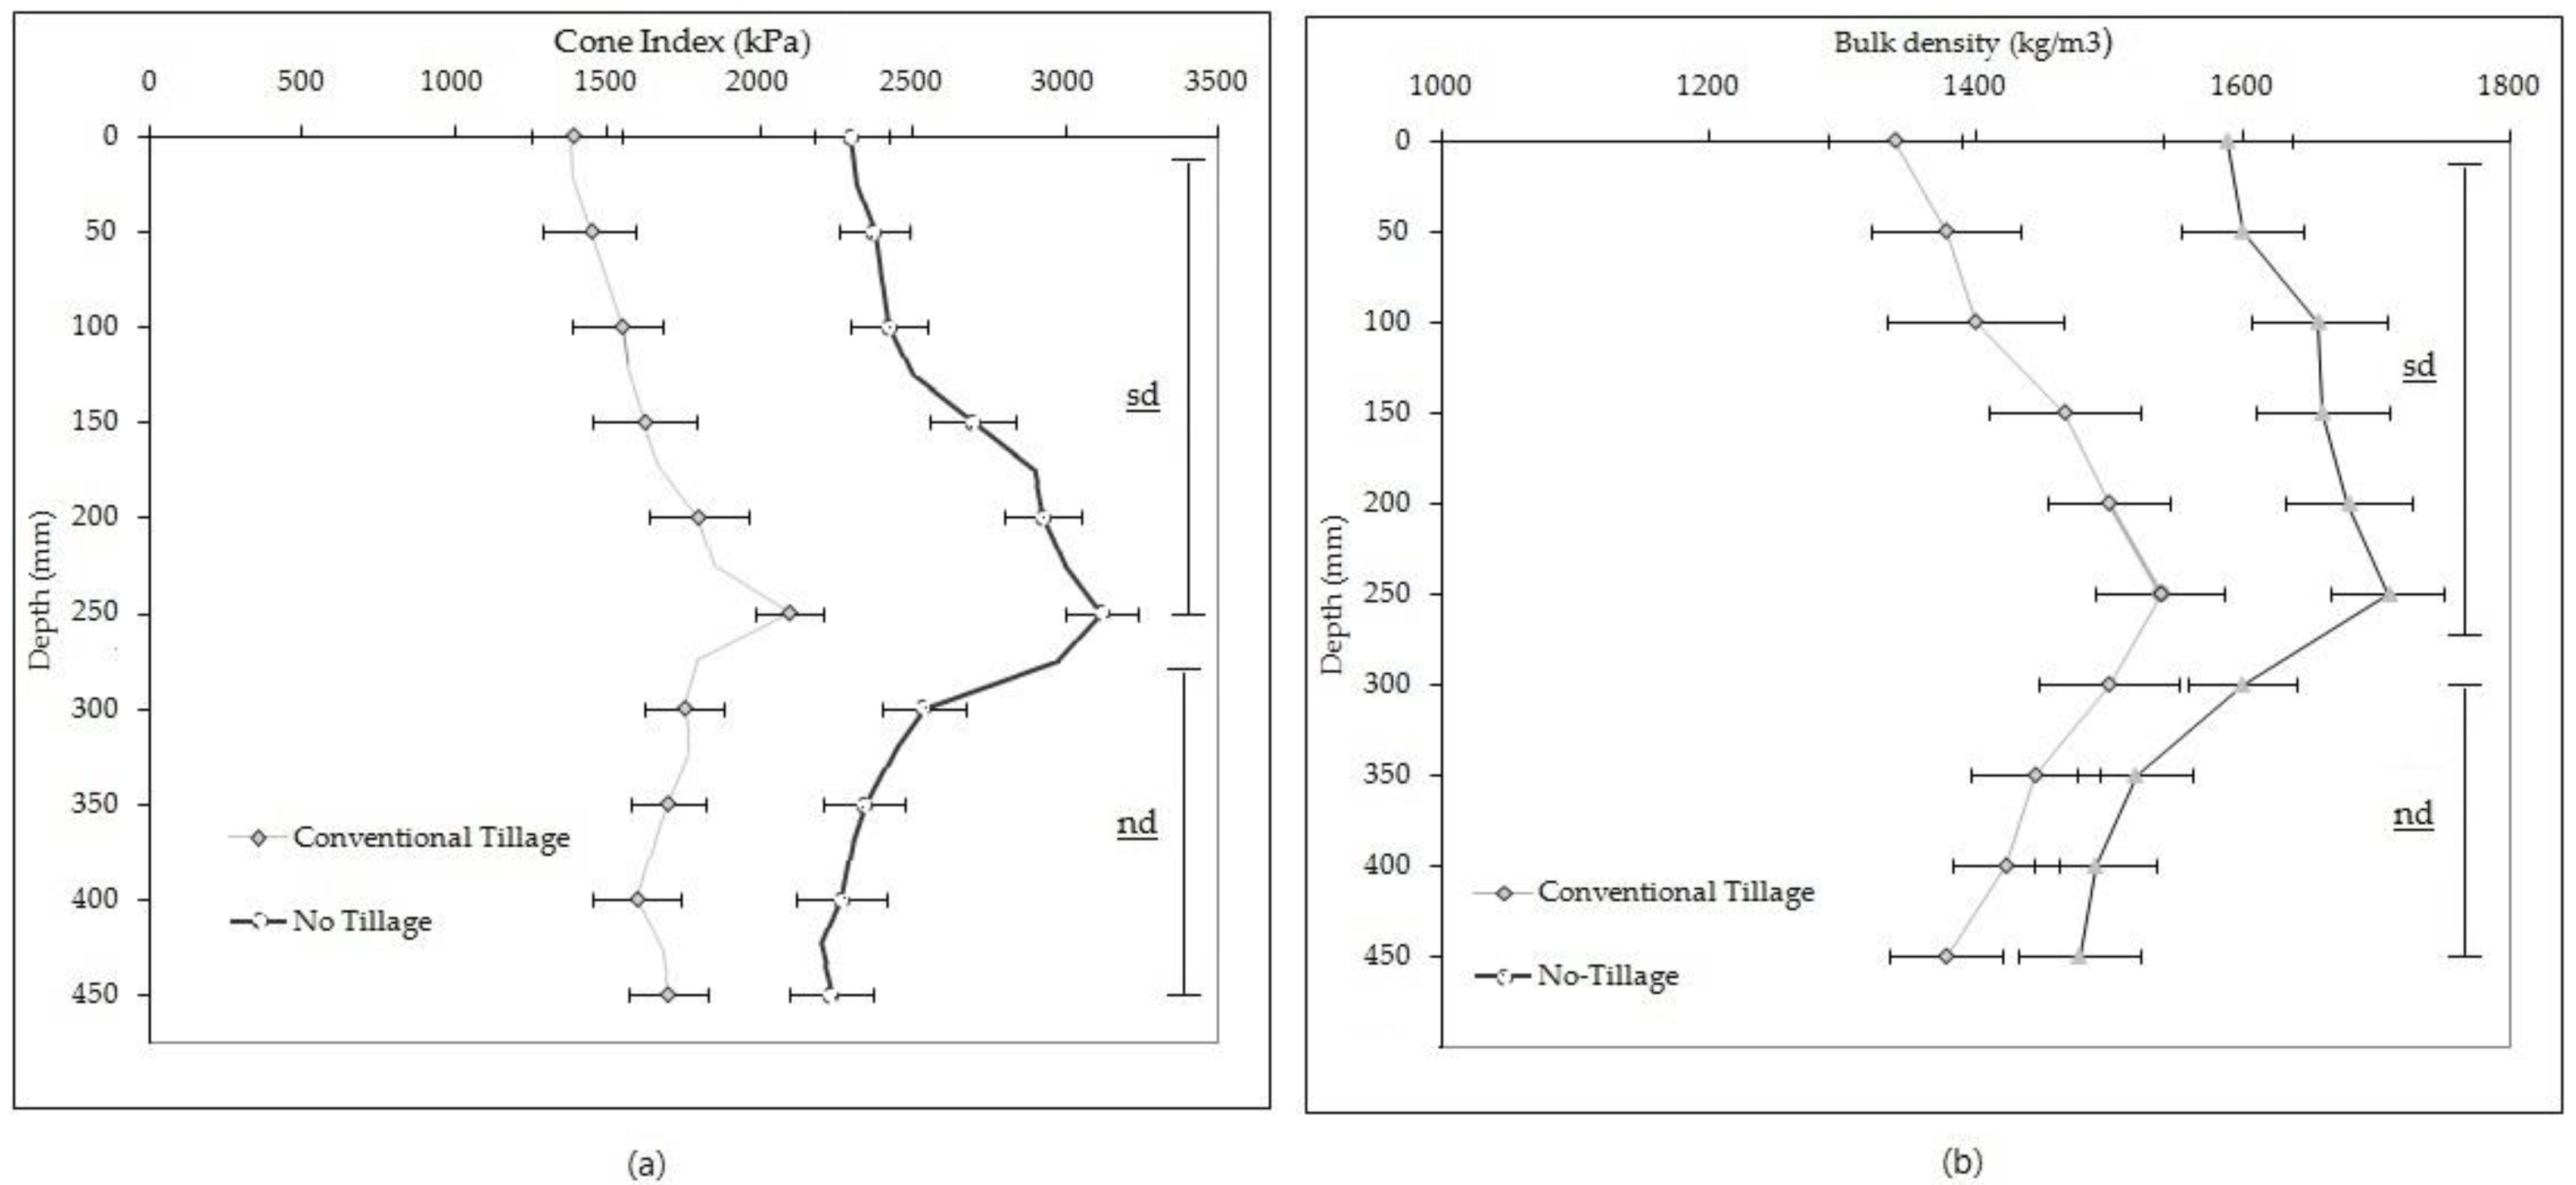
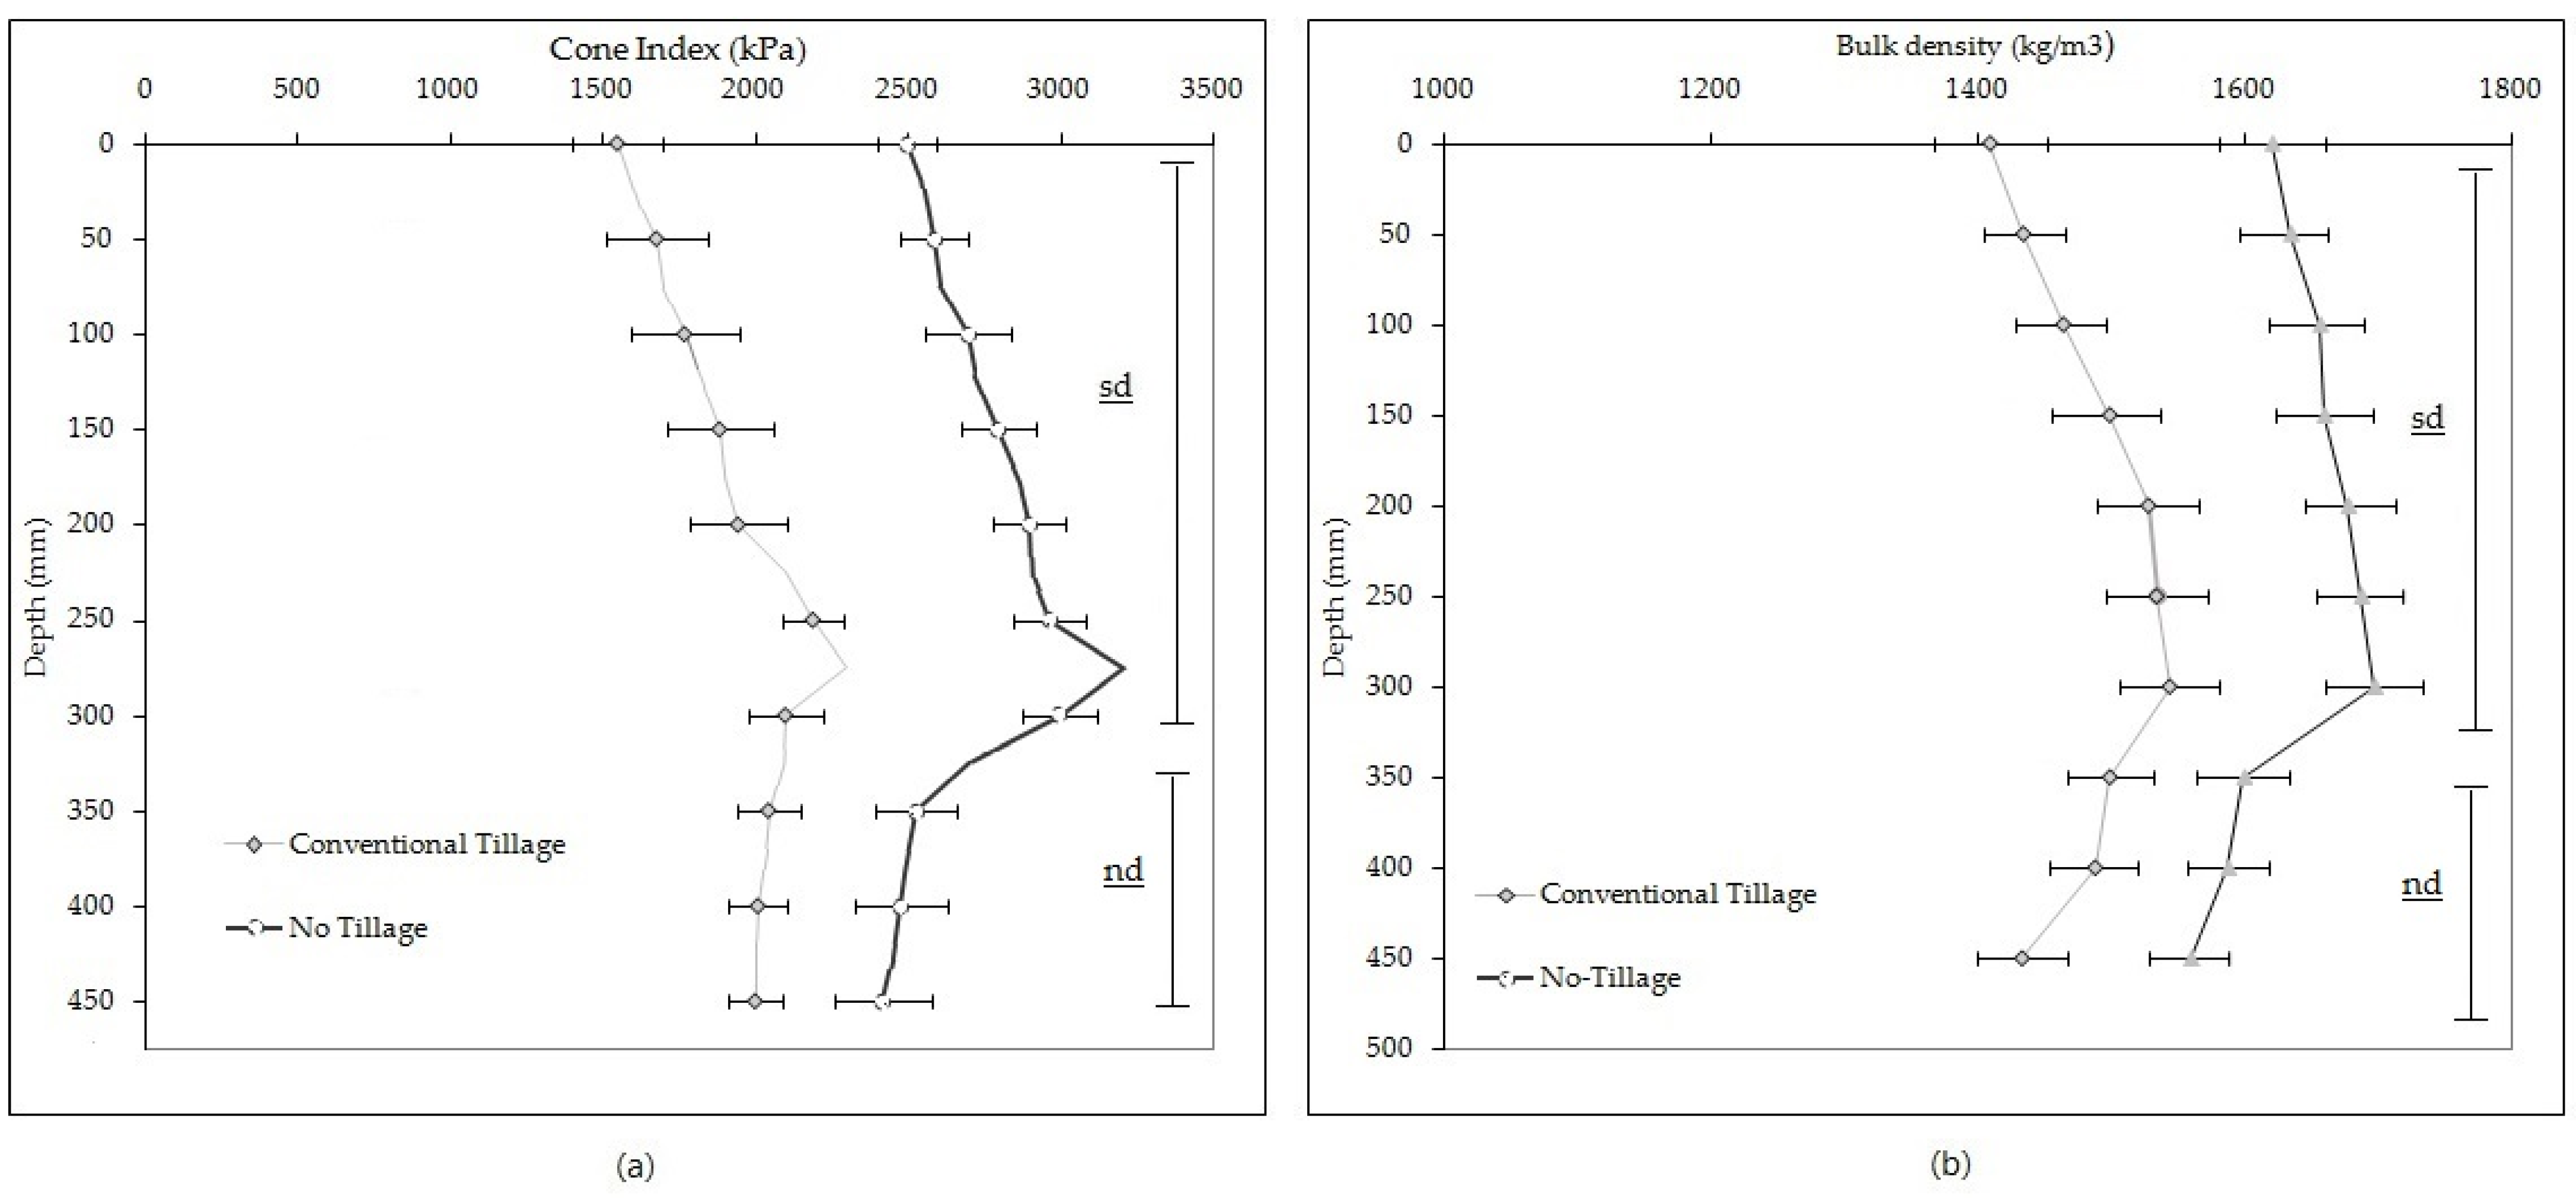
  • Although the soil worked under NT presented maximum DBD values between 1600 and 1653 kg m−3, the yield of both crops was lower in NT than in the soil worked in CT;
  • Subsoil densification was high in the CT treatment even using a low weight planter. This is an outcome of the large number of passes of the farm machinery made during the growing seasons;
  • From the point of view of soil sustainability and crop production, the soybean and wheat yields for the CT treatment demonstrate that tillage of the topsoil horizon is required and that work under continuous NT should be avoided as much as possible.

Author Contributions

Conceptualization, G.F.B., G.F.N. and R.G.C.; methodology, investigation, and data validation, G.F.N.; electronic calibration planter device and formal analysis, G.F.B.; writing—original draft preparation, G.F.N.; writing—review and editing, R.G.C. All authors have read and agreed to the published version of the manuscript.

Funding

The work reported in this article was supported by grants provided by: Technology Department at National University of Luján, Argentina through Project ID: T088, Soil compaction study produced by machinery traffic on soils under no-tillage and conventional tillage (http://www.unlu.edu.ar) (accessed on 2 December 2021) and Research Group AGR-172 Regional Government of Andalusia (CIMEDES) and Project TRFE-I-2019/005 of the Research Plan of the University of Almeria, Spain, (http://www.ual.es) (accessed on 2 December 2021).

Institutional Review Board Statement

Not applicable.

Informed Consent Statement

Not applicable.

Data Availability Statement

The data reported in this article are available from Guido F. Botta ([email protected]) and Gustavo F. Nardon ([email protected]).

Acknowledgments

Operational support provided by the owners of the farm where this study was conducted is gratefully acknowledged.

Conflicts of Interest

The authors declare no conflict of interest. The funders had no role in the design of the study; in the collection, analyses, or interpretation of data; in the writing of the manuscript, or in the decision to publish the results.

References

  1. European Commission. Proposal for A Directive of the European Parliament and of the Council Establishing A Framework for the Protection of Soil and Amending Directive 2004/35/EC. COM; Europese Commissie: Brussel, Belgium, 2006; 232 final. [Google Scholar]
  2. Chamen, W.C.T.; Alakukku, L.; Pires, S.; Sommer, C.; Spoor, G.; Tijink, F.; Weisskopf, P. Prevention strategies forfield traffic-induced subsoil compaction: A review. Part 2. Equipmentandfield practices. Soil Tillage Res. 2003, 73, 161–174. [Google Scholar] [CrossRef]
  3. Spoor, G.; Tijink, F.G.J.; Weisskopf, P. Subsoil compaction: Risk, avoidance, identification and alleviation. Soil Tillage Res. 2003, 73, 175–182. [Google Scholar] [CrossRef]
  4. Masola, M.J.; Alesso, C.A.; Carrizo, M.E.; Berhongaray, G.; Botta, G.F.; Horn, R.; Imhoff, S. Advantages of the one-wheeled tramline for multiple machinery widths method on sunflower (Helianthus annus L.) and maize (Zea mays L.) responses in the Argentinean Flat Pampas. Soil Tillage Res. 2020, 196, 104462. [Google Scholar] [CrossRef]
  5. Botta, G.F.; Tolón-Becerra, A.; Melcon, F.B. Seedbed compaction produced by traffic on four tillage regimes in the rolling Pampas of Argentina. Soil Tillage Res. 2009, 105, 128–134. [Google Scholar] [CrossRef]
  6. Voorhees, W.V.; Lindstrom, M.J. Soil compaction constraints on conservation tillage in the northern Corn Belt. J. Soil Water Conserv. 1983, 38, 307–311. [Google Scholar]
  7. Botta, G.F.; Tolón Becerra, A.; Bienvenido, F.; Rivero, D.; Laureda, D.A.; Ezquerra-Canalejo, A.; Contessotto, E.E. Sunflower (Helianthus annuus L.) harvest: Tractor and grain chaser traffic effects on soil compaction and crop yields. Land Degrad. Dev. 2018, 29, 4252–4261. [Google Scholar] [CrossRef]
  8. Botta, G.F.; Pozzolo, O.; Bomben, M.; Rosatto, H.; Rivero, D.; Ressia, M.; Tourn, M.; Soza, M.; Vazquez, J. Traffic alternatives for harvesting soybean (Glycine max L.): Effect on yields and soil under a direct sowing system. Soil Tillage Res. 2007, 96, 145–154. [Google Scholar] [CrossRef]
  9. Håkansson, I.; Reeder, R.C. Subsoil compaction by vehicles with axle load extend persistence and crop response. Soil Tillage Res. 1994, 29, 277–304. [Google Scholar] [CrossRef]
  10. Tolón-Becerra, A.; Lastra-Bravo, X.B.; Botta, G.F.; Tourn, M.; Linares, P.; Ressia, M.; Balbuena, R. Traffic effect on soil compaction and yields of wheat in Spain [Efectos del tráfico del tractor sobre la distribución de la compactación del suelo y los rendimientos de trigo en España]. Span. J. Agric. Res. 2011, 9, 395–403. [Google Scholar] [CrossRef] [Green Version]
  11. Buschiazzo, D.E.; Zobeck, T.; Aimar, S.B. Wind erosion in loess soils of the Semiarid Argentinian Pampas. Soil Sci. 1999, 164, 133–138. [Google Scholar] [CrossRef]
  12. EP291. ASABE Standard. Terminology and definitions for soils tillage and soil tool relationships Engineering Practice. American Society of Agricultural Engineering: St. Joseph, MI, USA, 1992; pp. 106–108.
  13. Botta, G.F.; Tolón-Becerra, A.; Lastra-Bravo, X.; Tourn, M.; Balbuena, R.; Rivero, D. Continuous application of direct sowing: Traffic effect on subsoil compaction and maize (Zea mays L.) yields in Argentinean Pampas. Soil Tillage Res. 2013, 134, 111–120. [Google Scholar] [CrossRef]
  14. Flowers, M.; Lal, R. Axle load and tillage effects on soil physical properties and soybean grain yield on a mollic ochraqualf in northwest Ohio. Soil Tillage Res. 1998, 48, 21–35. [Google Scholar] [CrossRef]
  15. Jorajuria, D.; Draghi, L.; Aragon, A. The effect of vehicle weight on the distribution of compaction with depth and the yield of Lolium/Trifolium grassland. Soil Tillage Res. 1997, 41, 1–12. [Google Scholar] [CrossRef]
  16. Terminiello, A.M.; Claverie, J.A.; Casado, J.; Balbuena, R. Cone index evolution through the gwowth season of cabbage crop (Brassica oleracea L.). In Proceedings of the Fourth CADIR (Argentine Congress on Agricultural Engineering), Buenos Aires, Argentina, 18 October 2000. [Google Scholar]
  17. USDA. World Agricultural Production, USDA Circular Series; United States Department of Agriculture: Washington, DC, USA, 2020. [Google Scholar]
  18. Soil Survey Staff. Keys to Soil Taxonomy, 12th ed.; USDA-Natural Resources Conservation Service: Washington, DC, USA, 2014. [Google Scholar]
  19. Nardón, G.F. Accurate Planters: Inter-Seed Spacing Modelization. Master’s Thesis, Faculty of Agricultural Sciences and Forestry, National University of La Plata, La Plata, Argentina, 2003; 158p. (In Spanish). [Google Scholar]
  20. Botta, G.F.; Antille, D.; Nardon, G.F.; Rivero, D.; Bienvenido, F.; Contessotto, E.E.; Ezquerra-Canalejo, A.; Ressia, J.M. Zero and controlled traffic improved soil physical conditions and soybean yield under no-tillage. Soil Tillage Res. 2022, 215, 105235. [Google Scholar] [CrossRef]
  21. EP542.1 ASAE Standard. Procedures for Using and Reporting Data Obtained with the Soil Cone Penetrometer. American Society of Agricultural Engineering: St. Joseph, MI, USA, 2019. Available online: https://elibrary.asabe.org/standards.asp (accessed on 2 December 2021).
  22. Desbiolles, J.M.A.; Kleemann, S. Seeding system factors influence no-till cropping results. In Proceedings of the 16th Triennial International Soil Tillage Research Organisation Conference, Bisbane, Australia, 13–18 July 2003. [Google Scholar]
  23. Solhjou, A.; Fielke, J.M.; Desbiolles, J.M.A. Soil translocation by narrow openers with various rake angles. Biosyst. Eng. 2012, 112, 65–73. [Google Scholar] [CrossRef]
  24. Sayre, K.; Govaerts, B.; Martinez, A.; Mezzalama, M.; Martinez, M. Comparison of alternative conservation agriculture technologies for rainfed production in the highlands of central Mexico. In Proceedings of the 17th Conference of the International Soil Tillage Research Organization, Kiel, Germany, 28 August–3 September 2006. [Google Scholar]
  25. Soane, B.D.; Dickson, J.W.; Campbell, D.J. Compaction by Agricultural Vehicles: A Review. III. Incidence and Control of Compaction in Crop Production, 1st ed.; Bush Estate Penicuik Midlothian: Scotland, UK, 1983; pp. 3–36. [Google Scholar]
  26. Rivero, E.R.D. Compactación Producida por el tráfico de las Cosechadoras: Efecto Sobre el Suelo y el Rendimiento del Cultivo de soja (Glycine max L.) bajo Siembra Directa en la Pampa Argentina. Ph.D. Thesis, Universidad de Almería, Provincia de Almería, España, 25 May 2016. [Google Scholar]
  27. Grosso, J.A.; Ressia, J.M.; Bongiorno, C.V.; Mendivil, G.O. Characterization of the degree of soil compaction in a field under no till using geostatistical tools. Rev. De La Fac. De Cienc. Agronómicas UNR 2020, 34, 004. [Google Scholar] [CrossRef]
  28. Antille, D.L.; Bennett, J.M.; Jensen, T. Soil compaction and controlled traffic considerations in Australian cotton-farming systems. Crop Pasture Sci. 2016, 67, 1–28. [Google Scholar] [CrossRef]
  29. Daddow, R.L.; Warrington, G.E. Growth-Limiting Soil Bulk Densities as Influenced by Soil Texture; U.S.D.A., Forest Service: Fort Collins, CO, USA, 1983; pp. 1–17, WSD6-TN-00005. [Google Scholar]
Figure 1. (a) Cone index profile before agricultural machinery traffic; (b) soil dry bulk density profile before agricultural machinery traffic. (sd): significant difference, (ns): not significant difference (p < 0.01) Duncan’s multiple range test.
Agronomy 12 00282 g001
Figure 2. (a) Cone index profile for the first cropping season; (b) soil dry bulk density profile for the first cropping season. (sd): significant difference, (ns): not significant difference (p < 0.01) Duncan’s multiple range test.
Agronomy 12 00282 g002
Figure 3. (a) Cone index profile for the second cropping season; (b) soil dry bulk density profile for the second cropping season. (sd): significant difference, (ns): not significant difference (p < 0.01) Duncan’s multiple range test.
Agronomy 12 00282 g003
Figure 4. (a) Cone index profile for the third cropping season; (b) soil dry bulk density profile for the third cropping season. (sd): significant difference, (ns): not significant difference (p < 0.01) Duncan’s multiple range test.
Agronomy 12 00282 g004
Table 1. Typical soil profile characteristics.
HORIZONSApAACC
Depth range (mm)0–150150–300300–650650–1200
Organic Carbon (g kg−1)12.30 ± 5.26.7 ± 1.25.2 ± 1.4-
Clay (g kg−1)173 ± 3.21304 ± 2.5190 ± 2.467 ± 2.31
Silt (g kg−1)318 ± 3.02280 ± 2.31210 ± 2.33305 ± 1.61
Sand (g kg−1)509 ± 2.16416 ± 2.11600 ± 2.27637 ± 2.01
pH in H20 (1:2.5)6.2 ± 0.046.3 ± 0.026.4 ± 0.026.7 ± 0.01
Table 2. Total rainfall and mean air temperature data recorded for Trenque Lauquen in the three cropping seasons (July 1 to April 30 (ten months).
MonthRainfall (mm)Mean Air Temperature (°C)
1st Cropping
Season
2nd Cropping Season3rd Cropping Season1st Cropping
Season
2nd Cropping Season3rd Cropping Season
July28323514.012.012.0
August25202917.216.516.8
September55605221.018.322.2
October109627023.323.923.7
November991507427.329.329.2
December158675630.331.631.2
January29192932.333.432.2
February271681829.228.531.3
March106924025.223.231.3
April311656925.723.025.4
Table 3. Description and characteristics of the treatments for two crops.
Tillage TreatmentsDescriptionNumber of
Tillage/Passes
per Hectare
Total
Load a (kN)
Total
Displacement a
(km ha1)
No-tillageSprayer (pre seeding) and planter43606.22
Conventional tillage13 rigidly mounted curved shanks—disk harrow (625 N/disk, 40 disk)—eight section spike tooth harrow—two passes of a basket roller and planter.812114.2
a Load and displacement: complete equipment and weights are loaded.
Table 4. Timing of planting and harvest recorded at the experimental site for each season.
Planting date
Wheat (Triticum aestivum L.)Soybean (Glycine max L.)
1st cropping season2nd cropping season3rd cropping season1st cropping season2nd cropping season3rd cropping season
9 July10 July12 July6 December10 December12 December
Harvest date
1st cropping season2nd cropping season3rd cropping season1st cropping season2nd cropping season3rd cropping season
28 November29 November30 November4 April12 April15 April
Table 5. Specification of the farm equipment used in the experiments.
DescriptionUnitFWA Tractor,
Two Axle and Single Wheel
HarvesterSprayer.
Self-Propelled
Grain Chaser,
Two Axle and Single Wheel
Engine power CV (kW)145 (106)275/201.6142/104.13-
Front tires-16.9R 38800/65R3212.4–3624.5 R32
* Tire inflation pressure (front axle)kPa70114285120
Rear tires -24.5R3218.4 R2612.4–3624.5 R32
* Tire inflation pressure (rear axle)kPa65170285120
Overall load kN79.80152108.7196
Load front axlekN31.7598.843.4898
Load rear axlekN48.0553.265.2298
Static load per front wheelkN15.87549.4021.7449
Static load per rear wheelkN24.02526.6632.6149
Front wheels track widthmm2800320021002800
Rear wheels track widthmm2800300021002800
Mean ground pressure per front tirekPa41.2152.6522877.5
Mean ground pressure per rear tirekPa43.6558.4224977.5
Planters
Planter 1Planter 2
Overall loadkN89.7025.20
Overall width m9.502.55
Seed metering system-Pneumatic vacuum distributionDouble round feed
Tires-400/60–15.512.5–24
Mean ground pressure per wheel kPa96.580.0
Cutting and soil penetration furrower-Turbo coulter, single-disc with one-depth limiting wheelDouble-disc with double-depth limiting wheel
Coverer and/or compacter-Covering press wheels, variable angleCovering press wheels
* Tire inflation pressures correspond to the manufacturer’s recommendation for dynamic load and speed.
Table 6. Wheat seedling emergence at 11 to 22 days after sowing across three cropping seasons. (Values with different letters between tillage regimes are significantly different at each depth (p < 0.01) Duncan’s multiple range test).
1st Cropping Season2nd Cropping Season3rd Cropping Season
Days after planting111522111522111522
No-tillage22.7a33.2a39.8b22.2a32.1a39.3b21.3a31.0a39.0b
Conventional Tillage27.5b39.8b41.1b26.4b37.5b40.0b26.3b37.5b39.7b
Table 7. Soybean seedling emergence at 11 to 22 days after sowing across three cropping seasons. (Values with different letters between tillage regimes are significantly different at each depth (p < 0.01) Duncan’s multiple range test).
1st Cropping Season2nd Cropping Season3rd Cropping Season
Days after planting111522111522111522
No-tillage2.7a3.5a8.6b2.5a3.2a8.3b2.5a3.1a8.2b
Conventional Tillage5.7b6.5b8.9b5.4b6.3b8.7b5.3b6.1b8.7b
Table 8. Wheat yields and standard deviation for the different treatments in three cropping seasons (tons ha−1). Values with different letters between tillage regimes are significantly different at each depth (p < 0.01) Duncan’s multiple range test.
1st Cropping Season2nd Cropping Season3rd Cropping Season
No-tillage3.53 ± 0.41a3.47 ± 0.37a3.42 ± 0.30a
Conventional Tillage4.10 ± 0.39b3.90 ± 0.32b4.01 ± 0.42b
Table 9. Soybean yields and standard deviation for the different treatments in three cropping seasons (tons ha−1). Values with different letters between tillage regimes are significantly different at each depth (p < 0.01) Duncan’s multiple range test.
1st Cropping Season2nd Cropping season3rd Cropping Season
No-tillage2.91 ± 0.21a2.80 ± 0.17a2.78 ± 0.14a
Conventional Tillage3.31 ± 0.37b3.20 ± 0.30b3.23 ± 0.29b
Publisher’s Note: MDPI stays neutral with regard to jurisdictional claims in published maps and institutional affiliations.

