Article

No Tillage Increases SOM in Labile Fraction but Not Stable Fraction of Andosols from a Long-Term Experiment in Japan

by
Jeannette Aduhene-Chinbuah
1,
Soh Sugihara
2,*,
Masakazu Komatsuzaki
3,
Tomoyasu Nishizawa
3 and
Haruo Tanaka
2
1
United Graduate School of Agricultural Science, Tokyo University of Agriculture and Technology, Fuchu 183-8509, Tokyo, Japan
2
Institute of Agriculture, Tokyo University of Agriculture and Technology, Fuchu 183-8509, Tokyo, Japan
3
College of Agriculture, Ibaraki University, Ami 300-0393, Ibaraki, Japan
*
Author to whom correspondence should be addressed.
Agronomy 2022, 12(2), 479; https://doi.org/10.3390/agronomy12020479
Submission received: 19 January 2022 / Revised: 7 February 2022 / Accepted: 10 February 2022 / Published: 14 February 2022

Abstract

:
No tillage (NT) fosters carbon (C) sequestration, increases soil organic matter (SOM) stock, and improves soil health. However, its effect on SOM accumulation in Andosol, which has high OM stabilization characteristics due to its specific mineral properties, remains unclear. In this study, we evaluated the effect of NT on SOM content and its distribution by the physical fractionation method and assessed the quality of accumulated SOM in each fraction. We collected soil samples at 0–2.5, 2.5–7.5, and 7.5–15 cm depths from NT and conventional tillage (CT) plots in a long-term (19 years) field experiment of Andosols in Ibaraki, Japan. The soil samples were separated into light fraction (LF), coarse-POM (cPOM: 0.25–2 mm), fine-POM (fPOM: 0.053–0.25 mm), and silt + clay (mOM: <0.053 mm). The C, nitrogen (N), and organic phosphorus (Po) contents of each fraction were analyzed. The C content of cPOM and fPOM in NT at 0–7.5 cm was higher than in CT, while there was no clear difference in the mOM fraction or deeper layer (7.5–15 cm). NT increased the C, N, and Po contents in the labile POM fractions at the surface layers but did not increase the stable fraction or change the quality.

1. Introduction

Soil organic matter (SOM) has a significant influence on many soil functions (i.e., physical, chemical, and biological) and stores nutrients (carbon (C), nitrogen (N), phosphorus (P), etc.), which are gradually released into the soil by mineralization for plant uptake [1]. The management of SOM amounts in soil is crucial to soil fertility and crop yield as well as in climate change mitigation [2,3,4,5]. Therefore, the management of SOM is key to soil functioning worldwide [6]. No tillage (NT) has been found to play an essential role in SOM accumulation [7,8] by reducing surface soil disturbance. Thus, NT is considered a promising technique for sustainable SOM management, which includes the sequestration of C for climate change mitigation and sustainable soil fertility.
Andosols, a volcanic ash soil, show the highest soil organic carbon (SOC) density after organic soils from SOC mass estimation [9,10] and are widely distributed worldwide near volcanic areas, especially in Japan. In this soil type, its nano-sized short-ranged-order (SRO) minerals and OM complexes act as strong binding agents that facilitate aggregate formation [11], causing high SOC stabilization [12,13]. On the other hand, studies have shown that accumulated SOC in Andosols is sometimes unstable and affected by land-use changes, causing the loss of huge SOC [14]. Iwasaki et al. [15] found that continuous organic matter application increased SOC only at the low initial SOC sites but decreased in the higher initial SOC sites of Andosols in Japan. These results indicate that high SOC losses occur in soils with high initial SOC, highlighting the difficulties in maintaining SOC levels in Andosols because of its high SOC content. In Japan, 47% of the total agricultural land area is Andosols [16]; 80% of cultivated cropland in Japan is tilled by rotary cultivators [17,18], which disturbs the soil surface and its structure [19], resulting in SOC reduction in Andosols in Japan [20,21]. Thus, to achieve sustainable land management in Andosols in Japan, there is a need to evaluate the quantitative effect of NT on SOC accumulation.
The no-tillage system has been found to reduce the rate of SOM decomposition, to increase soil aggregation in Andosols, and to improve soil biological structures by increasing fungal biomass [22]. Higashi et al. [23] reported a 25.1% higher SOC content in NT than conventional tillage (CT) at a depth of 0–2.5 cm and 8.4% higher SOC content in NT than CT at a depth of 2.5–7.5 cm in Andosols in Japan after a 9-year NT cultivation. Gong et al. [24] also found that SOC stocks in NT were significantly higher than CT at 0–2.5 cm and 0–7.5 cm in Andosols in Japan on a 19-year NT field. Several other studies have also verified the similar positive effects of NT on SOC stocks [19,25,26]. However, little is known about the effect of NT on the characteristics of accumulated SOC. Recently, to explore the effect of NT on SOM content and quality in various soil particle size fractions [27,28,29,30], many studies have used physical fractionation methods that separate the complex nature of SOM into particle size fractions, differing in physical properties, microbial degradability, and turnover times: light fractions (LF), particulate organic matter (POM), and mineral-associated organic matter (mOM) [28,31,32]. Generally, the mOM fraction has a higher C content because of its C stability with fine particles, such as silt and clay, while POM fractions are labile and have smaller C contents compared with the mOM fraction [11,33]. Nonetheless, the POM fractions are highly sensitive indicators for different soil management practices (such as tillage treatments) [27,34,35]. Bayer et al. [36] found that NT increased the C content in POM fractions after 5 and 8 years in Brazil, and Kibet et al. [37] observed similar SOC increment characteristics in the USA. However, studies in southern Brazil [38,39] have reported a higher increase in the C content in the mOM fraction than in the POM fractions. These varying results can be explained by the effect of tillage on SOC accumulation and site-specific characteristics, which is largely dependent on the soil type, specifically the mineralogy and texture [36,37,40]. As Andosols contain many SRO minerals, which ensure the physical stability of C in the mOM fraction, NT treatment should cause minor alterations in C in stable fractions, such as mOM, compared with other labile fractions, such as sand or POM fractions [41]. Therefore, we hypothesized that the POM fractions would be more sensitive to the effect of NT on SOC in Andosols in Japan than the mOM fraction. As a result of the limited information available regarding the effect of NT on fractionated SOC characteristics in Andosols in Japan, these detailed data are important for estimating future SOC dynamics or C sequestration, including its stability in soil, under NT management in Andosols in Japan.
Carbon mineralization and stability are tightly coupled with N and P, such as stoichiometry [42,43]. Many studies have indicated that assessing the quantitative relationship between C and N/P is a helpful method for understanding the C and N/P dynamics in soils [44,45]. Wyngaard et al. [44] observed a significant relationship between organic P (Po) and C in POM fractions in a NT cropland in a Mollisol in Argentina. Wyngaard et al. [46] also indicated that POM fractions largely contributed to the nutrient (N and P) supply of soil, compared with the mOM fraction. Andosols are P-deficient soil due to their high P absorption coefficient (PAC) [47,48]. Thus, evaluating the C and P relationships in each fraction is important for understanding the SOC dynamics in a stoichiometric context. Wulanningtyas et al. [18] found that NT increased SOC, N, and available P, and found a clear relationship between organic P mineralization and available P as well as SOC in Andosols in Japan. However, limited information is available regarding the effect of NT on the stoichiometric characteristics of SOM, such as the quantitative relationship between C and N/P in each fraction in Andosols, which should provide important information on soil nutrient lability of each fraction under NT management. Thus, there is a need to evaluate the effect of NT on the C, N, and Po relationships in each fraction using physical fractionation methods in Andosols in Japan.
Therefore, our objectives were as follows: (1) to compare the accumulated SOC characteristics using the physical fractionation methods and (2) to assess the quantitative relationship between C, N, and Po in each soil fraction under NT and CT management in Andosols in Japan. Our findings will contribute to achieving better SOC dynamics or C sequestration, including its stability in soil, under NT management in Andosols in Japan.

2. Materials and Methods

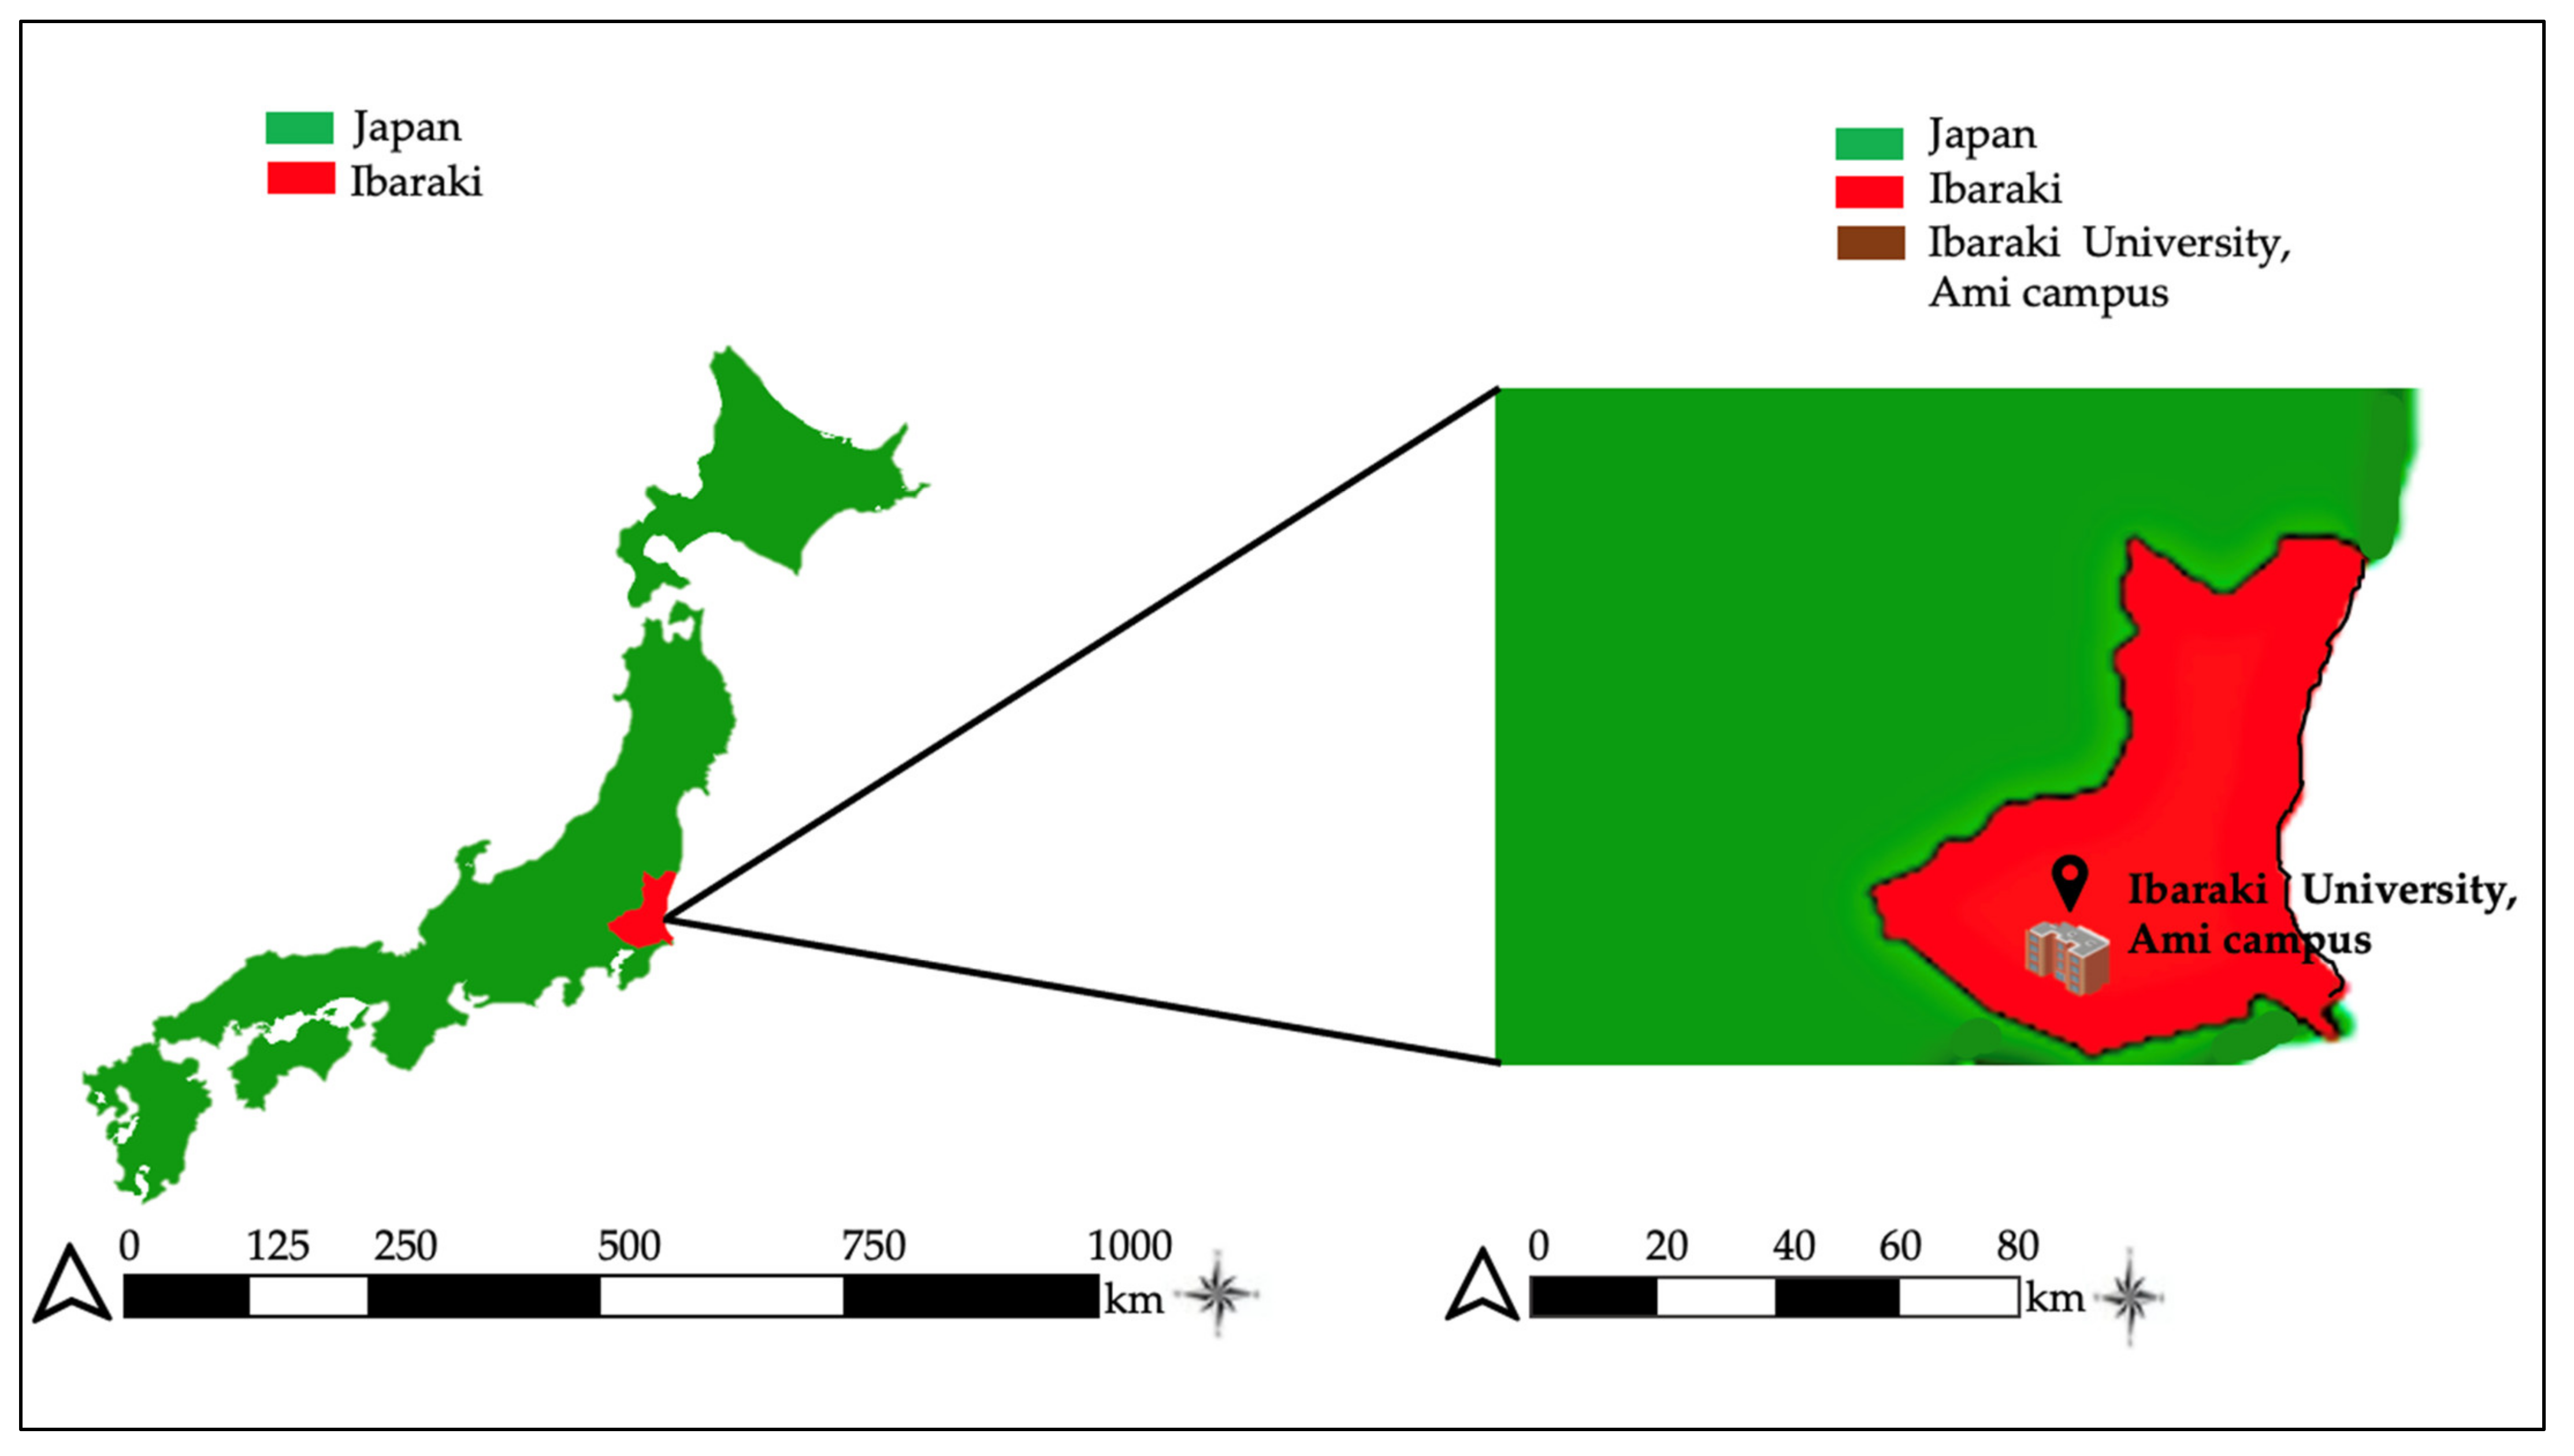
2.1. Research Site and Experimental Design

The research site is located at the Center for International Field Agriculture Research and Education, Ibaraki University, Ami-Japan (Figure 1) [18,49], with an annual mean temperature of 14.5 °C and an annual rainfall of 1352 mm from the start of the experimental system in 2002–2020 [50]. The soil is classified as an Andosol [51].
The experimental design of the research plots was a completely randomized block with a split-plot design, with the tillage systems being the main plot factor and the winter cover crops the split-plot factor (four replications per treatment plot). This experimental system has been in place for 19 years [18]. The experimental plot was used for upland rice cultivation for the first six years and was swapped for soybean cultivation from the 7th year to the present. On the plots, ryegrass was grown as a winter cover crop and cut before soybean cultivation in late June. In the NT plot (NT), the ryegrass was left on its surface, while in the conventional tilled plot (CT), the ryegrass was incorporated into the soil to a depth of 15 cm with a rotary cultivator (SX1905; Nipplo, Matsuyama Co., Ltd. Nagano, Japan) before soybean cultivation in late June. In this experiment, no chemical fertilizer, pesticides, and herbicides were applied to fertilize and control pests, diseases, or weeds in the field [18,23].

2.2. Soil Sampling and Analysis

Sampling was conducted in late October 2019, before soybean harvesting. Soils were collected from different tillage systems (NT and CT) plots at three depths (0–2.5 cm, 2.5–7.5 cm, and 7.5–15 cm). We collected five composite soil samples from one plot using a core sampler (5 cm diameter × 15 cm depth) and then combined and mixed for each replicate and treatment to obtain one sample for each plot. Finally, we collected 24 soil samples (2 tillage systems × 3 depths × 4 replicates). All soils were immediately stored in a refrigerator (at 4 °C) under field-moist conditions and were sieved using a 2 mm sieve before soil analysis; some of the samples were dried and used for physicochemical analysis.
The total C and N of the bulk soil were measured using an NC analyzer (Sumigraph NC-TR22; Sumika Chemical Analysis Services Ltd., Osaka, Japan) (Table S1). There was no inorganic C in the soils because of the acidic conditions. The pH of the soil (1:2.5) was measured using a pH meter (Horiba Scientific pH meter D-52; Horiba Advanced Techno. Co. Ltd., Kyoto, Japan). The pH values of NT (5.99, 6.09, and 6.21 at 0–2.5 cm, 2.5–7.5 cm, and 7.5–15 cm depths, respectively) did not differ statistically from the CT values (6.02, 6.26, and 6.31 at 0–2.5 cm, 2.5–7.5 cm, and 7.5–15 cm depths, respectively). Bulk density was evaluated from different core samples collected from each depth (0–2.5, 2.5–7.5, and 7.5–15 cm). The bulk density of NT (0.41 g cm−3 and 0.54 g cm−3) did not differ statistically from the CT values (0.49 g cm−3 and 0.51 g cm−3) at the depths of 0–2.5 cm and 2.5–7.5 cm, respectively, while NT (0.63 g cm−3) had a higher bulk density than CT (0.55 g cm−3) in the 7.5–15 cm depth.

2.3. Physical Fractionation and Chemical Analysis of Soil Organic Matter

The density-size fractionation method was used to obtain four fractions [52]. Briefly, 60 mL of NaI solution (<1.7 g cm−3) was added to 30 g of fresh soil in a 100 mL centrifuge tube and a round-trip shake was conducted for 16 h using a reciprocal shaker at 220 rpm. During this process, 30 glass beads were added to help crush the soil aggregates. Then, the samples were centrifuged for 15 min at 3000 rpm, and LF was removed by suction into a vacuum filtration unit fitted with a filter and funnel. The obtained LF was then washed with CaCl2 and distilled water until clear to reduce the increased residue mass from the addition of the NaI solution, which has a heavy mass. Thus, by density separation, LF < 1.7 g cm−3 was separated from the heavy fractions (HF) >1.7 g cm−3. The separated LF remaining in the filter paper was dried at 60 °C to a constant weight for 24 h. The HF in the NaI solution was washed with 30 mL of distilled water three times, and the liquid was poured away each time. Finally, 30 mL of distilled water was added to the HF, shaken for 16 h at 220 rpm, and separated by size and sedimentation, as highlighted below. The HF was then dispersed over a 250 μm sieve nested on a 53 μm sieve in a beaker. The soils in these sieves were thoroughly washed until clear. The soil remaining in the 250 μm sieve was coarse sand (cPOM), while the soil remaining in the 53 μm sieve was fine sand (fPOM). The soil solution remaining in the beaker was the silt and clay fractions (<53 μm). The cPOM and fPOM fractions were placed in a container and dried at 60 °C for at least 24 h until a constant weight was achieved and then dried in a 100 °C oven for >24 h. The mOM solution was centrifuged for 15 min at 3000 rpm, and the soil was separated from the supernatant, scooped into a crucible, and dried at 60 °C to constant weight for at least 48 h before being moved to a 100 °C oven for an additional 24 h. The dried fractions were weighed to determine the mass of each fraction recovered, and the soil mass recovery rate was between 96–104% (Table S2). The fractionated samples obtained for each treatment were ground to a powder with a tungsten mortar and pestle and stored at room temperature for further use.
The total C and N of the whole fractionated samples were determined with the same NC analyzer used above. To evaluate the relationship between Po and TC as well as between Po and TN of each fraction, the Po content of each fraction was measured by the ignition method [53]. We ignited a fine ground sample (0.5 g) in a muffle furnace (FUL230 FB Electric muffle furnace; ADVANTEC) at 550 °C for 2 h. In addition, the same samples (0.5 g) were weighed but not ignited. For both ignited and non-ignited samples, 25 mL of 0.5 M H2SO4 was added and shaken for 16 h at 125 rpm, centrifuged at 3000 rpm, and then filtered. Each aliquot of the treatment solution’s pH was adjusted using p-nitrophenol as an indicator and measured by colorimetry using the molybdate–ascorbic acid procedure with a UV-VIS spectrophotometer (UV1280; Shimadzu) at an absorbance of 712 nm [54]. Po was calculated by subtracting P (non-ignited) from P (ignited) to obtain Po for each treatment sample. In this study, the Po content for LF was not measured because the amount of LF material was relatively small and could be negligible [55].

2.4. Statistical Analysis

All statistical analyses were performed using SYSTAT 12.5 (SYSTTAT Software, Richmond, CA, USA). All data are expressed on a dry weight basis. Data measured on both the physical and chemical characteristics were analyzed using the Student’s t-test. The Tukey–Kramer test was used to separate treatment means, where analysis of variance indicated significant differences among the treatment means. The relationships between C, N, and Po were also evaluated. In all cases, statistical significance was set at p < 0.05.

3. Results

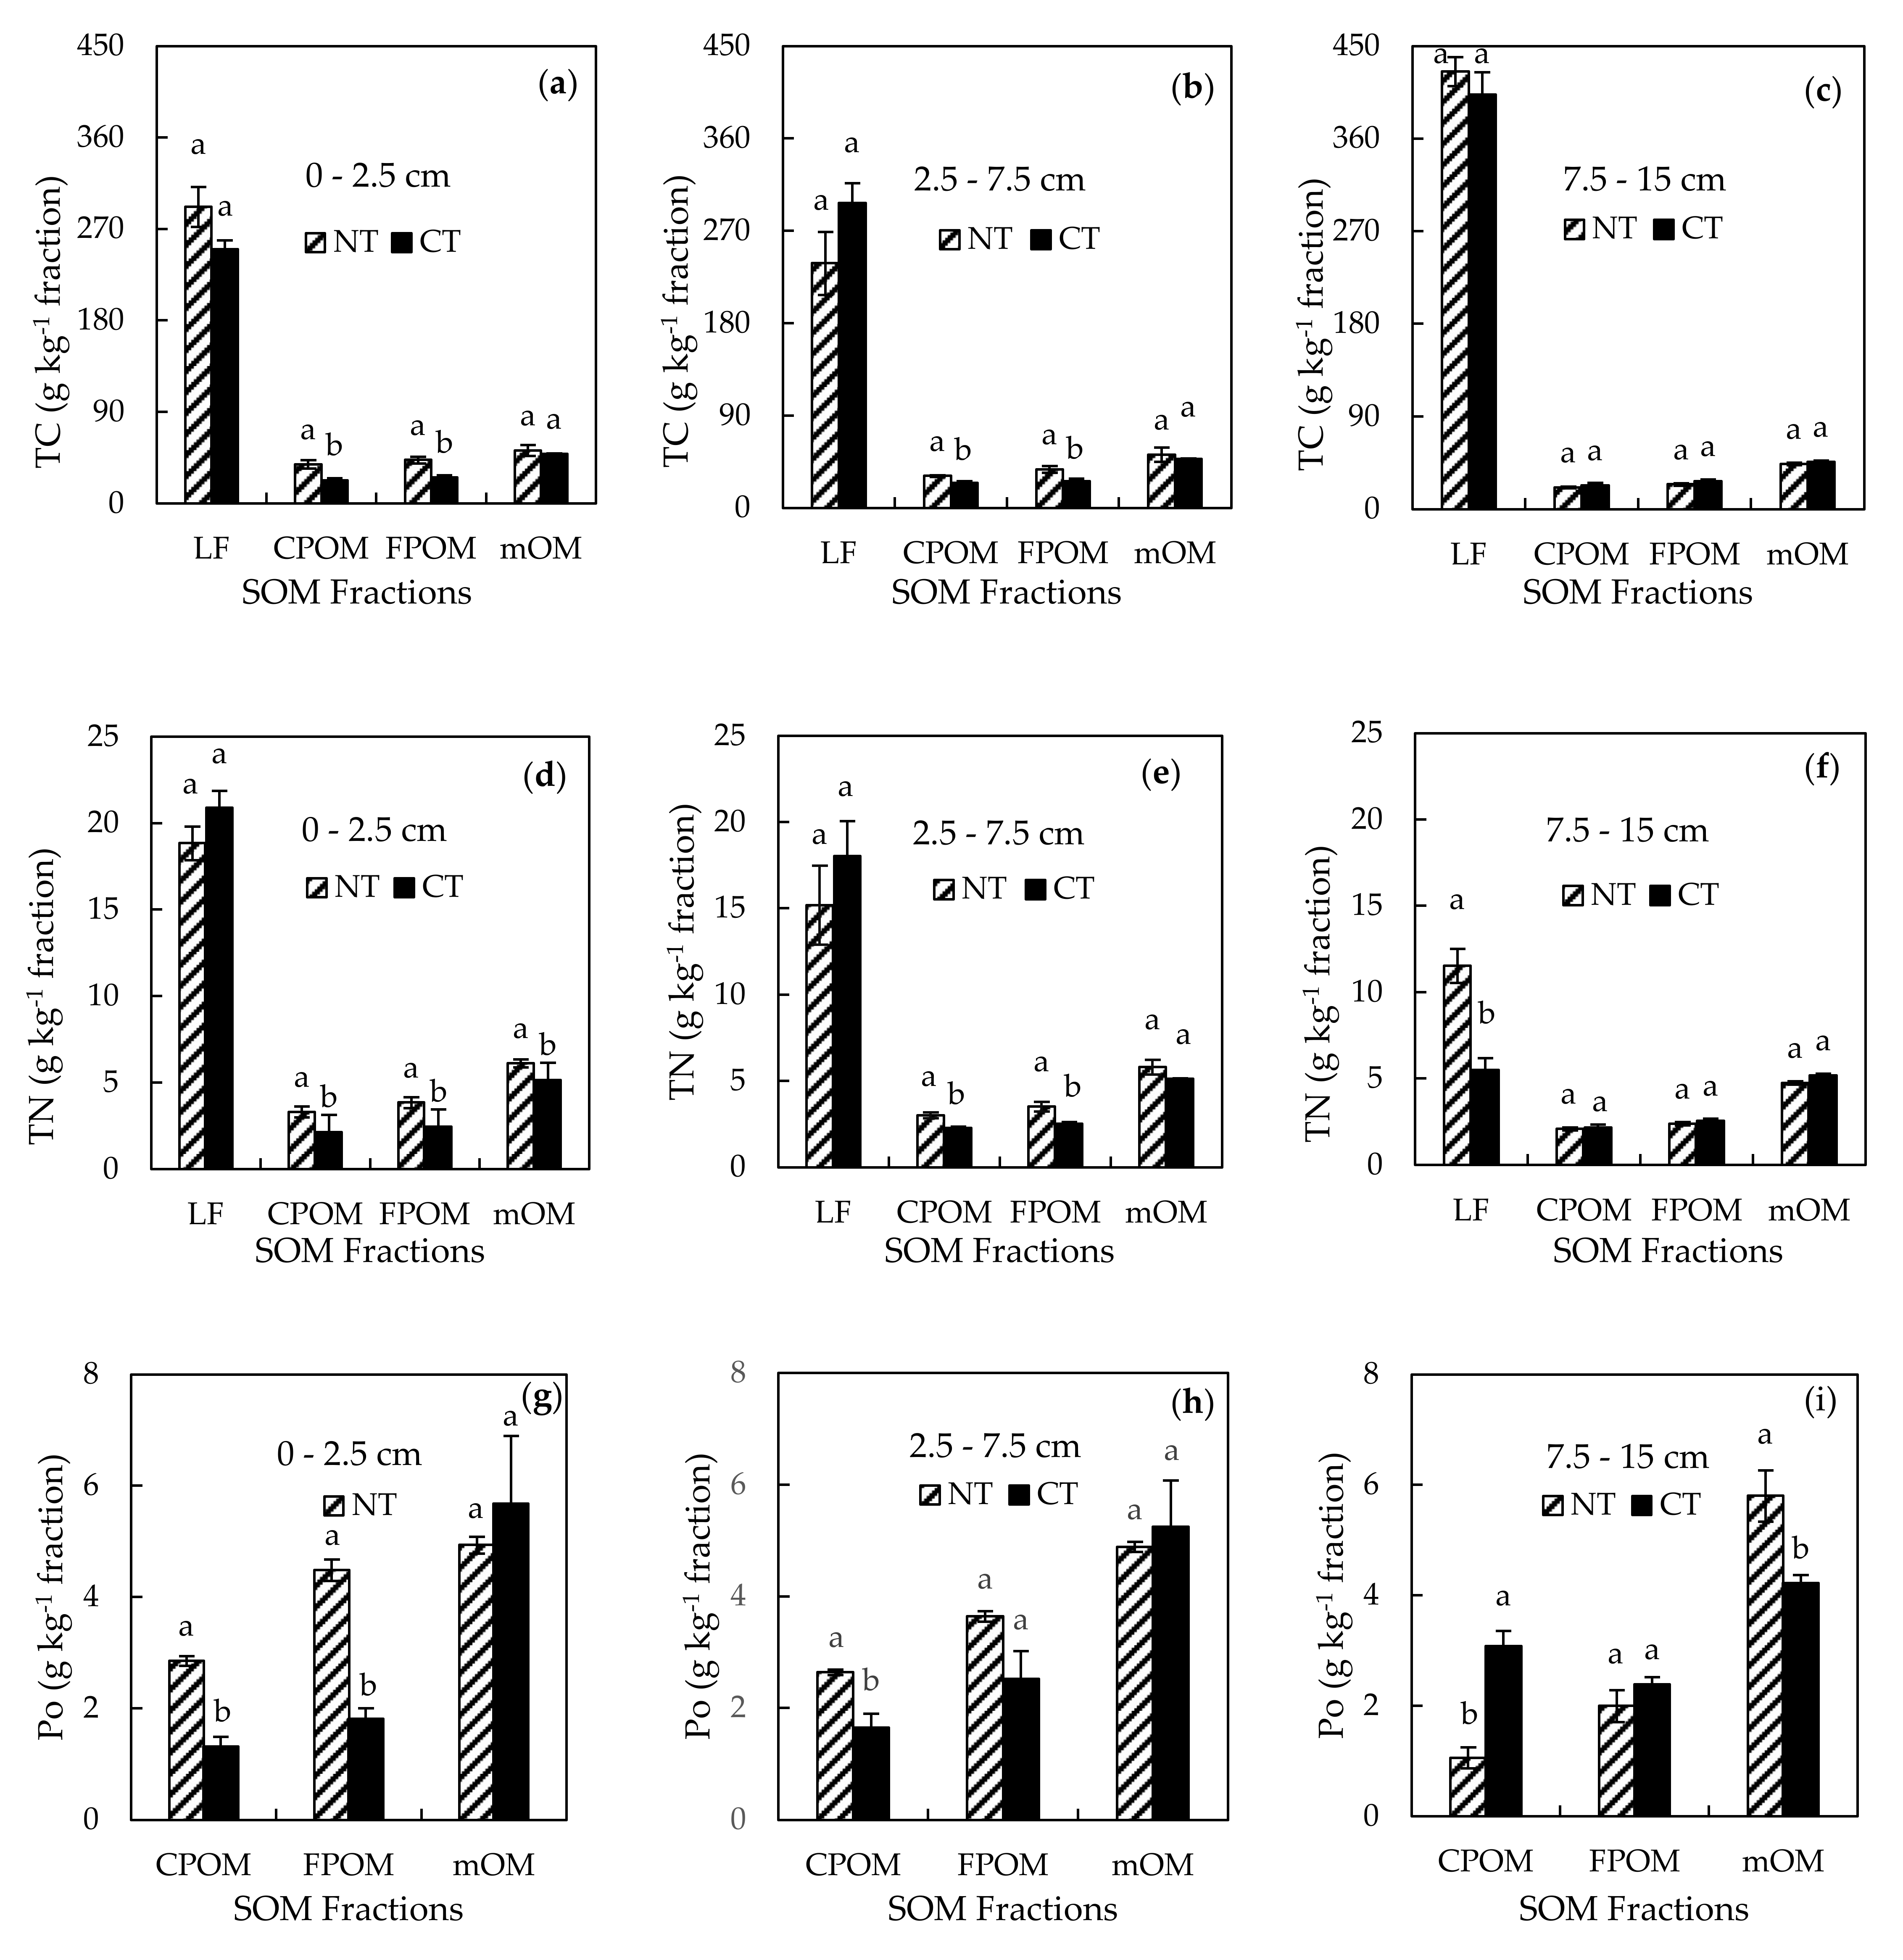
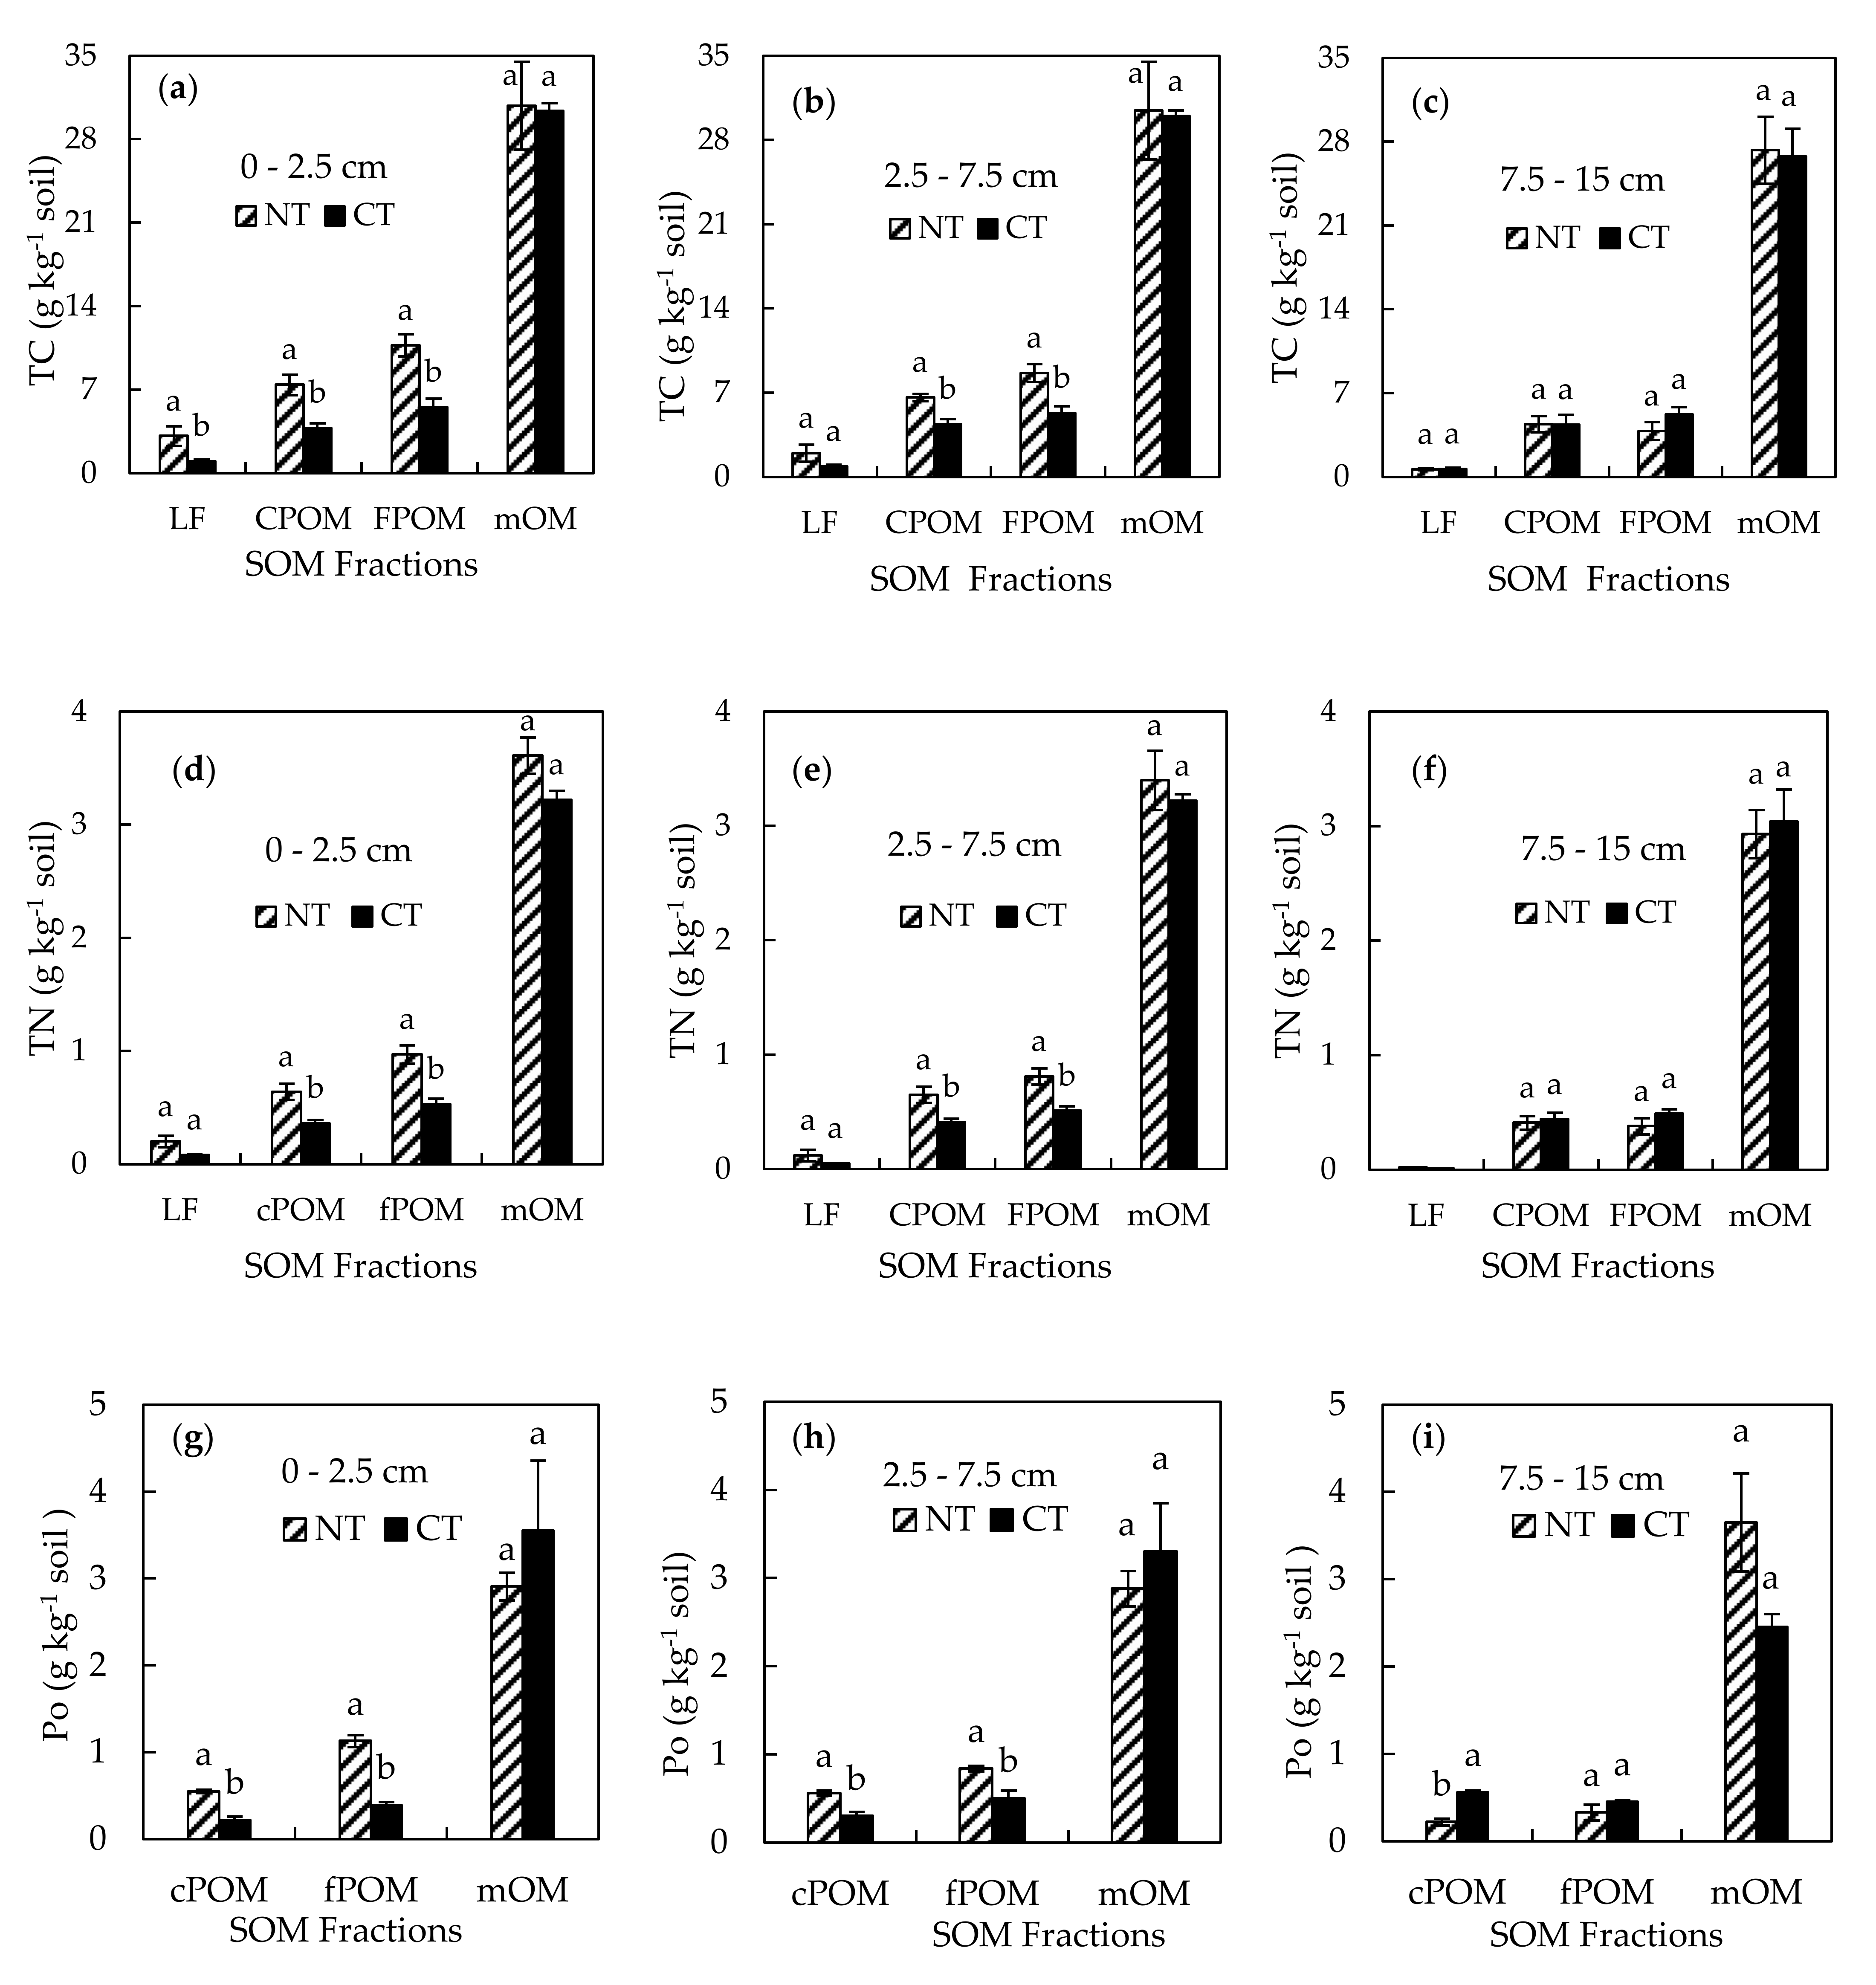
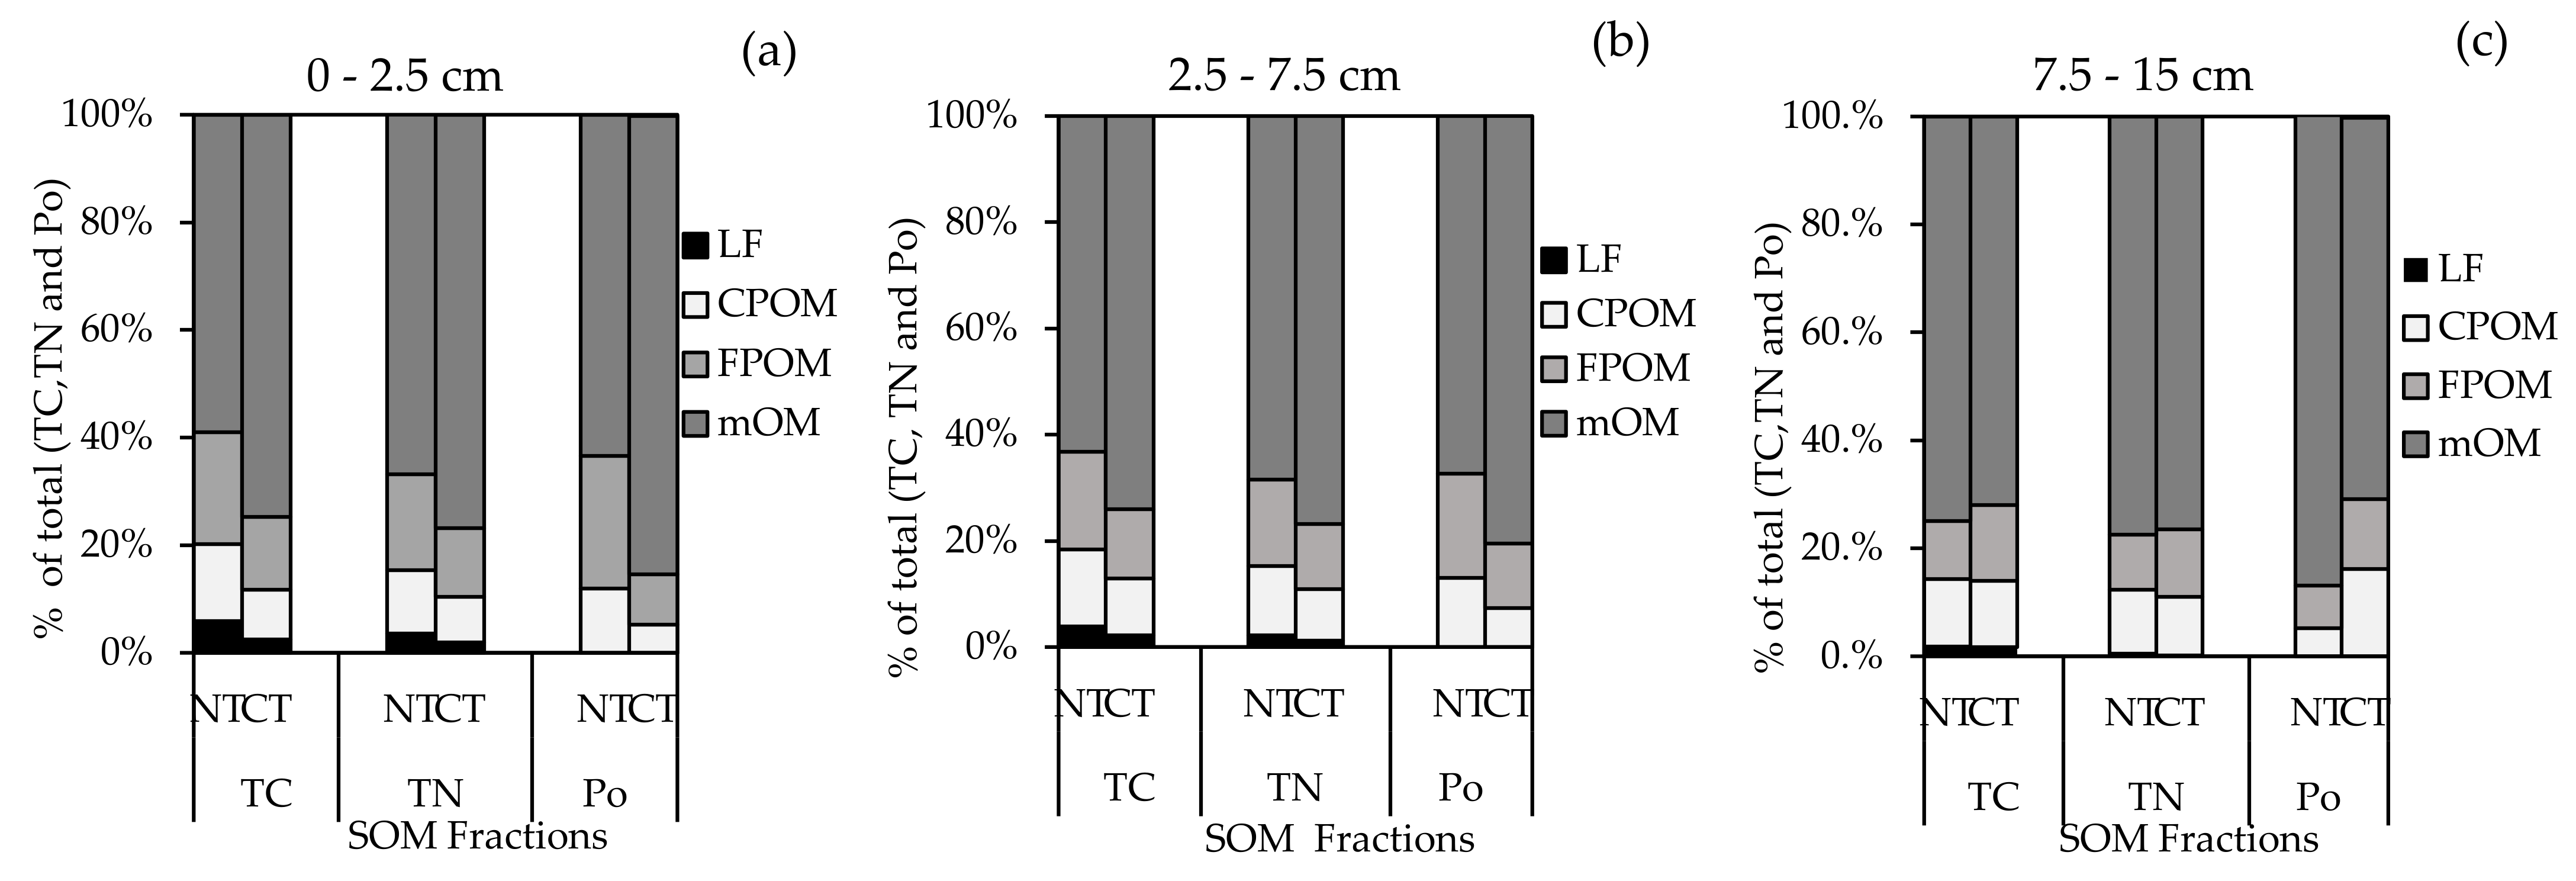
3.1. TC, TN, and Po in Fractionated OM and Its Contribution to Its Total Amount in the Soil

Figure 2 presents the TC, TN, and Po concentrations of each fraction. For the TC concentration, the LF and mOM fractions showed no significant difference between NT and CT, while the TC concentrations of the cPOM and fPOM fractions in NT were higher than those in CT (Figure 2a–c). Similar to the TC concentration, NT increased the TN and Po concentrations in both POM fractions at the 0–7.5 cm depth compared with CT (Figure 2d–i). The Po concentration of mOM at the 7.5–15 cm depth was higher in NT than in CT, while that of cPOM and fPOM was lower in NT than in CT (Figure 2i).
Figure 3 presents the results for the TC, TN, and Po contents of soil (calculated by the multiplication of TC, TN, and Po concentrations by the mass proportion of soil in each fraction). The TC, TN, and Po contents of cPOM and fPOM at the 0–2.5 cm and 2.5–7.5 cm depth were clearly higher in NT than CT, while those of mOM did not differ among the treatments throughout the depths (Figure 3). The TC of cPOM and fPOM in NT at 0–2.5 cm were 7.4 and 10.7 g C kg−1, respectively, and were larger than those in CT (3.8 and 5.5 g C kg−1). The TC of cPOM and fPOM in NT at 0–2.5 cm were 7.4 and 10.7 g C kg−1, respectively, and were larger than those in CT (3.8 and 5.5 g C kg−1). The TC of cPOM and fPOM at 2.5–7.5 cm were also larger in NT (6.6 and 8.6 g C kg−1) than CT (4.4 and 5.3 g C kg−1). Similarly, the TN and Po of cPOM and fPOM in NT were larger than CT at 0–2.5 and 2.5–7.5 cm. On the other hand, the Po of cPOM in NT (0.22 g C kg−1) was lower than in CT (0.56 g C kg−1) at 7.5–15 cm.
In the case of LF, the TC of LF in NT (3.12 g C kg−1) was higher than CT (1.00 g C kg−1) at a depth of 0–2.5 cm, while the TN of LF in NT (0.02 g C kg−1) was higher than CT (0.01 g C kg−1) at the 7.5–15 cm depth. Figure 4 shows the ratio of each fraction to the total fraction. The mOM fraction mainly contributed to the total TC, TN, and Po of soil (59–85%), followed by fPOM (9.4–24.6%), cPOM (5.3–14.3%), and LF (2.0–5.9%).
Table 1 shows the results of the two-way ANOVA of the effects of tillage treatments and soil depth on TC, TN, and Po contents of each fraction. Tillage treatment (NT and CT) had an effect on the TC, TN, and Po of labile fractions (LF, cPOM, and fPOM) but not on the stable fractions (mOM). Soil depth (0–2.5, 2.5–7.5, and 7.5–15 cm) had no clear effect on TC, TN, and Po of cPOM and mOM, while it had clear influence of LF and fPOM.

3.2. SOC Stock in the Fractionated OM under Different Tillage Management Systems

Figure 5 presents the total SOC stock (0–15 cm depth) of each fraction. The total SOC stock in cPOM and fPOM was significantly higher in NT than in CT at the surface layers (0–2.5 and 2.5–7.5 cm), while it was not the case of LF and mOM.
The total SOC stock of cPOM was larger in NT at 0–2.5 (0.76 Mg C ha−1) and 2.5–7.5 cm (2.68 Mg C ha−1), respectively, than in CT (0.46 and 1.68 Mg C ha−1, respectively). The total SOC stock of fPOM in NT at 0–2.5 (1.10 Mg C ha−1) and 2.5–7.5 cm (3.49 Mg C ha−1), respectively, was larger than those in CT (0.68 and 2.02 Mg C ha−1, respectively). Nonetheless, the total SOC stock in the 0–15 cm depth was not clearly different (54.48 and 54.63 Mg C ha−1 in NT and CT, respectively), mainly due to the larger SOC stock of each fraction at 7.5–15 cm in CT.

3.3. C:N, C:Po, and N:Po Ratio of SOM Fractions

The C:N ratios did not statistically differ in the whole fractions through the soil depths, except for LF at 0–2.5 and 7.5–15 cm (Table 2). The C:N ratio of LF (12.1–76.3) was higher than all the other fractions regardless of the treatment and depth, while the mOM fraction had the lowest C:N ratios (8.5–9.4) (Table 2). The C:Po and N:Po ratio of cPOM and mOM at 7.5–15 cm were higher in NT than CT, while those of fPOM at the 0–2.5 cm were lower in NT than CT (Table 2). Two-way ANOVA showed that both tillage and soil depth did not significantly affect the C:N, C:Po, and N:Po ratios of each fraction, except for LF (Table 1).

4. Discussion

4.1. Effect of No Tillage on Physically Fractionated C, N, and Po in Andosols

In this study, NT clearly increased the TC of cPOM and fPOM only at the surface layer (0–7.5 cm). On the other hand, NT did not increase the TC of the mOM throughout the depth (0–15 cm) even after continuous treatment for 19 years. These results indicate that (1) NT increased the labile SOC at the surface layer (0–2.5 cm and 2.5–7.5 cm) but not at the subsurface layer (deeper than 7.5 cm), and (2) NT did not increase the stable SOC in Andosols in Japan. Thus, our first hypothesis was verified. Pinheiro et al. [56] observed that the C of the sand fraction (i.e., cPOM) in NT (13.9 gkg−1) was higher than that in CT (2.5 gkg−1) at 0–10 cm depth but not in the silt + clay fraction (i.e., mOM) after seven years of tillage treatment in Oxisols, Brazil. These results indicate that POM fractions at the surface layer are good indicators of conservation management in Andosols, Japan. The possible reason for the lack of variation in stable SOC by NT may be as follows: (1) POM fractions may have more room for TC accumulation because POM fractions are not saturated generally [32], or (2) TC of mOM might be saturated, preventing TC accumulation in this fraction [56,57]. For the first reason, past research has reported that incorporated C was absorbed in cPOM and fPOM because of the allophanic minerals in these fractions of Andosols [11,58], potentially preventing the mineralized C from moving and accumulating into mOM from other fractions. In this study, it was not possible to conclude the reason; therefore, further research is necessary to assess the fraction migration with decomposition by using the 13C-labelled residues, which facilitates tracking C residues through the different SOM pools [59,60]. The increase in TC in the LF fraction at the surface layer under NT is due to SOM build-up in the surface depth as a result of a lack of disturbance [61].
Similar accumulation patterns of TN and Po with TC of each fraction were observed in this study under the tillage treatments at the surface layers (0–7.5 cm) (Figure 3). Asano et al. [11] also reported a similar distribution pattern between N and C within the various fractions of Andosols in Japan, and our results were consistent with their results. Dou et al. [62] also observed a similar trend between C and N accumulation in Inceptisols in the USA, showing that a similar accumulation pattern in C and N (and possibly Po) occurs not only in Andosols but also in other soil types. In this study, the TN and Po of POM fractions were higher in NT than in CT because of the increased aggregation stability caused by NT treatment both in cPOM and fPOM at the surface layer [63,64]. The stability of SOM is a biochemical indicator of soil quality [65], as it prevents nutrient loss and ensures nutrient availability to plants and microorganisms [37]. Hence, the higher stability of TN and Po of POM fractions under NT highlights the relevance of NT in soil fertility and plant growth in Andosols. Tan et al. [66] also found a higher TN in the POM fractions in NT than in CT in Berks, Coshocton, and Rayne soils in the USA when assessing the effects of land use and management on the mass distribution of SOC fractions. This indicates that aggregation is higher in labile fractions of undisturbed soils than in disturbed soils. In the case of Po, we found a lower Po of cPOM in NT than that in CT at 7.5–15 cm because NT treatment should accumulate newly added plant residue on the surface. By contrast, CT treatment should uniformly mix through the depth [67] and Po of the labile fraction, such as cPOM, at deeper layers should become lower in NT than CT.
We found that NT increased the total SOC stock of cPOM and fPOM compared with CT at the 0–7.5 cm depth, while its effect was diluted by the SOC stock of fPOM and mOM at the 7.5–15 cm depth. The total SOC stock at 0–15 cm was not different for NT and CT treatments (Figure 5). Higashi et al. [23] also observed similar results in the same experimental field; for example, they found that NT did not increase the total SOC stock in bulk soil at 0–15 cm depth for nine years of tillage treatments. Alvarez et al. [68] also observed a significant SOC stock increase in the medium fraction at the 0–5 cm depth by NT relative to CT but disappeared at depths greater than 5 cm. Furthermore, no significant difference in the mOM fraction with tillage treatment with depth was observed in Mollisols in Argentina after 15 years of treatment. These results indicate that NT in Andosols should affect the vertical distribution of accumulated SOC stock within the various fractions at 0–15 cm depth but not increase the total SOC stock even after 19 years experimental period.

4.2. Effect of No Tillage on Fractionated OM Quality in Andosols

In this study, we did not observe a clear difference in the C:N, C:Po, and N:Po ratios of most fractions between the NT and CT treatments in Andosols even after an experimental period of 19 years. This is possibly because of the strong binding agent for OM, such as SRO minerals in Andosols [69], although Zotarelli et al. [30] also reported no difference in the C:N ratio for POM and mOM fractions under NT for 25 years at a depth of 0–20 cm in Oxisols. On the other hand, Tan et al. [66] observed a significant difference in the C:N ratio of LF between NT and CT, which is consistent with our results. This could be because LF is the first point where crop residue transforms to SOM, and C and N mineralization occur [70].
These results indicate that NT did not affect the availability of TN and Po in the whole soil fraction in Andosols, although NT increased the amounts of TN and Po of cPOM and fPOM. To compare and assess the Po availability in each fraction at NT and CT, we conducted a simple regression analysis between C and Po of each fraction (Figure 6) [44]. In this analysis, we found a clear relationship between C and Po of both cPOM and fPOM but not of mOM in NT. Conversely, no clear relationship was observed between C and Po for cPOM, fPOM, and mOM in CT. This indicates that C of both cPOM and fPOM was closely related to Po by NT treatment, and thus, both fractions are important for P supply for crop growth, with C mineralization. Wyngaard et al. [44] on Mollisols in Argentina and Sugihara et al. [45] on Oxisols in Cameroon also found a clear relationships between C and Po of POM but not of mOM. The reason for the unclear relationship between C and Po of mOM is as follows: the mineralization rate of C and Po would be slower in mOM than in POM fractions due to the strong P fixation capacity of SRO minerals in Andosols, and thus, such unbalanced Po accumulation would have occurred, although further study is necessary. In addition, we found a different quantitative relationship between C and Po in cPOM (slope: 0.06–0.07) and fPOM (slope: 0.10), indicating more Po accumulation for the C unit of fPOM than cPOM. To the best of our knowledge, no other study has reported such differences for cPOM and fPOM in terms of Po availability. This theoretically indicates that the fPOM fraction is a more important P pool than cPOM in Andosols. Organic molecules (i.e., Po and SOC) are lower in the cPOM fraction than in the fPOM fraction because the cPOM fraction is unprotected and more susceptible to decomposition [6,71]. Further studies are needed to understand the relationship between cPOM and fPOM P supply in relation to C mineralization using 13 C and 31 P nuclear magnetic resonance [72] in Andosols and other soil types to verify the uniqueness of this observation for Andosols.

5. Conclusions

This study revealed an increase in the TC, TN, and Po contents of cPOM and fPOM fractions at the 0–7.5 cm depth in the no-tillage system from a long-term experiment, suggesting that the no-tillage system must be highly effective for the improvement of soil fertility at the surface soils in Andosols, Japan. We also found that more Po accumulation for the C unit of fPOM than cPOM, indicating the fPOM fraction is a more important P pool than cPOM in Andosols, though there was no clear effect of the no-tillage system on these pattern. Finally, we conclude that the no-tillage system in Andosols of Japan can improve the soil health and crop yield, as POM fractions have a large influence on the nutrient-supplying capacity of soils [73].

Supplementary Materials

The following supporting information can be downloaded at: https://www.mdpi.com/article/10.3390/agronomy12020479/s1, Table S1. Effect of no tillage (NT) and conventional tillage (CT) on TC (g C kg−1) and TN (g N kg−1) contents at various soil depths on bulk soil of Andosol crop land in the Kanto Region of Japan and Table S2. Mass distribution (%) of SOM fractions in the various soil depths when no tillage (NT) and conventional tillage (CT) are applied to an Andosol crop land in the Kanto Region of Japan.

Author Contributions

Conceptualization, J.A.-C., S.S. and M.K.; methodology, J.A.-C., S.S. and H.T.; formal analysis, J.A.-C. and S.S.; investigation, J.A.-C., S.S., M.K. and T.N.; resources, S.S.; writing—original draft preparation, J.A.-C.; writing—review and editing, J.A.-C., S.S., M.K., T.N. and H.T.; visualization, J.A.-C.; supervision, S.S.; funding acquisition, S.S. and H.T. All authors have read and agreed to the published version of the manuscript.

Funding

This research and APC was funded by the Japanese Society for the Promotion of Science KAKENHI (grant numbers 17H06171 and 20H03113).

Data Availability Statement

Not applicable.

Acknowledgments

We thank the staff of the Center for International Field Agriculture Research and Education, Ibaraki University, for their technical support in the field survey and soil sampling.

Conflicts of Interest

The authors declare no conflict of interest.

References

  1. Weil, R.R.; Brady, C.N. Nature and Properties of Soils, 15th ed.; Pearson Education Limited: London, UK, 2017. [Google Scholar]
  2. Lal, R. Soil carbon sequestration impacts on global climate change and food security. Science 2004, 304, 1623–1627. [Google Scholar] [CrossRef] [PubMed] [Green Version]
  3. Lal, R. Carbon emission from farm operations. Environ. Int. 2004, 30, 981–990. [Google Scholar] [CrossRef] [PubMed]
  4. Komatsuzaki, M.; Ohta, H. Soil management practices for sustainable agro-ecosystems. Sustain. Sci. 2007, 2, 103–120. [Google Scholar] [CrossRef]
  5. Sachs, J.; Schmidt-Traub, G.; Kroll, C.; Lafortune, G.; Fuller, G.; Woelm, F. Sustainable Development Report 2020: The Sustainable Development Goals and Covid-19 Includes the SDG Index and Dashboards. In Sustainable Development Report 2020; Cambridge Books: Cambridge, UK, 2021. [Google Scholar] [CrossRef]
  6. Six, J.; Feller, C.; Denef, K.; Ogle, S.M.; De Moraes Sa, J.C.; Albrecht, A. Soil organic matter, biota and aggregation in temperate and tropical soils-Effects of no-tillage. Agronomie 2002, 22, 755–775. [Google Scholar] [CrossRef] [Green Version]
  7. Paul, E.A.; Paustian, K.H.; Elliott, E.T.; Cole, C.V. Soil Organic Matter in Temperate Agroecosystems; CRC Press: Boca Raton, FL, USA, 2019. [Google Scholar] [CrossRef]
  8. Six, J.; Elliott, E.T.; Paustian, K. Aggregate and Soil Organic Matter Dynamics under Conventional and No-Tillage Systems. Soil Sci. Soc. Am. J. 1999, 63, 1350–1358. [Google Scholar] [CrossRef] [Green Version]
  9. Eswaran, H.; Berg, E.; Van Den Reich, P. Organic Carbon in Soils of the World. Soil Sci. Soc. Am. J. 1993, 57, 192–194. [Google Scholar] [CrossRef] [Green Version]
  10. Pubs.GISS: Hillel and Rosenzweig 2009: Soil Carbon and Climate Change: Carbon Exchange in the Terrestrial. Available online: https://pubs.giss.nasa.gov/abs/hi05100g.html (accessed on 28 December 2021).
  11. Asano, M.; Wagai, R. Evidence of aggregate hierarchy at micro- to submicron scales in an allophanic andisol. Geoderma 2014, 216, 62–74. [Google Scholar] [CrossRef]
  12. Wada, K.; Higashi, T. The Categories of Aluminium and Iron-Humus Complexes in Ando Soils Determined by Selective Dissolution. J. Soil Sci. 1976, 27, 357–368. [Google Scholar] [CrossRef]
  13. Miyazawa, M.; Takahashi, T.; Sato, T.; Kanno, H.; Nanzyo, M. Factors controlling accumulation and decomposition of organic carbon in humus horizons of Andosols: A case study for distinctive non-allophanic Andosols in northeastern Japan. Biol. Fertil. Soils 2013, 49, 929–938. [Google Scholar] [CrossRef]
  14. Takahashi, T.; Yamada, K.; Kanno, H.; Nanzyo, M. Organic carbon accumulation in Andosols: (2)Contribution of aluminum-humus complexes to carbon accumulation in non-allophanic Andosols. J. Integr. F. Sci. 2010, 7, 69–72. [Google Scholar]
  15. Iwasaki, S.; Endo, Y.; Hatano, R. The effect of organic matter application on carbon sequestration and soil fertility in upland fields of different types of Andosols. Soil Sci. Plant Nutr. 2017, 63, 200–220. [Google Scholar] [CrossRef] [Green Version]
  16. Koga, N.; Shimoda, S.; Shirato, Y.; Kusaba, T.; Shima, T.; Niimi, H.; Yamane, T.; Wakabayashi, K.; Niwa, K.; Kohyama, K.; et al. Assessing changes in soil carbon stocks after land use conversion from forest land to agricultural land in Japan. Geoderma 2020, 377, 114487. [Google Scholar] [CrossRef]
  17. Hoshino, Y.; Higashi, T.; Ito, T.; Komatsuzaki, M. Tillage can reduce the radiocesium contamination of soybean after the Fukushima Dai-ichi nuclear power plant accident. Soil Tillage Res. 2015, 153, 76–85. [Google Scholar] [CrossRef]
  18. Wulanningtyas, H.S.; Gong, Y.; Li, P.; Sakagami, N.; Nishiwaki, J.; Komatsuzaki, M. A cover crop and no-tillage system for enhancing soil health by increasing soil organic matter in soybean cultivation. Soil Tillage Res. 2021, 205, 104749. [Google Scholar] [CrossRef]
  19. Ito, T.; Araki, M.; Komatsuzaki, M.; Kaneko, N.; Ohta, H. Soil nematode community structure affected by tillage systems and cover crop managements in organic soybean production. Appl. Soil Ecol. 2015, 86, 137–147. [Google Scholar] [CrossRef] [Green Version]
  20. Shirato, Y.; Hakamata, T.; Taniyama, I. Modified rothamsted carbon model for andosols and its validation: Changing humus decomposition rate constant with pyrophosphate-extractable Al. Soil Sci. Plant Nutr. 2004, 50, 149–158. [Google Scholar] [CrossRef]
  21. Jastrow, J.D.; Amonette, J.E.; Bailey, V.L. Mechanisms controlling soil carbon turnover and their potential application for enhancing carbon sequestration. Clim. Change 2007, 80, 5–23. [Google Scholar] [CrossRef]
  22. Nakamoto, T.; Komatsuzaki, M.; Hirata, T.; Araki, H. Effects of tillage and winter cover cropping on microbial substrate-induced respiration and soil aggregation in two Japanese fields. Soil Sci. Plant Nutr. 2012, 58, 70–82. [Google Scholar] [CrossRef] [Green Version]
  23. Higashi, T.; Yunghui, M.; Komatsuzaki, M.; Miura, S.; Hirata, T.; Araki, H.; Kaneko, N.; Ohta, H. Tillage and cover crop species affect soil organic carbon in Andosol, Kanto, Japan. Soil Tillage Res. 2014, 138, 64–72. [Google Scholar] [CrossRef]
  24. Gong, Y.; Li, P.; Lu, W.; Nishiwaki, J.; Komatsuzaki, M. Response of soil carbon dioxide emissions to no-tillage and moldboard plow systems on Andosols in a humid, subtropical climate, Japan. Geoderma 2021, 386, 114920. [Google Scholar] [CrossRef]
  25. Yagioka, A.; Komatsuzaki, M.; Kaneko, N.; Ueno, H. Effect of no-tillage with weed cover mulching versus conventional tillage on global warming potential and nitrate leaching. Agric. Ecosyst. Environ. 2015, 200, 42–53. [Google Scholar] [CrossRef]
  26. Koga, N. Tillage, fertilizer type, and plant residue input impacts on soil carbon sequestration rates on a Japanese Andosol. Soil Sci. Plant Nutr. 2017, 63, 396–404. [Google Scholar] [CrossRef]
  27. Cambardella, C.A.; Elliott, E.T. Particulate Soil Organic-Matter Changes across a Grassland Cultivation Sequence. Soil Sci. Soc. Am. J. 1992, 56, 777–783. [Google Scholar] [CrossRef]
  28. Six, J.; Elliott, E.T.; Paustian, K.; Doran, J.W. Aggregation and Soil Organic Matter Accumulation in Cultivated and Native Grassland Soils. Soil Sci. Soc. Am. J. 1998, 62, 1367–1377. [Google Scholar] [CrossRef] [Green Version]
  29. Sohi, S.P.; Mahieu, N.; Arah, J.R.M.; Powlson, D.S.; Madari, B.; Gaunt, J.L. A Procedure for Isolating Soil Organic Matter Fractions Suitable for Modeling. Soil Sci. Soc. Am. J. 2001, 65, 1121–1128. [Google Scholar] [CrossRef]
  30. Zotarelli, L.; Alves, B.J.R.; Urquiaga, S.; Torres, E.; Dos Santos, H.P.; Paustian, K.; Boddey, R.M.; Six, J. Impact of Tillage and Crop Rotation on Aggregate-Associated Carbon in Two Oxisols. Soil Sci. Soc. Am. J. 2005, 69, 482–491. [Google Scholar] [CrossRef] [Green Version]
  31. Wander, M. Soil organic matter fractions and their relevance to soil function. In Soil Organic Matter in Sustainable Agriculture; CRC Press: Boca Raton, FL, USA, 2004; pp. 67–102. [Google Scholar]
  32. Lavallee, J.M.; Soong, J.L.; Cotrufo, M.F. Conceptualizing soil organic matter into particulate and mineral-associated forms to address global change in the 21st century. Glob. Change Biol. 2020, 26, 261–273. [Google Scholar] [CrossRef] [Green Version]
  33. Álvaro-Fuentes, J.; López, M.V.; Cantero-Martinez, C.; Arrúe, J.L. Tillage Effects on Soil Organic Carbon Fractions in Mediterranean Dryland Agroecosystems. Soil Sci. Soc. Am. J. 2008, 72, 541–547. [Google Scholar] [CrossRef] [Green Version]
  34. Salvo, L.; Hernández, J.; Ernst, O. Distribution of soil organic carbon in different size fractions, under pasture and crop rotations with conventional tillage and no-till systems. Soil Tillage Res. 2010, 109, 116–122. [Google Scholar] [CrossRef]
  35. Wander, M.M.; Bidart, M.G.; Aref, S. Tillage Impacts on Depth Distribution of Total and Particulate Organic Matter in Three Illinois Soils. Soil Sci. Soc. Am. J. 1998, 62, 1704–1711. [Google Scholar] [CrossRef]
  36. Bayer, C.; Martin-Neto, L.; Mielniczuk, J.; Pavinato, A.; Dieckow, J. Carbon sequestration in two Brazilian Cerrado soils under no-till. Soil Tillage Res. 2006, 86, 237–245. [Google Scholar] [CrossRef]
  37. Kibet, L.C.; Blanco-Canqui, H.; Jasa, P. Long-term tillage impacts on soil organic matter components and related properties on a Typic Argiudoll. Soil Tillage Res. 2016, 155, 78–84. [Google Scholar] [CrossRef]
  38. Bayer, C.; Martin-Neto, L.; Mielniczuk, J.; Pillon, C.N.; Sangoi, L. Changes in Soil Organic Matter Fractions under Subtropical No-Till Cropping Systems. Soil Sci. Soc. Am. J. 2001, 65, 1473–1478. [Google Scholar] [CrossRef]
  39. Bayer, C.; Mielniczuk, J.; Martin-Neto, L.; Ernani, P.R. Stocks and humification degree of organic matter fractions as affected by no-tillage on a subtropical soil. Plant Soil 2002, 238, 133–140. [Google Scholar] [CrossRef]
  40. Parfitt, R.L.; Theng, B.K.G.; Whitton, J.S.; Shepherd, T.G. Effects of clay minerals and land use on organic matter pools. Geoderma 1997, 75, 1–12. [Google Scholar] [CrossRef]
  41. Pinheiro, É.F.M.; de Campos, D.V.B.; de Carvalho Balieiro, F.; dos Anjos, L.H.C.; Pereira, M.G. Tillage systems effects on soil carbon stock and physical fractions of soil organic matter. Agric. Syst. 2015, 132, 35–39. [Google Scholar] [CrossRef]
  42. LeBauer, D.S.; Treseder, K.K. Nitrogen limitation of net primary productivity in terrestrial ecosystems is globally distributed. Ecology 2008, 89, 371–379. [Google Scholar] [CrossRef] [Green Version]
  43. Vitousek, P.M.; Porder, S.; Houlton, B.Z.; Chadwick, O.A. Terrestrial phosphorus limitation: Mechanisms, implications, and nitrogen-phosphorus interactions. Ecol. Appl. 2010, 20, 5–15. [Google Scholar] [CrossRef] [Green Version]
  44. Wyngaard, N.; Vidaurreta, A.; Echeverría, H.E.; Picone, L.I. Dynamics of Phosphorus and Carbon in the Soil Particulate Fraction Under Different Management Practices. Soil Sci. Soc. Am. J. 2013, 77, 1584–1590. [Google Scholar] [CrossRef]
  45. Sugihara, S.; Shibata, M.; Mvondo-Ze, A.D.; Araki, S.; Kosaki, T.; Funakawa, S. Soil phosphorus of stable fraction differentially associate with carbon in the tropical forest and savanna of eastern Cameroon. Soil Sci. Plant Nutr. 2017, 63, 616–627. [Google Scholar] [CrossRef] [Green Version]
  46. Wyngaard, N.; Cabrera, M.L.; Jarosch, K.A.; Bünemann, E.K. Phosphorus in the coarse soil fraction is related to soil organic phosphorus mineralization measured by isotopic dilution. Soil Biol. Biochem. 2016, 96, 107–118. [Google Scholar] [CrossRef] [Green Version]
  47. Shoji, S.; Dahlgren, R.; Nanzyo, M. Chapter 3 Genesis of Volcanic Ash Soils. Dev. Soil Sci. 1993, 21, 37–71. [Google Scholar] [CrossRef]
  48. Takeda, M.; Nakamoto, T.; Miyazawa, K.; Murayama, T.; Okada, H. Phosphorus availability and soil biological activity in an Andosol under compost application and winter cover cropping. Appl. Soil Ecol. 2009, 42, 86–95. [Google Scholar] [CrossRef]
  49. Zhao, T.; Zhao, Y.; Higashi, T.; Komatsuzaki, M. Power Consumption of No-tillage Seeder under Different Cover Crop Species and Termination for Soybean Production. Eng. Agric. Environ. Food 2012, 5, 50–56. [Google Scholar] [CrossRef]
  50. Japan Meteorological Agency. Search for Past Weather Data. Available online: https://www.data.jma.go.jp/obd/stats/etrn/view/annually_s.php?prec_no=40&block_no=47646&year=2020&month=&day=&view= (accessed on 30 December 2021).
  51. FAO. World Reference Base for Soil Resources, 3rd ed.; FAO: Rome, Italy, 2015; Volume 4, ISBN 9789251083697. [Google Scholar]
  52. Diochon, A.; Gillespie, A.W.; Ellert, B.H.; Janzen, H.H.; Gregorich, E.G. Recovery and dynamics of decomposing plant residue in soil: An evaluation of three fractionation methods. Eur. J. Soil Sci. 2016, 67, 196–205. [Google Scholar] [CrossRef]
  53. Walker, T.W.; Adams, A.F.R. Studies on Soil Organic Matter: I. Influence of Phosphorus Content of Parent Materials on Accumulations of Carbon, Nitrogen, Sulfur, and Organic Phosphorus In Grassland Soils. Soil Sci. 1958, 87, 307–318. [Google Scholar] [CrossRef]
  54. Murphy, J.; Riley, J.P. A modified single solution method for the determination of phosphate in natural waters. Anal. Chim. Acta 1962, 27, 31–36. [Google Scholar] [CrossRef]
  55. Adams, J.L.; Tipping, E.; Thacker, S.A.; Quinton, J.N. An investigation of the distribution of phosphorus between free and mineral associated soil organic matter, using density fractionation. Plant Soil 2018, 427, 139–148. [Google Scholar] [CrossRef] [Green Version]
  56. Hassink, J.; Whitmore, A.P.; Kubát, J. Size and density fractionation of soil organic matter and the physical capacity of soils to protect organic matter. Eur. J. Agron. 1997, 7, 189–199. [Google Scholar] [CrossRef]
  57. Castellano, M.J.; Mueller, K.E.; Olk, D.C.; Sawyer, J.E.; Six, J. Integrating plant litter quality, soil organic matter stabilization, and the carbon saturation concept. Glob. Change Biol. 2015, 21, 3200–3209. [Google Scholar] [CrossRef]
  58. Baldock, J.A.; Skjemstad, J.O. Role of the soil matrix and minerals in protecting natural organic materials against biological attack. Org. Geochem. 2000, 31, 697–710. [Google Scholar] [CrossRef]
  59. Sangster, A.; Knight, D.; Farrell, R.; Bedard-Haughn, A. Repeat-pulse 13CO2 labeling of canola and field pea: Implications for soil organic matter studies. Rapid Commun. Mass Spectrom. 2010, 24, 2791–2798. [Google Scholar] [CrossRef] [PubMed]
  60. Comeau, L.P.; Lemke, R.L.; Knight, J.D.; Bedard-Haughn, A. Carbon input from 13C-labeled crops in four soil organic matter fractions. Biol. Fertil. Soils 2013, 49, 1179–1188. [Google Scholar] [CrossRef]
  61. Skjemstad, J.O.; Dalal, R.C. Spectroscopic and chemical differences in organic matter of two vertisols subjected to long periods of cultivation. Aust. J. Soil Res. 1987, 25, 323–335. [Google Scholar] [CrossRef]
  62. Dou, F.; Hons, F.M. Tillage and Nitrogen Effects on Soil Organic Matter Fractions in Wheat-based Systems. Soil Sci. Soc. Am. J. 2006, 70, 1896–1905. [Google Scholar] [CrossRef]
  63. Beare, M.H.; Hendrix, P.F.; Cabrera, M.L.; Coleman, D.C. Aggregate-Protected and Unprotected Organic Matter Pools in Conventional- and No-Tillage Soils. Soil Sci. Soc. Am. J. 1994, 58, 787–795. [Google Scholar] [CrossRef]
  64. Franzluebbers, A.J.; Arshad, M.A. Soil organic matter pools with conventional and zero tillage in a cold, semiarid climate. Soil Tillage Res. 1996, 39, 1–11. [Google Scholar] [CrossRef]
  65. Chen, H.; Liang, Q.; Gong, Y.; Kuzyakov, Y.; Fan, M.; Plante, A.F. Reduced tillage and increased residue retention increase enzyme activity and carbon and nitrogen concentrations in soil particle size fractions in a long-term field experiment on Loess Plateau in China. Soil Tillage Res. 2019, 194, 104296. [Google Scholar] [CrossRef]
  66. Tan, Z.; Lal, R.; Owens, L.; Izaurralde, R.C. Distribution of light and heavy fractions of soil organic carbon as related to land use and tillage practice. Soil Tillage Res. 2007, 92, 53–59. [Google Scholar] [CrossRef]
  67. Cade-Menun, B.J.; Carter, M.R.; James, D.C.; Liu, C.W. Phosphorus Forms and Chemistry in the Soil Profile under Long-Term Conservation Tillage: A Phosphorus-31 Nuclear Magnetic Resonance Study. J. Environ. Qual. 2010, 39, 1647–1656. [Google Scholar] [CrossRef]
  68. Alvarez, R.; Russo, M.E.; Prystupa, P.; Scheiner, J.D.; Blotta, L. Soil carbon pools under conventional and no-tillage systems in the Argentine Rolling Pampa. Agron. J. 1998, 90, 138–143. [Google Scholar] [CrossRef]
  69. Broadbent, F.E.; Jackman, R.H.; McNicoll, J. Mineralization of carbon and nitrogen in some new zealand allophanic soils. Soil Sci. 1964, 98, 118–128. [Google Scholar] [CrossRef]
  70. Saljnikov, E.; Cakmak, D.; Rahimgalieva, S. Soil organic matter stability as affected by land management in steppe ecosystems. In Soil Processes and Current Trends in Quality Assessment; IntechOpen: London, UK, 2013; pp. 269–310. [Google Scholar] [CrossRef] [Green Version]
  71. Blanco-Moure, N.; Gracia, R.; Bielsa, A.C.; López, M.V. Long-term no-tillage effects on particulate and mineral-associated soil organic matter under rainfed Mediterranean conditions. Soil Use Manag. 2013, 29, 250–259. [Google Scholar] [CrossRef] [Green Version]
  72. Hamdan, R.; El-Rifai, H.M.; Cheesman, A.W.; Turner, B.L.; Reddy, K.R.; Cooper, W.T. Linking phosphorus sequestration to carbon humification in wetland soils by 31P and 13C NMR spectroscopy. Environ. Sci. Technol. 2012, 46, 4775–4782. [Google Scholar] [CrossRef]
  73. Haynes, R.J. Labile Organic Matter Fractions as Central Components of the Quality of Agricultural Soils: An Overview. Adv. Agron. 2005, 85, 221–268. [Google Scholar] [CrossRef]
Figure 1. Map of study area: Center for International Field Agriculture Research and Education, Ibaraki University, Japan.
Agronomy 12 00479 g001
Figure 2. Total carbon (TC); -(ac) (g C kg−1 fraction), total nitrogen (TN); (df) (g N kg−1 fraction), and organic phosphorus (Po); (gi) (P kg−1 fraction) of SOM fractions by physical fractionation of Andosols from No-Tillage (NT) and Conventional Tillage (CT) systems. Different letters show significant differences for the tillage treatments of each fraction, according to Student’s t-test (p < 0.05).
Agronomy 12 00479 g002
Figure 3. Total carbon (TC); (ac) (g C kg−1 soil), total nitrogen (TN); (df) (g N kg−1 soil), and organic phosphorus (Po); (gi) (g P kg−1 soil) of SOM fractions by physical fractionation of Andosols from the no-tillage (NT) and conventional-tillage (CT) systems. Different letters show significant differences for the tillage treatments of each fraction, according to Student’s t-test (p < 0.05).
Agronomy 12 00479 g003
Figure 4. Percentage (%) of total of total carbon (TC); (a), total nitrogen (TN); (b), and organic phosphorus(Po); (c) of SOM fractions by physical fractionation of Andosols from no-tillage (NT) and conventional-tillage (CT) systems.
Agronomy 12 00479 g004
Figure 5. Total carbon content (MgC ha−1) of SOM fractions (light fraction (LF); (a), coarse-POM (c-POM); (b), fine-POM (f-POM); (ce) silt+clay (mOM) by physical fractionation of Andosols from the no-tillage (NT) and rotary (RT) system-cultivated land under ryegrass (RY) at various depths. Bars indicate the standard error (n = 4). Different letters show significant differences for the tillage treatments of each soil depth, according to Student’s t-test (p < 0.05).
Agronomy 12 00479 g005
Figure 6. Relationship between organic P (Po) and total carbon (C) content of the various SOM fractions by physical fractionation of Andosols from no-tillage (NT) (a,b) and conventional tillage (CT) system-cultivated land under ryegrass (RY) at various depths (c). * p < 0.05, ** p < 0.01, and *** p < 0.001 using program regression and ANOVA. The continuous line () represents the regression line for NT.
Agronomy 12 00479 g006
Table 1. Summary of effects of no-tillage (NT) and conventional-tillage (CT) at various depths on the TC (gC kg−1 soil), TN (gN kg−1 soil), and Po (gP kg−1 soil) content, as well as C, N, and Po ratios according to analysis of variance (ANOVA).
LFcPOMfPOMmOM (Silt + Clay)
Total Carbon (TC)
Tillage Treatment******NS
Soil Depth*NS***NS
Tillage Treatment × Soil DepthNS****NS
Total Nitrogen (TN)
Tillage Treatment******NS
Soil Depth**NS***NS
Tillage treatment × Soil treatmentNS***NS
Organic Phosphorus (Po)
Tillage Treatment ****NS
Soil Depth NS***NS
Tillage Treatment × Soil treatment ******NS
C:N Ratio
Tillage Treatment*NSNSNS
Soil Depth***NSNSNS
Tillage Treatment × Soil treatment***NSNSNS
C:Po Ratio
Tillage Treatment NSNSNS
Soil Depth NSNSNS
Tillage Treatment × Soil treatment ***NSNS
N:Po Ratio
Tillage Treatment NSNSNS
Soil Depth NSNSNS
Tillage Treatment × Soil treatment ****NS
N.B. Values indicated in the table above tables are the p-values obtained from the analysis of variance for the various sources of variation. p > 0.05: not significant (NS); p < 0.05: (* p < 0.05, ** p < 0.01, and *** p < 0.001).
Table 2. C:N, C:Po, and N:Po ratios of each fraction by physical fractionation of Andosols from the no-tillage (NT) and conventional-tillage (CT) systems at various depths.
Tillage TreatmentLFcPOMfPOMmOM
(Silt + Clay)
Total
NTCTNTCTNTCTNTCTNTCT
Soil depth (cm)~C:N ratio~
0–2.515.5 a
(0.74)
12.1 b
(0.51)
11.6 a
(0.19)
10.6 a
(0.51)
11 a
(0.08)
10.3 a
(0.53)
8.47 a
(0.66)
9.44 a
(0.15)
46.7 a
(0.41)
42.4 a
(1.50)
2.5–7.520.9 a
(5.53)
17.3 a
(2.50)
10.4 a
(0.55)
10.7 a
(0.56)
10.7 a
(0.19)
10.3 a
(0.59)
8.83 a
(0.61)
9.31 a
(0.10)
50.8 a
(5.04)
47.6 a
(2.66)
7.5–1538.0 b
(4.33)
76.3 a
(8.74)
10.1 a
(0.20)
10.5 a
(0.44)
10.1 a
(0.16)
10.6 a
(0.41)
9.26 a
(0.31)
8.83 a
(0.25)
67.4 b
(4.10)
106.2 a
(8.70)
~C:Po ratio~
0–2.5 13.6 a
(1.73)
17.9 a
(2.05)
9.53 b
(0.66)
14.1 a
(1.16)
10.5 a
(0.77)
10.3 a
(2.86)
33.6 a
(2.40)
42.4 a
(3.89)
2.5–7.5 11.8 a
(0.31)
15.4 a
(1.55)
10.3 a
(0.68)
11.1 a
(1.40)
10.6 a
(1.49)
10.0 a
(1.97)
32.7 a
(2.15)
36.6 a
(2.15)
7.5–15 21.6 a
(3.42)
7.66 b
(1.20)
12.8 a
(1.77)
11.5 a
(1.28)
7.67 b
(0.47)
10.9 a
(0.37)
42.1 a
(4.33)
30.1 b
(1.77)
~N:Po ratio~
0–2.5 1.17 a
(0.14)
1.70 a
(0.20)
0.86 b
(0.06)
1.38 a
(0.11)
1.24 a
(0.02)
1.11 a
(0.32)
3.27 a
(0.20)
4.18 a
(0.34)
2.5–7.5 1.14 a
(0.06)
1.48 a
(0.22)
0.96 a
(0.06)
1.11 a
(0.20)
1.19 a
(0.09)
1.08 a
(0.22)
3.30 a
(0.22)
3.67 a
(0.32)
7.5–15 2.14 a
(0.35)
0.72 b
(0.09)
1.26 a
(0.16)
1.08 a
(0.11)
0.84 b
(0.08)
1.23 a
(0.05)
4.24 a
(0.43)
3.05 b
(0.17)
N.B. Different superscript letters indicate significant differences between the land management practices within each depth at p < 0.05, using the Student’s t-test. Numbers in parentheses indicate standard errors of the mean (n = 4).
Publisher’s Note: MDPI stays neutral with regard to jurisdictional claims in published maps and institutional affiliations.

